of SiGe/Si StructuresReal-time, In-line and Integrated...
21
WISE 2000 - International Workshop on Spectroscopic Ellipsometry University of Michigan, 8-9th May 2000 Real-time, In-line and Integrated Metrology of SiGe/Si Structures Chris Pickering Defence Evaluation and Research Agency, Malvern, UK Tel: +44-1684-894898 Fax:+44-1684-895113 E-mail: [email protected]
Transcript of of SiGe/Si StructuresReal-time, In-line and Integrated...

WISE 2000 - International Workshop on Spectroscopic EllipsometryUniversity of Michigan, 8-9th May 2000
Real-time, In-line and Integrated Metrology of SiGe/Si Structures
Chris PickeringDefence Evaluation and Research Agency, Malvern, UK
Tel: +44-1684-894898Fax:+44-1684-895113E-mail: [email protected]

❚ Introduction❚ Optical and epitaxy facilities❚ Ex-situ characterisation of strained SiGe structures
➜ in-line SE for SiGe process development❚ Real-time in-situ monitoring/control of SiGe
➜ data analysis methods❚ Development of integrated metrology
➜ advantages and future work

IN-SITU REAL-TIME(during process)
Processchambers
Load Locks
Cool-downchamber
INTEGRATEDIN-LINE(between
processes)
Robotwafer
handler
IN-LINE/OFF-LINE(after process)
INTEGRATED METROLOGY USING SPECTROSCOPIC ELLIPSOMETRY
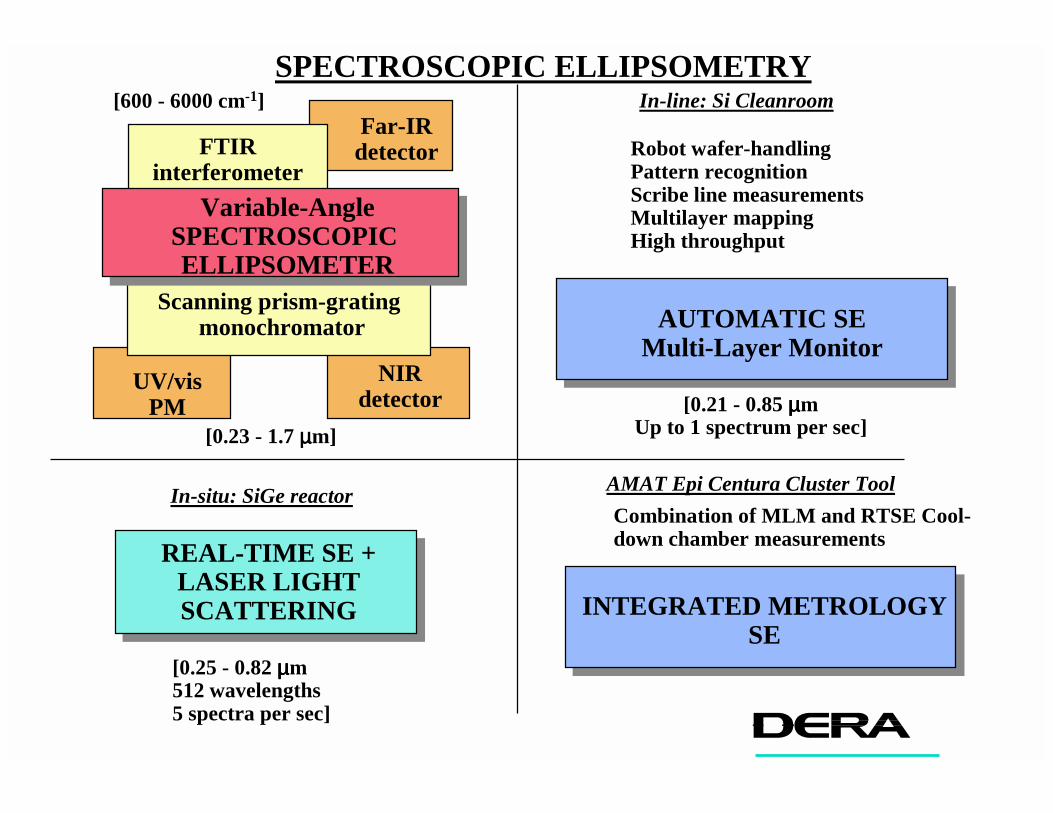
Variable-AngleSPECTROSCOPIC ELLIPSOMETER
Scanning prism-grating monochromator
UV/visPM
NIRdetector
AUTOMATIC SEMulti-Layer Monitor
In-line: Si Cleanroom
Robot wafer-handlingPattern recognitionScribe line measurementsMultilayer mappingHigh throughput
REAL-TIME SE + LASER LIGHT SCATTERING
In-situ: SiGe reactor
[0.25 - 0.82 µµµµm 512 wavelengths5 spectra per sec]
FTIR interferometer
Far-IR detector
[600 - 6000 cm-1]
[0.23 - 1.7 µµµµm][0.21 - 0.85 µµµµm
Up to 1 spectrum per sec]
SPECTROSCOPIC ELLIPSOMETRY
INTEGRATED METROLOGY SE
AMAT Epi Centura Cluster ToolCombination of MLM and RTSE Cool-down chamber measurements

Applied Materials Epi Centura ®❚ single wafer cluster tool wafer sizes:
100mm, 150mm, 200mm❚ standard reduced pressure processes❚ new low pressure process❚ n- and p-type Si and SiGe multi-layers❚ selective and non-selective epitaxy❚ strain-relaxed SiGe virtual substrates❚ integrated metrology under development
Custom low-pressure cold-wall reactor❚ UHV background pressure❚ 100mm, single wafer❚ in-situ diagnostics for process control❚ n- and p-type Si and SiGe multi-layers❚ SiGe virtual substrates❚ high mobility 2D electron gases in strained-Si layers❚ SiGe/Si multi-quantum well structures
Advanced Low-Temperature Epitaxy at DERA
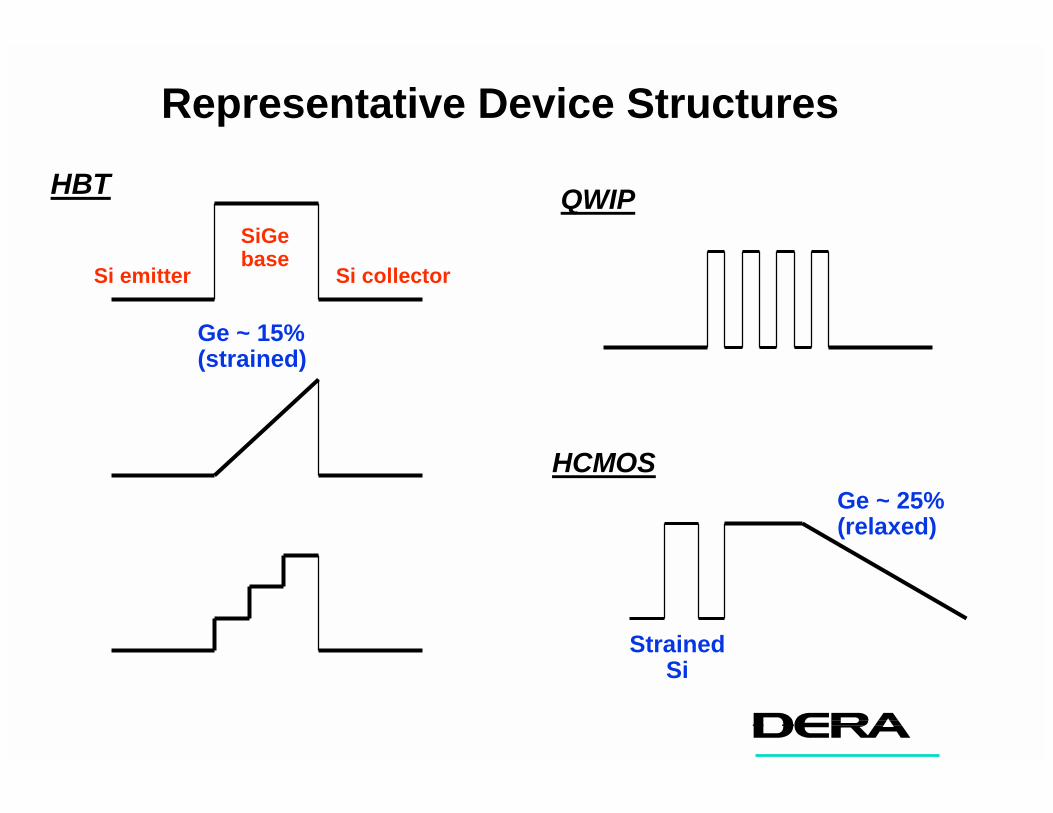
Representative Device Structures
HBT QWIP
HCMOS
Ge ~ 15% (strained)
Ge ~ 25% (relaxed)
Strained Si
Si collector
SiGe base
Si emitter

Prism
MultichannelDetector
Entrance Fiber
G rating
P ris m
P MT
E ntrance F iber
SOPRA Multi-Layer Monitor
Scanning
O.M.A.
Scanningchannel
O.M.A.channel
PDA
PMT

Strained Si(1-x)Ge(x)
Energy (eV)2.0 3.0 4.0 5.0
Rea
l(Die
lect
ric C
onst
ant),
ε1
Imag(D
ielectric Constant),
ε2
-40
-20
0
20
40
60
0
10
20
30
40
50
Six=0.065x=0.125x=0.17x=0.23

Strained and Relaxed Si(0.8)Ge(0.2)
Energy (eV)2.5 3.0 3.5 4.0 4.5
Rea
l(Die
lect
ric C
onst
ant),
ε 1
Imag(D
ielectric Constant),
ε2
-20
-10
0
10
20
30
40
0
10
20
30
40
50
strained, ε1relaxed, ε1strained, ε2relaxed, ε2
E1E1 + ∆∆∆∆1

Thin SiGe Layer
Energy (eV)2.5 3.0 3.5 4.0 4.5
<ε1>
<ε2 >
-20
-10
0
10
20
30
40
0
10
20
30
40
50Fit <ε1><ε2>
0 si 1 mm1 sigewv x=0.140 359.57 Å2 sio2 3.8448 Å
Thick SiGe Layer
Energy (eV)1.5 2.4 3.3 4.1 5.0
Tan
Ψ
Cos∆
0.0
0.2
0.4
0.6
0.8
-1.2
-0.9
-0.6
-0.3
-0.0
0.3
0.6Fit TanΨCos∆
0 si 1 mm1 sigewv x=0.110 6067.6 Å2 sio2 9.9339 Å
SE Characterisation of Single SiGe Epitaxial Layers

Growth Rate Vs Germanium Content (610C)
0
0.2
0.4
0.6
0.8
1
1.2
1.4
1.6
0 0.05 0.1 0.15 0.2 0.25
Ge content
Gro
wth
Rat
e (A
ng/s
ec)
SEXRD
Germanium Content Vs Gas Ratio
0
0.05
0.1
0.15
0.2
0.25
0 0.01 0.02 0.03 0.04 0.05 0.06 0.07 0.08
Gas Ratio (GeH4 / SiH4)
Ge
Co
nten
t
XRDSE
Calibration of DERA SiGe Epi Process

substrate
high-low15%
7%
992 Å
low-high
substrate
10%18%
917 Å
SE Characterisation of Graded SiGe Layers
Energy (eV)2.0 2.5 3.0 3.5 4.0 4.5
<ε1>
<ε2 >
-20
-10
0
10
20
30
40
0
10
20
30
40
50
Fit high-lowlow-high

-4 -3 -2 -1 0 1 2 3 4-4-3-2-101234
0.135-0.13750.1325-0.1350.13-0.1325
1 2 3 4 5S1
S2
S3
S4
S5725-750700-725675-700650-675625-650600-625575-600550-575
-4 -3 -2 -1 0 1 2 3 4-4
-3
-2
-1
0
1
2
3
4
370-375365-370360-365
1 2 3 4 5S1
S2
S3
S4
S50.139-0.14
0.138-0.139
0.137-0.138
0.136-0.137
0.135-0.136
VG Reactor AMAT Reactor
Ge fraction Ge
fraction
SiGe thickness (Å)
SiGe thickness (Å)

LLS PC
Xe lamp
700
Windows
Analyzer
Collimating Optics
Optical Fibre
PRISM SPECTROMETERWITH INTENSIFIED
PHOTODIODE ARRAY(250 - 825 nm)
Diaphragm
Heater and Wafer
Rotating Polarizer
Shutter
Collimating Optics
Diaphragm
ELLIPSOMETER CONTROL
ELECTRONICS
REACTOR CONTROL
PC
To Reactor Mass Flow Controllers
and Heater
Xe Lamp Power Supply
Zoom Lens
Filter
PM Tube
Amp-Disc
Ar Laser(488 nm)
Shutter
Real-time Spectroscopic Ellipsometry and Laser
Light Scattering
ELLIPSOMETRY PC
DSP

ANALYSIS OF REAL-TIME MULTI-WAVELENGTH DATA
� Normal Spectral Regression�average x and total thickness
� Virtual Interface Spectral Regression�surface x and growth rate as f(time) - demonstrated�accumulated thickness - endpointing demonstrated
� Artificial Neural Networks (with Principal Components)�surface x as f(time) independent of growth rate - achieved�extensive training required for specific structures�very fast
� Bayesian Statistical Tracking�surface x and growth rate as f(time) - achieved�predictive tracking based on trends and system models�provides statistical confidence limits

-20
-10
0
10
20
30
40
2 2.5 3 3.5 4 4.5 5
Energy (eV)
εε εε 11 11
0
5
10
15
20
25
30
35
40
εε εε 22 22
Si
20% Ge
610ºC
SiGe High Temperature Reference Spectra(0, 4, 6, 9, 11, 14, 17, 20% Ge)
0
0.05
0.1
0.15
0.2
0.25
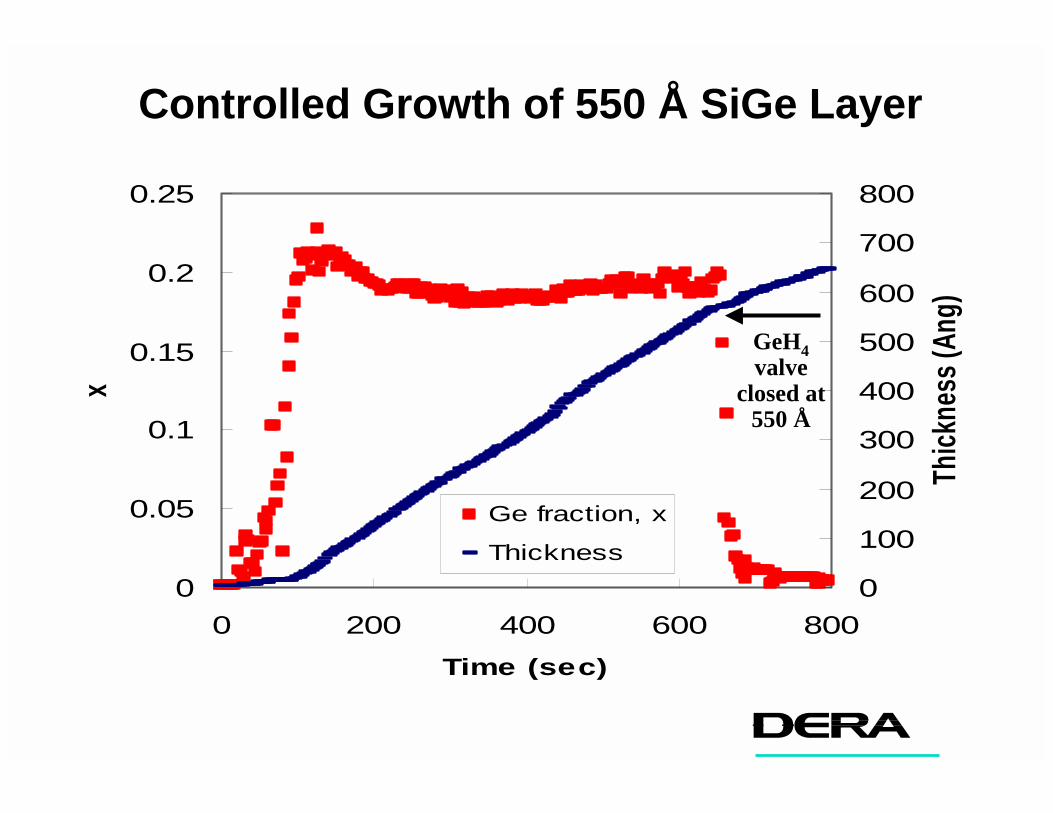
0 200 400 600 800Time (sec)
x
0
100
200
300
400
500
600
700
800
Thick
ness
(Ang
)
Ge fraction, x
Thickness
GeH4 valve
closed at 550 Å
Controlled Growth of 550 Å SiGe Layer

Sequential Bayesian estimation of composition
Bayesian approach to composition estimation using state of the art tracking methods:
PriorPrior
PosteriorPosterior
ObservationsObservations
Prior knowledge is updated to
Posterior knowledge in the
light of observations.
Incorporation of system model to track specified trajectory

Real-time SE and Off-line SIMS Data for Stepped Ge Layer Profile
0
0 .02
0 .04
0 .06
0 .08
0 .1
0 .12
0 .14
0 .16
0 .18
0 .2
0 500 1 000 1 500 200 0 250 0
D e p th (A n g stro m s)
Ge
frac
tion
RTSE
SIMS

Spectrometer
Xenon Lamp
Cool-down chamber
Electronics and Power supplies
Optical
ibreEllipsometer
head
Transfer chamber
X-Y-Z stage with Autofocus & Pattern Recognition
MEDEA T618 Metrology Platform WP3.2

Advantages of Integrated Metrology
❚ Rapid process development❚ Evaluation of in-situ cleaning❚ Run-to-run and chamber-to-
chamber repeatability❚ Cross-wafer uniformity❚ Go/no go after each process
step❚ Accurate measurement of
layers obscured by later processing, eg buried thin
Si or SiGe, gradients❚ Run-to-run control and early
fault detection
❚ Implementation of SE in cool-down chamber of AMAT Epi Centura
- Adapt and test SE instrument- Reference spectra measurement- Methodology and system integration
❚ Evaluation of applicability- Measurements between processes
and off-line verification- Tests on patterned wafers
❚ Recommendation for improved cost-effectiveness
- Throughput, minimum requirements
Future Work