of living impacted spending habits? Q2 · 2 days ago · BROLL SA RETAIL SNAPSHOT Q2:2018 4 R 18 R...
7
Q2 2018 www.broll.com the impact of price hikes on retail spend retail SNAPSHOT Has the high cost of living impacted spending habits?
Transcript of of living impacted spending habits? Q2 · 2 days ago · BROLL SA RETAIL SNAPSHOT Q2:2018 4 R 18 R...

Q22018
www.broll.com
the impact of price hikes on retail spend
retailSNAPSHOT
Has the high cost of living impacted spending habits?
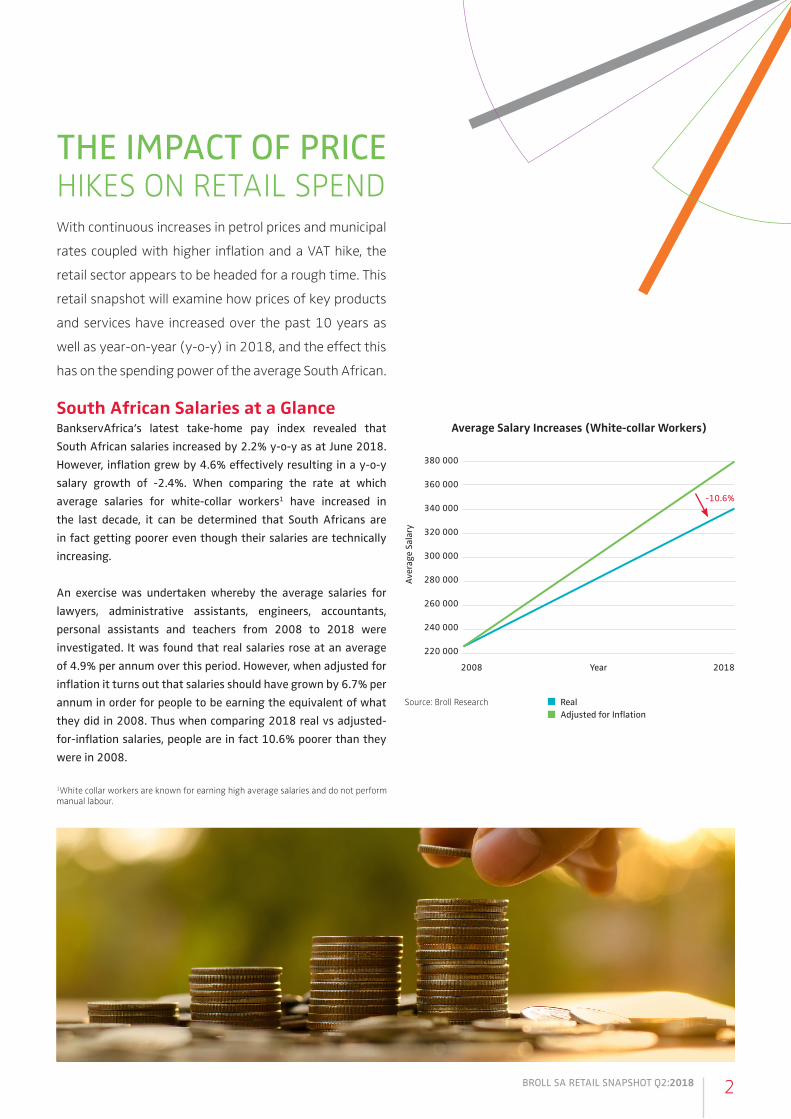
South African Salaries at a GlanceBankservAfrica’s latest take-home pay index revealed that South African salaries increased by 2.2% y-o-y as at June 2018. However, inflation grew by 4.6% effectively resulting in a y-o-y salary growth of -2.4%. When comparing the rate at which average salaries for white-collar workers1 have increased in the last decade, it can be determined that South Africans are in fact getting poorer even though their salaries are technically increasing.
An exercise was undertaken whereby the average salaries for lawyers, administrative assistants, engineers, accountants, personal assistants and teachers from 2008 to 2018 were investigated. It was found that real salaries rose at an average of 4.9% per annum over this period. However, when adjusted for inflation it turns out that salaries should have grown by 6.7% per annum in order for people to be earning the equivalent of what they did in 2008. Thus when comparing 2018 real vs adjusted-for-inflation salaries, people are in fact 10.6% poorer than they were in 2008.
2BROLL SA RETAIL SNAPSHOT Q2:2018
THE IMPACT OF PRICE HIKES ON RETAIL SPEND With continuous increases in petrol prices and municipal
rates coupled with higher inflation and a VAT hike, the
retail sector appears to be headed for a rough time. This
retail snapshot will examine how prices of key products
and services have increased over the past 10 years as
well as year-on-year (y-o-y) in 2018, and the effect this
has on the spending power of the average South African.
1White collar workers are known for earning high average salaries and do not perform manual labour.
Average Salary Increases (White-collar Workers)
380 000
360 000
340 000
320 000
300 000
280 000
260 000
240 000
220 000
-10.6%
2008 Year 2018
RealAdjusted for Inflation
Source: Broll Research
Aver
age
Sala
ry
Factors Affecting Consumer Spend
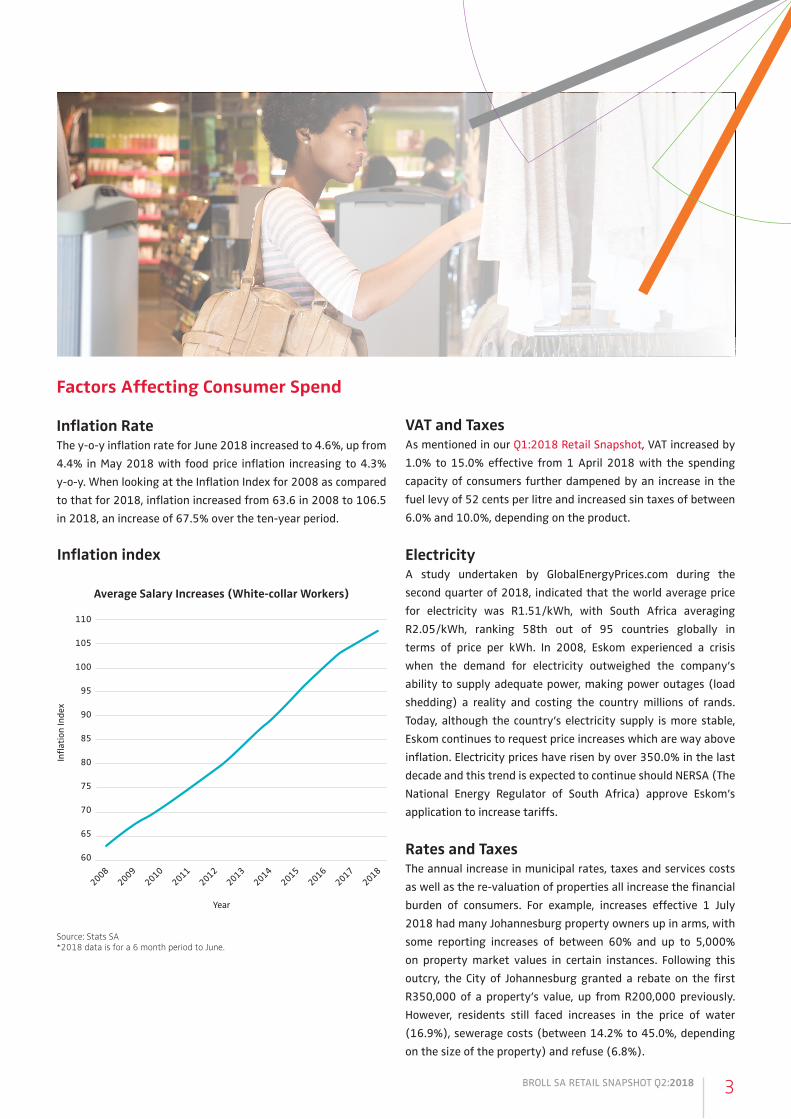
Inflation RateThe y-o-y inflation rate for June 2018 increased to 4.6%, up from 4.4% in May 2018 with food price inflation increasing to 4.3% y-o-y. When looking at the Inflation Index for 2008 as compared to that for 2018, inflation increased from 63.6 in 2008 to 106.5 in 2018, an increase of 67.5% over the ten-year period.
VAT and TaxesAs mentioned in our Q1:2018 Retail Snapshot, VAT increased by 1.0% to 15.0% effective from 1 April 2018 with the spending capacity of consumers further dampened by an increase in the fuel levy of 52 cents per litre and increased sin taxes of between 6.0% and 10.0%, depending on the product.
ElectricityA study undertaken by GlobalEnergyPrices.com during the second quarter of 2018, indicated that the world average price for electricity was R1.51/kWh, with South Africa averaging R2.05/kWh, ranking 58th out of 95 countries globally in terms of price per kWh. In 2008, Eskom experienced a crisis when the demand for electricity outweighed the company’s ability to supply adequate power, making power outages (load shedding) a reality and costing the country millions of rands. Today, although the country’s electricity supply is more stable, Eskom continues to request price increases which are way above inflation. Electricity prices have risen by over 350.0% in the last decade and this trend is expected to continue should NERSA (The National Energy Regulator of South Africa) approve Eskom’s application to increase tariffs.
Rates and TaxesThe annual increase in municipal rates, taxes and services costs as well as the re-valuation of properties all increase the financial burden of consumers. For example, increases effective 1 July 2018 had many Johannesburg property owners up in arms, with some reporting increases of between 60% and up to 5,000% on property market values in certain instances. Following this outcry, the City of Johannesburg granted a rebate on the first R350,000 of a property’s value, up from R200,000 previously. However, residents still faced increases in the price of water (16.9%), sewerage costs (between 14.2% to 45.0%, depending on the size of the property) and refuse (6.8%).
3BROLL SA RETAIL SNAPSHOT Q2:2018
Inflation index
110
105
100
95
90
85
80
75
70
65
60
20082010
20122014
20162009
20112013
20152017
Year
2018
Average Salary Increases (White-collar Workers)
Infla
tion
Inde
x
Source: Stats SA*2018 data is for a 6 month period to June.

4BROLL SA RETAIL SNAPSHOT Q2:2018
R 18
R 16
R 14
R 12
R 10
R 8
R 6
R 4
R0
Average Fuel Price Increases
Fuel Fuel in South Africa is still considered relatively cheap on a global scale, sitting very much in the middle of an average fuel price scale compared to other countries, with the average price around the world being R15.44/litre. However, the country has been faced with a number of price hikes recently and on the 4th July 2018 yet another fuel price increase was implemented, this time breaking the country’s fuel price record with a staggering rate of R16.02/litre for 95 unleaded. When looking at a six month period in 2008 and 2018 (January to July), July in both years reported the highest rate per litre of fuel. When comparing the fuel price in July 2008 vs July 2018 an increase of 49.7% is evident. These increases not only affect the cost of transport but also the cost of food, which is already well above the inflation rate as shown later in this report.
Food When looking at the cost of food compared to a decade ago, it is evident that most products have risen well above the inflation rate, with an average increase of 93.4% for the same basket of goods. White bread has increased from R5.89 in 2008 to R13.49 in current prices. However when looking at the rate of inflation and adjusting the prices accordingly, white bread should only cost R9.86. That is a 36.8% difference. When considering inflation, the only products that work out slightly cheaper are milk and wine. So why are so many products more expensive than the rate of inflation? The answer is not a simple one as varying factors play a role in determining the cost of goods. However, aspects which majorly contribute to these price changes include the likes of electricity and fuel prices, both of which have increased well above the inflation rate, in addition to climate conditions such as the recent drought across the country. 2008
2018Source: Automobile Association of South Africa
* In 2008 Chocolate slabs were 100g, in 2018 they are 80g.** In 2008 Beer was sold in 340ml cans, in 2018 they are 330ml cans.Note: Inflation = 2008 figures adjusted for inflation.
1L Long Life Milk
Broccoli per kg
2008: R8.462018: R13.99Inflation: R14.16
2008: R20.262018: R39.99Inflation: R33.92
2008: R56.022018: R109.96Inflation: R93.78
2008: R14.792018: R29.90Inflation: R24.76
2008: R5.892018: R13.49Inflation: R9.86
2008: R7.932018: R14.99Inflation: R13.27
2008: R71.732018: R119.90Inflation: R120.08
2008: R20.132018: R45.35Inflation: R33.70
2008: R12.702018: R29.99Inflation: R21.26
2008: R13.892018: R36.99Inflation: R23.25
2008: R36.422018: R60.00Inflation: R60.97
2008: R28.872018: R59.99Inflation: R48.33
T-Bone Steak per kg
2.5kg White Sugar
White Bread
Chocolate*
750ml Sunflower oil
250g Instant Coffee
1kg Gouda
Cigerette 20pk
Bottle of Red Wine
Six pack of Beer**
5BROLL SA RETAIL SNAPSHOT Q2:2018
Entertainment Another interesting fact, although not related to a basic necessity, is the cost of a movie ticket today compared with that of ten years ago. The average movie ticket, not including popcorn and Coke, is now 228.0% more expensive in nominal terms. In 2008, you would have paid R25.00 for a 2D movie where today you are looking at approximately R85.00 a ticket. When taking 2008 prices into consideration and adjusting for inflation, a 2D movie ticket should in fact only cost the consumer R41.85; however, increasing costs of electricity and fuel amongst others, all contribute to higher prices.
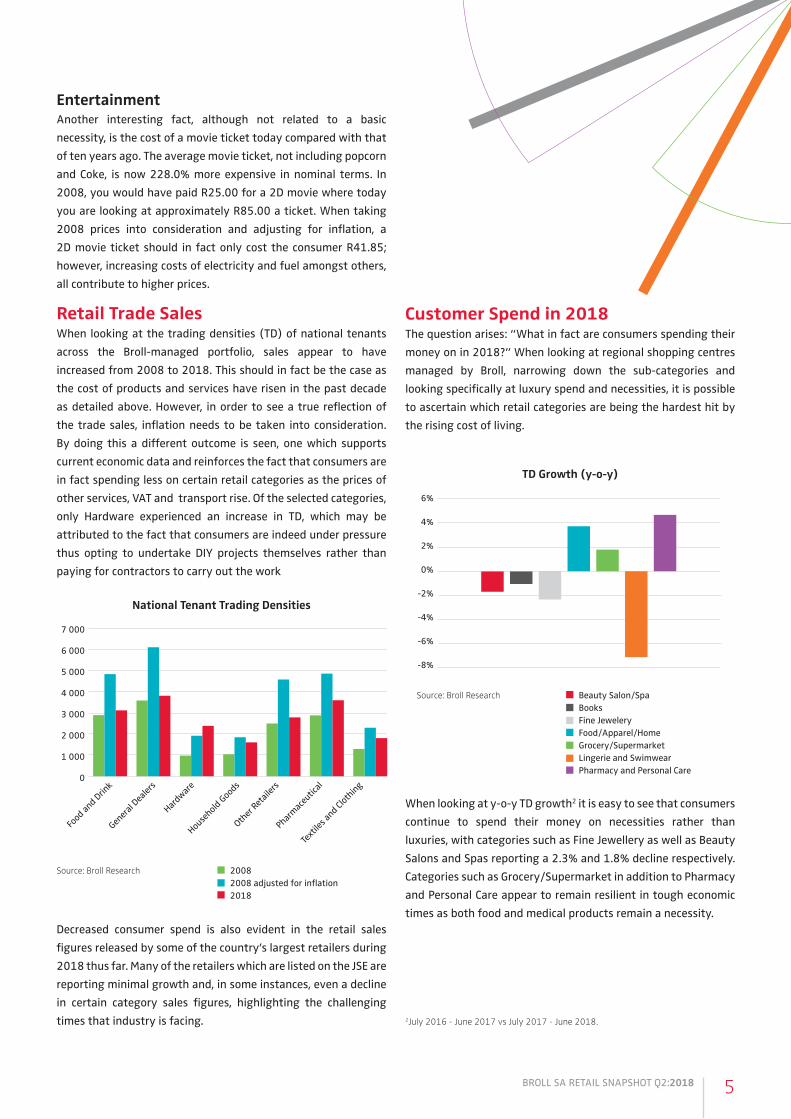
Retail Trade SalesWhen looking at the trading densities (TD) of national tenants across the Broll-managed portfolio, sales appear to have increased from 2008 to 2018. This should in fact be the case as the cost of products and services have risen in the past decade as detailed above. However, in order to see a true reflection of the trade sales, inflation needs to be taken into consideration. By doing this a different outcome is seen, one which supports current economic data and reinforces the fact that consumers are in fact spending less on certain retail categories as the prices of other services, VAT and transport rise. Of the selected categories, only Hardware experienced an increase in TD, which may be attributed to the fact that consumers are indeed under pressure thus opting to undertake DIY projects themselves rather than paying for contractors to carry out the work
Decreased consumer spend is also evident in the retail sales figures released by some of the country’s largest retailers during 2018 thus far. Many of the retailers which are listed on the JSE are reporting minimal growth and, in some instances, even a decline in certain category sales figures, highlighting the challenging times that industry is facing.
20082008 adjusted for inflation2018
7 000
6 000
5 000
4 000
3 000
2 000
1 000
0
Source: Broll Research
National Tenant Trading Densities
Food and Drin
k
Genera
l Dea
lers
Hardware
Household Goods
Other Reta
ilers
Pharmaceu
tical
Textile
s and Cl
othing
6%
4%
2%
0%
-2%
-4%
-6%
-8%
Customer Spend in 2018The question arises: “What in fact are consumers spending their money on in 2018?” When looking at regional shopping centres managed by Broll, narrowing down the sub-categories and looking specifically at luxury spend and necessities, it is possible to ascertain which retail categories are being the hardest hit by the rising cost of living.
When looking at y-o-y TD growth2 it is easy to see that consumers continue to spend their money on necessities rather than luxuries, with categories such as Fine Jewellery as well as Beauty Salons and Spas reporting a 2.3% and 1.8% decline respectively. Categories such as Grocery/Supermarket in addition to Pharmacy and Personal Care appear to remain resilient in tough economic times as both food and medical products remain a necessity.
TD Growth (y-o-y)
Beauty Salon/SpaBooksFine JeweleryFood/Apparel/HomeGrocery/SupermarketLingerie and SwimwearPharmacy and Personal Care
Source: Broll Research
2July 2016 - June 2017 vs July 2017 - June 2018.

CONCLUDING REMARKSMost of the country’s population is concerned about the high cost of living, which appears to be increasing faster and higher than the average increase in salaries. When taking all of the above-mentioned factors into account, it is evident that consumers continue to focus their spending on necessities such as food and pharmaceutical products with luxuries such as jewellery taking a back seat.
This trend is set to continue throughout 2018 with little signs of relief likely. The rising price of fuel continues, increased electricity tariffs and living costs overall continue to rise, all of which impact upon the retail supply chain and hence the goods and services which consumers spend on. This will negatively affect consumers’ pockets and is expected to place further pressure on disposable income. In conclusion, the retail market looks set to remain under pressure, and landlords and retailers alike need to be conscious of the pressure consumers are under. This makes the provision of shoppertainment and unique offerings more vital than ever before.
6BROLL SA RETAIL SNAPSHOT Q2:2018

For more information please email [email protected]
DisclaimerBroll Property Group has taken every care in the preparation of this report. The sources of information used are believed to be accurate and reliable, but no guarantee of accuracy or completeness can be given. Neither Broll Property Group, nor any CBRE company, nor any director, representative or employee of Broll Property Group, accepts liability for any direct or consequential loss arising from the use of this document or its content. The information and opinions contained in this report are subject to change without notice. No part or parts of this report may be stored in a retrieval system or reproduced or transmitted in any form or by any means, electronic, mechanical, reprographic, recording or otherwise, now known or to be devised, without prior consent from Broll Property Group.
Retail SnapshotQ2: 2018

![code- q%?lb/--3 SPIN STRUCTURE MEASUREMENTS FROM/67531/metadc... · R(z,Q2))] we used the NMC3' fits to F2(x,Q2) data and SLAC fit3' to 7 R(x,Q2), which was extrapolated to unmeasured](https://static.fdocuments.net/doc/165x107/5f0e59ba7e708231d43ed1ed/code-qlb-3-spin-structure-measurements-from-67531metadc-rzq2-we.jpg)