of Conviction. Constancy · the comparative information presented in these financial statements for...
90
Annual Report 2018-19 Courage of Conviction. Constancy of Change.
Transcript of of Conviction. Constancy · the comparative information presented in these financial statements for...
Annual Report 2018-19
Courage of Conviction.
Constancy of Change.
Kotak M
ahindra Bank Limited | Thirty Fourth A
nnual Report 2018-19
Kotak Mahindra Bank Limited, 27BKC, C 27, G Block, Bandra-Kurla Complex, Bandra (E),
Mumbai - 400 051Website: www.kotak.com
BSE: 500247 | NSE: KOTAKBANK | Bloomberg: KMB:IN
CIN: L65110MH1985PLC038137 conc
ept a
nd d
esig
n at
Wya
ttPr
ism C
omm
unic
atio
ns
Annual Report 2018-19
Courage of Conviction.
Constancy of Change.
Kotak M
ahindra Bank Limited | Thirty Fourth A
nnual Report 2018-19Kotak Mahindra Bank Limited, 27BKC,
C 27, G Block, Bandra-Kurla Complex, Bandra (E), Mumbai - 400 051
Website: www.kotak.com
BSE: 500247 | NSE: KOTAKBANK | Bloomberg: KMB:IN
CIN: L65110MH1985PLC038137 conc
ept a
nd d
esig
n at
Wya
ttPr
ism C
omm
unic
atio
ns

1
Financial HighlightsBank Reports and
StatementsConsolidated Financial
StatementsDirectors Report
Courage of Conviction.Constancy of Change.
Board’s ReportTo The Members of
Kotak Mahindra Asset Management Company Limited
Your Directors present their Twenty Fifth Annual Report together with the Audited Financial Statements of the Company for the financial year ended March 31, 2019.
1. FINANCIAL HIGHLIGHTS
(` in Lakhs)
Year ended March 31, 2019
Year ended March 31, 2018
Gross income 67,419 51,248
Profit before Depreciation and Tax 36,118 13,532
Depreciation and Amortization 975 907
Profit before Tax 35,143 12,625
Profit after Tax 22,900 8,132
Other Comprehensive Income (34) (38)
Balance of Profit from previous years 17,703 10,459
Amount available for appropriation 40,569 18,591
Appropriations
Transfer to Capital Redemption Reserve - (850)
Surplus carried forward to the Balance Sheet 40,569 17,703
For the purposes of reporting, we have transitioned our basis of accounting from Indian generally accepted accounting principles (“IGAAP”) to Ind AS. The accounting policies have been applied in preparing the financial statements for the year ended 31 March 2019, the comparative information presented in these financial statements for the year ended 31 March 2018 and in the preparation of an opening Ind AS balance sheet at 1 April 2017 (the “transition date”).
In preparing our opening Ind AS balance sheet, we have adjusted amounts reported in financial statements prepared in accordance with IGAAP. On transition, we did not revise estimates previously made under IGAAP except where required by Ind AS.
2. DIVIDEND Your Directors recommend a dividend of `2384 lakhs excluding dividend distribution tax.
Transfer to reserves: Your Directors have not recommended any of profits to the General Reserves of the Company.
SHARE CAPITAL
The issued, subscribed and paid up share capital of the Company is `29,80,00,000/- divided into 2,98,00,000 Equity Shares of `10/- each. There has been no change in the share capital during the year.
3. REVIEW OF OPERATIONS OF THE COMPANY The Company is a whollyowned subsidiary of Kotak Mahindra Bank Limited (KMBL) and is the Asset Manager for Kotak Mahindra Mutual
Fund (KMMF) which is a trust set up under the provisions of The Indian Trusts Act, 1882.
The growth in the mutual funds industry continues unabated. The industry registered a growth of 6% YOY in Q4 FY19 over Q4 FY18 with the Quarterly Average Assets under Management (QAAUM) for Q4 FY19 at `24.52 Lakh cr.
During the same period, on the basis of percentage growth in QAAUM, KMAMC was amongst the second fastest growing Mutual Fund House – within the top 10 Fund Houses ranked by QAAUM. The QAAUM which stood at ̀ 1, 50,271cr for Jan-Mar 2019 has seen growth of around 21% in Q4 FY19 over Q4 FY18 and 157% over last 3 years. KMAMC continues to be the 7th largest Fund House in the country

2 Annual Report 2018-19
in terms of QAAUM. Market Share in QAAUM has grown to 6.13% from 5.41% in Q4 FY18 and 4.32%, 3 years back. The cumulative number of non-gold SIPs with the mutual fund stood at 11.92 Lakhs in Mar 19 as compared to 9.67 Lakhs in Mar 18.
KMAMC has 18.75 Lakhs unique investors basis the RTA data against the industry of 192.86 Lakhs, a market share of 9.7%, against a share of 8.8% in Mar 18. Thus, we have a share of investors of 9.7% against a overall market share in AUM terms of 6.2%.
The portfolio management business witnessed a drop in AUM, given the turbulence in the market, especially in the small and mid-cap space. Resultantly, the Company ended the year with discretionary AUM of `3,332cr against `3,762cr as on March 31, 2018.
The annual AAUM of the Company for FY19 was `1,38,215cr against `1,15,398cr in FY18, a growth of 20%. Consequently, Fee & Commission Income grew by 30% to `651.08cr from `501.99 cr in FY18. The overall costs reduced by `321.78cr in FY19 against `385.42cr in FY18. Hence, the overall profit before tax has increased to `352.41cr in FY19 compared to `127.05cr in FY18, a growth of 277%. Key regulatory changes viz. all commissions as trail only and no upfront directly or indirectly, resulted in a drop in the business promotion expenses from `169.53cr in FY18 to `145.28cr in FY19. Given the sharp drop in PMS volumes over the previous year, the referral commissions also witnessed a drop from `82.67 cr in FY18 to `28.36 cr in FY19.
New schemes launched: • ThirtyTwoFixedMaturityPlans(FMPs)werelaunchedwhichcollected`6, 186.17cr during their NFO period.
• ThreeIntervalSchemewerelaunchedwhichcollected`219.17cr during their NFO period.
• Twocloseendeddiversifiedequityfundswerelaunched,whichgarneredatotalof`405.14cr during their NFO period.
• KMAMChadasuccessful launchof itsBalancedAdvantageFund,whichwitnessedacollectionof`1877.97cr during its NFO period. This was at all-time high for KMAMC in its NFO collection since inception of the business.
• KMAMClauncheditsOvernightFundwhichcollected`1015.52cr during its NFO period.
Digitization initiatives:
Investor Related Key Developments • LaunchedVideoKYCmoduleinexistingappandlaunched“MyFirstMF”appfornon-KYCverifiedinvestors.
• Revampedwebsitewithmanynewfeatures.Somekeyfeaturesincludemanyautoalertsforinvestors,portfoliosummaryrevamp,a micro site for the ”Lets Plan with Kotak” campaign which resulted in 10,000 organic views, etc.
• LaunchedInstantRedemptionfacilityforInvestors.
• LaunchedNewsiteforPMSbusiness.
• Simplifiedthemobileloginaccesswith4digitpinandbiometric.
• IntroducedMissedcallbasedportfoliovaluationforinvestors.
• DistributorRelatedKeyDevelopments.
• LaunchedProstartOnlineTrainingModulewhichisusedbyover1400IFA’swithover20,000videoviews.
• Createdprovisionfordistributorstodownloadinvestorsaccountstatementandcapitalgainstatement
API’sforpartneringwithnewagedistributors.
These initiatives have resulted in a growth of 64% in the digital business, increased client acquisitions and Online SIP registrations. Our online IFA empanelment features helped us digitally register 6,400 IFAs
Market influences:
Equity Market Overview: FY19 was an eventful and tumultuous year, almost akin to a roller coaster ride. The year started on an optimistic note, with expectations
of recovery in both domestic GDP growth and corporate earnings. The year also saw very sharp movement in crude oil prices all of which had a bearing on the domestic macro economy and the currency.

3
Financial HighlightsBank Reports and
StatementsConsolidated Financial
StatementsDirectors Report
Courage of Conviction.Constancy of Change.
September 2018 saw the beginning of a liquidity crisis in the NBFC (Non-Banking Financial Services) sector brought on by the default by IL&FS (Infrastructure Leasing and Financial Services). The NBFC sector which had been growing at a fast pace, saw a sudden liquidity squeeze, resulting in slow down of growth and apprehensions of credit defaults. Those entities running Asset – Liability mismatches were the hardest hit. The situation, however, improved considerably towards the end of the year with the RBI providing liquidity support to the system through OMOs (Open Market Operations), forex swaps and many companies resorting to asset sell downs.
Mutual fund flows were resilient throughout the year and provided support to the equity markets. The flows into mutual funds proved to be sticky with investors adopting the SIP (Systematic Investment Plan) route for their investment requirements. For FY19, the net inflows into equity from DIIs or Domestic Institutional Investors stood at USD 10.25 Bn. Foreign Institutional Investors (FIIs) on the other hand were net sellers in Indian equities for the first 9 months of FY19. The situation changed sharply in February and March 2019 with many investors starting to factor in higher probability of a stable government post the general elections.
The economy is at an inflection point. Structural reforms initiated over the last few years such as the implementation of GST (Goods and Services Tax), Bankruptcy Code, steps taken to formalize the economy, etc. are likely to start yielding benefits which would accrue over the long-term. While there are fears of some slowdown in consumption activity in the near term, we believe that this is not a structural problem for the economy. With inflation expected to stay within the medium term, the RBI target of 4% (+/-2%) and, consequently, real interest rates in the economy being high, the RBI could have room to cut policy rates further. Corporate asset quality stress appears to be ebbing and there are visible signs of large ticket asset resolutions under the Bankruptcy Code.
Oil prices peaked at USD 86/bbl. in October 2018. While we cannot rule out volatility in crude oil prices in FY20, our expectation is that the Current Account Deficit (CAD) in FY20 would range between 2.3-2.5% of GDP, which appears manageable. The forex reserves of the country at USD 412 Bn as on 31st March 2019 also provide comfort in the event of external sector vulnerability.
The global macro risks, especially those around growth outlook need monitoring. While the risk of a full blown trade war between the US and China remains, the fears appear to have reduced considerably. Trends in global GDP growth (including the US and China) would need to be watched closely. Any sharp deceleration in growth could have an impact on investor risk appetite and, consequently, foreign flows into the country.
Against this backdrop, we expect the large cap Nifty Index to report 16-18% earnings growth in FY20 with a large chunk of the improvement likely to be driven by corporate banks on account of lower credit costs. Over the last few years, the Midcap index outperformed the Nifty and, consequently, there was a huge difference in valuations of midcaps v/s the large caps. The correction in midcaps during FY19 has brought the relative Midcap valuation v/s the Nifty closer to the 2014 levels (which was the time when midcap Bull Run started). Similar is also the case for small cap valuations v/s the Nifty. With the froth in the mid and small cap space now having been wiped out, one could selectively look at investments in quality midcap companies with good managements, healthy Balance Sheets and high growth potential.
With improving corporate earnings, we would continue to follow our investment philosophy of Growth at a Reasonable Price (GARP) with an aim of investing in companies which have the potential to report earnings growth higher than the market, a strong Balance Sheet position and stable management.
Investors may keep investing through mutual funds in a systematic manner for the medium to long-term keeping in mind individual risk profile and return expectations.
Debt Market Overview 2018 saw markets everywhere, globally as well as domestically, behave like quicksilver – ever-shifting and unpredictable. This year has
been one of the worst on record this decade for global bond markets. Rising benchmark interest rates, expectations of slower global growth and wavering outlook on oil prices have been the key drivers for negative returns, dampening investor demands and widening spreads.
Against a backdrop of choppy global bond yields, slowing global growth, escalating tariff wars and geopolitical tensions, the Indian gilts have had a trying year. Starting with 7.34%-levels in Jan 2018, the 10-yr gilt improved to its annual low of 7.13% in the first weekofApril.However,posttheRBI’sMonetaryPolicyCommittee(MPC)announcementinearlyApril2018,inadequateOpenMarketOperations (OMO) announcements by the RBI and the currency crises experienced by certain emerging market economies, the yields spiked to a high 8.18% in Sep 2018.
H2 of FY18-19 was quite eventful for credit markets due to stress in the NBFC sector, which lead to sharp widening of credit spreads. Post September, the pressure on the Indian gilts seems to have eased as the 10-yr gilt rallied to 7.25%-levels. This rally has mainly been driven by a significant cooling in crude prices, back-to-back OMO announcements by the RBI, strengthening rupee and rejuvenation in FII inflows. This could not percolate to the credit market across the board.

4 Annual Report 2018-19
Crude prices touched a high of US$ 86.09/bbl. at the beginning of October 2018 before they cooled down by ~36% to hover around the US$ 55/bbl. as on Dec 20, 2018.
Atthebeginningof2018,twoofourbiggestconcernsforIndiangiltandbondyieldsstemmedfromtheGovernment’sabilitytocontainfiscaldeficit,especiallyintherunuptogeneralelectionsinfirsthalfofFY19andfromtheRBI’sabilitytomanageinflation.
InNovember,CPIinflationhadcorrectedtoa14-monthlowof2.3%withcore-CPIat5.45%,wellwithintheRBI’stargetedinflationrange of 4% (±2%) for the fiscal year of 2019. Cooling fuel prices and deflating food prices have contributed to lower inflation numbers.
We had a sudden change of Guard at the RBI in December 2018 when Dr. Urijit Patel stepped down and was replaced by Mr. Shaktikanta Das. Thus, change of thought process too and this triggered a different approach to the state of the economy. In lower inflation and the change of guard at the RBI, we saw a complete U turn in the monetary policy from calibrated tightening to a beginning of a rate cutting cycle. In the new regime, the RBI changed the stance form calibrated tightening to Neutral and delivered 2 rate cuts of 25 bps each making the repo rate of 6%. The RBI also introduced FX swap to add durable liquidity and announce two auction of USD 5 USD Bn each. This initiative not only added FX to the kitty and durable liquidity but also lead to some spread tightening in the bond markets.
The Central Government made all efforts to maintain fiscal discipline. However, due to certain revenue shortfall the fears came true and there was a slippage and the Government was able to deliver 3.40% for FY18-19. Despite an election year and some populist scheme, the target FD for FY20 has been set at 3.3%, which shifts the goal post of FRBM target for some more time.
Despite the jitters felt due to various credit events that unfolded during 2018, markets seem to be exhibiting resilience. Domestic investors continued their buying into mutual funds even as FIIs sold.
Certain macro-economic indicators are showing a clear, positive trend from Currency, Inflation and Monetary policy point of view. These spell positively for fix income markets across categories in FY20.
Scheme Performance: The snapshot of the performance for FY-19 of the key schemes is as under:
Equity Schemes Benchmark FY19 Returns (%)
Benchmark Returns (%)
Performance (%)
Kotak Bluechip Fund (Erstwhile Kotak 50) Nifty 50 TRI 9.17 16.45 -7.28
Kotak Equity Hybrid (Erstwhile Kotak Balance Fund)
Nifty 50 Hybrid Composite Debt 70:30 Index
3.28 13.59 -10.31
Kotak India EQ Contra Fund (Erstwhile Kotak Classic Equity)
Nifty 100 TRI 11.6 13.96 -2.36
Kotak Emerging Equity Scheme Nifty Midcap 100 TRI -0.23 -1.85 1.62
Kotak Equity Arbitrage Fund Nifty 50 Arbitrage Index 6.1 5.35 0.75
Kotak Small cap Fund (Erstwhile Kotak Midcap Fund)
Nifty Small cap 50 TRI -6.68 -17.58 10.9
Kotak Equity Opportunities Fund Nifty 200 TRI 8.45 11.89 -3.44
Kotak Standard Multicap Fund (Erstwhile Kotak Select Focus Fund)
Nifty 200 TRI 11.47 11.89 -0.42
Kotak Taxsaver Nifty 500 TRI 10.15 9.7 0.45
Kotak Equity Savings Fund 75% Nifty 50 Arbitrage Index and 25% Nifty 50 TRI
7.55 8.17 -0.62
Kotak Infrastructure and Economic Reform Fund
India Infrastructure Index (Customized Index by IISL)
-6.26 -3.86 -2.4
Kotak Balanced Advantage Fund NIFTY 50 Hybrid Composite Debt 50:50 Index
6.01 7.66 -1.65

5
Financial HighlightsBank Reports and
StatementsConsolidated Financial
StatementsDirectors Report
Courage of Conviction.Constancy of Change.
Debt Schemes Benchmark FY19 Returns (%)
Benchmark Returns (%)
Performance (%)
Kotak Banking and PSU Debt Fund - Reg - Growth
CRISIL Banking and PSU Debt Index 7.59 7.24 0.35
Kotak Bond Scheme - Reg – Growth NIFTY Medium to Long Duration Debt Index
6.85 5.69 1.16
Kotak Bond Short Term Plan - Reg – Growth NIFTY Short Duration Debt Index 7.39 7.39 0
KOTAK DYNAMIC BOND FUND – Reg - Growth (Erstwhile Kotak Flexi Debt Scheme)
Nifty Composite Debt Index 8.85 6.62 2.23
KOTAK MONEY MARKET SCHEME – Reg - Growth (Erstwhile Kotak Floater Short Term Scheme)
Nifty Money Market Index 8.16 7.58 0.58
KOTAK MAHINDRA GILT UNIT SCHEME 98 - INVESTMENTPLAN–Reg–Growth
Nifty All Duration G-Sec Index 7.97 8.95 -0.98
KOTAK CREDIT RISK FUND (Erstwhile Kotak Income Opportunities Fund)
CRISIL Composite AA Short Term Bond Index
6.36 8.01 -1.65
KOTAK MAHINDRA LIQUID SCHEME - Reg - Growth
Nifty Liquid Index 7.39 7.38 0.01
KOTAKSAVINGSFUND-Reg–Growth(Erstwhile Kotak Treasury Advantage Fund)
NIFTY Ultra Short Duration Debt Index
7.83 8.19 -0.36
Kotak Medium Term Fund – Reg- Growth NIFTY Medium Duration Debt Index
5.89 6.76 -0.87
Kotak Corporate Bond Fund Reg – Growth CRISIL Corporate Bond Composite Index
8.25 5.79 2.46
Kotak Low Duration Fund – Reg – Growth NIFTY Low Duration Debt Index 7.69 7.72 -0.03
KOTAK DEBT HYBRID – Reg – Growth (Erstwhile Kotak Monthly Income Plan
CRISIL Hybrid 85+15 - Conservative Index
4.24 7.65 -3.41
Kotak Overnight Fund - Reg – Growth NIFTY 1D Rate Index 6.22 6.32 -0.1
Awards: During FY19, the Company has won number of awards,
• 2018DMAAsiaEchoAwardsforBestUseofDirectMailDiwali–Beejboxwali(Silver)
• CNBCTV18BestMutualFundHouseoftheyear2018
• CNBCTV18BestDebtMutualFundHouseoftheyear2018
• CNBCTV18BestCorporateBondoftheyear2018
• CNBCTV18BestETFoftheyear2018
• CNBCTV18BestArbitrageFundoftheyear2018
Investor Awareness Program: KMAMC has been conducting investor awareness programs throughout India. KMAMC has been making efforts to educate and make
prospective investors aware about Mutual Funds. During the year ended 31st March, 2019, 224 investor awareness programs were conducted across India and approximately 12,084 investors attended these programs.
Further, various booklets, leaflets, newsletters explaining the concepts of Mutual Funds were presented and distributed during the various investor meets with an aim to educate investors.

6 Annual Report 2018-19
4. SUBSIDIARY Kotak Mahindra Pension Fund Limited (KMPFL), a subsidiary of the Company was appointed as a Pension Fund Manager (PFM) by the
PensionFundRegulatoryandDevelopmentAuthority(PFRDA),onApril30,2009.Theinitiallicensewasforaperiodof3years.Variousterm extensions were granted by PFRDA for this arrangement of management of Pension Funds. Request for Proposal (RFP) for selection of Pension Funds for NPS Private Sector Schemes in conjunction with PFRDA, (Pension Fund) Regulations, 2015 dated September 9, 2016 called for bids afresh with applications from the sponsors and allowed differential pricing by PFMs. However, the validity period for this RFP lapsed on October 17, 2017.
KMAMC continues to act as the Sponsor of KMPFL vide letter dated June 24, 2016 until fresh selection process is initiated by PFRDA, under Pension Fund Regulatory and Development Authority (Pension Funds) Regulations, 2015. As per the recent press reports, the Pension Fund Regulatory and Development Authority (PFRDA) is set to issue guidelines on foreign direct investment (FDI) in the sector. PFRDA may also allow higher commission for financial institutions and permit post offices to sign up subscribers for pension products and the commission for pension fund managers is tied to new RFP (Request for proposal) which is proposed to be initiated.
As per the current terms of the appointment, the funds are received in the Trustee Bank (Axis Bank) as per the pension fund subscription information provided by the central record keeping agency (National Securities Depository Limited and Karvy Computershare). The assets are under the custody of the NPS Trustee appointed custodian viz., Stock Holding Corporation of India Limited.
The Company manages nine schemes. During the year, the general business environment has been good for Pension Funds with the industry keeping up the momentum in line with the previous financial year. The combined assets under management (AUM) onMarch 31, 2019 were `784cr (`536cr as of March 31, 2018) a growth of 46.30%. The overall pension fund industry AUM (including the private and public sectors) has grown from `234,579cr as on March 31, 2018 to `318,214cr as on March 31, 2019, a growth of 35.70 % and the private sector industry AUM has grown from `5,682cr as on March 31, 2018 to `9,827cr as on March 31, 2019, a growth of 73%.
At the current stage of pension fund business, considering the low rates of management fees, profits before tax including revenue generated from the investment management activity for March 31, 2019 is `7.08 Lakhs (Previous year – loss `4.92 Lakhs)
5. KEY SEBI CIRCULARS Post SEBI circulars dated October 6, 2017 and December 4, 2017 on scheme categorization, all the changes of the aforesaid circular
have been incorporated in the offer documents of schemes of Kotak Mahindra Mutual fund and the same was completed by June 2018. Further following key circular have been issued by SEBI during the year:
• SEBI(MutualFunds)(SecondAmendment)Regulations,2018readwithSEBIcircularno.SEBI/HO/IMD/DF2/CIR/P/2018/91datedJune 5, 2018 stated that additional expenses in lieu of exit load, have been reduced to 0.05 per cent from 0.20 percent of daily net assets of the scheme from May 29, 2018.
• SEBI,videcircularNo.SEBI/HO/IMD/DF2/CIR/P/2018/137datedOctober22,2018,hasstatedthatallschemerelatedexpenses,including commission paid to distributors, shall necessarily be paid from the scheme only. MFs/AMCs shall adopt full trail model of commission in all schemes, without payment of any upfront commission or up fronting of any trail commission, directly or indirectly, in cash or kind, through sponsorships, or any other route.
• SEBI,videGazetteNotificationno.No.SEBI/LAD-NRO/GN/2018/51-datedDecember13,2018hasrecalibratedtheTotalExpenseRatio (TER), which will reduce the cost of investment for the investors w.e.f 1st April 2019 . For open ended schemes, TER reduction ranges from 5 Bps to 40 Bps where the AUM of the scheme is between `3,000 Cr to `50,000 cr. For close-ended Equity schemes, TER reduced from 2.25 % to 1.25% and 1% for debt Schemes.
• SEBI vide circular no. SEBI/HO/IMD/DF2/CIR/P/2018/160 datedDecember 28, 2018, has permitted segregation of portfolio inmutual fund schemes, in case of a credit event at the issuer level i.e. downgrade or subsequent downgrades in credit rating to below investment grade by a SEBI registered Credit Rating Agency (CRA).
6. UPDATES ON KEY EVENTS: - Certain FMPs of Kotak Mahindra Mutual Fund, had a cumulative exposure of ` 86.16 cr, in IL&FS Group companies. KMMF has
made a 100% provision against the same in the respective Schemes. The recovery will be dependent on resolution plan achieved by the new Board of IL&FS / NCLT.
- Certain FMPs of Kotak Mahindra Mutual Fund had invested in debentures of Essel Group Companies. Few FMPs among these, matured in April 2019 (cumulatively amounting to ` 307.67 cr approximately.) among these matured in April 2019. On 25th January 2019 there was a sharp correction in share price of Zee. Post this correction the, issuer was unable to top-up the required share collateral. Considering the interest of the investors and in accordance with the provisions of SEBI (MF) Regulations, 1996,
7
Financial HighlightsBank Reports and
StatementsConsolidated Financial
StatementsDirectors Report
Courage of Conviction.Constancy of Change.
realized the value of investments forming part of portfolio has been paid to investors on maturity of various FMP schemes in April 2019, barring the portion of investments in the Essel Group This portion of the investment will be distributed upon realization, which is expected in September 2019.
- TheCompanyreceivedaShowCauseNotice(‘SCN’)dated10May2019withregardtocertaininvestmentsmadeintwoFixedMaturity Plans, which matured in April 19, in respect of which, proceeds pertaining to these investments were not paid to the investors on maturity of the FMPs. SEBI has initiated adjudication proceedings vide Show cause Notice dated 31st May 2019, against the Company and some of its officials. The Company intends to file appropriate responses in consultation with its lawyers.
7. DIRECTORS AND KEY MANAGERIAL PERSONNEL
Directors retiring by rotation Mr. Gaurang Shah (DIN 00016660) would retire by rotation at the Twenty Fifth Annual General Meeting (AGM) and, being eligible, has
offered himself for re-appointment.
The Board of Directors recommend re-appointment of Mr. Gaurang Shah (DIN 00016660), as Director at the ensuing AGM.
Directors appointed during the year Ms. Anjali Bansal (DIN 00207746) was appointed as Non-Executive Independent Director of the Company w.e.f. September 7, 2018.
Directors resigned during the year During the year under review, Mr. Bipin Shah (DIN 00006094) resigned w.e.f April 24, 2018. The Company places on record its
appreciation and gratitude for the valuable contributions made by him during his tenure as member of the Board.
Board Evaluation A formal evaluation of the performance of the Board, its Committees, the Chairman and the individual Directors was carried out
for the year 2018 - 19. The evaluation was done using individual questionnaires, covering various aspect of performance, including composition, relationship among Directors, director competency, contribution to risk management compliance roles and responsibilities, board procedures, processes, functioning and effectiveness.
As part of the evaluation process, the performance of non-independent Directors, the Chairman and the Board was done by the independent Directors. The performance evaluation of the respective Committees and that of independent and non-independent Directors was done by the Board, excluding the Director being evaluated. Based on the Board evaluation summary, the Directors were satisfied with the results of the performance evaluation of the Board and its Committees, the Chairman and the individual Directors.
Key Managerial Personnel (KMPs) In terms of the provisions of Section 203 of the Companies Act, 2013, read with Rule 8 of the Companies (Appointment of Remuneration
of Managerial Personnel) Rules, 2014, Mr. Nilesh Shah – Managing Director, Mr. Krishnan Ramchandran – Chief Financial Officer (CFO) and Ms. Jolly Bhatt – Company Secretary, are the Key Managerial Personnel of the Company.
Appointment and Remuneration Policy for Directors and Key Managerial Personnel The Nomination and Remuneration Committee of the Board of Directors has formulated criteria for appointment of Key Managerial
Personnel and Senior Management personnel and all other employees. Based on the criteria set, it recommends to the Board the appointment of Key Managerial Personnel and Senior Management personnel. The Committee considers the qualifications, positive attributes as per the suitability of the role and independent status as may be required of the nominee before such appointment.
The Board has adopted a Remuneration Policy for Managerial Personnel and Senior Management personnel and all other employees. The policy is in line with the Compensation Policy of Kotak Mahindra Bank Ltd., the holding company, which is based on the Guidelines issued by the Reserve Bank of India. The salient features of the Remuneration Policy are as follows:
• Objectiveistomaintainfair,consistentandequitablecompensationpracticesinalignmentwithKotak’scorevaluesandstrategicbusiness goals.
• ApplicabletoallemployeesoftheCompany.Employeesclassifiedinto3groups:
o Key Managerial Personnel
o Senior Management i.e. (personnel of the Company who are members of its core management team, excluding the Board of Directors, comprising all members of management one level below the executive directors, including the functional heads)
8 Annual Report 2018-19
o All other employees
• CompensationstructureisbroadlydividedintoFixed,VariableandESOPs
o Fixed Pay – Total cost to the Company i.e. Salary, Retrials and Other Benefits
o VariablePay–LinkedtoassessmentofperformanceandpotentialbasedonBalancedKeyResultAreas(KRAs),StandardsofPerformance and achievement of targets with overall linkage to Bank budgets and business objectives. The main form of incentive compensation includes – Cash, Deferred Cash/Incentive Plan and Stock Appreciation Rights.
o Stock Appreciation Rights (SARs) : These are structured, variable incentives, linked to Kotak Mahindra Bank Stock price, payable over a period of time.
o ESOPs– Employee Stock Options (ESOP) of Kotak Mahindra Bank Ltd. granted on a discretionary basis to employees based on their performance and potential with the objective of retaining the employee.
• CompensationComposition–TheratioofVariablePaytoFixedPayandtheratioofCashv/sNon-CashwithinVariablepayoutlinedfor each category of employee classification.
• AnyvariationinthePolicytobewithapprovaloftheNomination&RemunerationCommittee.
• ClawbackclausesapplicableonDeferredVariablePay.
• ThecriteriaforpaymentofcommissiontoIndependentDirectorshavebeenincludedintheRemunerationPolicy.
Approval of the shareholders for payment of profit based commission to Independent Directors and Non-Executive Director (i.e. directors who are not in employment of Kotak Bank or its subsidiaries) of the Company for FY-19 is being sought at the ensuing Annual General Meeting of the Company.
Remuneration to KMPs is as per the terms of their employment.
8. NUMBER OF BOARD MEETINGS Board Meetings
During the year ended 31st March 2019, 8 meetings of the Board of Directors were held.
Declaration from Independent Directors
The Board has received declarations from all the Independent Directors as per the requirement of Section 149(7) of the Companies Act, 2013 and the Board is satisfied that all the Independent Directors meet the criteria of independence as mentioned in Section 149(6) of the Act.
9. COMMITTEES
(A) AUDIT COMMITTEE In terms of the requirement of Section 177 of Companies Act, 2013, the Audit Committee presently consists of Mr. Sukant Kelkar
– Chairman, Mr. C. Jayaram and Mr. Nalin Shah with any two members forming the quorum.
During the year ended 31st March, 2019, 7 meetings of the Committee were held. There was no case where recommendation of the Audit Committee was not accepted by the Board of Directors.
(B) NOMINATION AND REMUNERATION COMMITTEE In terms of the requirement of Section 178 of the Companies Act, 2013, the Nomination and Remuneration Committee presently
consists of Mr. Sukant Kelkar – Chairman, Mr. Sanjiv Malhotra, Mr. C. Jayaram and Mr. Gaurang Shah, with any two members forming the quorum.
During the year ended 31st March, 2019, 2 meetings of the Committee were held.
(C) CSR COMMITTEE In terms of the requirement of Section 135 of the Companies Act, 2013, the CSR Committee presently consists of Mr. Sukant
Kelkar – Chairman, Mr. C. Jayaram and Mr. Gaurang Shah, with any two members forming the quorum.
During the year ended 31st March, 2019, 2 meetings of the Committee were held.
9
Financial HighlightsBank Reports and
StatementsConsolidated Financial
StatementsDirectors Report
Courage of Conviction.Constancy of Change.
9. AUDITORS
Statutory Auditors In terms of Section 139 of the Companies Act, 2013, M/s. S.R. Batliboi & Co. LLP, Chartered Accountants, were appointed as the
Statutory Auditors of your Company for a period of five years from the conclusion of the Annual General Meeting of FY 14-15 until the conclusion of the Annual General Meeting of FY 19-20 of the Company, subject to ratification by the members every year. However, pursuant to Section 40 of the Companies (Amendment) Act, 2017 (i.e. Section 139 of the Companies Act, 2013) which was notified with effect from 7th May, 2018, ratification of the appointment of the Statutory Auditors by the members at every Annual General Meeting is no longer required. Accordingly, ratification resolution is not being taken up at the ensuing Annual General Meeting.
TheStatutoryAuditors’reportdoesnotcontainanyqualifications,reservationsoradverseremarks.
Further, no frauds have been reported by the Auditors under Section 143(12) of the Companies Act, 2013.
Secretarial Auditors Pursuant to Section 204 of the Companies Act, 2013, The Company has appointed Ms. Rupal D. Jhaveri, a Company Secretary in
Practice, as its Secretarial Auditor. The Secretarial Audit Report for the year ended March 31, 2019 is annexed to this Report.
TheSecretarialAuditor’sreportdoesnotcontainanyqualifications,reservationsoradverseremark.
INTERNAL FINANCIAL CONTROLS The Board of Directors confirms that there are internal financial controls with reference to Financial Statements in place and that such
controls are operating effectively. During the year under review, no material or serious observation has been observed for inefficiency or inadequacy of such controls.
10. RELATED PARTY TRANSACTIONS AllRelatedPartyTransactionsthatwereenteredintoduringthefinancialyearwereonarm’slengthbasisandwereintheordinarycourse
of business.
Pursuant to Section 134(3) (h) of the Companies Act, 2013, read with Rule 8(2) of the Companies (Accounts) Rules, 2014, there are no transactions to be reported under Section 188(1) of the Companies Act, 2013 in form AOC-2.
All Related Party Transactions as required under Accounting Standard 18 are reported in Notes to the Financial Statements.
11. PARTICULARS OF LOANS, GUARANTEES OR INVESTMENTS During the year, the Company has not given any loans, guarantees or made investments which attract the provisions of Section 186 of
the Companies Act, 2013.
12. WHISTLE BLOWER POLICY The Company has also put in place a Whistle Blower Policy to raise concerns internally and to disclose information which the individual
believes shows malpractice, serious irregularities, fraud, unethical business conduct, abuse or wrong doing or violation of any law. There was no reference made under the policy during the year.
13. CORPORATE SOCIAL RESPONSIBILITY YourCompany’sCSRCommitteedrivestheCSRprogrameoftheCompany.YourCompanyhasaBoardapprovedCSRpolicy,charting
outitsCSRapproach.ThispolicyarticulatestheCompany’saimtopositivelycontributetowardseconomic,environmentalandsocialwell-being of communities through its CSR interventions. The core CSR focus areas outlined are:
• Education
• Vocationalskillsandlivelihood
• Preventivehealthcareandsanitation
• Reducinginequalitiesfacedbysociallyandeconomicallybackwardgroups
• Sustainabledevelopment
• Reliefandrehabilitation

10 Annual Report 2018-19
• CleanIndia
• Sports
TheCompany’sCSRPolicyisavailableontheCompany’swebsite:assetmanagement.kotak.com
PursuanttotheprovisionsofSection135,ScheduleVIIoftheCompaniesAct,2013(theAct),readwiththeCompanies(CorporateSocialResponsibility) Rules, 2014 the report of the expenditure on CSR by the Company is as under:
The average net profit U/S 198 of the Company for the last three financial years preceding 31st March, 2019 is `82.16 cr.
The prescribed CSR expenditure required U/S 135, of the Act for FY 2018-19 is `164.00 Lakhs.
The CSR expenditure incurred from 1st April, 2018 to 31st March, 2019 U/S 135 of the Companies Act, 2013 amounts to `71.00 Lakhs as against `20.00 Lakhs incurred in FY 2017-18. The unspent amount CSR Expenditure amount for FY 2018-19 is `93Lakhs.
CSR expenditure of `71.00 lakh as a percentage of average net profit U/S 198 of the Company at `82.16cr is 0.86 %.
TheCompany’sbudgetinCSRfocussedsectorsandprogramsareapprovedbytheBoardCSRCommitteeandtheBoard.TheCompany’sCSR budget is guided by the vision of creating long-term benefits for the society. The Company has been building its CSR capabilities on a sustainable basis and is committed to gradually increasing its CSR spending in the coming year for its long-term projects. The Company identifies suitable NGO partners for carrying out its CSR programs. It undertakes CSR programs that are scalable, sustainable and have the potential to be replicated across locations and create a sustainable and measurable impact in communities.
Most of the CSR programs undertaken are in the area of education, healthcare, livelihood, vocational skill development, sports and other areassuchasreliefandrehabilitationandenvironmentalsustainabilityetc.TheCompany’sCSRfootprinthasbeenconsistentlyincreasingover the years. The Company is committed to stepping-up its CSR programs and expenditure in the years ahead.
TheCompany’sCSRExpenditureinFY2018-19of`71.00 Lakhs, which is over 255% higher than the previous financial year. In FY 2016-17,theCompany’sCSRExpenditurewas`10.00 Lakhs, which increased to `20.00 Lakhs in FY 2017-18 – an increase of 100% over the previous financial year.
OneofthereasonsfortheCompanyCSRExpenditure’sunderspendistheNGO’sinabilitytoutilizelargeCSRExpenditureallocatedundertheCompany’sCSRprograms.
Your Company does not consider “administrative overheads” as part of its CSR Expenditure.
The details of CSR programs and Expenditure U/S 135 of the Companies Act, 2013, for FY 2018-19, are annexed to this report.
14. RISK MANAGEMENT SEBI circular MFID/CIR/15/19133/2002 dated September 30, 2002 governs Mutual Funds on Risk Management. The said circular details
guidelines in the areas of Fund Management, Operations, Customer Service, Marketing and Distribution and other business risks. These practices are being audited by the Internal Auditors and the audit report on risk management is presented to the Boards of the Company and Kotak Mahindra Trustee Company Limited, every six months. Over and above this, SEBI has mandated a system audit for mutual funds to be conducted once every two years, by an independent auditor. The same has been implemented by the Company.
Risk Management function is operational at two levels. The first level is an integral part of the concerned functions like Fund Management, Information Technology, Operations and Treasury; while the internal operational and regulatory functions like the investment positions are managed at the floor level.
The risks in Fund Management are managed by the Investment Committee which is appointed by the Board and is responsible for monitoring the credit and interest rate risks, whereas, the Risk Management Committee oversees the operational risk function.
The Company has robust risk management policy and practices in all the above related areas of functioning to check the adequacy of the risk management systems.
The Company has in place, Cyber Security and Cyber Resilience framework in accordance with SEBI circular SEBI/HO/IMD/DF2/CIR/P/2019/12 dated 10th January 2019.
11
Financial HighlightsBank Reports and
StatementsConsolidated Financial
StatementsDirectors Report
Courage of Conviction.Constancy of Change.
Liquidity Management The RBI in its Circular No. DBOD.BP.NO.56/21.04.098/2012-13 dated November 7, 2012 had stipulated that Banks need to put in place
a framework for monitoring institution-wide liquidity risk and for overseeing operating subsidiaries and foreign branches. Further, the RBI, in its Annual Financial Inspection Report has directed the Bank to implement a Group wide Liquidity Risk management framework.
Based on the above, Kotak Mahindra Bank Ltd. and its group companies have adopted a Liquidity Risk Management Policy. The Board of Directors has adopted Liquidity Risk Management Policy which is line with the Kotak Bank Policy.
TheCompanyinvestsitssurplusfundsintheLiquidSchemesoftheKotakMahindraMutualFund.TheCompany’ssurplusfundswereinvested by the authorized personnel of the Company as per the mandate of the Board of Directors. The Company also has Manual of Policies and Procedures for expenditure management (including capital and revenue). All expenses during the year were in accordance with the policy. Additionally, the Company has invested in the growth option of all its open ended schemes in accordance with the guidelines as specified under SEBI (Mutual Fund) Regulations, 1996.
15. EMPLOYEES The employee strength of your Company was 434 as of March 31, 2019.
As required by the Sexual Harassment of Women at Workplace (Prevention, Prohibition & Redressal) Act, 2013, the Company has formulated a Policy on Sexual Harassment of Women at Workplace (Prevention, Prohibition & Redressal). No such instance was reported during the year.
The Company has complied with provisions relating to the constitution of Internal Complaints Committee under the Sexual Harassment of Women at Workplace (Prevention, Prohibition and Redressal) Act, 2013.
In accordance with the provisions of Rule 5 (2) of the Companies (Appointment and Remuneration of Managerial Personnel) Rules, 2014, thenamesandotherparticularsofemployeesaresetoutintheAnnexuretotheBoard’sReport.IntermsoftheprovisotoSection136(1)oftheCompaniesAct,2013,theBoard’sReportisbeingsentexcludingtheaforesaidannexure.TheAnnexureisavailableforinspectionat the Registered Office of the Company during the business hours on working days.
16. DEPOSITS The Company neither invited nor accepted any deposit from the public falling within the ambit of Section 73 of the Companies Act,
2013 and The Companies (Acceptance of Deposits) Rules, 2014 during the year. Also, there are no deposits due and outstanding as on 31st March, 2019.
17. CONSERVATION OF ENERGY, TECHNOLOGICAL ABSORPTION AND FOREIGN EXCHANGE EARNINGS AND OUTGO
Since, the Company does not undertake any manufacturing facility, the provisions pertaining to Section 134(3) (m) of the Companies Act, 2013 regarding conservation of energy and technological absorption are not applicable to the Company.
DuringtheyearendedMarch31,2019theCompany’sforeignexchangeincomewas`4.58cr (Previous year `3.24cr), while the outgo was `0.66cr (Previous year `1.78cr)
18. MATERIAL CHANGES AND COMMITMENTS, IF ANY, AFFECTING THE FINANCIAL POSITION OF THE COMPANY As per 134(3) (l) of the Companies Act, 2013, there have been no material changes and commitments affecting the financial position of
the Company which have occurred between the end of the financial year of the Company to which the financial statements relate and the date of the report.
19. SIGNIFICANT AND MATERIAL ORDERS PASSED BY THE REGULATORS/COURTS/TRIBUNAL There have been no orders passed by the Regulators / Courts/Tribunal, which would impact the going concern status of your Company
and its future operations, during the financial year.
20. DIRECTORS’ RESPONSIBILITY STATEMENT The Directors, based on the representations received from the Management, confirm in pursuance of Section 134(5) of the Companies
Act, 2013, that:
i. The Company has, in the preparation of the annual financial statements for the financial year ended March 31, 2019, followed the applicable accounting standards along with proper explanations relating to material departures, if any;

12 Annual Report 2018-19
ii. The Directors had selected such accounting policies and applied them consistently and made judgments and estimates that are reasonable and prudent so as to give a true and fair view of the state of affairs of the Company as at 31st March, 2019 and of the Profit of the Company for the year ended March 31, 2019;
iii. The Directors had taken proper and sufficient care to the best of their knowledge and ability, for the maintenance of adequate accounting records in accordance with the provisions of the Act for safeguarding the assets of the Company and for preventing and detecting fraud and other irregularities;
iv. The Directors had prepared the annual financial statements on a going concern basis; and
v. The Directors had devised proper systems to ensure compliance with the provisions of all applicable laws and that such systems are adequate and operating effectively.
21. SECRETARIAL STANDARDS TheCompanycomplieswiththeapplicableSecretarialStandardsissuedbythe‘InstituteofCompanySecretariesofIndia’.
22. CHANGE IN THE NATURE OF BUSINESS The Company has not undergone any changes in the nature of the business during the Financial Year.
ANNEXURES Followingstatements/documents/reportsaresetoutasAnnexurestotheDirectors’Report:
(a) Extract of Annual Return under Section 134(3)(a) of the Companies Act, 2013 read with Rule 12(1) of Companies (Management & Administration) Rules, 2014. (Annexure – A).
(b) Report on CSR activities pursuant to the provisions of Section 135(4)(a) of the Companies Act, 2013, read with Rule 9 of the Companies (Corporate Social Responsibility Policy) Rules, 2014 (Annexure – B).
(c) Secretarial Audit Report pursuant to Section 204 of the Companies Act, 2013(Annexure C).
ACKNOWLEDGEMENT The Board would like to place on record its gratitude for the valuable guidance received from the Government of India, the Securities
and Exchange Board of India, the Reserve Bank of India, the Association of Mutual Funds of India and other Government and Regulatory agencies, investors in the mutual fund schemes and to the shareholders for their continued support extended to the Company. The Board expresses its sincere appreciation to all the employees for the commendable teamwork, outstanding performance, enthusiastic contributionanddedicationoftheCompany’semployeesatalllevels.
The Directors also express their gratitude for the unstinted support and guidance received from Kotak Bank and other group companies.
For and on behalf of the Board of Directors
UDAY KOTAK CHAIRMAN
(DIN 00007467)
Mumbai Dated: June 12, 2019
13
Financial HighlightsBank Reports and
StatementsConsolidated Financial
StatementsDirectors Report
Courage of Conviction.Constancy of Change.
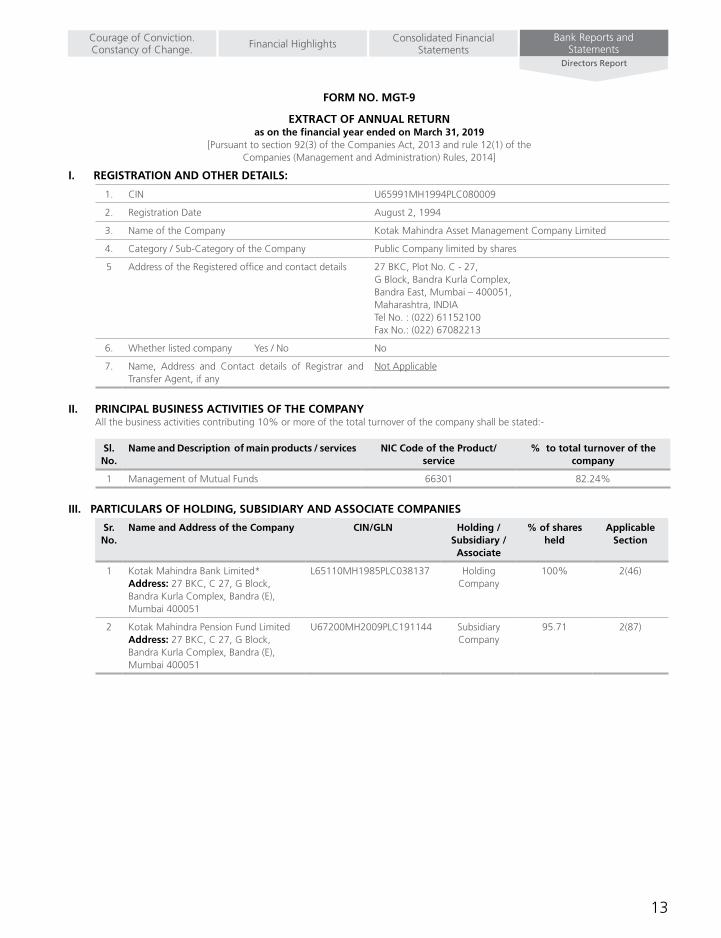
FORM NO. MGT-9
EXTRACT OF ANNUAL RETURNas on the financial year ended on March 31, 2019
[Pursuant to section 92(3) of the Companies Act, 2013 and rule 12(1) of the Companies (Management and Administration) Rules, 2014]
I. REGISTRATION AND OTHER DETAILS:
1. CIN U65991MH1994PLC080009
2. Registration Date August 2, 1994
3. Name of the Company Kotak Mahindra Asset Management Company Limited
4. Category / Sub-Category of the Company Public Company limited by shares
5 Address of the Registered office and contact details 27 BKC, Plot No. C - 27, G Block, Bandra Kurla Complex, Bandra East, Mumbai – 400051, Maharashtra, INDIA Tel No. : (022) 61152100 Fax No.: (022) 67082213
6. Whether listed company Yes / No No
7. Name, Address and Contact details of Registrar and Transfer Agent, if any
Not Applicable
II. PRINCIPAL BUSINESS ACTIVITIES OF THE COMPANY All the business activities contributing 10% or more of the total turnover of the company shall be stated:-
Sl. No.
Name and Description of main products / services NIC Code of the Product/ service
% to total turnover of the company
1 Management of Mutual Funds 66301 82.24%
III. PARTICULARS OF HOLDING, SUBSIDIARY AND ASSOCIATE COMPANIES
Sr. No.
Name and Address of the Company CIN/GLN Holding / Subsidiary /
Associate
% of shares held
Applicable Section
1 Kotak Mahindra Bank Limited* Address: 27 BKC, C 27, G Block, Bandra Kurla Complex, Bandra (E), Mumbai 400051
L65110MH1985PLC038137 Holding Company
100% 2(46)
2 Kotak Mahindra Pension Fund Limited Address: 27 BKC, C 27, G Block, Bandra Kurla Complex, Bandra (E), Mumbai 400051
U67200MH2009PLC191144 Subsidiary Company
95.71 2(87)

14 Annual Report 2018-19
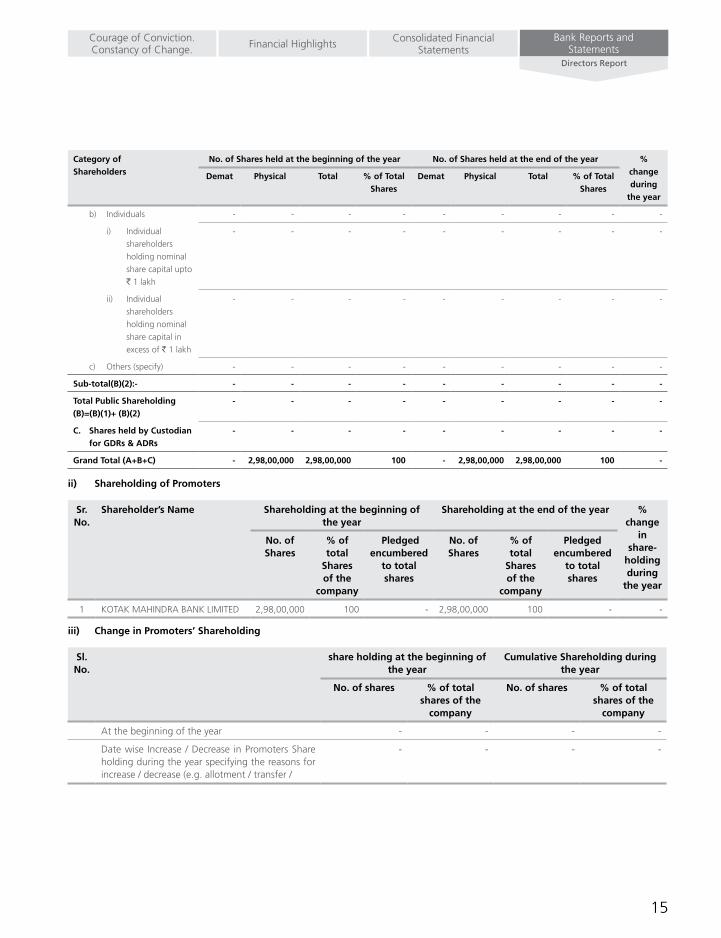
IV. SHARE HOLDING PATTERN (Equity share capital breakup as percentage of total equity)
i) Category-wise Share Holding
Kotak Mahindra Asset Management Company is 100 % subsidiary of Kotak Mahindra Bank Ltd.
Category of Shareholders
No. of Shares held at the beginning of the year No. of Shares held at the end of the year % change during
the year
Demat Physical Total % of Total Shares
Demat Physical Total % of Total Shares
A. Promoters
1) Indian
a) Individual / HUF - - - - - - - - -
b) Central Govt - - - - - - - - -
c) State Govt(s) - - - - - - - - -
d) Bodies Corp - - - - - - - -
e) Banks/FI* - 2,98,00,000 2,98,00,000 100 - 2,98,00,000 2,98,00,000 100 -
f) Any Other - - - - - - - - -
Sub total (A) (1) - 2,98,00,000 2,98,00,000 100 - 2,98,00,000 2,98,00,000 100 -
2) Foreign
a) NRIs - Individuals - - - - - - - - -
b) Other – Individuals - - - - - - - - -
c) Bodies Corp. - - - - - - - - -
d) Banks / FI - - - - - - - - -
e) Any Other…. - - - - - - - - -
Sub total (A) (2) - - - - - - - - -
Total shareholding of Promoter (A) = (A)(1)+(A)(2)
- 2,98,00,000 2,98,00,000 100 - 2,98,00,000 2,98,00,000 100 -
B. Public Shareholding
1. Institutions
a) Mutual Funds - - - - - - - - -
b) Banks / FI - - - - - - - - -
c) Central Govt - - - - - - - - -
d) State Govt(s) - - - - - - - - -
e) VentureCapitalFunds - - - - - - - - -
f) Insurance Companies - - - - - - - - -
g) FIIs - - - - - - - - -
h) ForeignVentureCapital
Funds
- - - - - - - - -
i) others - - - - - - - - -
Sub-total (B)(1):- - - - - - - - - -
2. Non-Institutions
a) Bodies Corp.
i) Indian - - - - - - - - -
ii) Overseas - - - - - - - - -
15
Financial HighlightsBank Reports and
StatementsConsolidated Financial
StatementsDirectors Report
Courage of Conviction.Constancy of Change.
Category of Shareholders
No. of Shares held at the beginning of the year No. of Shares held at the end of the year % change during
the year
Demat Physical Total % of Total Shares
Demat Physical Total % of Total Shares
b) Individuals - - - - - - - - -
i) Individual
shareholders
holding nominal
share capital upto
` 1 lakh
- - - - - - - - -
ii) Individual
shareholders
holding nominal
share capital in
excess of ` 1 lakh
- - - - - - - - -
c) Others (specify) - - - - - - - - -
Sub-total(B)(2):- - - - - - - - - -
Total Public Shareholding (B)=(B)(1)+ (B)(2)
- - - - - - - - -
C. Shares held by Custodian for GDRs & ADRs
- - - - - - - - -
Grand Total (A+B+C) - 2,98,00,000 2,98,00,000 100 - 2,98,00,000 2,98,00,000 100 -
ii) Shareholding of Promoters
Sr. No.
Shareholder’s Name Shareholding at the beginning of the year
Shareholding at the end of the year % change
in share-
holding during
the year
No. of Shares
% of total
Shares of the
company
Pledged encumbered
to total shares
No. of Shares
% of total
Shares of the
company
Pledged encumbered
to total shares
1 KOTAK MAHINDRA BANK LIMITED 2,98,00,000 100 - 2,98,00,000 100 - -
iii) Change in Promoters’ Shareholding
Sl. No.
share holding at the beginning of the year
Cumulative Shareholding during the year
No. of shares % of total shares of the
company
No. of shares % of total shares of the
company
At the beginning of the year - - - -
Date wise Increase / Decrease in Promoters Share holding during the year specifying the reasons for increase / decrease (e.g. allotment / transfer /
- - - -
16 Annual Report 2018-19
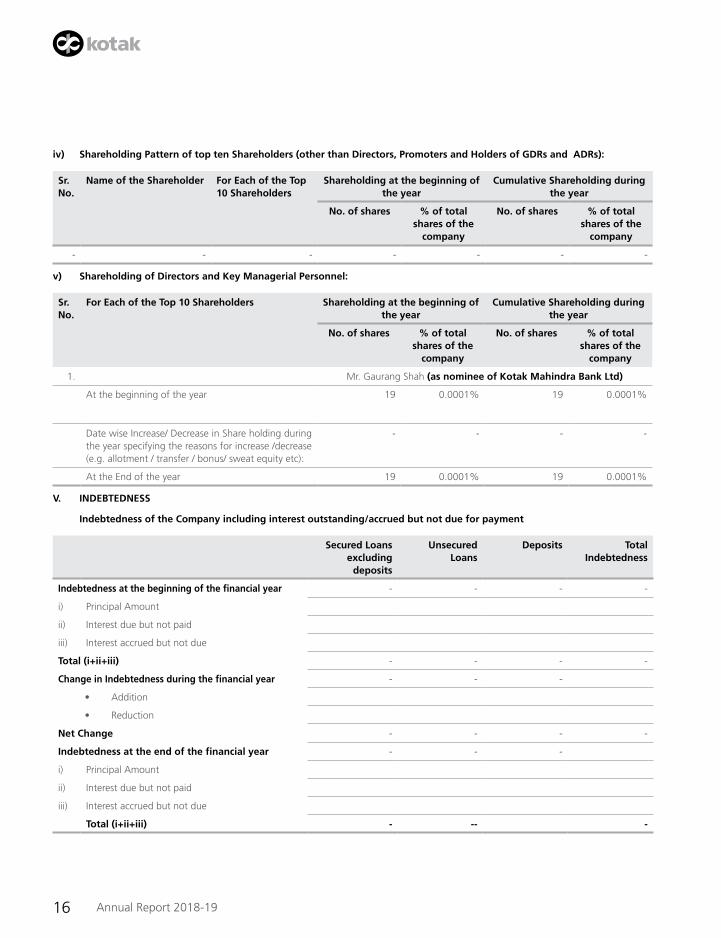
iv) Shareholding Pattern of top ten Shareholders (other than Directors, Promoters and Holders of GDRs and ADRs):
Sr. No.
Name of the Shareholder For Each of the Top 10 Shareholders
Shareholding at the beginning of the year
Cumulative Shareholding during the year
No. of shares % of total shares of the
company
No. of shares % of total shares of the
company
- - - - - - -
v) Shareholding of Directors and Key Managerial Personnel:
Sr. No.
For Each of the Top 10 Shareholders Shareholding at the beginning of the year
Cumulative Shareholding during the year
No. of shares % of total shares of the
company
No. of shares % of total shares of the
company
1. Mr. Gaurang Shah (as nominee of Kotak Mahindra Bank Ltd)
At the beginning of the year 19 0.0001% 19 0.0001%
Date wise Increase/ Decrease in Share holding during the year specifying the reasons for increase /decrease (e.g. allotment / transfer / bonus/ sweat equity etc):
- - - -
At the End of the year 19 0.0001% 19 0.0001%
V. INDEBTEDNESS
Indebtedness of the Company including interest outstanding/accrued but not due for payment
Secured Loans excluding
deposits
Unsecured Loans
Deposits Total Indebtedness
Indebtedness at the beginning of the financial year - - - -
i) Principal Amount
ii) Interest due but not paid
iii) Interest accrued but not due
Total (i+ii+iii) - - - -
Change in Indebtedness during the financial year - - -
• Addition
• Reduction
Net Change - - - -
Indebtedness at the end of the financial year - - -
i) Principal Amount
ii) Interest due but not paid
iii) Interest accrued but not due
Total (i+ii+iii) - -- -
17
Financial HighlightsBank Reports and
StatementsConsolidated Financial
StatementsDirectors Report
Courage of Conviction.Constancy of Change.
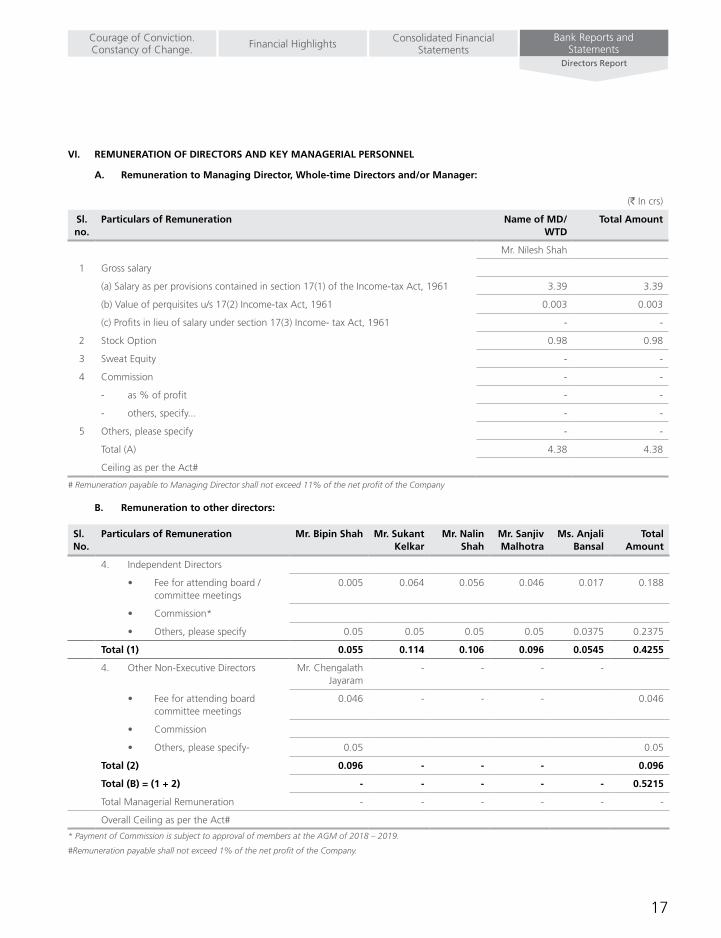
VI. REMUNERATION OF DIRECTORS AND KEY MANAGERIAL PERSONNEL
A. Remuneration to Managing Director, Whole-time Directors and/or Manager:
(` In crs)
Sl. no.
Particulars of Remuneration Name of MD/WTD
Total Amount
Mr. Nilesh Shah
1 Gross salary
(a) Salary as per provisions contained in section 17(1) of the Income-tax Act, 1961 3.39 3.39
(b)Valueofperquisitesu/s17(2)Income-taxAct,1961 0.003 0.003
(c) Profits in lieu of salary under section 17(3) Income- tax Act, 1961 - -
2 Stock Option 0.98 0.98
3 Sweat Equity - -
4 Commission - -
- as % of profit - -
- others, specify... - -
5 Others, please specify - -
Total (A) 4.38 4.38
Ceiling as per the Act#
# Remuneration payable to Managing Director shall not exceed 11% of the net profit of the Company
B. Remuneration to other directors:
Sl. No.
Particulars of Remuneration Mr. Bipin Shah Mr. Sukant Kelkar
Mr. Nalin Shah
Mr. Sanjiv Malhotra
Ms. Anjali Bansal
Total Amount
4. Independent Directors
• Feeforattendingboard/committee meetings
0.005 0.064 0.056 0.046 0.017 0.188
• Commission*
• Others,pleasespecify 0.05 0.05 0.05 0.05 0.0375 0.2375
Total (1) 0.055 0.114 0.106 0.096 0.0545 0.4255
4. Other Non-Executive Directors Mr. Chengalath Jayaram
- - - -
• Feeforattendingboardcommittee meetings
0.046 - - - 0.046
• Commission
• Others,pleasespecify- 0.05 0.05
Total (2) 0.096 - - - 0.096
Total (B) = (1 + 2) - - - - - 0.5215
Total Managerial Remuneration - - - - - -
Overall Ceiling as per the Act#
* Payment of Commission is subject to approval of members at the AGM of 2018 – 2019.
#Remuneration payable shall not exceed 1% of the net profit of the Company.
18 Annual Report 2018-19
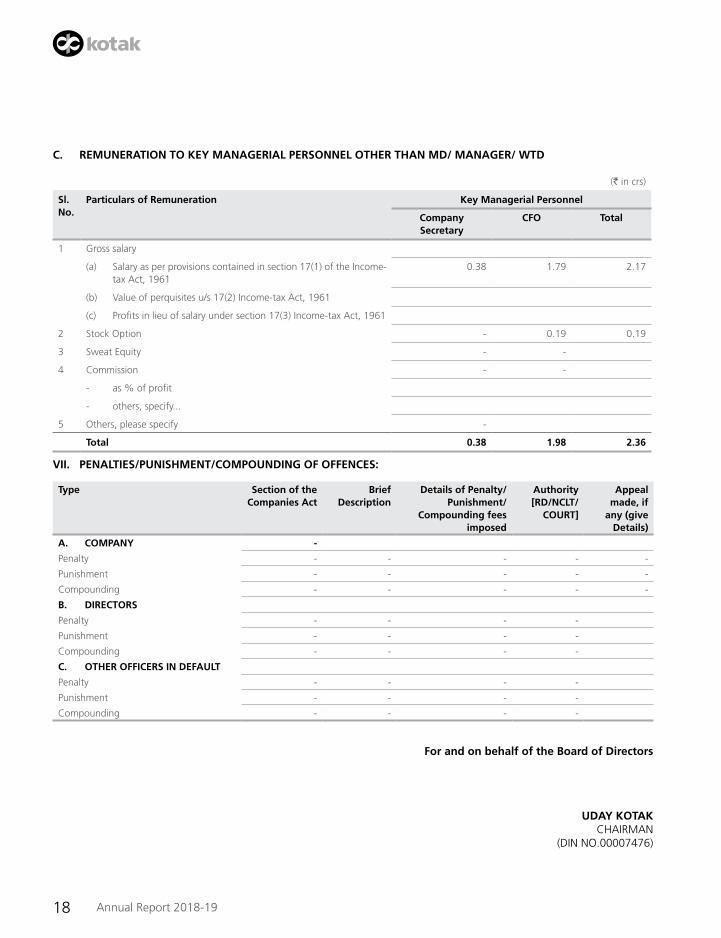
C. REMUNERATION TO KEY MANAGERIAL PERSONNEL OTHER THAN MD/ MANAGER/ WTD
(` in crs)
Sl. No.
Particulars of Remuneration Key Managerial Personnel
Company Secretary
CFO Total
1 Gross salary
(a) Salary as per provisions contained in section 17(1) of the Income-tax Act, 1961
0.38 1.79 2.17
(b) Valueofperquisitesu/s17(2)Income-taxAct,1961
(c) Profits in lieu of salary under section 17(3) Income-tax Act, 1961
2 Stock Option - 0.19 0.19
3 Sweat Equity - -
4 Commission - -
- as % of profit
- others, specify...
5 Others, please specify -
Total 0.38 1.98 2.36
VII. PENALTIES/PUNISHMENT/COMPOUNDING OF OFFENCES:
Type Section of the Companies Act
Brief Description
Details of Penalty/ Punishment/
Compounding fees imposed
Authority [RD/NCLT/
COURT]
Appeal made, if
any (give Details)
A. COMPANY -
Penalty - - - - -
Punishment - - - - -
Compounding - - - - -
B. DIRECTORS
Penalty - - - -
Punishment - - - -
Compounding - - - -
C. OTHER OFFICERS IN DEFAULT
Penalty - - - -
Punishment - - - -
Compounding - - - -
For and on behalf of the Board of Directors
UDAY KOTAK CHAIRMAN
(DIN NO.00007476)
19
Financial HighlightsBank Reports and
StatementsConsolidated Financial
StatementsDirectors Report
Courage of Conviction.Constancy of Change.
FORM MR-3
SECRETARIAL AUDIT REPORTFOR THE FINANCIAL YEAR ENDED 31sT MARCH 2019
[Pursuant to section 204(1) of the Companies Act, 2013 and Rule 9 of the Companies (Appointment and Remuneration of Managerial Personnel) Rules, 2014]
To,The Members, KOTAK MAHINDRA ASSET MANAGEMENT COMPANY LIMITED
I have conducted the secretarial audit of the compliance of applicable statutory provisions and the adherence to good corporate practices by Kotak Mahindra Asset Management Company Limited (hereinafter called the “Company”). Secretarial Audit was conducted in a manner that provided me a reasonable basis for evaluating the corporate conducts/statutory compliances and expressing my opinion thereon.
BasedonmyverificationoftheCompany’sbooks,papers,minutebooks,formsandreturnsfiledandotherrecordsmaintainedbythecompanyand also the information provided by the Company, its officers, agents and authorized representatives during the conduct of secretarial audit, I hereby report that in my opinion, the company has, during the audit period covering the financial year ended on 3 Ist March 2019 (‘Audit period’) compliedwith the statutory provisions listedhereunder and also that theCompanyhasproper Board-processes and compliancemechanism in place to the extent, in the manner and subject to the reporting made hereinafter.
I have examined the books, papers, minute books, forms and returns filed and other records maintained by the Company for the financial year ended on 31st March 2019, according to the provisions of:
1. The Companies Act, 2013 (the Act) and the rules made there under;
2. TheSecuritiesContracts(Regulation)Act,1956(‘SCRA’)andtherulesmadethereunder;
3. The Depositories Act, 1996 and the Regulations and Bye- Laws framed there under;
4. ForeignExchangeManagementAct,1999(‘FEMA’)andtheRulesandRegulationsmadethereundertotheextentofForeignDirectInvestment, overseas Direct Investment and External Commercial Borrowings (Not Applicable);
5. The laws prescribed under Securities and Exchange Board of India Act, 1992 to the extent applicable:-
a) The Securities and Exchange Board of India (Substantial Acquisition of Shares and Takeovers) Regulations, 2011;
b) The Securities and Exchange Board oflndia (Prohibition oflnsider Trading) Regulations, 20 15;
c) The Securities and Exchange Board of India (Issue of Capital and Disclosure Requirements) Regulations, 2009. (Not Applicable);
d) The Securities and Exchange Board oflndia (Share Based Employee Benefits) Regulations, 20 14;
e) The Securities and Exchange Board of India (Issue and Listing of Debt Securities) Regulations, 2008 (Not Applicable);
f) The Securities and Exchange Board of India (Registrar to an Issue and Share Transfer Agents) Regulations, 1993 regarding Companies Act and dealing with client;
g) The Securities and Exchange Board oflndia (Delisting of Equity Shares) Regulations, 2009 (Not Applicable);
h) The Securities and Exchange Board of India (Buyback of Securities) Regulations, 1998 and The Securities and Exchange Board of India (Buy-back of Securities) Regulations, 2018; (Not Applicable) and;
i) The Securities and Exchange Board of India (Listing Obligations and Disclosure Requirements) Regulations, 2015 (Not Applicable);
6. The Company being an Asset Management Company, the acts, laws and regulations specifically applicable to the Company are given below:
a) The Securities and Exchange Board oflndia (Mutual funds) Regulations, 1996 as amended;
b) The Securities and Exchange Board of India (Portfolio Managers) Regulations, 1993;
The Company has its own robust compliance system and the Company is also subject to monitoring by and reporting of compliances to SEBI.
7. Other laws to the extent applicable to the Company as per the representations made by the Company;
I have also examined compliance with the applicable clauses of the following:
Secretarial Standards issued pursuant to section 118(10) of the Act by The Institute of Company Secretaries of India.
During the period under review the Company has generally complied with the above mentioned Secretarial Standards issued by The Institute of Company Secretaries of India.

20 Annual Report 2018-19
During the period under review the Company has complied with the provisions of the Act, Rules, Regulations, Guidelines, etc. mentioned above.
I further report that
The Board of Directors of the Company is duly constituted with proper balance of Executive Directors, Non- Executive Directors and Independent Directors. The changes in the composition of the Board of Directors that took place during the period under review were carried out in compliance with the provisions of the Act.
Adequate notice is given to all directors to schedule the Board Meetings, agenda and detailed notes on agenda were sent atleast seven days in advance except for the meetings which were held at a shorter notice to transact urgent business and a system exists for seeking and obtaining further information and clarifications on the agenda items before the meeting and for meaningful participation at the meeting.
Majoritydecisioniscarriedthroughwhilethedissentingmembers’views,ifany,arecapturedandrecordedasapartoftheminutes.
I further report that there are adequate systems and processes in the company commensurate with the size and operations of the company to monitor and ensure compliance with applicable laws, rules, regulations and guidelines.
I further report that duringtheauditperiodinmyopinion,therearenospecificevents/actionshavingamajorbearingonthecompany’saffairs in pursuance of the above referred laws, rules, regulations, guidelines, standards, etc. referred to above.
Rupal Dhiren JhaveriPlace: Mumbai FCS No: 5441Date: 19th April 2019 Certificate of Practice No. 4225
Annexure A
To,
The Members
KOTAK MAHINDRA ASSET MANAGEMENT COMPANY LIMITED
My report of even date is to be read along with this letter.
‘Annexure A’
1. Maintenance of secretarial record is the responsibility of the management of the company.
My responsibility is to express an opinion on these secretarial records based on my audit.
2. I have followed the audit practices and processes as were appropriate to obtain reasonable assurance about the correctness of the contents of the Secretarial records. The verification was done on test basis to ensure that correct facts are reflected in secretarial records. Ibelieve that the processes and practices, Ifollowed provide a reasonable basis for my opinion.
3. I have not verified the correctness and appropriateness of financial records and Books of Accounts of the company.
4. Wherever required, I have obtained the Management representation about the compliance of laws, rules and regulations and happening of events etc.
5. The compliance of the provisions of Corporate and other applicable laws, rules, regulations, standards is the responsibility of management. My examination was limited to the verification of procedures on test basis.
6. The Secretarial Audit report is neither an assurance as to the future viability of the company nor of the efficacy or effectiveness with which the management has conducted the affairs of the company.
Rupal Dhiren JhaveriPlace: Mumbai FCS No: 5441Date: 19th April 2019 Certificate of Practice No. 4225

21
Financial HighlightsBank Reports and
StatementsConsolidated Financial
StatementsDirectors Report
Courage of Conviction.Constancy of Change.
Details of CSR activities and expenditure U/S 135 of The Companies Act, 2013
CSR project/ activity
identified
Sector in which the project is covered
Area of project implementation
(Name of the District / s, State / s
where project / programme was
undertaken
Programme / project
wise budgeted amount (` Lakh)
Programme / project wise actual spend during the
year – Direct expenditures
(` Lakh)
Programme / project wise actual spend
during the year – Overheads
(` Lakh)
Cumulative Expenditure
up to reporting period (Since FY 2014-15)
(` Lakh)
Amount spent Direct or through
implementing agency (` Lakh)
Promoting education
Education Mumbai - Maharashtra
30.00 21.12 4.02 67.00(Out of ` 30.00 Lakh, the NGO has not utilised
`4.86 Lakh. This will be used
towards meeting expenses for FY2019-20)
Implementing Agency - 30.00
Promoting livelihood
VocationalSkills and Livelihood
Ahmednagar - Maharashtra, Bhopal - Madhya Pradesh, Raipur -Chhattisgarh
41.00 15.07 0.17 41.00 (Out of ` 41.00 Lakh, the NGO has not utilised
`25.75 Lakh. This will be used towards meeting
expenses for FY2019-20)
Implementing Agency - 41.00
TOTAL CSR SPEND U/S 135 OF THE COMPANIES ACT, 2013, DURING FY 2018-19 71.00
Summary of CSR Programmes implemented in FY 2018-19
• KotakEducationFoundation(KEF)istheCompany’slong-termCSRpartnerandprimaryvehicletoimplementitsCSRProgrammesinEducation and Livelihood. Founded in 2006, KEF empowers young people from underprivileged families through various education- based initiatives and equips them with employable skills. KEF also organises various livelihood programmes for Below Poverty Line (BPL) families in the regions of Mumbai, Thane and Raigad.
Additionally, the Company has started implementing long term CSR Programmes that are sustainable and scalable.
• InFY2018-19,theCompanyimplementeditsCSRProgramme‘VocationalSkillsandLivelihood’,whichitisimplementinginpartnershipwith (and through) Pratham Education Foundation (Pratham). The expenditure will fund setting up entrepreneurship incubation centres for providing basic entrepreneurship skill training, mentorship support and linkages for setting up micro enterprises by the underprivileged youths from economically disadvantaged backgrounds. These centres are in Ahmednagar (Maharashtra), Bhopal (Madhya Pradesh), and Raipur(Chhattisgarh).TheCompany’sCSRinitiativeprovidesopportunitiestotheseyouthsfromeconomicallydisadvantagedsectionsofthe society with limited access to training and capital to succeed as an entrepreneur.
SUKANT KELKAR(DIN 00015883)CHAIRMAN OF CSR COMMITTEE
NILESH SHAH(DIN 01711720)MANAGING DIRECTOR
UDAY KOTAK(DIN 00007467)CHAIRMAN
22 Annual Report 2018-19
Independent Auditor’s ReportTo The Members of Kotak Mahindra Asset Management Company Limited
REPORT ON THE AUDIT OF THE STANDALONE IND AS FINANCIAL STATEMENTS
OPINIONWe have audited the accompanying standalone Ind AS financial statements of Kotak Mahindra Asset Management Company Limited (the ‘Company’),whichcomprise theBalancesheetasatMarch312019, theStatementofProfitandLoss, includingthestatementofOtherComprehensive Income, the Cash Flow Statement and the Statement of Changes in Equity for the year then ended, and notes to the financial statements, including, a summary of significant accounting policies and other explanatory information.
In our opinion and to the best of our information and according to the explanations given to us, the aforesaid standalone Ind AS financial statementsgivetheinformationrequiredbytheCompaniesAct,2013,asamended(the‘Act’)inthemannersorequiredandgiveatrueandfair view in conformity with the accounting principles generally accepted in India, of the state of affairs of the Company as at March 31, 2019, its profit including other comprehensive income its cash flows and the changes in equity for the year ended on that date.
BASIS FOR OPINIONWe conducted our audit of the standalone Ind AS financial statements in accordance with the Standards on Auditing (SAs), as specified under section143(10)oftheAct.OurresponsibilitiesunderthoseStandardsarefurtherdescribedinthe‘Auditor’sResponsibilitiesfortheAuditoftheStandaloneIndASFinancialStatements’sectionofourreport.WeareindependentoftheCompanyinaccordancewiththe‘CodeofEthics’issued by the Institute of Chartered Accountants of India together with the ethical requirements that are relevant to our audit of the financial statements under the provisions of the Act and the Rules thereunder, and we have fulfilled our other ethical responsibilities in accordance with these requirements and the Code of Ethics. We believe that the audit evidence we have obtained is sufficient and appropriate to provide a basis for our audit opinion on the standalone Ind AS financial statements.
INFORMATION OTHER THAN THE FINANCIAL STATEMENTS AND AUDITOR’S REPORT THEREONTheCompany’sBoardofDirectorsisresponsiblefortheotherinformation.TheotherinformationcomprisestheinformationincludedintheDirector’sreport,butdoesnotincludethestandaloneIndASfinancialstatementsandourauditor’sreportthereon.
Our opinion on the standalone Ind AS financial statements does not cover the other information and we do not express any form of assurance conclusion thereon.
In connection with our audit of the standalone Ind AS financial statements, our responsibility is to read the other information identified above and, in doing so, consider whether such other information is materially inconsistent with the standalone Ind AS financial statements or our knowledge obtained in the audit or otherwise appears to be materially misstated. If, based on the work we have performed, we conclude that there is a material misstatement of this other information, we are required to report that fact. We have nothing to report in this regard.
RESPONSIBILITY OF MANAGEMENT AND THOSE CHARGED WITH GOVERNANCE FOR THE STANDALONE IND AS FINANCIAL STATEMENTSThe Company’s Board of Directors is responsible for thematters stated in section 134(5) of the Actwith respect to the preparation ofthese standalone Ind AS financial statements that give a true and fair view of the financial position, financial performance including other comprehensive income, cash flows and changes in equity of the Company in accordance with the accounting principles generally accepted in India, including the Indian Accounting Standards (“Ind AS”) specified under section 133 of the Act read with the Companies (Indian Accounting Standards) Rules, 2015, as amended.
This responsibility also includes maintenance of adequate accounting records in accordance with the provisions of the Act for safeguarding of the assets of the Company and for preventing and detecting frauds and other irregularities; selection and application of appropriate accounting policies; making judgments and estimates that are reasonable and prudent; and the design, implementation and maintenance of adequate internal financial controls, that were operating effectively for ensuring the accuracy and completeness of the accounting records, relevant to the preparation and presentation of the standalone Ind AS financial statements that give a true and fair view and are free from material misstatement, whether due to fraud or error.
InpreparingthestandaloneIndASfinancialstatements,theBoardofDirectorsareresponsibleforassessingtheCompany’sabilitytocontinueas a going concern, disclosing, as applicable, matters related to going concern and using the going concern basis of accounting unless management either intends to liquidate the Company or to cease operations, or has no realistic alternative but to do so.
ThoseBoardofDirectorsarealsoresponsibleforoverseeingtheCompany’sfinancialreportingprocess.

23
Bank Reports and Statements
Consolidated Financial StatementsFinancial HighlightsCourage of Conviction.
Constancy of Change.Independent Auditors Report
AUDITOR’S RESPONSIBILITIES FOR THE AUDIT OF THE STANDALONE IND AS FINANCIAL STATEMENTSOur objectives are to obtain reasonable assurance about whether the standalone Ind AS financial statements as a whole are free from material misstatement,whetherduetofraudorerror,andtoissueanauditor’sreportthatincludesouropinion.Reasonableassuranceisahighlevelof assurance, but is not a guarantee that an audit conducted in accordance with SA will always detect a material misstatement when it exists. Misstatements can arise from fraud or error and are considered material if, individually or in the aggregate, they could reasonably be expected to influence the economic decisions of users taken on the basis of these standalone Ind AS financial statements.
As part of an audit in accordance with SAs, we exercise professional judgment and maintain professional skepticism throughout the audit. We also:
a) Identify and assess the risks of material misstatement of the standalone Ind AS financial statements, whether due to fraud or error, design and perform audit procedures responsive to those risks, and obtain audit evidence that is sufficient and appropriate to provide a basis for our opinion. The risk of not detecting a material misstatement resulting from fraud is higher than for one resulting from error, as fraud may involve collusion, forgery, intentional omissions, misrepresentations, or the override of internal control.
b) Obtain an understanding of internal control relevant to the audit in order to design audit procedures that are appropriate in the circumstances. Under section 143(3)(i) of the Act, we are also responsible for expressing our opinion on whether the Company has adequate internal financial controls system in place and the operating effectiveness of such controls.
c) Evaluate the appropriateness of accounting policies used and the reasonableness of accounting estimates and related disclosures made by management.
d) Concludeontheappropriatenessofmanagement’suseofthegoingconcernbasisofaccountingand,basedontheauditevidenceobtained,whetheramaterialuncertaintyexistsrelatedtoeventsorconditionsthatmaycastsignificantdoubtontheCompany’sabilitytocontinueasagoingconcern.Ifweconcludethatamaterialuncertaintyexists,wearerequiredtodrawattentioninourauditor’sreporttothe related disclosures in the financial statements or, if such disclosures are inadequate, to modify our opinion. Our conclusions are based ontheauditevidenceobtaineduptothedateofourauditor’sreport.However,futureeventsorconditionsmaycausetheCompanytocease to continue as a going concern.
e) Evaluate the overall presentation, structure and content of the standalone Ind AS financial statements, including the disclosures, and whether the standalone Ind AS financial statements represent the underlying transactions and events in a manner that achieves fair presentation.
We communicate with those charged with governance regarding, among other matters, the planned scope and timing of the audit and significant audit findings, including any significant deficiencies in internal control that we identify during our audit.
We also provide those charged with governance with a statement that we have complied with relevant ethical requirements regarding independence, and to communicate with them all relationships and other matters that may reasonably be thought to bear on our independence, and where applicable, related safeguards.
REPORT ON OTHER LEGAL AND REGULATORY REqUIREMENTS1. AsrequiredbytheCompanies(Auditor’sReport)Order,2016(“theOrder”),issuedbytheCentralGovernmentofIndiaintermsofsub-
section (11) of section 143 of the Act, we give in the “Annexure 1” a statement on the matters specified in paragraphs 3 and 4 of the Order.
2. As required by Section 143(3) of the Act, we report that:
(a) We have sought and obtained all the information and explanations which to the best of our knowledge and belief were necessary for the purposes of our audit;
(b) In our opinion, proper books of account as required by law have been kept by the Company so far as it appears from our examination of those books;
(c) The Balance Sheet, the Statement of Profit and Loss including the Statement of Other Comprehensive Income, the Cash Flow Statement and Statement of Changes in Equity dealt with by this Report are in agreement with the books of account;
(d) In our opinion, the aforesaid standalone Ind AS financial statements comply with the Accounting Standards specified under Section 133 of the Act, read with Companies Indian Accounting Standards Rules, 2015, as amended;
(e) On the basis of the written representations received from the directors as on March 31, 2019 taken on record by the Board of Directors, none of the directors is disqualified as on March 31, 2019 from being appointed as a director in terms of Section 164 (2) of the Act;
24 Annual Report 2018-19
(f) With respect to the adequacy of the internal financial controls over financial reporting of the Company with reference to these standalone Ind AS financial statements and the operating effectiveness of such controls, refer to our separate Report in “Annexure 2” to this report;
(g) According to the information and explanations given by the management, the managerial remuneration has been paid in accordancewiththerequisiteapprovalsmandatedbytheprovisionsofsection197readwithScheduleVtotheCompaniesAct,2013;
(h) WithrespecttotheothermatterstobeincludedintheAuditor’sReportinaccordancewithRule11oftheCompanies(AuditandAuditors) Rules, 2014, as amended in our opinion and to the best of our information and according to the explanations given to us:
i. The Company does not have any pending litigations which would impact its financial position – Refer Note 28(a) and Note 28(b) to the financial statements;
ii. The Company has made provision, as required under the applicable law or accounting standards, for material foreseeable losses, if any, on long-term contracts including derivative contracts; and
iii. There were no amounts which were required to be transferred to the Investor Education and Protection Fund by the Company.
For S.R. Batliboi & Co. LLPChartered AccountantsICAI Firm Registration Number: 301003E/E300005
per Viren H. MehtaPartnerMembership Number: 048749
Place: MumbaiDate: 12 June 2019
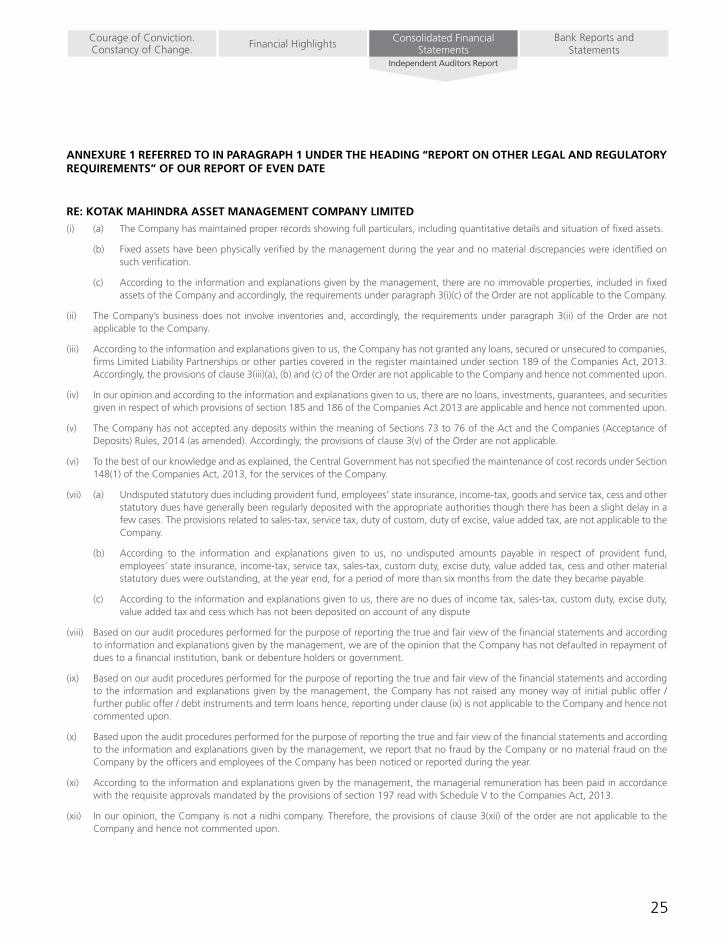
25
Bank Reports and Statements
Consolidated Financial StatementsFinancial HighlightsCourage of Conviction.
Constancy of Change.Independent Auditors Report
ANNEXURE 1 REFERRED TO IN PARAGRAPH 1 UNDER THE HEADING “REPORT ON OTHER LEGAL AND REGULATORY REqUIREMENTS” OF OUR REPORT OF EVEN DATE
RE: KOTAK MAHINDRA ASSET MANAGEMENT COMPANY LIMITED(i) (a) The Company has maintained proper records showing full particulars, including quantitative details and situation of fixed assets.
(b) Fixed assets have been physically verified by the management during the year and no material discrepancies were identified on such verification.
(c) According to the information and explanations given by the management, there are no immovable properties, included in fixed assets of the Company and accordingly, the requirements under paragraph 3(i)(c) of the Order are not applicable to the Company.
(ii) TheCompany’sbusinessdoesnot involve inventoriesand,accordingly, the requirementsunderparagraph3(ii)of theOrderarenotapplicable to the Company.
(iii) According to the information and explanations given to us, the Company has not granted any loans, secured or unsecured to companies, firms Limited Liability Partnerships or other parties covered in the register maintained under section 189 of the Companies Act, 2013. Accordingly, the provisions of clause 3(iii)(a), (b) and (c) of the Order are not applicable to the Company and hence not commented upon.
(iv) In our opinion and according to the information and explanations given to us, there are no loans, investments, guarantees, and securities given in respect of which provisions of section 185 and 186 of the Companies Act 2013 are applicable and hence not commented upon.
(v) The Company has not accepted any deposits within the meaning of Sections 73 to 76 of the Act and the Companies (Acceptance of Deposits) Rules, 2014 (as amended). Accordingly, the provisions of clause 3(v) of the Order are not applicable.
(vi) To the best of our knowledge and as explained, the Central Government has not specified the maintenance of cost records under Section 148(1) of the Companies Act, 2013, for the services of the Company.
(vii) (a) Undisputedstatutoryduesincludingprovidentfund,employees’stateinsurance,income-tax,goodsandservicetax,cessandotherstatutory dues have generally been regularly deposited with the appropriate authorities though there has been a slight delay in a few cases. The provisions related to sales-tax, service tax, duty of custom, duty of excise, value added tax, are not applicable to the Company.
(b) According to the information and explanations given to us, no undisputed amounts payable in respect of provident fund, employees’stateinsurance,income-tax,servicetax,sales-tax,customduty,exciseduty,valueaddedtax,cessandothermaterialstatutory dues were outstanding, at the year end, for a period of more than six months from the date they became payable.
(c) According to the information and explanations given to us, there are no dues of income tax, sales-tax, custom duty, excise duty, value added tax and cess which has not been deposited on account of any dispute
(viii) Based on our audit procedures performed for the purpose of reporting the true and fair view of the financial statements and according to information and explanations given by the management, we are of the opinion that the Company has not defaulted in repayment of dues to a financial institution, bank or debenture holders or government.
(ix) Based on our audit procedures performed for the purpose of reporting the true and fair view of the financial statements and according to the information and explanations given by the management, the Company has not raised any money way of initial public offer / further public offer / debt instruments and term loans hence, reporting under clause (ix) is not applicable to the Company and hence not commented upon.
(x) Based upon the audit procedures performed for the purpose of reporting the true and fair view of the financial statements and according to the information and explanations given by the management, we report that no fraud by the Company or no material fraud on the Company by the officers and employees of the Company has been noticed or reported during the year.
(xi) According to the information and explanations given by the management, the managerial remuneration has been paid in accordance withtherequisiteapprovalsmandatedbytheprovisionsofsection197readwithScheduleVtotheCompaniesAct,2013.
(xii) In our opinion, the Company is not a nidhi company. Therefore, the provisions of clause 3(xii) of the order are not applicable to the Company and hence not commented upon.

26 Annual Report 2018-19
(xiii) According to the information and explanations given by the management, transactions with the related parties are in compliance with section 177 and 188 of Companies Act, 2013 where applicable and the details have been disclosed in the notes to the financial statements, as required by the applicable accounting standards.
(xiv) According to the information and explanations given to us and on an overall examination of the balance sheet, the Company has not made any preferential allotment or private placement of shares or fully or partly convertible debentures during the year under review and hence, reporting requirements under clause 3(xiv) are not applicable to the Company and, not commented upon.
(xv) Based on our audit procedures performed for the purpose of reporting the true and fair view of the financial statements and according to the information and explanations given by the management, the Company has not entered into any non-cash transactions with directors or persons connected with him as referred to in section 192 of Companies Act, 2013.
(xvi) According to the information and explanations given to us, the provisions of section 45-IA of the Reserve Bank of India Act, 1934 are not applicable to the Company.
For S.R. Batliboi & Co. LLPChartered AccountantsICAI Firm Registration Number: 301003E/E300005
per Viren H. MehtaPartnerMembership Number: 048749
Place: MumbaiDate: 12 June 2019

27
Bank Reports and Statements
Consolidated Financial StatementsFinancial HighlightsCourage of Conviction.
Constancy of Change.Independent Auditors Report
ANNEXURE 2 TO THE INDEPENDENT AUDITOR’S REPORT OF EVEN DATE ON THE STANDALONE IND AS FINANCIAL STATEMENTS OF KOTAK MAHINDRA ASSET MANAGEMENT COMPANY LIMITED
REPORT ON THE INTERNAL FINANCIAL CONTROLS UNDER CLAUSE (I) OF SUB-SECTION 3 OF SECTION 143 OF THE COMPANIES ACT, 2013 (“THE ACT”)We have audited the internal financial controls over financial reporting of Kotak Mahindra Asset Management Company Limited (“the Company”) as of March 31, 2019 in conjunction with our audit of the standalone Ind AS financial statements of the Company for the year ended on that date.
MANAGEMENT’S RESPONSIBILITY FOR INTERNAL FINANCIAL CONTROLSThe Board of Directors are responsible for establishing and maintaining internal financial controls based on the internal control over financial reporting criteria established by the Company considering the essential components of internal control stated in the Guidance Note on Audit of Internal Financial Controls Over Financial Reporting issued by the Institute of Chartered Accountants of India. These responsibilities include the design, implementation and maintenance of adequate internal financial controls that were operating effectively for ensuring the orderly and efficientconductofitsbusiness,includingadherencetotheCompany’spolicies,thesafeguardingofitsassets,thepreventionanddetectionof frauds and errors, the accuracy and completeness of the accounting records, and the timely preparation of reliable financial information, as required under the Act.
AUDITOR’S RESPONSIBILITYOurresponsibilityistoexpressanopinionontheCompany’sinternalfinancialcontrolsoverfinancialreportingwithreferencetothesestandaloneInd AS financial statements based on our audit. We conducted our audit in accordance with the Guidance Note on Audit of Internal Financial Controls Over Financial Reporting (the “Guidance Note”) and the Standards on Auditing as specified under section 143(10) of the Companies Act, 2013, to the extent applicable to an audit of internal financial controls and, both issued by the Institute of Chartered Accountants of India. Those Standards and the Guidance Note require that we comply with ethical requirements and plan and perform the audit to obtain reasonable assurance about whether adequate internal financial controls over financial reporting with reference to these standalone Ind AS financial statements were established and maintained and if such controls operated effectively in all material respects.
Our audit involves performing procedures to obtain audit evidence about the adequacy of the internal financial controls over financial reporting with reference to these standalone financial statements and their operating effectiveness. Our audit of internal financial controls over financial reporting included obtaining an understanding of internal financial controls over financial reporting with reference to these standalone Ind AS financial statements, assessing the risk that a material weakness exists, and testing and evaluating the design and operating effectiveness of internalcontrolbasedontheassessedrisk.Theproceduresselecteddependontheauditor’sjudgement,includingtheassessmentoftherisksof material misstatement of the financial statements, whether due to fraud or error.
We believe that the audit evidence we have obtained is sufficient and appropriate to provide a basis for our audit opinion on the internal financial controls over financial reporting with reference to these standalone Ind AS financial statements.
MEANING OF INTERNAL FINANCIAL CONTROLS OVER FINANCIAL REPORTING WITH REFERENCE TO THESE IND AS FINANCIAL STATEMENTSAcompany’s internalfinancialcontroloverfinancial reportingwith referenceto thesestandalone IndASfinancial statements isaprocessdesigned to provide reasonable assurance regarding the reliability of financial reporting and the preparation of financial statements for external purposes inaccordancewithgenerallyacceptedaccountingprinciples.Acompany’s internalfinancialcontroloverfinancial reportingwithreference to these standalone Ind AS financial statements includes those policies and procedures that (1) pertain to the maintenance of records that, in reasonable detail, accurately and fairly reflect the transactions and dispositions of the assets of the company; (2) provide reasonable assurance that transactions are recorded as necessary to permit preparation of standalone Ind AS financial statements in accordance with generally accepted accounting principles, and that receipts and expenditures of the company are being made only in accordance with authorisations of management and directors of the company; and (3) provide reasonable assurance regarding prevention or timely detection ofunauthorisedacquisition,use,ordispositionofthecompany’sassetsthatcouldhaveamaterialeffectonthestandaloneIndASfinancialstatements.

28 Annual Report 2018-19
INHERENT LIMITATIONS OF INTERNAL FINANCIAL CONTROLS OVER FINANCIAL REPORTING WITH REFERENCE TO THESE STANDALONE IND AS FINANCIAL STATEMENTSBecause of the inherent limitations of internal financial controls over financial reporting with reference to these standalone Ind AS financial statements, including the possibility of collusion or improper management override of controls, material misstatements due to error or fraud may occur and not be detected. Also, projections of any evaluation of the internal financial controls over financial reporting with reference to these standalone Ind AS financial statements to future periods are subject to the risk that the internal financial control over financial reporting with reference to these standalone Ind AS financial statements may become inadequate because of changes in conditions, or that the degree of compliance with the policies or procedures may deteriorate.
OPINIONIn our opinion, the Company has, in all material respects, adequate internal financial controls over financial reporting with reference to these standalone Ind AS financial statements and such internal financial controls over financial reporting with reference to these standalone Ind AS financial statements were operating effectively as at March 31, 2019, based on the internal control over financial reporting criteria established by the Company considering the essential components of internal control stated in the Guidance Note on Audit of Internal Financial Controls Over Financial Reporting issued by the Institute of Chartered Accountants of India.
For S.R. Batliboi & Co. LLPChartered AccountantsICAI Firm Registration Number: 301003E/E300005
per Viren MehtaPartnerMembership Number: 048749
Place: MumbaiDate: 12 June 2019

29
Bank Reports and Statements
Consolidated Financial StatementsFinancial HighlightsCourage of Conviction.
Constancy of Change.Balance Sheet
Balance Sheet as at 31ST MARCH 2019
(Amount in Lakhs)Particulars Note
No.As at
31st March,2019As at
31st March,2018As at
1st April,2017ASSETSFinancial assetsCash and cash equivalents 2 151.69 619.26 15.78 Receivables(I) Trade receivables 3 3,839.08 5,694.24 2,856.26 (II Other receivables 3 17.13 20.60 16.95 Loans 4 47.44 19.70 37.70 Investments 5 45,344.24 21,720.29 13,043.30 Other Financial assets 6 75.87 74.97 67.69 Sub total 49,475.45 28,149.06 16,037.68 Non-financial assetsCurrent Tax assets (Net) 1,477.31 1,626.78 1,784.56 Deferred Tax assets (Net) 335.30 428.09 316.11 Property, Plant and Equipment 7 918.12 840.95 626.74 Intangible assets 8 617.03 919.17 1,276.05 Intangible assets under development 9 136.31 - - Other Non-financial assets 10 2,165.14 3,510.83 2,077.22 Sub total 5,649.21 7,325.82 6,080.68 Total Assets 55,124.66 35,474.88 22,118.36 LIABILITIES AND EqUITYLIABILITIESFinancial liabilitiesPayables(I) Trade payables(i) total outstanding dues of micro enterprises and small
enterprises - - -
(ii) total outstanding dues of creditors other than micro enterprises and small enterprises
11 2,550.25 6,361.88 3,611.33
Borrowings (Other than Debt Securities) 12 - - 850.00 Other Financial liabilities 13 1,300.00 1,300.00 900.00 Sub total 3,850.25 7,661.88 5,361.33 Non-Financial liabilitiesCurrent tax liabilities (Net) 49.80 49.80 49.80 Provisions 14 1,832.70 1,317.85 1,062.44 Other non-financial liabilities 15 2,662.34 3,021.86 475.13 Sub total 4,544.84 4,389.51 1,587.37 EqUITYEquity Share Capital 16 2,980.00 2,980.00 2,980.00 Other equity 17 43,749.57 20,443.49 12,189.66 Sub total 46,729.57 23,423.49 15,169.66 Total Liabilities and Equity 55,124.66 35,474.88 22,118.36 Significant Accounting Policies & Notes on Accounts 1
As per our report of even date For and on behalf of the Board of Directors
For S. R. Batliboi & Co. LLP Firm Registration. No. 301003E/E300005 Chartered Accountants
Managing Director Directorper Viren H. Mehta Partner Membership No.:048749 Chief Financial Officer Company Secretary
Mumbai Dated: June 12, 2019
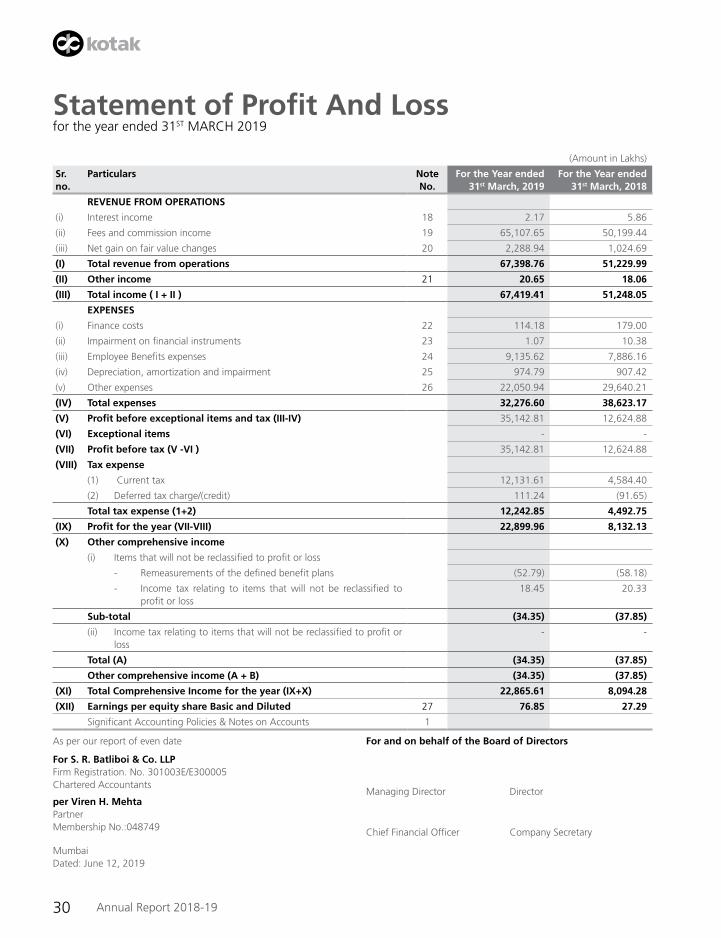
30 Annual Report 2018-19
Statement of Profit And Loss for the year ended 31ST MARCH 2019
(Amount in Lakhs)
Sr.no.
Particulars Note No.
For the Year ended 31st March, 2019
For the Year ended 31st March, 2018
REVENUE FROM OPERATIONS
(i) Interest income 18 2.17 5.86
(ii) Fees and commission income 19 65,107.65 50,199.44
(iii) Net gain on fair value changes 20 2,288.94 1,024.69
(I) Total revenue from operations 67,398.76 51,229.99
(II) Other income 21 20.65 18.06
(III) Total income ( I + II ) 67,419.41 51,248.05
EXPENSES
(i) Finance costs 22 114.18 179.00
(ii) Impairment on financial instruments 23 1.07 10.38
(iii) Employee Benefits expenses 24 9,135.62 7,886.16
(iv) Depreciation, amortization and impairment 25 974.79 907.42
(v) Other expenses 26 22,050.94 29,640.21
(IV) Total expenses 32,276.60 38,623.17
(V) Profit before exceptional items and tax (III-IV) 35,142.81 12,624.88
(VI) Exceptional items - -
(VII) Profit before tax (V -VI ) 35,142.81 12,624.88
(VIII) Tax expense
(1) Current tax 12,131.61 4,584.40
(2) Deferred tax charge/(credit) 111.24 (91.65)
Total tax expense (1+2) 12,242.85 4,492.75
(IX) Profit for the year (VII-VIII) 22,899.96 8,132.13
(X) Other comprehensive income
(i) Items that will not be reclassified to profit or loss
- Remeasurements of the defined benefit plans (52.79) (58.18)
- Income tax relating to items that will not be reclassified to profit or loss
18.45 20.33
Sub-total (34.35) (37.85)
(ii) Income tax relating to items that will not be reclassified to profit or loss
- -
Total (A) (34.35) (37.85)
Other comprehensive income (A + B) (34.35) (37.85)
(XI) Total Comprehensive Income for the year (IX+X) 22,865.61 8,094.28
(XII) Earnings per equity share Basic and Diluted 27 76.85 27.29
Significant Accounting Policies & Notes on Accounts 1
As per our report of even date For and on behalf of the Board of Directors
For S. R. Batliboi & Co. LLP Firm Registration. No. 301003E/E300005 Chartered Accountants
Managing Director Directorper Viren H. Mehta Partner Membership No.:048749 Chief Financial Officer Company Secretary
Mumbai Dated: June 12, 2019
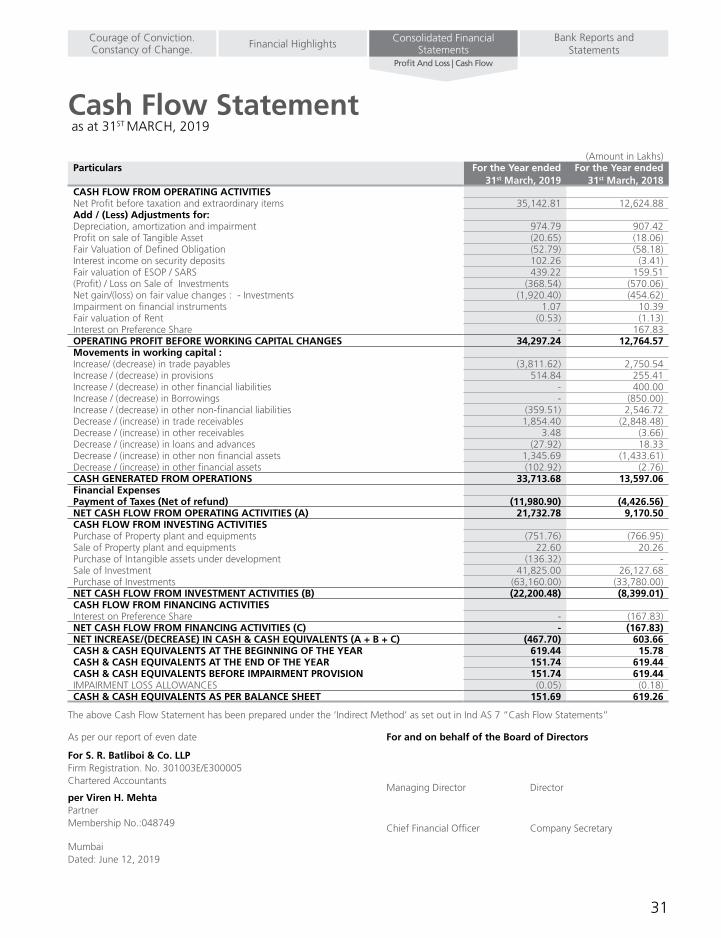
31
Bank Reports and Statements
Consolidated Financial StatementsFinancial HighlightsCourage of Conviction.
Constancy of Change.Profit And Loss | Cash Flow
Cash Flow Statement as at 31ST MARCH, 2019
(Amount in Lakhs)Particulars For the Year ended
31st March, 2019 For the Year ended
31st March, 2018 CASH FLOW FROM OPERATING ACTIVITIESNet Profit before taxation and extraordinary items 35,142.81 12,624.88 Add / (Less) Adjustments for:Depreciation, amortization and impairment 974.79 907.42 Profit on sale of Tangible Asset (20.65) (18.06)FairValuationofDefinedObligation (52.79) (58.18)Interest income on security deposits 102.26 (3.41)Fair valuation of ESOP / SARS 439.22 159.51 (Profit) / Loss on Sale of Investments (368.54) (570.06)Net gain/(loss) on fair value changes : - Investments (1,920.40) (454.62)Impairment on financial instruments 1.07 10.39 Fair valuation of Rent (0.53) (1.13)Interest on Preference Share - 167.83 OPERATING PROFIT BEFORE WORKING CAPITAL CHANGES 34,297.24 12,764.57 Movements in working capital :Increase/ (decrease) in trade payables (3,811.62) 2,750.54 Increase / (decrease) in provisions 514.84 255.41 Increase / (decrease) in other financial liabilities - 400.00 Increase / (decrease) in Borrowings - (850.00)Increase / (decrease) in other non-financial liabilities (359.51) 2,546.72 Decrease / (increase) in trade receivables 1,854.40 (2,848.48)Decrease / (increase) in other receivables 3.48 (3.66)Decrease / (increase) in loans and advances (27.92) 18.33 Decrease / (increase) in other non financial assets 1,345.69 (1,433.61)Decrease / (increase) in other financial assets (102.92) (2.76)CASH GENERATED FROM OPERATIONS 33,713.68 13,597.06 Financial ExpensesPayment of Taxes (Net of refund) (11,980.90) (4,426.56)NET CASH FLOW FROM OPERATING ACTIVITIES (A) 21,732.78 9,170.50 CASH FLOW FROM INVESTING ACTIVITIESPurchase of Property plant and equipments (751.76) (766.95)Sale of Property plant and equipments 22.60 20.26 Purchase of Intangible assets under development (136.32) - Sale of Investment 41,825.00 26,127.68 Purchase of Investments (63,160.00) (33,780.00)NET CASH FLOW FROM INVESTMENT ACTIVITIES (B) (22,200.48) (8,399.01)CASH FLOW FROM FINANCING ACTIVITIESInterest on Preference Share - (167.83)NET CASH FLOW FROM FINANCING ACTIVITIES (C) - (167.83)NET INCREASE/(DECREASE) IN CASH & CASH EqUIVALENTS (A + B + C) (467.70) 603.66 CASH & CASH EqUIVALENTS AT THE BEGINNING OF THE YEAR 619.44 15.78 CASH & CASH EqUIVALENTS AT THE END OF THE YEAR 151.74 619.44 CASH & CASH EqUIVALENTS BEFORE IMPAIRMENT PROVISION 151.74 619.44 IMPAIRMENT LOSS ALLOWANCES (0.05) (0.18)CASH & CASH EqUIVALENTS AS PER BALANCE SHEET 151.69 619.26
TheaboveCashFlowStatementhasbeenpreparedunderthe‘IndirectMethod’assetoutinIndAS7“CashFlowStatements”
As per our report of even date For and on behalf of the Board of Directors
For S. R. Batliboi & Co. LLP Firm Registration. No. 301003E/E300005 Chartered Accountants
Managing Director Directorper Viren H. Mehta Partner Membership No.:048749 Chief Financial Officer Company Secretary
Mumbai Dated: June 12, 2019
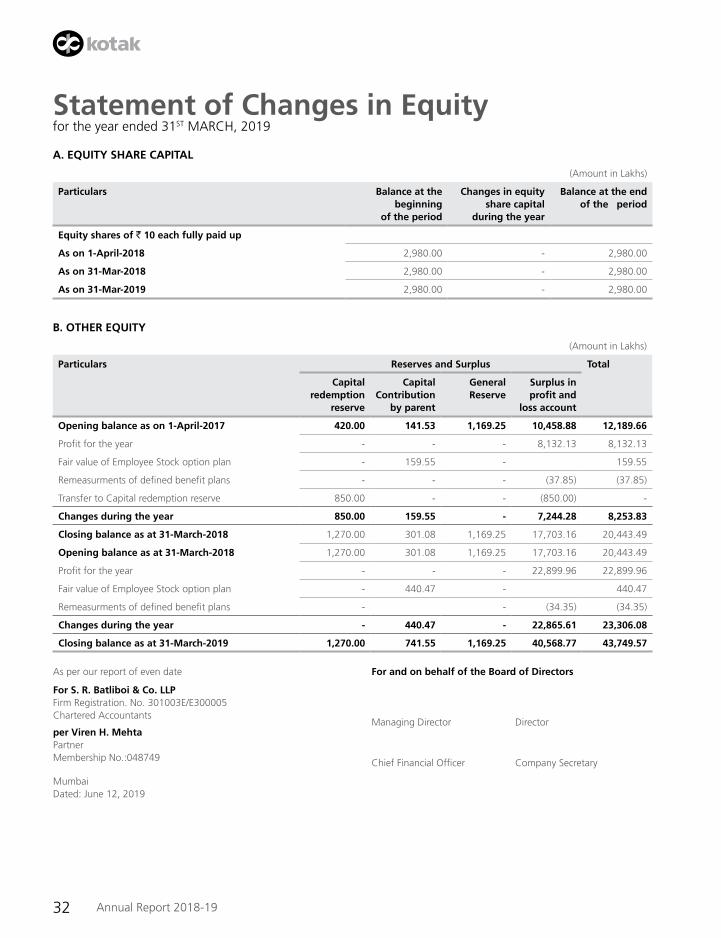
32 Annual Report 2018-19
Statement of Changes in Equity for the year ended 31ST MARCH, 2019
A. EqUITY SHARE CAPITAL
(Amount in Lakhs)
Particulars Balance at the beginning
of the period
Changes in equity share capital
during the year
Balance at the end of the period
Equity shares of ` 10 each fully paid up
As on 1-April-2018 2,980.00 - 2,980.00
As on 31-Mar-2018 2,980.00 - 2,980.00
As on 31-Mar-2019 2,980.00 - 2,980.00
B. OTHER EqUITY
(Amount in Lakhs)
Particulars Reserves and Surplus Total
Capital redemption
reserve
Capital Contribution
by parent
General Reserve
Surplus in profit and
loss account
Opening balance as on 1-April-2017 420.00 141.53 1,169.25 10,458.88 12,189.66
Profit for the year - - - 8,132.13 8,132.13
Fair value of Employee Stock option plan - 159.55 - 159.55
Remeasurments of defined benefit plans - - - (37.85) (37.85)
Transfer to Capital redemption reserve 850.00 - - (850.00) -
Changes during the year 850.00 159.55 - 7,244.28 8,253.83
Closing balance as at 31-March-2018 1,270.00 301.08 1,169.25 17,703.16 20,443.49
Opening balance as at 31-March-2018 1,270.00 301.08 1,169.25 17,703.16 20,443.49
Profit for the year - - - 22,899.96 22,899.96
Fair value of Employee Stock option plan - 440.47 - 440.47
Remeasurments of defined benefit plans - - (34.35) (34.35)
Changes during the year - 440.47 - 22,865.61 23,306.08
Closing balance as at 31-March-2019 1,270.00 741.55 1,169.25 40,568.77 43,749.57
As per our report of even date For and on behalf of the Board of Directors
For S. R. Batliboi & Co. LLP Firm Registration. No. 301003E/E300005 Chartered Accountants
Managing Director Directorper Viren H. Mehta Partner Membership No.:048749 Chief Financial Officer Company Secretary
Mumbai Dated: June 12, 2019

33
Schedules forming part of Balance Sheet and Profit and Loss Account
Bank Reports and Statements
Consolidated Financial StatementsFinancial HighlightsCourage of Conviction.
Constancy of Change.Changes in Equity | Schedulde
1. CORPORATE INFORMATION KotakMahindraAssetManagementCompanyLimited(‘theCompany’)isacompanydomiciledinIndiaandincorporatedon2nd August
1994 with its registered office situated at 27 BKC C-27, G Block, Bandra-Kurla Complex, Bandra East, Mumbai. The Company is incorporated to carry on the business of providing management and administrative services to the Kotak Mahindra Mutual Fund and to deploy the funds raised by the Kotak Mahindra Mutual Fund under its various Schemes. The Company also provides portfolio management services and portfolio advisory services.
2. BASIS OF PREPARATION
A. STATEMENT OF COMPLIANCE The financial statements of the Company have been prepared in accordance with Indian Accounting Standards (Ind AS) notified
under the Companies (Indian Accounting Standards) Rules, 2015 as amended by the Companies (Indian Accounting Standards) Rules, 2016 and other relevant provisions of the Companies Act, 2013 (‘the Act”).
The Company has adopted Ind AS from 1st April 2018 with effective transition date of 1st April 2017 and accordingly, these financial statements together with the comparative reporting period have been prepared in accordance with the recognition and measurement principles as laid down in lnd AS, prescribed under Section 133 of the Act read with relevant rules issued thereunder and the other accounting principles generally accepted in India. The transition to Ind AS has been carried out from the erstwhile Accounting Standards notified under the Act read with Rule 7 of the Companies (Accounts) Rules, 2014 (as amended) and other generally accepted accounting principles in India (collectively referred to as ‘the PreviousGAAP’). Accordingly, the impact oftransition has been recorded in the opening reserves as at 1st April 2017 and the comparative previous year has been restated / reclassified.
Reconciliations and explanations of the effect of the transition from Previous GAAP to Ind AS on the Equity, Statement of Profit and Loss and Cash Flows are provided in Note 38.
The financial statements have been prepared on accrual and going concern basis. The accounting policies are applied consistently to all the financial years presented in the financial statements, including the preparation of the opening Ind AS Balance Sheet as at1April2017beingthe‘dateoftransitiontoIndAS’.ThesestandalonefinancialstatementswereauthorizedforissuebytheCompany’sBoardofDirector’son12th June 2019.
B. FUNCTIONAL AND PRESENTATION CURRENCY ThefinancialstatementsarepresentedinIndianRupees(INR)whichisalsotheCompany’sfunctionalcurrency.Alltheamountsare
rounded to the nearest lakhs with two decimals, except when otherwise indicated.
C. BASIS OF MEASUREMENT The financial statements have been prepared on a historical cost basis except for the following:
• Certainfinancialassetsandliabilities-measuredatfairvalue(referaccountingpolicyregardingfinancialinstruments).
• Netdefinedbenefit(asset)/liability:planassetsaremeasuredatfairvaluelesspresentvalueofdefinedbenefitobligation;
• Share-basedpayments-measuredatfairvalue;and
• Assetsheldforsale:measuredatfairvaluelesscoststosell.
D. USE OF ESTIMATES AND JUDGEMENTS The preparation of the financial statements in accordance with Ind AS requires use of judgements, estimates and assumptions for
some items, which might have an effect on their recognition and measurement in the Balance Sheet and the Statement of Profit and Loss. The actual amounts realized may differ from these estimates. The estimates and the underlying assumptions are reviewed on an ongoing basis.
Judgment, estimates and assumptions are required in particular for:
I. Revenue
(a) Identifying performance obligation in the contract: The Company provides asset management services, portfolio management services and portfolio advisory services. The
34 Annual Report 2018-19
Schedules forming part of Balance Sheet and Profit and Loss Account
Company has determined that all the above services are capable of being distinct because the Company can provide those services on stand-alone basis and customer can benefit from those services on its own.
Recognition of revenue over time or at a point in time:
The Company recognizes revenue from all the services over time because the customer simultaneously receives and consumesthebenefitsoftheCompany’sperformanceasitperforms.
II. Determination of estimated useful lives of property, plant, equipment Useful lives of property, plant and equipment are based on nature of the asset, the estimated usage of the asset, the
operatingconditionsoftheasset,pasthistoryofreplacement,anticipatedtechnologicalchanges,manufacturers’warrantiesand maintenance support.
III. Recognition and Measurement of defined benefit obligations The obligation arising from defined benefit plan is determined on the basis of actuarial valuation. Key actuarial assumptions
which form the basis of above valuation include discount rate, trends in salary escalation, demographics and life expectancy. The discount rate is determined by reference to market yields at the end of the reporting period on government bonds. The period to maturity of the underlying bonds correspond to the probable maturity of the post-employment benefit obligations. Further details are disclosed in Note 33.
IV. Recognition of deferred tax assets Deferred tax assets and liabilities are recognized for the future tax consequences of temporary differences between the
carrying values of assets and liabilities and their respective tax bases, depreciation carry-forwards and carry-forwards of business losses. Deferred tax assets are recognized to the extent that it is probable that future taxable income will be available against which the deductible temporary differences, depreciation carry-forwards and unused tax credits could be utilized.
V. Recognition and measurement of provisions and contingencies The recognition and measurement of other provisions are based on the assessment of the probability of an outflow of
resources and on past experience and circumstances known at the reporting date. The actual outflow of resources at a future date may therefore, vary from the amount included in other provisions.
VI. Discounting of long-term financial assets/liabilities All financial assets/liabilities are required to be measured at fair value on initial recognition. In case of financial assets/
liabilities which are required to be subsequently measured at amortized cost, interest is accrued using the effective interest method.
VII. Fair value of share-based payments Estimating fair value for share-based payment transactions requires determination of the most appropriate valuation model
which depends on the terms and conditions of the grant. This estimate also requires determination of the most appropriate inputs to the valuation model including the expected life of the share option or appreciation right, volatility and dividend yield and making assumptions about them. The Company initially measures the cost of cash-settled transactions with employees using a Black-Scholes model. Key assumptions made with respect to expected volatility include share price, expected dividends and discount rate, under this option pricing model. For cash-settled share-based payment transactions, the liability needs to be remeasured at the end of each reporting period up to the date of settlement, with any changes in fair value recognized in the Statement of Profit and Loss. This requires a reassessment of the estimates used at the end of each reporting period.
For the measurement of the fair value of equity-settled transactions with employees at the grant date, the Company uses a Black-Scholes model.
The assumptions and models used for estimating fair value for share-based payment transactions are disclosed in Note 32.
VIII. Fair value of financial instruments The fair value of financial instruments is the price that would be received to sell an asset or paid to transfer a liability in
an orderly transaction in the principal (or most advantageous) market at the measurement date under current market
35
Schedules forming part of Balance Sheet and Profit and Loss Account
Bank Reports and Statements
Consolidated Financial StatementsFinancial HighlightsCourage of Conviction.
Constancy of Change.Scheduldes
conditions (i.e. an exit price) regardless of whether that price is directly observable or estimated using another valuation technique. When the fair values of financial assets and financial liabilities recorded in the Balance Sheet cannot be derived from active markets, they are determined using a variety of valuation techniques that include the use of valuation models. The inputs to these models are taken from observable markets where possible, but where this is not feasible, estimation is required in establishing fair values. For further details about determination of fair value please refer Note 33.
IX. Business model assessment Classification and measurement of financial assets depends on the results of the Solely Payments of principal and interest
(SPPI) and the business model test. The Company determines the business model at a level that reflects how groups of financial assets are managed together to achieve a particular business objective. This assessment includes judgment reflecting all relevant evidence, including how the performance of the assets is evaluated and its performance measured, the risks that affect the performance of the asset and how these are managed and how the managers of the asset are compensated. The Company monitors financial assets measured at amortized cost that are derecognized prior to their maturity to understand the reason for their disposal and whether the reasons are consistent with the objective of the business for which the asset was held.
X. Effective Interest Rate (EIR) method TheCompany’s EIRmethodology, recognizes interest income / expense using a rate of return that represents the best
estimate of a constant rate of return over the expected behavioural life of loans given / taken and recognizes the effect of potentially different interest rates at various stages and other characteristics of the product life cycle.
This estimation, by its nature, requires an element of judgment regarding the expected behaviour and life-cycle of the instruments, as well expected changes to benchmark rate and other fee income/expense that are integral parts of the instrument.
XI. Impairment of financial assets The Company recognizes loss allowances for expected credit losses on its financial assets measured at amortized cost and
Fair Value throughOther Comprehensive Income (FVOCI) except investment in equity instruments classified as FVOCI.At each reporting date, the Company assesses whether the above financial assets are credit- impaired. A financial asset is‘credit-impaired’whenoneormoreeventsthathaveadetrimentalimpactontheestimatedfuturecashflowsofthefinancialassethaveoccurred.TheCompany’sECLcalculationsareoutputsofstatisticalmodelswithanumberofunderlyingassumptions regarding the choice of variable inputs and their interdependencies such as macroeconomic scenarios.
XII. Impairment of non-financial assets Impairment exists when the carrying value of an asset or cash generating unit (CGU) exceeds its recoverable amount, which
is the higher of its fair value less costs of disposal and its value in use. The fair value less costs of disposal calculation is based onavailabledatafrombindingsalestransactions,conductedatarm’slength,forsimilarassetsorobservablemarketpricesless incremental costs of disposing of the asset. The value in use calculation is based on a discounted cash flow model. The recoverable amount is sensitive to the discount rate used for the discounted cash flow model as well as the expected future cash-inflows and the growth rate used for extrapolation purposes.
E. ACCOUNTING STANDARD ISSUED BUT NOT EFFECTIVE Followingare thenewstandardsandamendments toexistingstandards (asnotifiedbyMinistryofCorporateAffairs (‘MCA’)
on March 30, 2019) which are effective for annual period beginning after April 1, 2019. The Company intends to adopt these standards or amendments from the effective date.
Ind AS 116 – Leases Ind AS 116 is applicable for financial reporting periods beginning on or after April 1, 2019 and replaces existing lease accounting
guidance, namely Ind AS 17 Leases. Ind AS 116 introduces a single, on-Balance Sheet lease accounting model for lessees. A lessee recognizes a right-of-use (“ROU”) asset representing its right to use the underlying asset and a lease liability representing its obligation to make lease payments. The nature of expenses related to those leases will change as Ind AS 116 replaces the operating lease expense (i.e. rent) with depreciation charge for ROU assets and interest expense on lease liabilities. There are recognition exemptions for short-term leases and leases of low-value items. Lessor accounting remains similar to the current standard – i.e. lessors continue to classify leases as finance or operating leases.
36 Annual Report 2018-19
Schedules forming part of Balance Sheet and Profit and Loss Account
The Company is in the process of analyzing the impact of new lease standard on its financial statements.
F. AMENDMENTS TO EXISTING IND AS: ThefollowingamendedstandardsarenotexpectedtohaveasignificantimpactontheCompany’sstandalonefinancialstatements.
This assessment is based on currently available information and may be subject to changes arising from further reasonable and supportable information being made available to the Company when it will adopt the respective amended standards.
I. Amendment to Ind AS 12 Income Taxes: Appendix C – Uncertainty over Income Tax Treatments
The Appendix addresses how to recognize and measure deferred and current income tax assets and liabilities where there is uncertainty over a tax treatment.
II. Amendments to Ind AS 12 Income Taxes
The amendments clarify that the income tax consequences of dividends on financial instruments classified as equity should be recognized according to where the past transactions or events that generated distributable profits were recognized.
III. Amendments to Ind AS 19 Employee Benefits
This amendment requires:
• Touseupdatedassumptionstodeterminecurrentservicecostandnetinterestfortheremainderoftheperiodafteraplan amendment, curtailment or settlement; and
• To recognize in the Statement of Profit and Loss as part of past service cost, or gainor loss on settlement, anyreduction in surplus, even if that surplus was not previously recognized because of the impact of the asset ceiling.
3. SIGNIFICANT ACCOUNTING POLICIES
A. PROPERTY, PLANT AND EqUIPMENT
i. Recognition and measurement Items of property, plant and equipment (PPE) are measured at cost less accumulated depreciation and any accumulated
impairment losses.
The cost of an item of property, plant and equipment comprises:
a. its purchase price, including import duties and non-refundable purchase taxes, after deducting trade discounts and rebates.
b. any costs directly attributable to bringing the asset to the location and condition necessary for it to be capable of operating in the manner intended by the Management.
Income and expenses related to the incidental operations, not necessary to bring the item to the location and condition necessary for it to be capable of operating in the manner intended by management, are recognized in the Statement of Profit and Loss.
If significant parts of an item of property, plant and equipment have different useful lives, then they are accounted and depreciated for as separate items (major components) of property, plant and equipment.
Any gain or loss on disposal of an item of property, plant and equipment is recognized in the Statement of Profit and Loss.
ii. Subsequent expenditure Subsequent expenditure is capitalized only if it is probable that the future economic benefits associated with the expenditure
will flow to the Company.
iii. Depreciation Deprecation is provided on a pro-rata basis on a Straight Line Method over the estimated useful life of the assets at rates
which are equal to or higher than the rates prescribed under Schedule II of the Companies Act, 2013 in order to reflect the actual usage of the assets. Estimated useful lives of assets based on technical evaluation by the management are as follows:

37
Schedules forming part of Balance Sheet and Profit and Loss Account
Bank Reports and Statements
Consolidated Financial StatementsFinancial HighlightsCourage of Conviction.
Constancy of Change.Scheduldes
Computers 3 years
Office Equipment 5 Years
Furniture and Fixtures 6 years
Vehicles 4 years
Leasehold Improvements Over the period of lease subject to a maximum of 6 years
Assets costing less than INR 5,000 are fully depreciated in the year of purchase.
Depreciation methods, useful lives and residual values are reviewed at each reporting date and adjusted if appropriate.
B. INTANGIBLE ASSETS
i. Recognition and measurement Intangible assets are stated at cost of acquisition less accumulated amortization and impairment losses, if any. The cost of
an intangible asset comprises its purchase price, including any import duties and other non-refundable taxes (other than those subsequently recoverable from the taxing authorities), and any directly attributable expenditure on making ‘the asset ready for its intended use and net of any trade discounts and rebates. Subsequent expenditure on an intangible asset after its purchase/completion is recognized as an expense when incurred unless it is probable that such expenditure will enable the asset to generate future economic benefits in excess of its originally assessed standards of performance and such expenditure can be measured and attributed to the asset reliably, in which case such expenditure is added to the cost of the asset.
ii. Subsequent expenditure Subsequent expenditure is capitalized only when it increases the future economic benefits embodied in the specific asset to
which it relates.
iii. Amortization The intangible assets are amortized over the estimated useful lives as given below:
Software (including development) expenditure 3 years
Asset Management Rights 5 years
Amortization methods, useful lives and residual values are reviewed at each reporting date and adjusted if appropriate.
C. ACCOUNTING FOR OPERATING LEASES AS A LESSEE Leases where the lessor effectively retains substantially all the risks and rewards of ownership of the leased term, are classified as
operating leases. Payments made under operating leases are recognized in the Statement of Profit and Loss on a straight line basis over the term of the lease unless such payments are structured to increase in line with expected general inflation to compensate for the lessors expected inflationary cost increases.
D. REVENUE RECOGNITION OF INCOME Revenue (other than for those items to which Ind AS 109 Financial Instruments are applicable) is measured at fair value of the
consideration received or receivable. Ind AS 115 Revenue from contracts with customers outlines a single comprehensive model of accounting for revenue arising from contracts with customers.
The Company recognizes revenue from contracts with customers based on a five step model as set out in Ind 115:
Step 1: Identify contract(s) with a customer: A contract is defined as an agreement between two or more parties that creates enforceable rights and obligations and sets out the criteria for every contract that must be met.
Step 2: Identify performance obligations in the contract: A performance obligation is a promise in a contract with a customer to transfer a good or service to the customer.
Step 3: Determine the transaction price: The transaction price is the amount of consideration to which the Company expects to be entitled in exchange for transferring promised goods or services to a customer, excluding amounts collected on behalf of third parties.
38 Annual Report 2018-19
Schedules forming part of Balance Sheet and Profit and Loss Account
Step 4: Allocate the transaction price to the performance obligations in the contract: For a contract that has more than one performance obligation, the Company allocates the transaction price to each performance obligation in an amount that depicts the amount of consideration to which the Company expects to be entitled in exchange for satisfying each performance obligation.
Step 5: Recognize revenue when (or as) the Company satisfies a performance obligation
Revenue from contracts with customers is recognized when control of the goods or services are transferred to the customer at an amount that reflects the consideration to which the Company expects to be entitled in exchange for those goods or services
Investment management fees are recognized an accrual basis after deducting actual and estimated expenses from total expense accruals in scheme books.
Fees from Portfolio Advisory Services are recognized on an accrual basis in accordance with the terms of agreement.
Fees from Portfolio Management Services are recognized on an accrual basis in accordance with the terms of agreement.
Dividend income is recognized in the Statement of Profit and Loss on an accrual basis when the right to receive the dividend is established.
Purchase and sale of investments are recorded on trade date. The profit / loss on sale of investments is recognized in the Statement of Profit and Loss on the trade date, using the weighted average cost method.
Interest income on financial assets is recognized on an accrual basis using effective interest method.
E. INCOME TAX Income tax expense comprises current and deferred tax. It is recognized in the Statement of Profit and Loss except to the extent
that it relates to items recognized directly in equity or in other comprehensive income (OCI).
Current tax Current tax is measured at the amount expected to be paid in respect of taxable income for the year in accordance with the Income
Tax Act, 1961. Current tax comprises the expected tax payable or receivable on the taxable income or loss for the year and any adjustment to the tax payable or receivable in respect of previous years. It is measured using tax rates enacted or substantively enacted at the reporting date.
Current tax assets and current tax liabilities are offset only if the Company has a legally enforceable right to set off the recognized amounts, and it intends to realize the asset and settle the liability on a net basis or simultaneously.
Deferred tax Deferred tax is recognized in respect of temporary differences between the carrying amounts of assets and liabilities for financial
reporting purposes and the amounts used for taxation purposes.
Deferredtaxassetsarereviewedateachreportingdateandbasedonmanagement’sjudgment,arereducedtotheextentthatitisno longer probable that the related tax benefit will be realized; such reductions are reversed when the probability of future taxable profits improves.
Unrecognized deferred tax assets are reassessed at each reporting date and recognized to the extent that it has become probable that future taxable profits will be available against which they can be used.
Deferred tax is measured at the tax rates that are expected to be applied to temporary differences when they reverse, using tax rates enacted or substantively enacted at the reporting date.
The measurement of deferred tax reflects the tax consequences that would follow from the manner in which the Company expects, at the reporting date, to recover or settle the carrying amount of its assets and liabilities.
Deferred tax assets and liabilities are offset only if:
a. the Company has a legally enforceable right to set off current tax assets against current tax liabilities; and
b. the deferred tax assets and the deferred tax liabilities relate to income taxes levied by the same taxation authority.

39
Schedules forming part of Balance Sheet and Profit and Loss Account
Bank Reports and Statements
Consolidated Financial StatementsFinancial HighlightsCourage of Conviction.
Constancy of Change.Scheduldes
F. EMPLOYEE BENEFITS
Defined Contribution Plan Provident Fund/Employee State Insurance Scheme
TheCompany’s contribution togovernmentprovident fund and employee state insurance schemeare considered as definedcontribution plans and are charged as an expense based on the amount of contribution required to be made and when services are rendered by the employees. The Company has no further obligations.
Superannuation Fund TheCompanycontributesasumequivalentto15%ofeligibleemployee’ssalarysubjecttoamaximumof`1 Lakh per annum per
employee to a Superannuation Fund administered by trustees and managed by Kotak Mahindra Life Insurance Company Limited. The Company recognizes such contributions as an expense in the year they are incurred.
New Pension Scheme TheCompanycontributesupto10%ofeligibleemployees’salaryperannum,totheNewPensionFundadministeredbyPFRDA
appointed pension fund manager. The Company recognizes such contributions as an expense in the year they are incurred.
Defined Benefit Plan
Gratuity The Company accounts for the liability for future gratuity benefits based on an independent actuarial valuation. The gratuity
obligationisunfunded.ThenetpresentvalueoftheCompany’sobligationtowardsthesameisdeterminedbasedontheProjectedUnit Credit method as at the Balance Sheet date.
Remeasurement of all defined benefit plans, which comprise actuarial gains and losses are recognized immediately in OCI in the year they are incurred. Net interest expense (income) on the net defined liability (assets) is computed by applying the discount rate, used to measure the net defined liability (asset), to the net defined liability (asset) at the start of the financial year after taking into account any changes as a result of contribution and benefit payments during the year. Net interest expense and other expenses related to defined benefit plans are recognized in the Statement of Profit and Loss. Remeasurements are not reclassified to the Statement of Profit or Loss in subsequent period.
Compensated Absences Compensated absences which accrue to employees and which are expected to be availed within twelve months immediately
following the year end are reported as expenses during the year in which the employees performs the services that the benefit covers and the liabilities are reported at the undiscounted amount of the benefit, and where the availment or encashment is otherwise not expected to wholly occur within the next twelve months, the liability on account of the benefit is actuarially determined using the projected unit credit method.
Other Employee Benefits The undiscounted amount of short-term employee benefits expected to be paid in exchange for the services rendered by employees
are recognized during the year when the employees render the service. These benefits include performance incentives.
As per the Company policy, employees of the Company are eligible for an award after completion of a specified number of years of service with the Company. The obligation is measured at the Balance Sheet date on the basis of an actuarial valuation using the projected unit credit method.
G. FOREIGN CURRENCY TRANSACTIONS Transactions in foreign currencies are translated into functional currency at the exchange rates at the dates of the transactions or
an average rate if the average rate approximates the actual rate at the date of the transaction.
Monetary assets and liabilities denominated in foreign currencies are translated into the functional currency at the exchange rate at the reporting date. Non-monetary assets and liabilities that are measured at fair value in a foreign currency are translated into the functional currency at the exchange rate when the fair value was determined. Non-monetary assets and liabilities that are measured based on historical cost in a foreign currency are translated at the exchange rate at the date of the transaction.
40 Annual Report 2018-19
Schedules forming part of Balance Sheet and Profit and Loss Account
H. BORROWING COSTS Borrowing costs are interest and other costs (including exchange differences relating to foreign currency borrowings to the extent
that they are regarded as an adjustment to interest costs) incurred in connection with the borrowing of funds. Borrowing costs directly attributable to acquisition or construction of an asset which necessarily take a substantial period of time to get ready for their intended use are capitalized as part of the cost of that asset. Other borrowing costs are recognized as an expense in the period in which they are incurred.
I. EARNINGS PER SHARE Basic earnings per share is calculated by dividing the profit or loss for the year attributable to equity shareholders (after deducting
preference dividends and attributable taxes) by the weighted average number of equity shares outstanding during the year. Partly paid equity shares are treated as a fraction of an equity share to the extent that they are entitled to participate in dividends relative to a fully paid equity share during the reporting period. The weighted average number of equity shares outstanding during the year is adjusted for events such as bonus issue, bonus element in a rights issue, share split, and reverse share split (consolidation of shares), if any, that have changed the number of equity shares outstanding, without a corresponding change in resources.
For the purpose of calculating diluted earnings per share, the profit or loss for the year attributable to equity shareholders and the weighted average number of shares outstanding during the year are adjusted for the effects of all dilutive potential equity shares.
J. IMPAIRMENT OF NON-FINANCIAL ASSETS The carrying values of assets/cash generating units at each Balance Sheet date are reviewed for impairment if any indication of
impairment exists. If the carrying amount of the assets exceeds the estimated recoverable amount, an impairment is recognized for such excess amount in the Statement of Profit and Loss.
Therecoverableamountisthegreaterofthefairvaluelesscostsofdisposalandtheirvalueinuse.Valueinuseisarrivedatbydiscounting the future cash flows to their present value based on an appropriate discount factor.
When there is indication that an impairment loss recognized for an asset (other than a revalued asset) in earlier accounting periods which no longer exists or may have decreased, such reversal of impairment loss is recognized in the Statement of Profit and Loss to the extent the amount was previously charged to the Statement of Profit and Loss. In case of revalued assets, such reversal is not recognized.
K. PROVISIONS AND CONTINGENT LIABILITIES A provision is recognized when the Company has a present obligation as a result of past events and it is probable that an outflow
of resources will be required to settle the obligation in respect of which a reliable estimate can be made. When the effect of the time value of money is material, the Company determines the level of provision by discounting the expected cash flows at a pre-tax rate reflecting the current rates specific to the liability. These are reviewed at each Balance Sheet date and adjusted to reflect the current best estimates. Contingent liabilities are not recognized but disclosed in the notes.
L. SHARE BASED PAYMENTS
Employees Stock Options Plans (“ESOPs”) - Equity settled The ultimate holding company of the Company operates share option schemes for the purpose of providing incentives and
rewards toeligibleparticipantswhocontribute to thesuccessof theCompany’soperations.Employees (includingwhole-timedirectors) of the Company receive remuneration in the form of share-based payments, whereby employees render services as consideration for equity instruments (“equity settled transactions”).
The cost of equity-settled transactions with employees and directors for grants is measured by reference to the fair value at the date at which they are granted. The cost of equity-settled transactions is recognized in the Statement of Profit or Loss, together with a corresponding increase in reserves, representing contribution received from the ultimate holding company, over the period in which the performance and/or service conditions are fulfilled. The cumulative expense recognized for equity-settled transactions at the end of each reporting period until the vesting date reflects the extent to which the vesting period has expired and the Company’sbestestimateofthenumberofequityinstrumentsthatwillultimatelyvest.ThechargeorcredittotheStatementofProfit or Loss for a period represents the movement in the cumulative expense recognized as at the beginning and end of that period.

41
Schedules forming part of Balance Sheet and Profit and Loss Account
Bank Reports and Statements
Consolidated Financial StatementsFinancial HighlightsCourage of Conviction.
Constancy of Change.Scheduldes
Stock Appreciation Rights (“SARs”) - Cash Settled ThefairvalueoftheamountpayabletoemployeesinrespectofSAR’s,whicharesettledincash,isrecognizedasanexpensewith
a corresponding increase in liabilities, over the period the employees unconditionally become entitled to payment. The liability is measured at the end of each reporting date up to and including settlement date, with changes in the fair value recognized in the StatementofProfitandLossin‘ProvisionforStockAppreciationRights’undertheheadEmployeeBenefitExpense.
M. SEGMENT REPORTING Thecompany’soperatingsegmentsareestablishedonthebasisofthosecomponentsofthecompanythatareevaluatedregularly
bytheExecutiveCommittee(the‘ChiefOperatingDecisionMaker’asdefinedinlndAS108-‘OperatingSegments’),indecidinghow to allocate resources and in assessing performance. These have been identified taking into account the nature of products and services, the differing risks and returns and the internal business reporting systems. Basis of such evaluation, the company concluded it operates in a single reportable segment.
N. FINANCIAL INSTRUMENTS A financial instrument is any contract that gives rise to a financial asset of one entity and a financial liability or equity instrument
of another entity.
Financial assets
Recognition and Initial measurement
All financial assets are recognized initially at fair value plus or minus, in the case of financial assets not recorded at fair value through the Statement of Profit or Loss, transaction fees or costs that are directly attributable and incremental to the origination/acquisition of the financial asset unless otherwise specifically mentioned in the accounting policies.
Classification
The Company classifies its financial assets as subsequently measured at either amortized cost or fair value based on the business model for managing the financial assets and the contractual cash flow characteristics of the financial assets.
Business model assessment
The Company makes an assessment of the objective of a business model in which an asset is held such that it best reflects the way the business is managed and is consistent with the information provided to the Management. The information considered includes:
• theobjectivesfortheportfolio,inparticular,Management’sstrategyoffocusingonearningcontractualinterestrevenue,maintaining a particular interest rate profile, matching the duration of the financial assets to the duration of the liabilities that are funding those assets or realising cash flows through the sale of the assets;
• thefrequency,volumeandtimingofsalesinpriorperiods,thereasonsforsuchsalesanditsexpectationsaboutfuturesalesactivity. However, information about sales activity is not considered in isolation, but as part of an overall assessment of how theCompany’sstatedobjectiveformanagingthefinancialassetsisachievedandhowcashflowsarerealized.
• therisksthataffecttheperformanceofthebusinessmodel,thefinancialassetsheldwithinthatbusinessmodelandhowthose risks are managed.
Assessment whether contractual cash flows are solely payments of principal and interest
Forthepurposesofthisassessment,‘principal’isdefinedasthefairvalueofthefinancialassetoninitialrecognition.‘Interest’is defined as consideration for the time value of money and for the credit risk associated with the principal amount outstanding during a particular period of time and for other basic lending risks and costs as well as profit margin.
Subsequent measurement
The Company classifies its financial assets in the following measurement categories:
Financial assets at amortized cost
A financial asset is measured at amortized cost if it meets both of the following conditions:
• theassetisheldwithinabusinessmodelwhoseobjectiveistoholdassetsinordertocollectcontractualcashflows;and

42 Annual Report 2018-19
Schedules forming part of Balance Sheet and Profit and Loss Account
• thecontractualtermsofthefinancialassetrepresentcontractualcashflowsthataresolelypaymentsofprincipalandintereston the principal amount outstanding.
After initial measurement, such financial assets are subsequently measured at amortized cost using the effective interest (EIR) method. Amortized cost is calculated by considering any discount or premium on acquisition and fees or costs that are an integral part of the EIR and reported as part of interest income in the Statement of Profit and Loss. The losses, if any, arising from impairment are recognized in the Statement of Profit and Loss.
FinancialassetatfairvaluethroughOtherComprehensiveIncome(FVOCI)
AfinancialassetismeasuredatFVOCIifitmeetsbothofthefollowingconditions:
• theassetisheldwithinabusinessmodelwhoseobjectiveisachievedbybothcollectingcontractualcashflowsandsellingfinancial assets; and
• thecontractualtermsofthefinancialassetrepresentcontractualcashflowsthataresolelypaymentsofprincipalandintereston the principal amount outstanding.
After initial measurement, such financial assets are subsequently measured at fair value. Interest income is recognized using the effective interest (EIR) method. The impairment losses, if any, are recognized through Statement of Profit and Loss. The loss allowance is recognized in OCI and does not reduce the carrying value of the financial asset. On derecognition, gains and losses accumulated in OCI are reclassified to the Statement of Profit and Loss.
Financialassetatfairvaluethroughprofitandloss(FVTPL)
Anyfinancialasset,whichdoesnotmeetthecriteriaforclassificationasatamortizedcostorasFVOCI,isclassifiedtobemeasuredatFVTPL.
FinancialassetsincludedwithintheFVTPLcategoryaremeasuredatfairvaluewithallchangesrecognizedintheStatementofProfit and Loss.
All equity investments except for investments in subsidiary/associate/joint ventures are measured at fair value. Equity instruments whichareheldfortradingareclassifiedasatFVTPL.
EquityinstrumentsatFVOCI
TheCompanysubsequentlymeasuresallequityinvestmentsatFVTPL,unlesstheCompanyhaselectedtoclassifyirrevocablysomeofitsequityinvestmentsasequityinstrumentsatFVOCI,whensuchinstrumentsmeetthedefinitionofdefinitionofEquityunderInd AS 32 Financial Instruments: Presentation and are not held for trading. Such classification is determined on an instrument-by-instrument basis.
Gains and losses on these equity instruments are never recycled to the Statement of Profit and Loss. Dividends are recognized in the Statement of Profit and Loss as dividend income when the right of the payment has been established, except when the Company benefits from such proceeds as a recovery of part of the cost of the instrument, in which case, such gains are recorded inOCI.EquityinstrumentsatFVOCIarenotsubjecttoanimpairmentassessment.
Financial liabilities
TheCompanyclassifiesallfinancialliabilitiesassubsequentlymeasuredatamortizedcost,exceptforfinancialliabilitiesatFVTPL.LiabilitieswhichareclassifiedatFVTPL,includingderivativesthatareliabilities,shallbesubsequentlymeasuredatfairvalue.
O. IMPAIRMENT OF FINANCIAL ASSETS Methodology for computation of Expected Credit Losses (ECL)
ThefinancialinstrumentscoveredwithinthescopeofECLincludefinancialassetsmeasuredatamortizedcostandFVOCI,suchasloans, trade receivables, security deposit, balances with banks and other financial assets. ECL has not been determined on financial assetsmeasuredatFVTPL.
The loss allowance has been measured using lifetime ECL except for financial assets on which there has been no significant increase in credit risk since initial recognition. In such cases, loss allowance has been measured at 12 month ECL.
Ateachreportingdate,theCompanyassesseswhetherfinancialassetscarriedatamortizedcostandFVOCIarecredit-impaired.Afinancial asset is credit- impaired when one or more events that have a detrimental impact on the estimated future cash flows of
43
Schedules forming part of Balance Sheet and Profit and Loss Account
Bank Reports and Statements
Consolidated Financial StatementsFinancial HighlightsCourage of Conviction.
Constancy of Change.Scheduldes
the financial asset have occurred since initial recognition. Evidence that a financial asset is credit-impaired include observable data about the following events:
• significantfinancialdifficultyoftheissuerortheborrower;
• abreachofcontract,suchasadefaultorpastdueevent;
• the lender(s)of theborrower, foreconomicor contractual reasons relating to theborrower’sfinancialdifficulty,havinggranted to the borrower a concession(s) that the lender(s) would not otherwise consider;
• itisbecomingprobablethattheborrowerwillenterbankruptcyorotherfinancialreorganization;
• thedisappearanceofanactivemarketforthatfinancialassetbecauseoffinancialdifficulties.
ECL are a probability weighted estimate of credit losses measured as follows:
• Financialassetsthatarenotcreditimpairedatthereportingdate:
ECLhasbeenestimatedbydeterminingtheprobabilityofdefault(‘PD’),ExposureatDefault(‘EAD’)andlossgivendefault(‘LGD’).
PDhasbeencomputedusingobservedhistoryofdefaultandconvertedintoforwardlookingPD’susingsuitablemacro-economicvariable data.
• Financialassetsthatarecreditimpairedatthereportingdate:
ECL has been estimated as the difference between the gross carrying amount and the present value of estimated future cash flows.
For trade receivables, the Company applies a simplified approach. It recognizes impairment loss allowance based on lifetime ECLs at each reporting date, right from its initial recognition. Therefore, the Company does not track changes in credit risk, but instead recognizes a loss allowance based on lifetime ECLs at each reporting date.
If the terms of a financial asset are renegotiated or modified or an existing financial asset is replaced with a new one due to financial difficulties of the borrower, then an assessment is made of whether the financial asset should be derecognized:
• If theexpected restructuringwillnot result inderecognitionof theexistingasset,expectedcashflowsarising fromthemodified financial asset are included in calculating cash shortfalls from the existing asset.
• If theexpectedrestructuringwill result inderecognitionoftheexistingassetandtherecognitionofmodifiedasset,themodified asset is considered as a new financial asset. The date of the modification is treated as the date of initial recognition of that financial asset when applying the impairment requirements to the modified financial asset. The impairment loss allowance is measured at an amount equal to 12 month expected credit losses until there is a significant increase in credit risk. If modified financial asset is credit-impaired at initial recognition, the financial asset is recognized as originated credit impaired asset.
Criteria used for determination of movement from stage 1 (12 month ECL) to stage 2 (lifetime ECL) and stage 3 (Lifetime ECL)
TheCompanyappliesathree-stageapproachtomeasureECLonfinancialassetsmeasuredatamortizedcostandFVOCI.Theassets migrate through the following three stages based on an assessment of qualitative and quantitative considerations:
• Stage1:12monthECL:
For exposures where there has not been a significant increase in credit risk since initial recognition and that are not credit impaired upon origination, the portion of the lifetime ECL associated with the probability of default events occurring within the next 12 months is recognized. Interest income is accrued using the effective interest rate on the gross carrying amount.
• Stage2:LifetimeECL(notcreditimpaired):
At each reporting date, the Company assesses whether there has been a significant increase in credit risk for financial assets since initial recognition. In determining whether credit risk has increased significantly since initial recognition, the Company uses days past due (DPD) information and other qualitative factors to assess deterioration in credit quality of a financial asset.
For credit exposures where there has been a significant increase in credit risk since initial recognition but that are not credit impaired, a lifetime ECL is recognized. Interest income is accrued using the effective interest rate on the gross carrying amount.
44 Annual Report 2018-19
Schedules forming part of Balance Sheet and Profit and Loss Account
• Stage3:LifetimeECL(creditimpaired):
Financial assets are assessed as credit impaired when one or more events that have a detrimental impact on the estimated future cash flows of the asset have occurred. For financial assets that have become credit impaired, a lifetime ECL is recognized and interest revenue is calculated by applying the effective interest rate to the amortized cost (net of loss allowance).
If, in a subsequent period, credit quality improves and reverses any previously assessed significant increase in credit risk since origination, then the Expected Credit Loss reverts from lifetime ECL to 12-months ECL.
For loans whose significant payment obligations are only after next 12 months, life time ECL has been applied.
Method used to compute lifetime ECL: The Company calculates ECLs based on a probability-weighted scenarios to measure the expected cash shortfalls, discounted at
an approximation to the EIR. A cash shortfall is the difference between the cash flows that are due to an entity in accordance with the contract and the present value of cash flows that the entity expects to receive. The Company applies statistical techniques to estimate 12 month ECL and lifetime ECL.
Manner in which forward looking assumptions has been incorporated in ECL estimates:
The Company considers its historical loss experience and adjusts it for current observable data. In addition, the Company uses reasonable forecasts of future economic conditions including expert judgment to estimate the amount of expected credit losses. The methodology and assumptions including any forecasts of future economic conditions are periodically reviewed and changes, if any, are accounted for prospectively.
P. DERECOGNITION OF FINANCIAL ASSETS AND FINANCIAL LIABILITIES A financial asset (or, where applicable, a part of a financial asset or part of a group of similar financial assets) is primarily
derecognized when:
- the rights to receive cash flows from the asset have expired, or
- the Company has transferred substantially all the risks and rewards of the asset, or
- the Company has neither transferred nor retained substantially all the risks and rewards of the asset, but has transferred control of the asset
On derecognition of a financial asset (or, where applicable, a part of a financial asset or part of a group of similar financial assets), the difference between the carrying amount (measured at the date of derecognition) allocated to financial asset (or, where applicable, a part of a financial asset or part of a group of similar financial assets) and the consideration received (including any new asset obtained less any new liability assumed) is recognized in the statement of profit and loss.
Financial liabilities The Company derecognizes a financial liability when its contractual obligations are discharged or cancelled, or expire.
q. MODIFICATIONS OF FINANCIAL ASSETS AND FINANCIAL LIABILITIES
Financial assets If the terms of a financial asset are modified, the Company evaluates whether the cash flows of the modified asset are substantially
different. If the cash flows are substantially different, then the contractual rights to cash flows from the original financial asset are deemed to have expired. In this case, the original financial asset is derecognized and a new financial asset is recognized at fair value.
If the cash flows of the modified asset carried at amortized cost are not substantially different, then the modification does not result in derecognition of the financial asset. In this case, the Company recalculates the gross carrying amount of the financial asset asthepresentvalueoftherenegotiatedormodifiedcontractualcashflowsthatarediscountedatthefinancialasset’soriginaleffective interest rate and recognizes the amount arising from adjusting the gross carrying amount as a modification gain or loss in the Statement of Profit and Loss account. Any costs or fees incurred adjust the carrying amount of the modified financial asset and are amortized over the remaining term of the modified financial asset. If such a modification is carried out because of financial difficulties of the borrower, then the gain or loss is presented together with impairment losses. In other cases, it is presented as interest income.

45
Schedules forming part of Balance Sheet and Profit and Loss Account
Bank Reports and Statements
Consolidated Financial StatementsFinancial HighlightsCourage of Conviction.
Constancy of Change.Scheduldes
Financial liabilities The Company derecognizes a financial liability when its terms are modified and the cash flows of the modified liability are
substantially different. In this case, a new financial liability based on the modified terms is recognized at fair value. The difference between the carrying amount of the financial liability extinguished and the new financial liability with modified terms is recognized in the Statement of Profit and Loss.
R. MEASUREMENT OF FAIR VALUES TheCompany’saccountingpoliciesanddisclosuresrequirefairvaluemeasurementoffinancialinstrumentssuchasinvestmentin
unquoted equity instruments, mutual fund, etc.
Fair value is the price that would be received to sell an asset or paid to transfer a liability in an orderly transaction between market participants at the measurement date.
Management uses its judgment in selecting an appropriate valuation technique for financial instruments not quoted in an active market.Valuationtechniquescommonlyusedbymarketparticipantsareapplied.
When measuring the fair value of an asset or a liability, the Company uses observable market data as far as possible. Fair values are categorized into different levels in a fair value hierarchy based on the inputs used in the valuation techniques as follows:
• Level1:quotedprices(unadjusted)inactivemarketsforidenticalassetsorliabilities.
• Level2:inputsotherthanquotedpricesincludedinLevel1thatareobservablefortheassetorliability,eitherdirectly(i.e.asprices) or indirectly (i.e. derived from prices).
• Level3:inputsfortheassetorliabilitythatarenotbasedonobservablemarketdata(unobservableinputs).
If the inputs used to measure the fair value of an asset or a liability fall into different levels of the fair value hierarchy, then the fair value measurement is categorized in its entirety in the same level of the fair value hierarchy as the lowest level input that is significant to the entire measurement.
S. CASH AND CASH EqUIVALENTS Cash and cash equivalents comprise of cash on hand and demand deposits with banks. It also comprises of short-term deposits
with an original maturity of three months or less, highly liquid investments that are readily convertible into known amounts of cash and which are subject to insignificant risk of changes in value.
T. CASH FLOW STATEMENT Cash flows are reported using the indirect method, whereby profit / (loss) before exceptional items and tax is adjusted for the
effects of transactions of non-cash nature and any deferrals or accruals of past or future cash receipts or payments. The cash flows from operating, investing and financing activities.
U. Allassetsandliabilitieshavebeenclassifiedascurrentornon-currentaspertheCompany’soperatingcycleandothercriteriasetout in the Schedule III to the Companies Act, 2013. Based on the nature of services and the time between the provision of services and their realization in cash and cash equivalents, the Company has ascertained its operating cycle as 12 months for the purpose of current or non-current classification of assets and liabilities.
V. OPTIONAL EXEMPTIONS AND MANDATORY EXCEPTIONS UNDER IND AS 101 FIRST TIME ADOPTION OF INDIAN ACCOUNTING STANDARDS (IND AS)
Optional exemptions:
I. Deemed cost The Company has elected to account for property plant and equipment and intangible assets at their previous GAAP
carrying amount as at 01st April 2017 i.e. deemed cost as at the date of transition.
II. Share-based payments The Company has elected not to apply Ind AS 102 Share-based payment to equity instruments that vested before the date
of transition to Ind AS. Accordingly, the Company has measured only the unvested stock options on the date of transition as per Ind AS 102.
46 Annual Report 2018-19
Schedules forming part of Balance Sheet and Profit and Loss Account
III. Investment in subsidiaries, joint venture and associates The Company has elected to measure investment in subsidiaries, joint venture and associate at their previous GAAP carrying
amount as at 01st April, 2017 i.e. deemed cost as at the date of transition.
Mandatory exemptions:
I. Estimates The estimates at April 1, 2017 and March 31, 2018 are consistent with those made for the same dates in accordance
with the Indian GAAP (after adjustments to reflect any differences if any, in accounting policies). The Company has made estimates for following items in accordance with Ind AS at the date of transition as these were not required under previous GAAP:
• FairvaluationoffinancialinstrumentsatFVTPLand/orFVOCI
• Impairmentoffinancialassetsbasedonexpectedcreditlossmodel.
II. Derecognition of financial assets and financial liabilities Ind AS 101 requires a first-time adopter to apply the de-recognition provisions of Ind AS 109 prospectively for transactions
occurring on or after the date of transition to Ind AS. However, Ind AS 101 allows a first-time adopter to apply the de-recognitionrequirementsinIndAS109retrospectivelyfromadateoftheentity’schoosing,providedthattheinformationneeded to apply Ind AS 109 to financial assets and financial liabilities derecognised as a result of past transactions was obtained at the time of initially accounting for those transactions.
III. Classification of financial assets The Company has classified and measured the financial assets on the basis of the facts and circumstances that exist at the
date of transition to Ind AS.
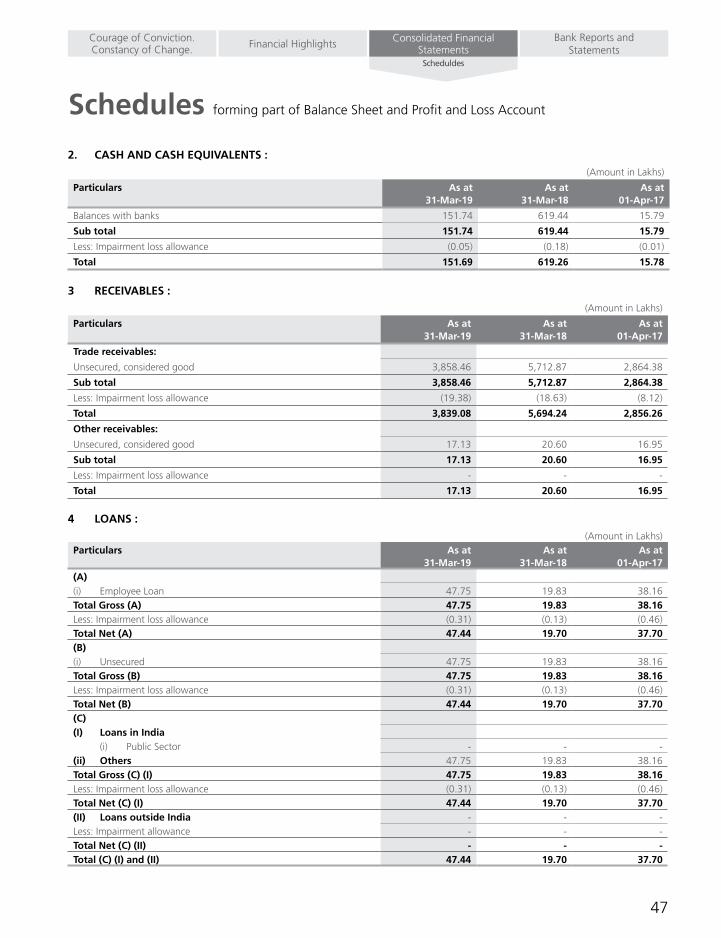
47
Schedules forming part of Balance Sheet and Profit and Loss Account
Bank Reports and Statements
Consolidated Financial StatementsFinancial HighlightsCourage of Conviction.
Constancy of Change.Scheduldes
2. CASH AND CASH EqUIVALENTS :
(Amount in Lakhs)
Particulars As at 31-Mar-19
As at 31-Mar-18
As at 01-Apr-17
Balances with banks 151.74 619.44 15.79
Sub total 151.74 619.44 15.79
Less: Impairment loss allowance (0.05) (0.18) (0.01)
Total 151.69 619.26 15.78
3 RECEIVABLES :
(Amount in Lakhs)
Particulars As at 31-Mar-19
As at 31-Mar-18
As at 01-Apr-17
Trade receivables:
Unsecured, considered good 3,858.46 5,712.87 2,864.38
Sub total 3,858.46 5,712.87 2,864.38
Less: Impairment loss allowance (19.38) (18.63) (8.12)
Total 3,839.08 5,694.24 2,856.26
Other receivables:
Unsecured, considered good 17.13 20.60 16.95
Sub total 17.13 20.60 16.95
Less: Impairment loss allowance - - -
Total 17.13 20.60 16.95
4 LOANS :
(Amount in Lakhs)Particulars As at
31-Mar-19As at
31-Mar-18As at
01-Apr-17(A)(i) Employee Loan 47.75 19.83 38.16 Total Gross (A) 47.75 19.83 38.16 Less: Impairment loss allowance (0.31) (0.13) (0.46)Total Net (A) 47.44 19.70 37.70 (B)(i) Unsecured 47.75 19.83 38.16 Total Gross (B) 47.75 19.83 38.16 Less: Impairment loss allowance (0.31) (0.13) (0.46)Total Net (B) 47.44 19.70 37.70 (C)(I) Loans in India (i) Public Sector - - - (ii) Others 47.75 19.83 38.16 Total Gross (C) (I) 47.75 19.83 38.16 Less: Impairment loss allowance (0.31) (0.13) (0.46)Total Net (C) (I) 47.44 19.70 37.70 (II) Loans outside India - - - Less: Impairment allowance - - - Total Net (C) (II) - - - Total (C) (I) and (II) 47.44 19.70 37.70
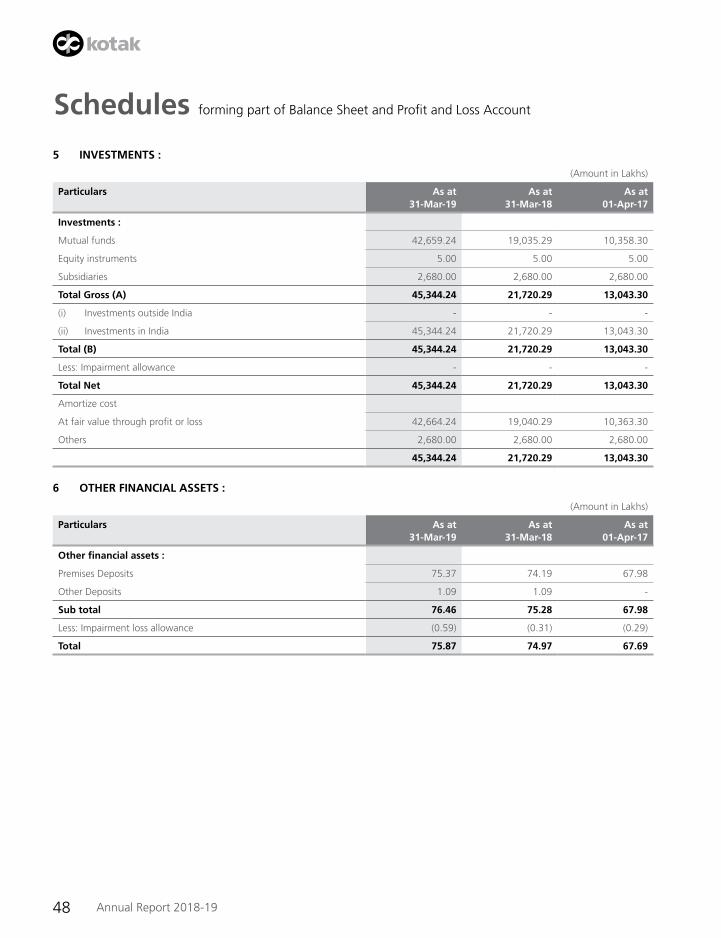
48 Annual Report 2018-19
Schedules forming part of Balance Sheet and Profit and Loss Account
5 INVESTMENTS :
(Amount in Lakhs)
Particulars As at 31-Mar-19
As at 31-Mar-18
As at 01-Apr-17
Investments :
Mutual funds 42,659.24 19,035.29 10,358.30
Equity instruments 5.00 5.00 5.00
Subsidiaries 2,680.00 2,680.00 2,680.00
Total Gross (A) 45,344.24 21,720.29 13,043.30
(i) Investments outside India - - -
(ii) Investments in India 45,344.24 21,720.29 13,043.30
Total (B) 45,344.24 21,720.29 13,043.30
Less: Impairment allowance - - -
Total Net 45,344.24 21,720.29 13,043.30
Amortize cost
At fair value through profit or loss 42,664.24 19,040.29 10,363.30
Others 2,680.00 2,680.00 2,680.00
45,344.24 21,720.29 13,043.30
6 OTHER FINANCIAL ASSETS :
(Amount in Lakhs)
Particulars As at 31-Mar-19
As at 31-Mar-18
As at 01-Apr-17
Other financial assets :
Premises Deposits 75.37 74.19 67.98
Other Deposits 1.09 1.09 -
Sub total 76.46 75.28 67.98
Less: Impairment loss allowance (0.59) (0.31) (0.29)
Total 75.87 74.97 67.69
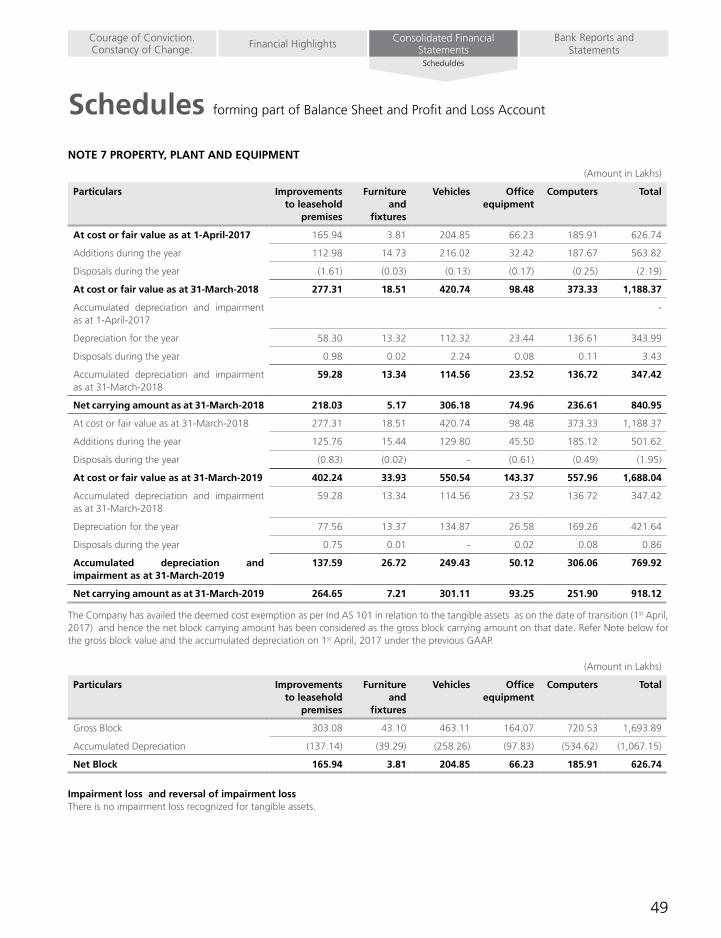
49
Schedules forming part of Balance Sheet and Profit and Loss Account
Bank Reports and Statements
Consolidated Financial StatementsFinancial HighlightsCourage of Conviction.
Constancy of Change.Scheduldes
NOTE 7 PROPERTY, PLANT AND EqUIPMENT
(Amount in Lakhs)
Particulars Improvements to leasehold
premises
Furniture and
fixtures
Vehicles Office equipment
Computers Total
At cost or fair value as at 1-April-2017 165.94 3.81 204.85 66.23 185.91 626.74
Additions during the year 112.98 14.73 216.02 32.42 187.67 563.82
Disposals during the year (1.61) (0.03) (0.13) (0.17) (0.25) (2.19)
At cost or fair value as at 31-March-2018 277.31 18.51 420.74 98.48 373.33 1,188.37
Accumulated depreciation and impairment as at 1-April-2017
-
Depreciation for the year 58.30 13.32 112.32 23.44 136.61 343.99
Disposals during the year 0.98 0.02 2.24 0.08 0.11 3.43
Accumulated depreciation and impairment as at 31-March-2018
59.28 13.34 114.56 23.52 136.72 347.42
Net carrying amount as at 31-March-2018 218.03 5.17 306.18 74.96 236.61 840.95
At cost or fair value as at 31-March-2018 277.31 18.51 420.74 98.48 373.33 1,188.37
Additions during the year 125.76 15.44 129.80 45.50 185.12 501.62
Disposals during the year (0.83) (0.02) - (0.61) (0.49) (1.95)
At cost or fair value as at 31-March-2019 402.24 33.93 550.54 143.37 557.96 1,688.04
Accumulated depreciation and impairment as at 31-March-2018
59.28 13.34 114.56 23.52 136.72 347.42
Depreciation for the year 77.56 13.37 134.87 26.58 169.26 421.64
Disposals during the year 0.75 0.01 - 0.02 0.08 0.86
Accumulated depreciation and impairment as at 31-March-2019
137.59 26.72 249.43 50.12 306.06 769.92
Net carrying amount as at 31-March-2019 264.65 7.21 301.11 93.25 251.90 918.12
The Company has availed the deemed cost exemption as per Ind AS 101 in relation to the tangible assets as on the date of transition (1st April, 2017) and hence the net block carrying amount has been considered as the gross block carrying amount on that date. Refer Note below for the gross block value and the accumulated depreciation on 1st April, 2017 under the previous GAAP.
(Amount in Lakhs)
Particulars Improvements to leasehold
premises
Furniture and
fixtures
Vehicles Office equipment
Computers Total
Gross Block 303.08 43.10 463.11 164.07 720.53 1,693.89
Accumulated Depreciation (137.14) (39.29) (258.26) (97.83) (534.62) (1,067.15)
Net Block 165.94 3.81 204.85 66.23 185.91 626.74
Impairment loss and reversal of impairment lossThere is no impairment loss recognized for tangible assets.

50 Annual Report 2018-19
Schedules forming part of Balance Sheet and Profit and Loss Account
NOTE 8 INTANGIBLE ASSETS
(Amount in Lakhs)
Particulars Software Copyrights, patents, other intellectual
property rights, services and operating rights *
Total
At cost or fair value as at 1-April-2017 374.28 901.77 1,276.05
Additions during the year 203.12 - 203.12
Disposals during the year - - -
At cost or fair value as at 31-March-2018 577.40 901.77 1,479.17
Accumulated depreciation and impairment as at 1-April-2017 -
Depreciation for the year 241.98 318.02 560.00
Disposals during the year - - -
Accumulated depreciation and impairment as at 31-March-2018 241.98 318.02 560.00
Net carrying amount as at 31-March-2018 335.42 583.75 919.17
At cost or fair value as at 31-March-2018 577.40 901.77 1,479.17
Additions during the year 250.12 - 250.12
Disposals during the year - - -
At cost or fair value as at 31-March-2019 827.52 901.77 1,729.29
Accumulated depreciation and impairment as at 31-March-2018 241.98 318.02 560.00
Depreciation for the year 234.24 318.02 552.26
Disposals during the year - - -
Accumulated depreciation and impairment as at 31-March-2019 476.22 636.04 1,112.26
Net carrying amount as at 31-March-2019 351.30 265.73 617.03
The Company has availed the deemed cost exemption as per Ind AS 101 in relation to the intangible assets as on the date of transition (1st April, 2017) and hence the net block carrying amount has been considered as the gross block carrying amount on that date. Refer Note below for the gross block value and the accumulated depreciation on 1st April, 2017 under the previous GAAP.
(Amount in Lakhs)
Particulars Software Copyrights, patents, other intellectual
property rights, services and operating rights *
Total
Gross Block 926.87 1,590.08 2,516.95
Accumulated Depreciation (552.59) (688.31) (1,240.90)
Net Block 374.28 901.77 1,276.05
* This contains, the asset management rights acquired which are amortized over a period of 5 years from the date of acquisition of the schemes, which is the period over which it is estimated that the benefits will flow to the Company.
Impairment loss and reversal of impairment lossThere is no impairment loss recognized for intangible assets.
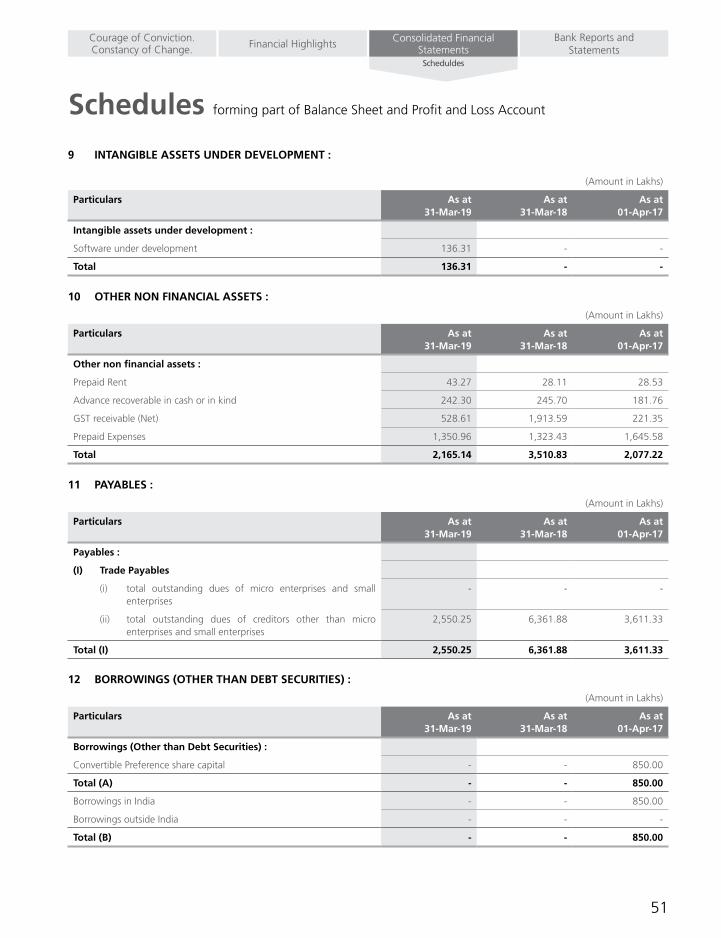
51
Schedules forming part of Balance Sheet and Profit and Loss Account
Bank Reports and Statements
Consolidated Financial StatementsFinancial HighlightsCourage of Conviction.
Constancy of Change.Scheduldes
9 INTANGIBLE ASSETS UNDER DEVELOPMENT :
(Amount in Lakhs)
Particulars As at 31-Mar-19
As at 31-Mar-18
As at 01-Apr-17
Intangible assets under development :
Software under development 136.31 - -
Total 136.31 - -
10 OTHER NON FINANCIAL ASSETS :
(Amount in Lakhs)
Particulars As at 31-Mar-19
As at 31-Mar-18
As at 01-Apr-17
Other non financial assets :
Prepaid Rent 43.27 28.11 28.53
Advance recoverable in cash or in kind 242.30 245.70 181.76
GST receivable (Net) 528.61 1,913.59 221.35
Prepaid Expenses 1,350.96 1,323.43 1,645.58
Total 2,165.14 3,510.83 2,077.22
11 PAYABLES :
(Amount in Lakhs)
Particulars As at 31-Mar-19
As at 31-Mar-18
As at 01-Apr-17
Payables :
(I) Trade Payables
(i) total outstanding dues of micro enterprises and small enterprises
- - -
(ii) total outstanding dues of creditors other than micro enterprises and small enterprises
2,550.25 6,361.88 3,611.33
Total (I) 2,550.25 6,361.88 3,611.33
12 BORROWINGS (OTHER THAN DEBT SECURITIES) :
(Amount in Lakhs)
Particulars As at 31-Mar-19
As at 31-Mar-18
As at 01-Apr-17
Borrowings (Other than Debt Securities) :
Convertible Preference share capital - - 850.00
Total (A) - - 850.00
Borrowings in India - - 850.00
Borrowings outside India - - -
Total (B) - - 850.00
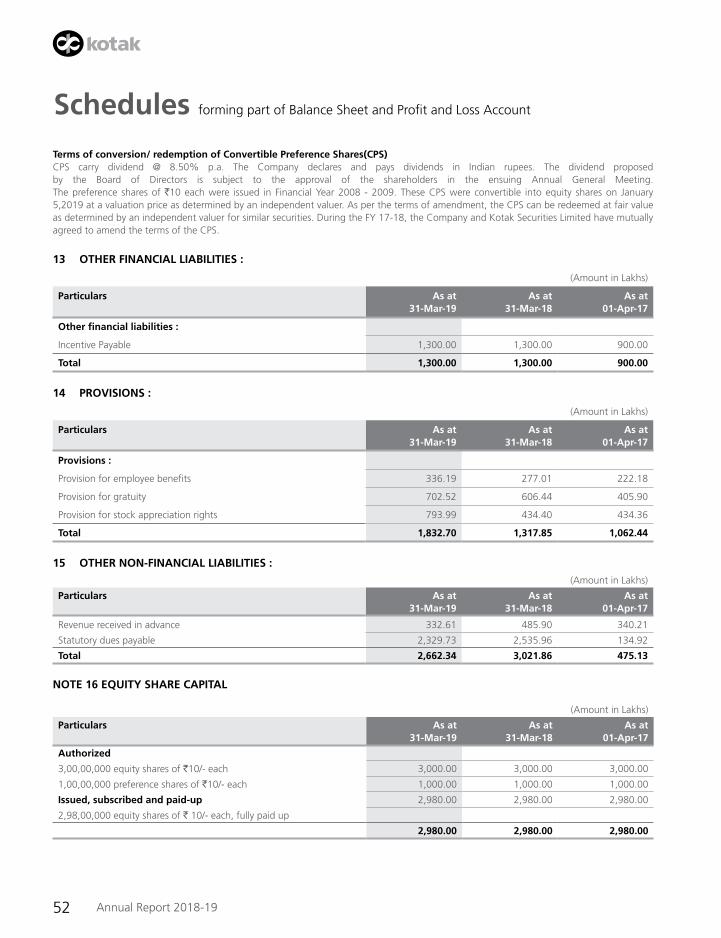
52 Annual Report 2018-19
Schedules forming part of Balance Sheet and Profit and Loss Account
Terms of conversion/ redemption of Convertible Preference Shares(CPS)CPS carry dividend @ 8.50% p.a. The Company declares and pays dividends in Indian rupees. The dividend proposed by the Board of Directors is subject to the approval of the shareholders in the ensuing Annual General Meeting. The preference shares of `10 each were issued in Financial Year 2008 - 2009. These CPS were convertible into equity shares on January 5,2019 at a valuation price as determined by an independent valuer. As per the terms of amendment, the CPS can be redeemed at fair value as determined by an independent valuer for similar securities. During the FY 17-18, the Company and Kotak Securities Limited have mutually agreed to amend the terms of the CPS.
13 OTHER FINANCIAL LIABILITIES :
(Amount in Lakhs)
Particulars As at 31-Mar-19
As at 31-Mar-18
As at 01-Apr-17
Other financial liabilities :
Incentive Payable 1,300.00 1,300.00 900.00
Total 1,300.00 1,300.00 900.00
14 PROVISIONS :
(Amount in Lakhs)
Particulars As at 31-Mar-19
As at 31-Mar-18
As at 01-Apr-17
Provisions :
Provision for employee benefits 336.19 277.01 222.18
Provision for gratuity 702.52 606.44 405.90
Provision for stock appreciation rights 793.99 434.40 434.36
Total 1,832.70 1,317.85 1,062.44
15 OTHER NON-FINANCIAL LIABILITIES :
(Amount in Lakhs)
Particulars As at 31-Mar-19
As at 31-Mar-18
As at 01-Apr-17
Revenue received in advance 332.61 485.90 340.21
Statutory dues payable 2,329.73 2,535.96 134.92
Total 2,662.34 3,021.86 475.13
NOTE 16 EqUITY SHARE CAPITAL
(Amount in Lakhs)
Particulars As at 31-Mar-19
As at 31-Mar-18
As at 01-Apr-17
Authorized
3,00,00,000 equity shares of `10/- each 3,000.00 3,000.00 3,000.00
1,00,00,000 preference shares of `10/- each 1,000.00 1,000.00 1,000.00
Issued, subscribed and paid-up 2,980.00 2,980.00 2,980.00
2,98,00,000 equity shares of ` 10/- each, fully paid up
2,980.00 2,980.00 2,980.00
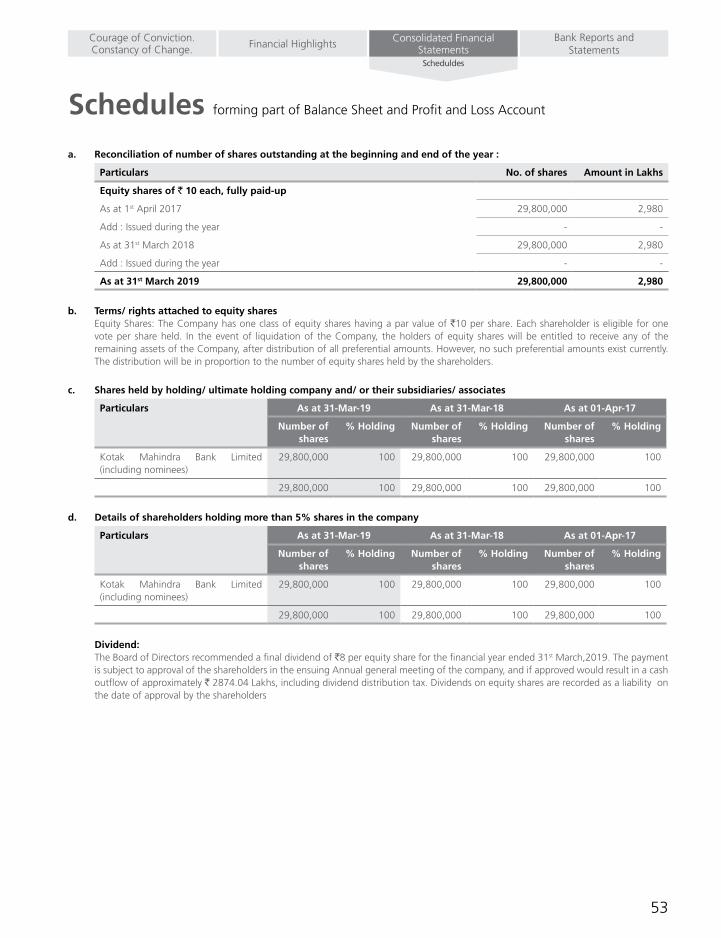
53
Schedules forming part of Balance Sheet and Profit and Loss Account
Bank Reports and Statements
Consolidated Financial StatementsFinancial HighlightsCourage of Conviction.
Constancy of Change.Scheduldes
a. Reconciliation of number of shares outstanding at the beginning and end of the year :
Particulars No. of shares Amount in Lakhs
Equity shares of ` 10 each, fully paid-up
As at 1st April 2017 29,800,000 2,980
Add : Issued during the year - -
As at 31st March 2018 29,800,000 2,980
Add : Issued during the year - -
As at 31st March 2019 29,800,000 2,980
b. Terms/ rights attached to equity shares Equity Shares: The Company has one class of equity shares having a par value of `10 per share. Each shareholder is eligible for one
vote per share held. In the event of liquidation of the Company, the holders of equity shares will be entitled to receive any of the remaining assets of the Company, after distribution of all preferential amounts. However, no such preferential amounts exist currently. The distribution will be in proportion to the number of equity shares held by the shareholders.
c. Shares held by holding/ ultimate holding company and/ or their subsidiaries/ associates
Particulars As at 31-Mar-19 As at 31-Mar-18 As at 01-Apr-17
Number of shares
% Holding Number of shares
% Holding Number of shares
% Holding
Kotak Mahindra Bank Limited (including nominees)
29,800,000 100 29,800,000 100 29,800,000 100
29,800,000 100 29,800,000 100 29,800,000 100
d. Details of shareholders holding more than 5% shares in the company
Particulars As at 31-Mar-19 As at 31-Mar-18 As at 01-Apr-17
Number of shares
% Holding Number of shares
% Holding Number of shares
% Holding
Kotak Mahindra Bank Limited (including nominees)
29,800,000 100 29,800,000 100 29,800,000 100
29,800,000 100 29,800,000 100 29,800,000 100
Dividend: The Board of Directors recommended a final dividend of `8 per equity share for the financial year ended 31st March,2019. The payment
is subject to approval of the shareholders in the ensuing Annual general meeting of the company, and if approved would result in a cash outflow of approximately ` 2874.04 Lakhs, including dividend distribution tax. Dividends on equity shares are recorded as a liability on the date of approval by the shareholders

54 Annual Report 2018-19
Schedules forming part of Balance Sheet and Profit and Loss Account
17 OTHER EqUITY :
(Amount in Lakhs)
Particulars As at 31-Mar-19
As at 31-Mar-18
As at 01-Apr-17
Capital redemption reserve 1,270.00 1,270.00 420.00
Capital Contribution from parent 741.56 301.08 141.53
General Reserve 1,169.25 1,169.25 1,169.25
Surplus in Statement of Profit and Loss 40,568.76 17,703.16 10,458.88
Total 43,749.57 20,443.49 12,189.66
17.1 NATURE AND PURPOSE OF RESERVE
Capital redemption reserve Capital redemption reserve is created on redemption/buy back of preference/equity share capital. Capital redemption reserve includes
transfer from General reserve on redemption/buy back of preference / equity shares.”
Capital Contribution from parent Capital Contribution from parent represents fair value of the employee stock options plan. The option are issued by the parent company
Kotak Mahindra Bank Limited” to the employees of the Company.
General reserve General Reserve represents appropriation of retained earnings and is available for distribution to the shareholders.
Surplus in Statement of Profit and Loss Surplus in Statement of Profit and Loss represents surplus/deficit of the company and is available for distribution to the shareholders.
REVENUE FROM OPERATIONS
18 INTEREST INCOME :
(Amount in Lakhs)
Particulars For the Year ended 31st March, 2019
For the Year ended 31st March, 2018
Other interest income 2.17 5.86
Total 2.17 5.86
19 FEES AND COMMISSION INCOME
(Amount in Lakhs)
Particulars For the Year ended 31st March, 2019
For the Year ended 31st March, 2018
Management fees 55,442.52 42,545.86
Portfolio advisory services 493.98 442.71
Portfolio management services 9,171.15 7,210.87
Total 65,107.65 50,199.44
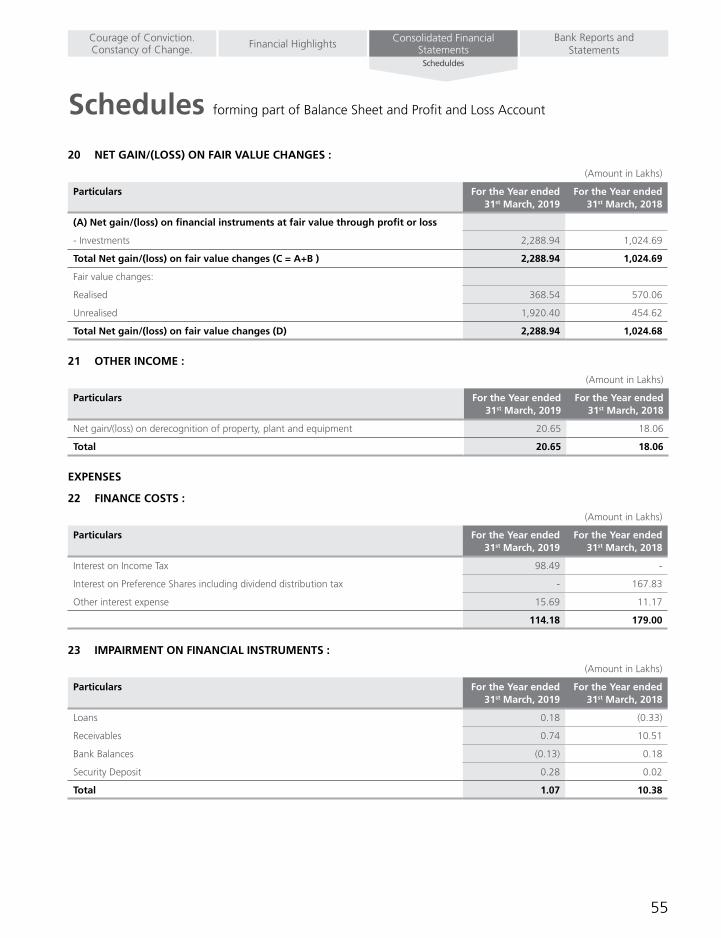
55
Schedules forming part of Balance Sheet and Profit and Loss Account
Bank Reports and Statements
Consolidated Financial StatementsFinancial HighlightsCourage of Conviction.
Constancy of Change.Scheduldes
20 NET GAIN/(LOSS) ON FAIR VALUE CHANGES :
(Amount in Lakhs)
Particulars For the Year ended 31st March, 2019
For the Year ended 31st March, 2018
(A) Net gain/(loss) on financial instruments at fair value through profit or loss
- Investments 2,288.94 1,024.69
Total Net gain/(loss) on fair value changes (C = A+B ) 2,288.94 1,024.69
Fair value changes:
Realised 368.54 570.06
Unrealised 1,920.40 454.62
Total Net gain/(loss) on fair value changes (D) 2,288.94 1,024.68
21 OTHER INCOME :
(Amount in Lakhs)
Particulars For the Year ended 31st March, 2019
For the Year ended 31st March, 2018
Net gain/(loss) on derecognition of property, plant and equipment 20.65 18.06
Total 20.65 18.06
EXPENSES
22 FINANCE COSTS :
(Amount in Lakhs)
Particulars For the Year ended 31st March, 2019
For the Year ended 31st March, 2018
Interest on Income Tax 98.49 -
Interest on Preference Shares including dividend distribution tax - 167.83
Other interest expense 15.69 11.17
114.18 179.00
23 IMPAIRMENT ON FINANCIAL INSTRUMENTS :
(Amount in Lakhs)
Particulars For the Year ended 31st March, 2019
For the Year ended 31st March, 2018
Loans 0.18 (0.33)
Receivables 0.74 10.51
Bank Balances (0.13) 0.18
Security Deposit 0.28 0.02
Total 1.07 10.38
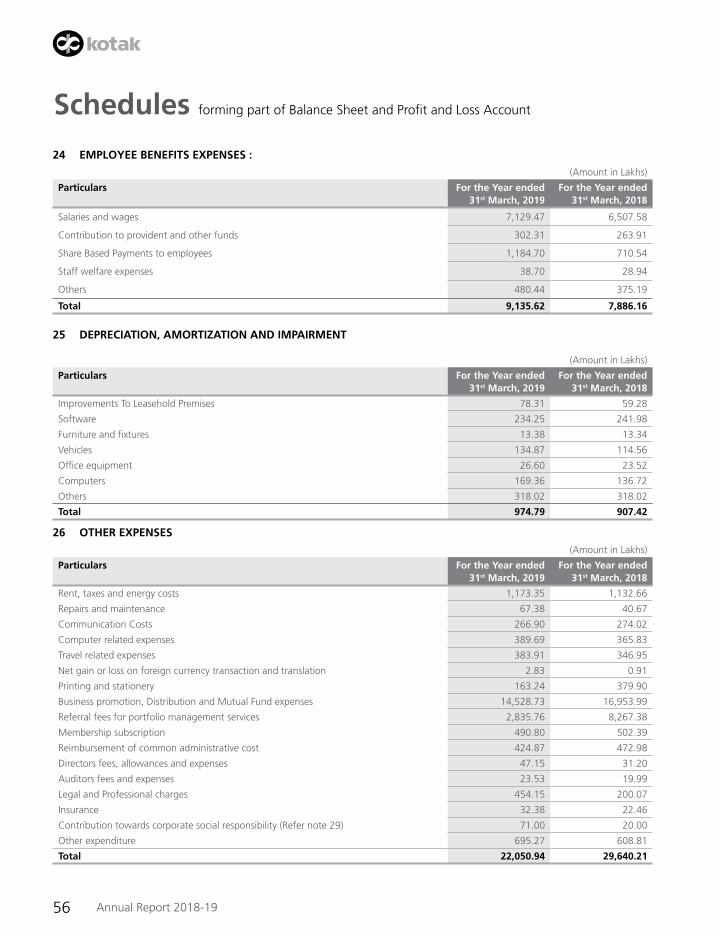
56 Annual Report 2018-19
Schedules forming part of Balance Sheet and Profit and Loss Account
24 EMPLOYEE BENEFITS EXPENSES :
(Amount in Lakhs)
Particulars For the Year ended 31st March, 2019
For the Year ended 31st March, 2018
Salaries and wages 7,129.47 6,507.58
Contribution to provident and other funds 302.31 263.91
Share Based Payments to employees 1,184.70 710.54
Staff welfare expenses 38.70 28.94
Others 480.44 375.19
Total 9,135.62 7,886.16
25 DEPRECIATION, AMORTIzATION AND IMPAIRMENT
(Amount in Lakhs)
Particulars For the Year ended 31st March, 2019
For the Year ended 31st March, 2018
Improvements To Leasehold Premises 78.31 59.28
Software 234.25 241.98
Furniture and fixtures 13.38 13.34
Vehicles 134.87 114.56
Office equipment 26.60 23.52
Computers 169.36 136.72
Others 318.02 318.02
Total 974.79 907.42
26 OTHER EXPENSES
(Amount in Lakhs)
Particulars For the Year ended 31st March, 2019
For the Year ended 31st March, 2018
Rent, taxes and energy costs 1,173.35 1,132.66
Repairs and maintenance 67.38 40.67
Communication Costs 266.90 274.02
Computer related expenses 389.69 365.83
Travel related expenses 383.91 346.95
Net gain or loss on foreign currency transaction and translation 2.83 0.91
Printing and stationery 163.24 379.90
Business promotion, Distribution and Mutual Fund expenses 14,528.73 16,953.99
Referral fees for portfolio management services 2,835.76 8,267.38
Membership subscription 490.80 502.39
Reimbursement of common administrative cost 424.87 472.98
Directors fees, allowances and expenses 47.15 31.20
Auditors fees and expenses 23.53 19.99
Legal and Professional charges 454.15 200.07
Insurance 32.38 22.46
Contribution towards corporate social responsibility (Refer note 29) 71.00 20.00
Other expenditure 695.27 608.81
Total 22,050.94 29,640.21
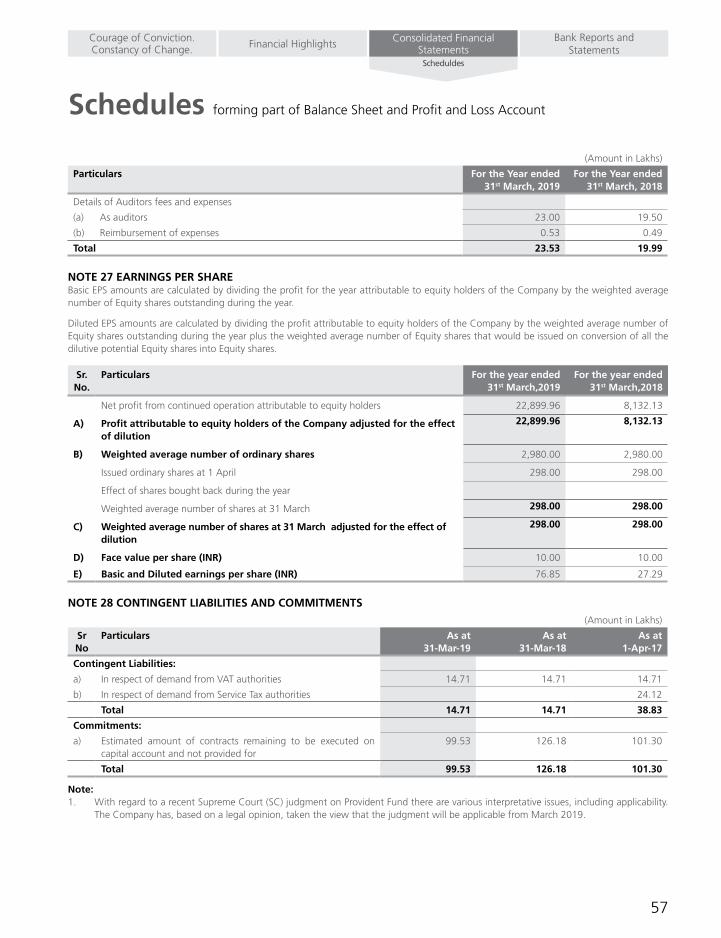
57
Schedules forming part of Balance Sheet and Profit and Loss Account
Bank Reports and Statements
Consolidated Financial StatementsFinancial HighlightsCourage of Conviction.
Constancy of Change.Scheduldes
(Amount in Lakhs)
Particulars For the Year ended 31st March, 2019
For the Year ended 31st March, 2018
Details of Auditors fees and expenses
(a) As auditors 23.00 19.50
(b) Reimbursement of expenses 0.53 0.49
Total 23.53 19.99
NOTE 27 EARNINGS PER SHAREBasic EPS amounts are calculated by dividing the profit for the year attributable to equity holders of the Company by the weighted average number of Equity shares outstanding during the year.
Diluted EPS amounts are calculated by dividing the profit attributable to equity holders of the Company by the weighted average number of Equity shares outstanding during the year plus the weighted average number of Equity shares that would be issued on conversion of all the dilutive potential Equity shares into Equity shares.
Sr. No.
Particulars For the year ended 31st March,2019
For the year ended 31st March,2018
Net profit from continued operation attributable to equity holders 22,899.96 8,132.13
A) Profit attributable to equity holders of the Company adjusted for the effect of dilution
22,899.96 8,132.13
B) Weighted average number of ordinary shares 2,980.00 2,980.00
Issued ordinary shares at 1 April 298.00 298.00
Effect of shares bought back during the year
Weighted average number of shares at 31 March 298.00 298.00
C) Weighted average number of shares at 31 March adjusted for the effect of dilution
298.00 298.00
D) Face value per share (INR) 10.00 10.00
E) Basic and Diluted earnings per share (INR) 76.85 27.29
NOTE 28 CONTINGENT LIABILITIES AND COMMITMENTS
(Amount in Lakhs)
Sr No
Particulars As at 31-Mar-19
As at 31-Mar-18
As at 1-Apr-17
Contingent Liabilities:
a) InrespectofdemandfromVATauthorities 14.71 14.71 14.71
b) In respect of demand from Service Tax authorities 24.12
Total 14.71 14.71 38.83
Commitments:
a) Estimated amount of contracts remaining to be executed on capital account and not provided for
99.53 126.18 101.30
Total 99.53 126.18 101.30
Note:1. With regard to a recent Supreme Court (SC) judgment on Provident Fund there are various interpretative issues, including applicability.
The Company has, based on a legal opinion, taken the view that the judgment will be applicable from March 2019.
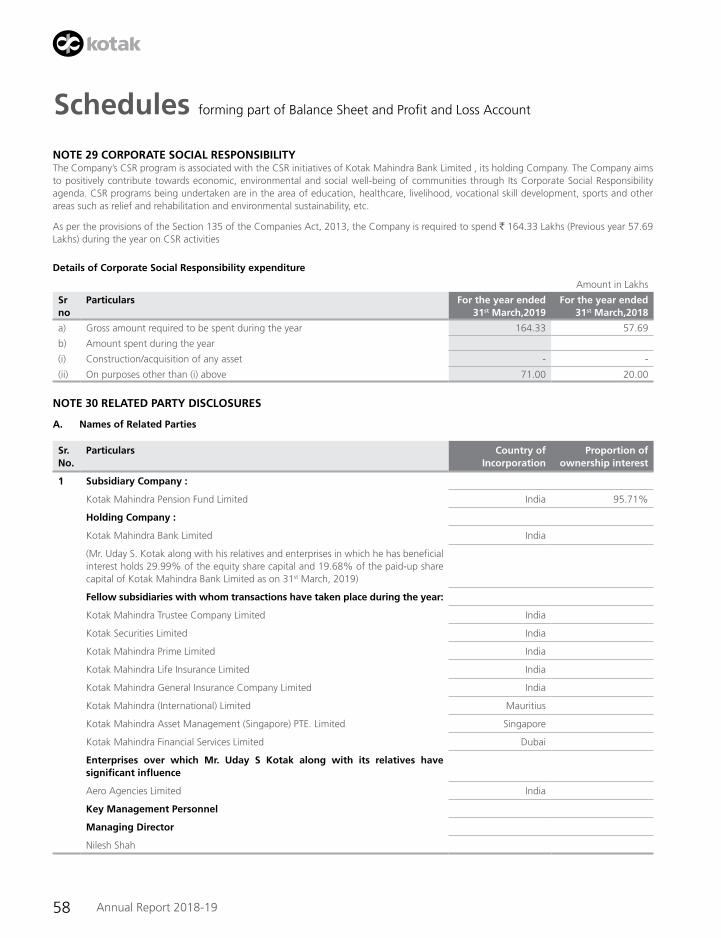
58 Annual Report 2018-19
Schedules forming part of Balance Sheet and Profit and Loss Account
NOTE 29 CORPORATE SOCIAL RESPONSIBILITYTheCompany’sCSRprogramisassociatedwiththeCSRinitiativesofKotakMahindraBankLimited,itsholdingCompany.TheCompanyaimsto positively contribute towards economic, environmental and social well-being of communities through Its Corporate Social Responsibility agenda. CSR programs being undertaken are in the area of education, healthcare, livelihood, vocational skill development, sports and other areas such as relief and rehabilitation and environmental sustainability, etc.
As per the provisions of the Section 135 of the Companies Act, 2013, the Company is required to spend ` 164.33 Lakhs (Previous year 57.69 Lakhs) during the year on CSR activities
Details of Corporate Social Responsibility expenditure
Amount in Lakhs
Sr no
Particulars For the year ended 31st March,2019
For the year ended 31st March,2018
a) Gross amount required to be spent during the year 164.33 57.69
b) Amount spent during the year
(i) Construction/acquisition of any asset - -
(ii) On purposes other than (i) above 71.00 20.00
NOTE 30 RELATED PARTY DISCLOSURES
A. Names of Related Parties
Sr. No.
Particulars Country of Incorporation
Proportion of ownership interest
1 Subsidiary Company :
Kotak Mahindra Pension Fund Limited India 95.71%
Holding Company :
Kotak Mahindra Bank Limited India
(Mr. Uday S. Kotak along with his relatives and enterprises in which he has beneficial interest holds 29.99% of the equity share capital and 19.68% of the paid-up share capital of Kotak Mahindra Bank Limited as on 31st March, 2019)
Fellow subsidiaries with whom transactions have taken place during the year:
Kotak Mahindra Trustee Company Limited India
Kotak Securities Limited India
Kotak Mahindra Prime Limited India
Kotak Mahindra Life Insurance Limited India
Kotak Mahindra General Insurance Company Limited India
Kotak Mahindra (International) Limited Mauritius
Kotak Mahindra Asset Management (Singapore) PTE. Limited Singapore
Kotak Mahindra Financial Services Limited Dubai
Enterprises over which Mr. Uday S Kotak along with its relatives have significant influence
Aero Agencies Limited India
Key Management Personnel
Managing Director
Nilesh Shah

59
Schedules forming part of Balance Sheet and Profit and Loss Account
Bank Reports and Statements
Consolidated Financial StatementsFinancial HighlightsCourage of Conviction.
Constancy of Change.Scheduldes
Sr. No.
Particulars Country of Incorporation
Proportion of ownership interest
Independent Director
Anjali Bansal
Bipin R Shah
C Jayaram
Nalin Shah
Sanjiv Malhotra
Sukant Kelkar
B. Transactions with Key Management Personnel
i. Key Management Personnel compensation
S r . No.
Particulars For the Year ended 31st March, 2019
For the Year ended 31st March, 2018
Managing Director
i. Short-term employee benefits 259.88 240.17
ii. Post-employment defined benefit 11.14 10.18
iii. Shared-based payments 174.39 432.03
Independent Director
i. Director Sitting Fees 23.40 16.20
ii. Director Commission 23.75 15.00
Note30aboveprovidestheinformationabouttheCompany’sstructure,includingthedetailsofthesubsidiariesandtheholdingcompany.The following table provides the total amount of transactions that have been entered into with related parties for the relevant financial year:
INR (In Lakhs)
Nature of Transaction Year ended March 31
Holding Company
Fellow Subsidiaries
Enterprises over which Director / relatives
/ Key Management Personnel have
significant influence
Kotak Mahindra
Pension Fund Subsidiary
Balance in Current Account 2019 61.80
2018 618.62
2017 4.73
Equity Shares
Equity Share Capital 2019 2,980.00
2018 2,980.00
2017 2,980.00
Kotak Securities Limited
Preference Share Capital 2019 -
2018 -
2017 850.00
Redemption during the year 2019 -
2018 850.00
2017 -
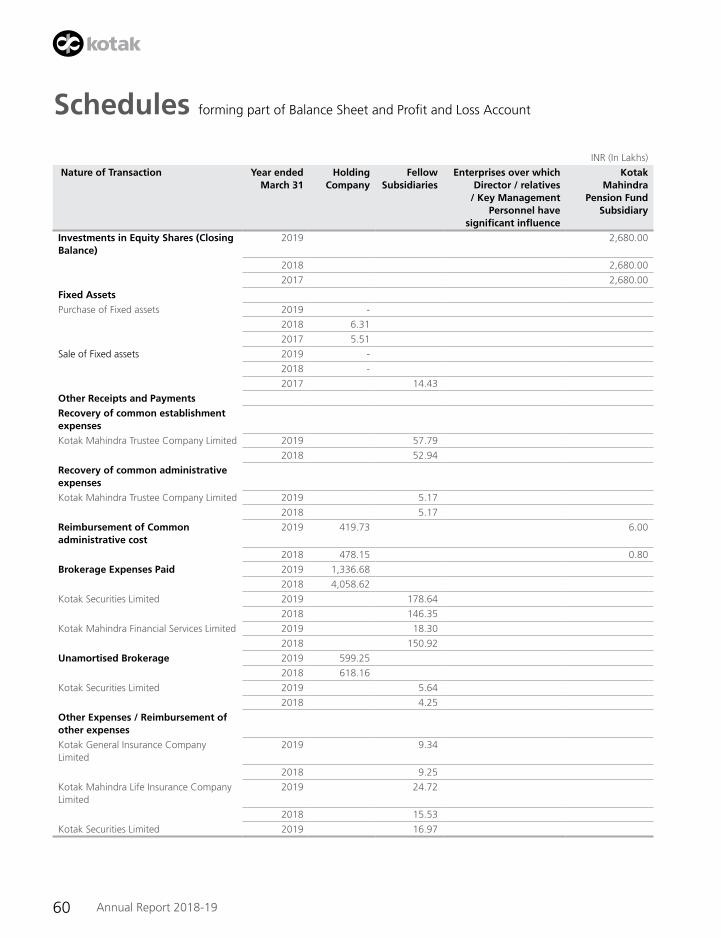
60 Annual Report 2018-19
Schedules forming part of Balance Sheet and Profit and Loss Account
INR (In Lakhs)
Nature of Transaction Year ended March 31
Holding Company
Fellow Subsidiaries
Enterprises over which Director / relatives
/ Key Management Personnel have
significant influence
Kotak Mahindra
Pension Fund Subsidiary
Investments in Equity Shares (Closing Balance)
2019 2,680.00
2018 2,680.00
2017 2,680.00
Fixed Assets
Purchase of Fixed assets 2019 -
2018 6.31
2017 5.51
Sale of Fixed assets 2019 -
2018 -
2017 14.43
Other Receipts and Payments
Recovery of common establishment expenses
Kotak Mahindra Trustee Company Limited 2019 57.79
2018 52.94
Recovery of common administrative expenses
Kotak Mahindra Trustee Company Limited 2019 5.17
2018 5.17
Reimbursement of Common administrative cost
2019 419.73 6.00
2018 478.15 0.80
Brokerage Expenses Paid 2019 1,336.68
2018 4,058.62
Kotak Securities Limited 2019 178.64
2018 146.35
Kotak Mahindra Financial Services Limited 2019 18.30
2018 150.92
Unamortised Brokerage 2019 599.25
2018 618.16
Kotak Securities Limited 2019 5.64
2018 4.25
Other Expenses / Reimbursement of other expenses
Kotak General Insurance Company Limited
2019 9.34
2018 9.25
Kotak Mahindra Life Insurance Company Limited
2019 24.72
2018 15.53
Kotak Securities Limited 2019 16.97

61
Schedules forming part of Balance Sheet and Profit and Loss Account
Bank Reports and Statements
Consolidated Financial StatementsFinancial HighlightsCourage of Conviction.
Constancy of Change.Scheduldes
INR (In Lakhs)
Nature of Transaction Year ended March 31
Holding Company
Fellow Subsidiaries
Enterprises over which Director / relatives
/ Key Management Personnel have
significant influence
Kotak Mahindra
Pension Fund Subsidiary
2018 19.80
Kotak Mahindra Prime Limited 2019 1.42
2018 0.58
Kotak Mahindra Trustee Company Limited 2019 3.60
2018 -
Rent Paid 2019 680.45
2018 690.60
Kotak Mahindra Prime Limited 2019 2.40
2018 2.13
Aero Agencies Limited Cost of travel tickets purchased ( Net of Discount )
2019 37.79
2018 31.32
Advisory Fees
Kotak Mahindra International Limited 2019 331.00
2018 221.00
Kotak Mahindra Asset Management (Singapore) PTE. Limited
2019 127.00
2018 103.00
Miscellaneous Receipts 2019 11.74
2018 -
Kotak Securities Limited 2019 2.51
2018 0.26
Kotak Mahindra Life Insurance Company Limited
2019 -
2018 0.30
Kotak General Insurance Company Limited
2019 -
2018 0.38
Kotak Mahindra International Limited 2019 13.73
2018 -
Miscellaneous Payments 2019 922.21
2018 753.26
Dividend Paid Kotak Securities Limited 2019 -
2018 72.25
Other payments to Kotak Securities Limited
2019 6.40
2018 -
Other Miscellaneous Prepaid
Kotak Mahindra Life Insurance Company Limited
2019 -
2018 8.99
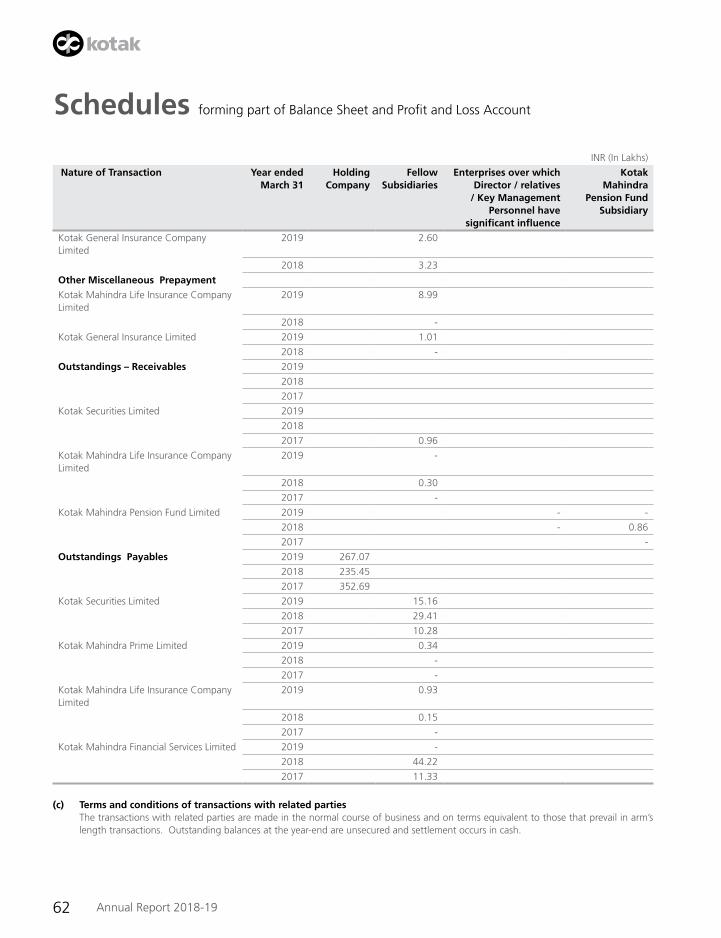
62 Annual Report 2018-19
Schedules forming part of Balance Sheet and Profit and Loss Account
INR (In Lakhs)
Nature of Transaction Year ended March 31
Holding Company
Fellow Subsidiaries
Enterprises over which Director / relatives
/ Key Management Personnel have
significant influence
Kotak Mahindra
Pension Fund Subsidiary
Kotak General Insurance Company Limited
2019 2.60
2018 3.23
Other Miscellaneous Prepayment
Kotak Mahindra Life Insurance Company Limited
2019 8.99
2018 -
Kotak General Insurance Limited 2019 1.01
2018 -
Outstandings – Receivables 2019
2018
2017
Kotak Securities Limited 2019
2018
2017 0.96
Kotak Mahindra Life Insurance Company Limited
2019 -
2018 0.30
2017 -
Kotak Mahindra Pension Fund Limited 2019 - -
2018 - 0.86
2017 -
Outstandings Payables 2019 267.07
2018 235.45
2017 352.69
Kotak Securities Limited 2019 15.16
2018 29.41
2017 10.28
Kotak Mahindra Prime Limited 2019 0.34
2018 -
2017 -
Kotak Mahindra Life Insurance Company Limited
2019 0.93
2018 0.15
2017 -
Kotak Mahindra Financial Services Limited 2019 -
2018 44.22
2017 11.33
(c) Terms and conditions of transactions with related parties Thetransactionswithrelatedpartiesaremadeinthenormalcourseofbusinessandontermsequivalenttothosethatprevailinarm’s
length transactions. Outstanding balances at the year-end are unsecured and settlement occurs in cash.

63
Schedules forming part of Balance Sheet and Profit and Loss Account
Bank Reports and Statements
Consolidated Financial StatementsFinancial HighlightsCourage of Conviction.
Constancy of Change.Scheduldes
NOTE 31 EMPLOYEE BENEFITS
A. The Company contributes to the following post-employment defined benefit plans in India.
(i) Defined Contribution Plans:a) The Company makes Provident Fund contributions to Recognized Provident Fund for employees. The Company is required to contribute
a specified percentage of the payroll costs to fund the benefits. The Company recognized `302.31 Lakh (Previous year ` 263.91 Lakh) for Provident Fund contributions in the Statement of Profit and Loss. The contributions payable to the Fund are at rates specified in the Rules of the Scheme.
b) The Company contributes a sum equivalent to 15% of basic subject to a maximum of ` 1 Lakh per annum per employee, of eligible employees’ eligible salary to a Superannuation Fund administered by trustees andmanaged by a fellow subsidiary. The Companyrecognizes `1 Lakhs (Previous year `1 Lakh) for such contributions as an expense in the year they are incurred. The Company has no obligation beyond its contribution to the Fund.
(ii) Defined Benefit Plan:
Gratuity :- The Company accounts for the liability for future gratuity benefits based on an independent actuarial valuation. The gratuity obligation
isunfunded.ThenetpresentvalueoftheCompany’sobligationtowardsthesameisdeterminedbasedontheProjectedUnitCreditmethod as at the Balance Sheet date.
A. Based on the actuarial valuation obtained in this respect, the following table sets out the status of the gratuity plan and the amounts recognizedintheCompany’sfinancialstatementsasatBalanceSheetdate:
As at 31-Mar-19
As at 31-Mar-18
As at 1-Apr-17
Present value of Unfunded defined benefit obligation (A) 702.52 606.44 405.90
Fair value of plan assets (B) - - -
Net (asset) / liability recognized in the Balance Sheet (A-B) 702.52 606.44 405.90
B. Movement in net defined benefit (asset) liability The following table shows a reconciliation from the opening balances to the closing balances for net defined benefit (asset) / liability and
its components:-
Defined benefit obligation
Fair value of plan assets Net defined benefit (asset)/liability
As at 31-Mar-19
As at 31-Mar-18
As at 31-Mar-19
As at 31-Mar-18
As at 31-Mar-19
As at 31-Mar-18
Opening balance 606.44 405.89 - - 606.44 405.89
Included in profit or loss
Current service cost 72.02 45.79 - - 72.02 45.79
Past service cost - 119.72 - - - 119.72
Interest cost (income) 43.54 27.64 - - 43.54 27.64
722.00 599.04 - - 722.00 599.04
Included in OCI
Remeasurement loss / (gain):
Actuarial loss / (gain) arising from:
Demographic assumptions (0.30) 58.95 - - (0.30) 58.95
Financial assumptions 33.95 (29.08) - - 33.95 (29.08)
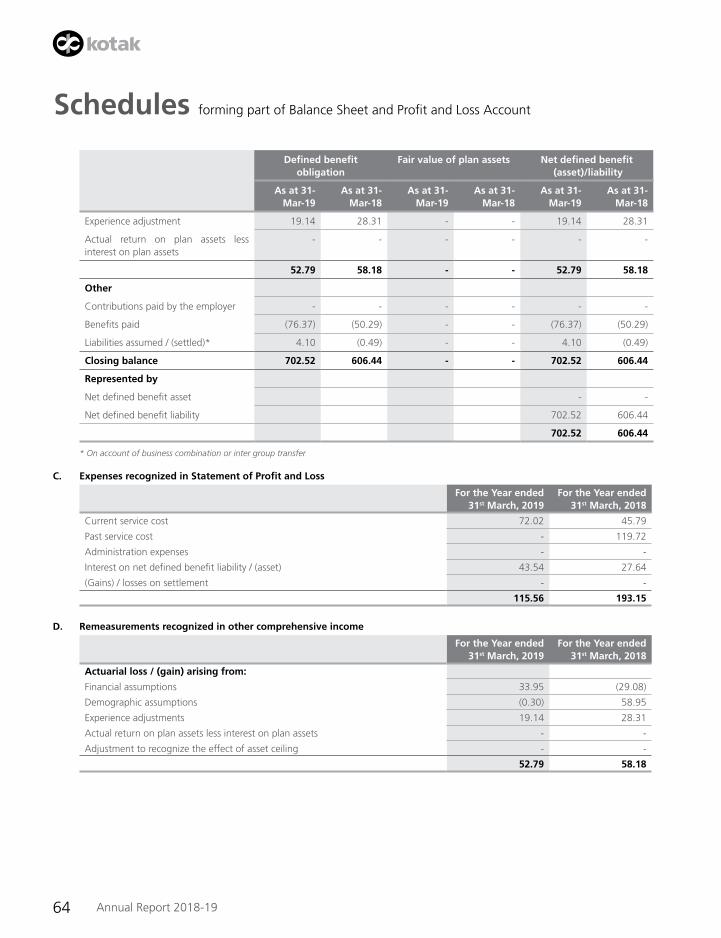
64 Annual Report 2018-19
Schedules forming part of Balance Sheet and Profit and Loss Account
Defined benefit obligation
Fair value of plan assets Net defined benefit (asset)/liability
As at 31-Mar-19
As at 31-Mar-18
As at 31-Mar-19
As at 31-Mar-18
As at 31-Mar-19
As at 31-Mar-18
Experience adjustment 19.14 28.31 - - 19.14 28.31
Actual return on plan assets less interest on plan assets
- - - - - -
52.79 58.18 - - 52.79 58.18
Other
Contributions paid by the employer - - - - - -
Benefits paid (76.37) (50.29) - - (76.37) (50.29)
Liabilities assumed / (settled)* 4.10 (0.49) - - 4.10 (0.49)
Closing balance 702.52 606.44 - - 702.52 606.44
Represented by
Net defined benefit asset - -
Net defined benefit liability 702.52 606.44
702.52 606.44
* On account of business combination or inter group transfer
C. Expenses recognized in Statement of Profit and Loss
For the Year ended 31st March, 2019
For the Year ended 31st March, 2018
Current service cost 72.02 45.79
Past service cost - 119.72
Administration expenses - -
Interest on net defined benefit liability / (asset) 43.54 27.64
(Gains) / losses on settlement - -
115.56 193.15
D. Remeasurements recognized in other comprehensive income
For the Year ended 31st March, 2019
For the Year ended 31st March, 2018
Actuarial loss / (gain) arising from:
Financial assumptions 33.95 (29.08)
Demographic assumptions (0.30) 58.95
Experience adjustments 19.14 28.31
Actual return on plan assets less interest on plan assets - -
Adjustment to recognize the effect of asset ceiling - -
52.79 58.18
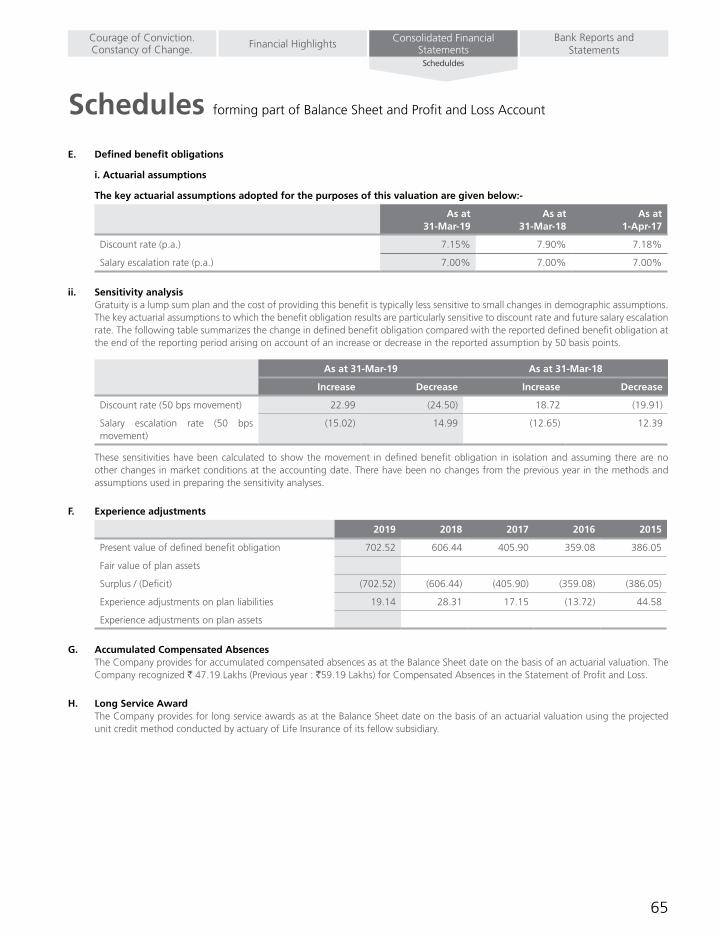
65
Schedules forming part of Balance Sheet and Profit and Loss Account
Bank Reports and Statements
Consolidated Financial StatementsFinancial HighlightsCourage of Conviction.
Constancy of Change.Scheduldes
E. Defined benefit obligations
i. Actuarial assumptions
The key actuarial assumptions adopted for the purposes of this valuation are given below:-
As at 31-Mar-19
As at 31-Mar-18
As at 1-Apr-17
Discount rate (p.a.) 7.15% 7.90% 7.18%
Salary escalation rate (p.a.) 7.00% 7.00% 7.00%
ii. Sensitivity analysis Gratuity is a lump sum plan and the cost of providing this benefit is typically less sensitive to small changes in demographic assumptions.
The key actuarial assumptions to which the benefit obligation results are particularly sensitive to discount rate and future salary escalation rate. The following table summarizes the change in defined benefit obligation compared with the reported defined benefit obligation at the end of the reporting period arising on account of an increase or decrease in the reported assumption by 50 basis points.
As at 31-Mar-19 As at 31-Mar-18
Increase Decrease Increase Decrease
Discount rate (50 bps movement) 22.99 (24.50) 18.72 (19.91)
Salary escalation rate (50 bps movement)
(15.02) 14.99 (12.65) 12.39
These sensitivities have been calculated to show the movement in defined benefit obligation in isolation and assuming there are no other changes in market conditions at the accounting date. There have been no changes from the previous year in the methods and assumptions used in preparing the sensitivity analyses.
F. Experience adjustments
2019 2018 2017 2016 2015
Present value of defined benefit obligation 702.52 606.44 405.90 359.08 386.05
Fair value of plan assets
Surplus / (Deficit) (702.52) (606.44) (405.90) (359.08) (386.05)
Experience adjustments on plan liabilities 19.14 28.31 17.15 (13.72) 44.58
Experience adjustments on plan assets
G. Accumulated Compensated Absences The Company provides for accumulated compensated absences as at the Balance Sheet date on the basis of an actuarial valuation. The
Company recognized ` 47.19 Lakhs (Previous year : `59.19 Lakhs) for Compensated Absences in the Statement of Profit and Loss.
H. Long Service Award The Company provides for long service awards as at the Balance Sheet date on the basis of an actuarial valuation using the projected
unit credit method conducted by actuary of Life Insurance of its fellow subsidiary.
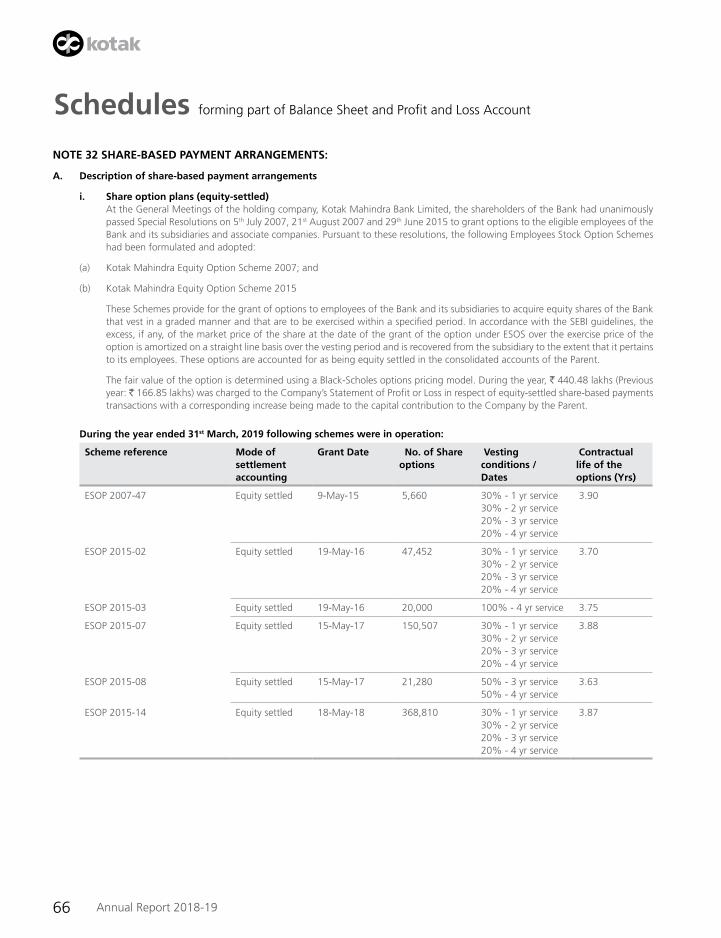
66 Annual Report 2018-19
Schedules forming part of Balance Sheet and Profit and Loss Account
NOTE 32 SHARE-BASED PAYMENT ARRANGEMENTS:
A. Description of share-based payment arrangements
i. Share option plans (equity-settled) At the General Meetings of the holding company, Kotak Mahindra Bank Limited, the shareholders of the Bank had unanimously
passed Special Resolutions on 5th July 2007, 21st August 2007 and 29th June 2015 to grant options to the eligible employees of the Bank and its subsidiaries and associate companies. Pursuant to these resolutions, the following Employees Stock Option Schemes had been formulated and adopted:
(a) Kotak Mahindra Equity Option Scheme 2007; and
(b) Kotak Mahindra Equity Option Scheme 2015
These Schemes provide for the grant of options to employees of the Bank and its subsidiaries to acquire equity shares of the Bank that vest in a graded manner and that are to be exercised within a specified period. In accordance with the SEBI guidelines, the excess, if any, of the market price of the share at the date of the grant of the option under ESOS over the exercise price of the option is amortized on a straight line basis over the vesting period and is recovered from the subsidiary to the extent that it pertains to its employees. These options are accounted for as being equity settled in the consolidated accounts of the Parent.
The fair value of the option is determined using a Black-Scholes options pricing model. During the year, ` 440.48 lakhs (Previous year: `166.85lakhs)waschargedtotheCompany’sStatementofProfitorLossinrespectofequity-settledshare-basedpaymentstransactions with a corresponding increase being made to the capital contribution to the Company by the Parent.
During the year ended 31st March, 2019 following schemes were in operation:
Scheme reference Mode of settlement accounting
Grant Date No. of Share options
Vesting conditions / Dates
Contractual life of the options (Yrs)
ESOP 2007-47 Equity settled 9-May-15 5,660 30% - 1 yr service 30% - 2 yr service 20% - 3 yr service 20% - 4 yr service
3.90
ESOP 2015-02 Equity settled 19-May-16 47,452 30% - 1 yr service 30% - 2 yr service 20% - 3 yr service 20% - 4 yr service
3.70
ESOP 2015-03 Equity settled 19-May-16 20,000 100% - 4 yr service 3.75
ESOP 2015-07 Equity settled 15-May-17 150,507 30% - 1 yr service 30% - 2 yr service 20% - 3 yr service 20% - 4 yr service
3.88
ESOP 2015-08 Equity settled 15-May-17 21,280 50% - 3 yr service 50% - 4 yr service
3.63
ESOP 2015-14 Equity settled 18-May-18 368,810 30% - 1 yr service 30% - 2 yr service 20% - 3 yr service 20% - 4 yr service
3.87

67
Schedules forming part of Balance Sheet and Profit and Loss Account
Bank Reports and Statements
Consolidated Financial StatementsFinancial HighlightsCourage of Conviction.
Constancy of Change.Scheduldes
Activity in the options outstanding under the Employee’s Stock Option Scheme are as follows:
Scheme reference Grant date Balance as at 01st April,
2018
Granted during the
year*
Exercised during the
year
Lapsed/cancelled during the
year**
Balance as at 31st
March, 2019
ESOP 2007-44 9-May-14 1,288 (1,288) - -
ESOP 2007-47 9-May-15 16,144 - (10,484) - 5,660
ESOP 2015-02 19-May-16 91,516 - (44,064) - 47,452
ESOP 2015-03 19-May-16 20,000 20,000
ESOP 2015-07 15-May-17 216,210 - (63,972) (1,731) 150,507
ESOP 2015-08 15-May-17 21,280 - - 21,280
ESOP 2015-14 18-May-18 368,810 - 368,810
366,438 368,810 (119,808) (1,731) 613,709
Scheme reference Grant date Balance as at 01st April, 2017
Granted during the
year*
Exercised during the
year
Lapsed/cancelled during the
year**
Balance as at 31st March, 2018
ESOP 2007-40 10-May-13 6,672 - (6,672) -
ESOP 2007-44 9-May-14 5,688 - (4,400) 1,288
ESOP 2007-47 9-May-15 30,008 (12,358) (1,506) 16,144
ESOP 2015-02 19-May-16 120,660 (27,723) (1,421) 91,516
ESOP 2015-03 19-May-16 20,000 20,000
ESOP 2015-07 15-May-17 218,260 - (2,050) 216,210
ESOP 2015-08 15-May-17 21,280 - 21,280
183,028 239,540 (51,153) (4,977) 366,438
*Includes transfer ins during the year
**Includes transfer outs during the year
The fair values were calculated using a Black-Scholes Model. The inputs were as follows:
Scheme Grant Date Exercise Price (INR)
Expected life (Years)
Annual Dividend
yield
Volatility Risk free rate Fair value per share
options (INR)
ESOP 2007-47 9-May-15 1,330.00 1.65 0.07% 27.61% 7.91% 267.02
ESOP 2007-47 9-May-15 1,330.00 2.48 0.07% 28.57% 7.92% 352.27
ESOP 2007-47 9-May-15 1,330.00 3.40 0.07% 28.83% 8.07% 432.89
ESOP 2007-47 9-May-15 1,330.00 3.90 0.07% 29.29% 8.01% 473.14
ESOP 2015-02 19-May-16 710.00 1.62 0.07% 26.85% 7.25% 134.08
ESOP 2015-02 19-May-16 710.00 2.45 0.07% 26.32% 7.32% 172.75
ESOP 2015-02 19-May-16 710.00 3.37 0.07% 27.96% 7.43% 218.71
ESOP 2015-02 19-May-16 710.00 3.70 0.07% 27.35% 7.46% 229.80
ESOP 2015-03 19-May-16 710.00 3.75 0.07% 27.28% 7.46% 231.24
ESOP 2015-07 15-May-17 955.00 1.54 0.06% 20.74% 6.64% 145.98
ESOP 2015-07 15-May-17 955.00 2.71 0.06% 35.44% 6.77% 289.06
ESOP 2015-07 15-May-17 955.00 3.38 0.06% 33.81% 6.88% 320.11
ESOP 2015-07 15-May-17 955.00 3.88 0.06% 34.20% 6.95% 349.84
ESOP 2015-08 15-May-17 955.00 2.63 0.06% 35.84% 6.76% 285.89
ESOP 2015-08 15-May-17 955.00 3.63 0.06% 33.27% 6.92% 331.03
ESOP 2015-14 18-May-18 1,271.00 1.45 0.06% 18.68% 7.44% 184.60
ESOP 2015-14 18-May-18 1,271.00 2.71 0.06% 32.95% 7.83% 383.29
ESOP 2015-14 18-May-18 1,271.00 3.37 0.06% 32.13% 7.97% 433.45
ESOP 2015-14 18-May-18 1,271.00 3.87 0.06% 31.43% 7.99% 465.70

68 Annual Report 2018-19
Schedules forming part of Balance Sheet and Profit and Loss Account
ii. Stock Appreciation Rights (cash-settled) At the General Meeting of the holding company, Kotak Mahindra Bank Limited, the shareholders of the Bank had unanimously passed
Special Resolution on 29th June, 2015 to grant stock appreciation rights (SARs) to the eligible employees of the Bank, its subsidiaries and associate companies. Pursuant to this resolution, Kotak Mahindra Stock Appreciation Rights Scheme 2015 has been formulated and adopted. Subsequently, the SARs have been granted under this scheme and the existing SARs will continue.
During the year, the management had approved SARs to be granted to eligible employees as and when deemed fit. The SARs are to be settled in cash and will vest in the manner as provided in the scheme / grant letters to employees. The Company under its various plans / series has granted 11,093 SARs during FY 2018-19.
During the year ended March 31, 2019 following schemes were in operation:
Scheme reference Mode of settlement accounting
Grant Date
No. of SARs
Vesting conditions / Dates
Contractual life of the options
(Yrs)
2015-4 (Series 4) Cash settled 19-May-16 14,600 30% - 2017-18 30% - 2018-19 40% - 2019-20
3.57
2015-4 (Series 6) Cash settled 19-May-16 336 33% - 2017-18 33% - 2018-19 34% - 2019-20
3.57
2015-9 (Series 9) Cash settled 15-May-17 32,851 30% - 2018-19 30% - 2019-20 40% - 2020-21
3.67
2015-17 (Series 17) Cash settled 18-May-18 60,560 30% - 2019-20 30% - 2020-21 40% - 2021-22
3.66
Detail of activity under SARs is summarized below:
Scheme reference Grant date
Balance as at 01st April, 2018
Granted during the
year*
Exercised during the
year
Lapsed/cancelled during
the year**
Balance as at 31st March,
2019
2015-04 9-May-15 4,856 (4,856) -
2015-6 (Series 6) 19-May-16 663 (327) 336
2015-4 (Series 4) 19-May-16 25,550 (10,950) 14,600
2015-9 (Series 9) 15-May-17 47,180 (14,079) (250) 32,851
2015-17 (Series 17) 18-May-18 - 60,560 60,560
78,249 60,560 (30,212) (250) 108,347
Scheme reference Grant date
Balance as at 01st April, 2018
Granted during the
year*
Exercised during the
year
Lapsed/cancelled during
the year**
Balance as at 31st March,
2019
2014-02 9-May-14 3,184 (3,184) -
2015-02 3-Apr-15 34,870 (34,870) -
2015-04 9-May-15 8,722 (3,738) (128) 4,856
2015-6 (Series 6) 19-May-16 990 (327) 663
2015-4 (Series 4) 19-May-16 37,050 (11,115) (385) 25,550
2015-9 (Series 9) 15-May-17 47,620 (440) 47,180
46,762 47,620 (15,180) (953) 78,249
*Includes transfer ins during the year
**Includes transfer outs during the year

69
Schedules forming part of Balance Sheet and Profit and Loss Account
Bank Reports and Statements
Consolidated Financial StatementsFinancial HighlightsCourage of Conviction.
Constancy of Change.Scheduldes
The fair values were calculated using a Black-Scholes Model. The inputs were as follows:
Scheme Grant Date
Vesting period
Expected life
(Years)
Exercise Price (INR)
Market price (INR)
Risk free rate
Dividend yield
Volatility Fair value per
optionSeries 2015-6 (Series 6)TrancheIV 19-May-16 0.25 0.25 - 1,047.80 6.14% 0.06% 19.23% 1,047.65 TrancheV 19-May-16 0.27 0.27 - 1,047.80 6.15% 0.06% 18.76% 1,047.64 TrancheVI 19-May-16 0.29 0.29 - 1,047.80 6.17% 0.06% 18.43% 1,047.63 TrancheVII 19-May-16 1.25 1.25 - 1,047.80 6.74% 0.06% 18.25% 1,047.05 TrancheVIII 19-May-16 1.27 1.27 - 1,047.80 6.75% 0.06% 18.14% 1,047.04 Tranche IX 19-May-16 1.29 1.29 - 1,047.80 6.75% 0.06% 18.03% 1,047.03 Series 2015-4 (Series 4)TrancheIV 19-May-16 0.33 0.33 - 1,047.80 6.21% 0.06% 17.88% 1,047.60 TrancheV 19-May-16 0.35 0.35 - 1,047.80 6.22% 0.06% 17.76% 1,047.59 TrancheVI 19-May-16 0.37 0.37 - 1,047.80 6.24% 0.06% 17.44% 1,047.58 TrancheVII 19-May-16 0.25 0.25 - 1,334.50 6.25% 0.05% 20.12% 1,334.32 TrancheVIII 19-May-16 0.27 0.27 - 1,334.50 6.26% 0.05% 19.74% 1,334.31 Tranche IX 19-May-16 0.29 0.29 - 1,334.50 6.27% 0.05% 20.04% 1,334.30 Tranche X 19-May-16 0.67 0.67 - 1,334.50 6.42% 0.05% 27.53% 1,334.03 Tranche XI 19-May-16 0.69 0.69 - 1,334.50 6.43% 0.05% 27.22% 1,334.02 Tranche XII 19-May-16 0.71 0.71 - 1,334.50 6.44% 0.05% 27.23% 1,334.00 Series 2015-9 (Series 9)Tranche I 15-May-17 0.42 0.42 - 1,047.80 6.27% 0.06% 16.74% 1,047.55 Tranche II 15-May-17 0.44 0.44 - 1,047.80 6.29% 0.06% 18.62% 1,047.54 Tranche III 15-May-17 0.46 0.46 - 1,047.80 6.30% 0.06% 18.79% 1,047.52 TrancheIV 15-May-17 0.59 0.59 - 1,334.50 6.39% 0.05% 28.06% 1,334.09 TrancheV 15-May-17 0.61 0.61 - 1,334.50 6.40% 0.05% 27.79% 1,334.08 TrancheVI 15-May-17 0.62 0.62 - 1,334.50 6.41% 0.05% 27.91% 1,334.06 TrancheVII 15-May-17 1.25 1.25 - 1,334.50 6.58% 0.05% 24.16% 1,333.62 TrancheVIII 15-May-17 1.27 1.27 - 1,334.50 6.59% 0.05% 24.03% 1,333.61 Tranche IX 15-May-17 1.29 1.29 - 1,334.50 6.59% 0.05% 23.89% 1,333.60 Tranche X 15-May-17 1.76 1.76 - 1,334.50 6.64% 0.05% 22.45% 1,333.27 Tranche XI 15-May-17 1.78 1.78 - 1,334.50 6.65% 0.05% 22.36% 1,333.26 Tranche XII 15-May-17 1.79 1.79 - 1,334.50 6.65% 0.05% 22.31% 1,333.24 Series 2015-17 (Series 17)Tranche I 18-May-18 0.33 0.33 - 1,334.50 6.29% 0.05% 27.91% 1,334.27 Tranche II 18-May-18 0.35 0.35 - 1,334.50 6.30% 0.05% 27.33% 1,334.25 Tranche III 18-May-18 0.37 0.37 - 1,334.50 6.31% 0.05% 27.53% 1,334.24 TrancheIV 18-May-18 1.59 1.59 - 1,334.50 6.63% 0.05% 23.04% 1,333.39 TrancheV 18-May-18 1.61 1.61 - 1,334.50 6.63% 0.05% 22.98% 1,333.37 TrancheVI 18-May-18 1.63 1.63 - 1,334.50 6.63% 0.05% 22.94% 1,333.36 TrancheVII 18-May-18 2.25 2.25 - 1,334.50 6.68% 0.05% 21.63% 1,332.92 TrancheVIII 18-May-18 2.27 2.27 - 1,334.50 6.69% 0.05% 21.55% 1,332.91 Tranche IX 18-May-18 2.29 2.29 - 1,334.50 6.69% 0.05% 21.47% 1,332.90 Tranche X 18-May-18 2.75 2.75 - 1,334.50 6.74% 0.05% 21.08% 1,332.57 Tranche XI 18-May-18 2.78 2.78 - 1,334.50 6.74% 0.05% 21.06% 1,332.56 Tranche XII 18-May-18 2.79 2.79 - 1,334.50 6.74% 0.05% 21.03% 1,332.54
The expected volatility is based on the historic volatility (calculated based on the weighted average remaining life of the share options), adjusted for any expected changes to future volatility due to publicly available information. The measurement of fair value was not adjusted for any other feature of the option grant and no option grant was subject to a market condition.
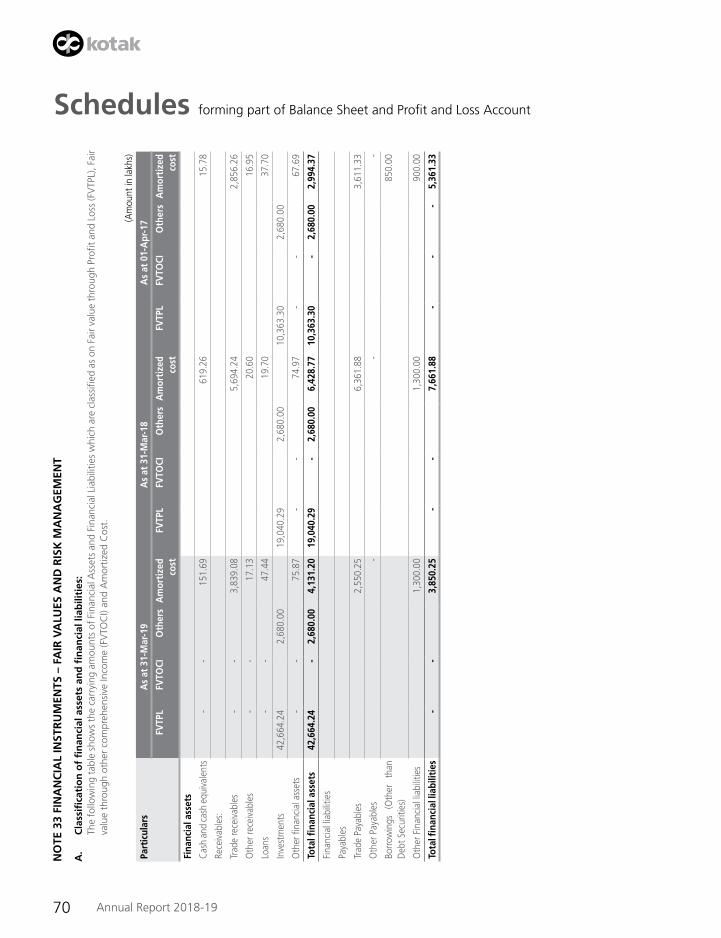
70 Annual Report 2018-19
Schedules forming part of Balance Sheet and Profit and Loss Account
NO
TE 3
3 FI
NA
NC
IAL
INST
RU
MEN
TS –
FA
IR V
ALU
ES A
ND
RIS
K M
AN
AG
EMEN
T
A.
Cla
ssifi
cati
on
of
fin
anci
al a
sset
s an
d fi
nan
cial
liab
iliti
es:
Th
efollowingtableshow
sthecarrying
amou
ntsofFinan
cialAssetsan
dFina
ncialLiabilitieswhichareclassified
ason
Fairvaluethroug
hProfi
tan
dLoss(FVTPL),Fair
valuethroug
hothe
rcompreh
ensiveIn
come(FVTO
CI)an
dAmortized
Cost.
(Am
ount
in la
khs)
Part
icul
ars
As
at 3
1-M
ar-1
9A
s at
31-
Mar
-18
As
at 0
1-A
pr-1
7
FV
TPL
FV
TOCI
O
ther
s A
mor
tize
d co
st
FV
TPL
FV
TOCI
O
ther
s A
mor
tize
d co
st
FV
TPL
FV
TOCI
O
ther
s A
mor
tize
d co
st
Fina
ncia
l ass
ets
Cas
h an
d ca
sh e
quiv
alen
ts -
- 1
51.6
9 6
19.2
6 1
5.78
Rece
ivab
les:
Trad
e re
ceiv
able
s -
- 3
,839
.08
5,6
94.2
4 2
,856
.26
Oth
er re
ceiv
able
s -
- 1
7.13
2
0.60
1
6.95
Loan
s -
- 4
7.44
1
9.70
3
7.70
Inve
stm
ents
42,6
64.2
4 2
,680
.00
19,0
40.2
9 2
,680
.00
10,3
63.3
0 2
,680
.00
Oth
er fi
nanc
ial a
sset
s -
- 7
5.87
-
- 7
4.97
-
- 6
7.69
Tota
l fina
ncia
l ass
ets
42,6
64.2
4 -
2,6
80.0
0 4
,131
.20
19,0
40.2
9 -
2,6
80.0
0 6
,428
.77
10,3
63.3
0 -
2,6
80.0
0 2
,994
.37
Fina
ncia
l lia
bilit
ies
Paya
bles
Trad
e Pa
yabl
es 2
,550
.25
6,3
61.8
8 3
,611
.33
Oth
er P
ayab
les
- -
-
Borr
owin
gs
(Oth
er
than
D
ebt S
ecur
ities
) 8
50.0
0
Oth
er F
inan
cial
liab
ilitie
s 1
,300
.00
1,3
00.0
0 9
00.0
0
Tota
l fina
ncia
l lia
bilit
ies
- -
3,8
50.2
5 -
- 7
,661
.88
- -
- 5
,361
.33
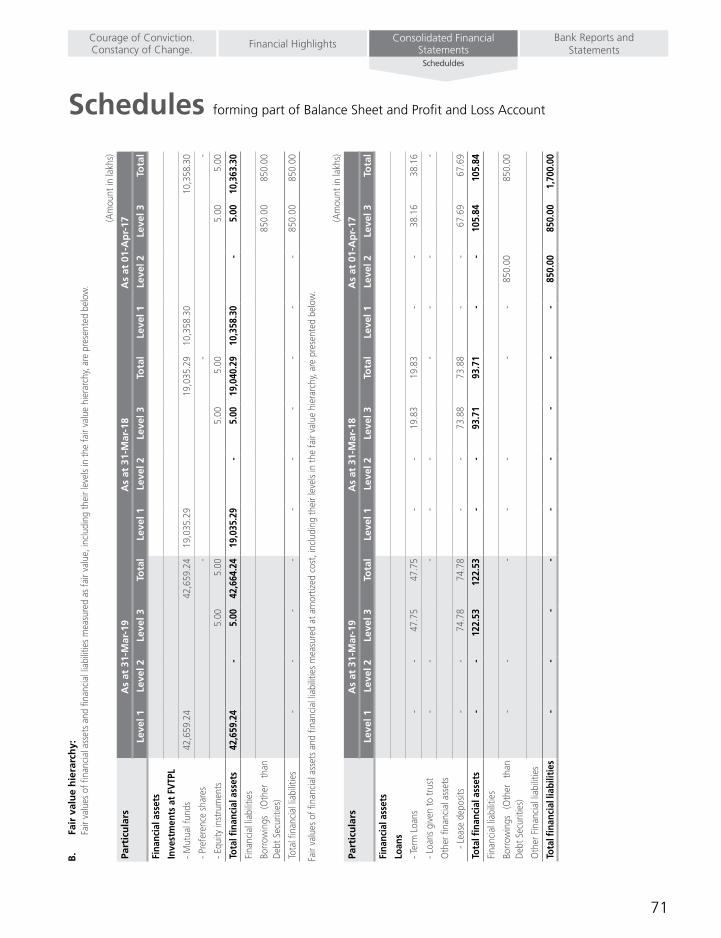
71
Schedules forming part of Balance Sheet and Profit and Loss Account
Bank Reports and Statements
Consolidated Financial StatementsFinancial HighlightsCourage of Conviction.
Constancy of Change.Scheduldes
B.
Fair
val
ue
hie
rarc
hy:
Fa
ir va
lues
of fi
nanc
ial a
sset
s an
d fin
anci
al li
abili
ties
mea
sure
d as
fair
valu
e, in
clud
ing
thei
r lev
els
in th
e fa
ir va
lue
hier
arch
y, ar
e pr
esen
ted
belo
w.
(Am
ount
in la
khs)
Part
icu
lars
As
at 3
1-M
ar-1
9A
s at
31-
Mar
-18
As
at 0
1-A
pr-
17
Lev
el 1
L
evel
2
Lev
el 3
T
ota
l L
evel
1
Lev
el 2
L
evel
3
To
tal
Lev
el 1
L
evel
2
Lev
el 3
T
ota
l
Fina
ncia
l ass
ets
Inve
stm
ents
at
FVTP
L
- Mut
ual f
unds
42,
659.
24
42,
659.
24
19,
035.
29
19,
035.
29
10,
358.
30
10,
358.
30
- Pre
fere
nce
shar
es -
- -
- Equ
ity in
stru
men
ts 5
.00
5.0
0 5
.00
5.0
0 5
.00
5.0
0
Tota
l fina
ncia
l ass
ets
42,
659.
24
- 5
.00
42,
664.
24
19,
035.
29
- 5
.00
19,
040.
29
10,
358.
30
- 5
.00
10,
363.
30
Fina
ncia
l lia
bilit
ies
Borr
owin
gs
(Oth
er
than
D
ebt S
ecur
ities
) 8
50.0
0 8
50.0
0
Tota
l fina
ncia
l lia
bilit
ies
- -
- -
- -
- -
- -
850
.00
850
.00
Fair
valu
es o
f fina
ncia
l ass
ets
and
finan
cial
liab
ilitie
s m
easu
red
at a
mor
tized
cos
t, in
clud
ing
thei
r lev
els
in th
e fa
ir va
lue
hier
arch
y, ar
e pr
esen
ted
belo
w.
(Am
ount
in la
khs)
Part
icu
lars
As
at 3
1-M
ar-1
9A
s at
31-
Mar
-18
As
at 0
1-A
pr-
17
Lev
el 1
L
evel
2
Lev
el 3
T
ota
l L
evel
1
Lev
el 2
L
evel
3
To
tal
Lev
el 1
L
evel
2
Lev
el 3
T
ota
l
Fina
ncia
l ass
ets
Loan
s
- Ter
m L
oans
- -
47.
75
47.
75
- -
19.
83
19.
83
- -
38.
16
38.
16
- Loa
ns g
iven
to tr
ust
- -
- -
- -
- -
-
Oth
er fi
nanc
ial a
sset
s
-
Leas
e de
posit
s -
- 7
4.78
7
4.78
-
- 7
3.88
7
3.88
-
- 6
7.69
6
7.69
Tota
l fina
ncia
l ass
ets
- -
122
.53
122
.53
- -
93.
71
93.
71
- -
105
.84
105
.84
Fina
ncia
l lia
bilit
ies
Borr
owin
gs
(Oth
er
than
D
ebt S
ecur
ities
) -
- -
- -
- -
850
.00
850
.00
Oth
er F
inan
cial
liab
ilitie
s
Tota
l fina
ncia
l lia
bilit
ies
- -
- -
- -
- -
- 8
50.0
0 8
50.0
0 1
,700
.00

72 Annual Report 2018-19
Schedules forming part of Balance Sheet and Profit and Loss Account
C. Measurement of fair values The fair value of financial instruments have been classified into three categories depending on the inputs used in the valuation technique.
The hierarchy gives the highest priority to quoted prices in active markets for identical assets or liabilities (Level 1 measurements) and lowest priority to unobservable inputs (Level 3 measurements).
The categories used are as follows:
Level 1 : Quoted prices (unadjusted) in active markets for identical assets or liabilities
Level 2 : Inputs other than quoted prices included within Level 1 that are observable for the asset or liability, either directly (i.e. as prices) or indirectly (i.e. derived from prices).
Level 3 : Inputs for the assets or liabilities that are not based on observable market data (unobservable inputs)
Fair value of financial assets and liabilities measured at amortized cost
(Amount in lakhs)
Particulars As at 31-Mar-19 As at 31-Mar-18 As at 01-Apr-17
Carrying amount
Fair value Carrying amount
Fair value Carrying amount
Fair value
Financial assets
Cash and cash equivalents 151.69 151.69 619.26 619.26 15.78 15.78
Receivables:
Trade receivables 3,839.08 3,839.08 5,694.24 5,694.24 2,856.26 2,856.26
Other receivables 17.13 17.13 20.60 20.60 16.95 16.95
Loans
- Term Loans
- Loans given to Employee 47.44 48.15 19.70 19.83 37.70 36.57
Other financial assets
- Lease deposits 74.78 74.64 73.88 74.51 67.69 67.98
- Others 1.09 1.09 1.09 1.09 - -
4,131.20 4,131.77 6,428.77 6,429.53 2,994.37 2,993.53
Financial liabilities
Payables
Trade Payables 2,550.25 2,550.25 6,361.88 6,361.88 3,611.33 3,611.33
Borrowings (Other than Debt Securities)
850.00 850.00
Other Financial liabilities 1,300.00 1,300.00 1,300.00 1,300.00 900.00 900.00
Total financial liabilities 3,850.25 3,850.25 7,661.88 7,661.88 5,361.33 5,361.33
The carrying amounts of Cash and cash equivalents, Bank Balance other than cash and cash equivalent, trade receivables, loan to employees, other deposits, other financial assets, trade payables, other financial liabilities are considered to be the same as their fair values, due to their short-term nature.
For financial assets and liabilities that are measured at fair value, the carrying amounts are equal to the fair values.
The following tables show the valuation techniques used in measuring Level 2 and Level 3 fair values, as well as the significant unobservable inputs used.

73
Schedules forming part of Balance Sheet and Profit and Loss Account
Bank Reports and Statements
Consolidated Financial StatementsFinancial HighlightsCourage of Conviction.
Constancy of Change.Scheduldes
Financial instruments not measured at fair value
Instrument type Valuation technique
Loans The fair values of loans that do not reprice or mature frequently are estimated using discounted cash flow models. The discount rates are based on internal models and consequently for the purposes of level disclosures categorized under Level 3. The Level 3 loans would decrease (increase) in value based upon an increase (decrease) in discount rate. For purposes of these fair value estimates, the fair values of impaired loans were computed by discounting expected cashflows using appropriate market yield.
Security Deposits For deposits with defined maturities, the fair values were estimated using discounted cash flow models that apply market interest rates corresponding to similar deposits and timing of maturities.
D. Financial risk management The Company has exposure to the following risks arising from financial instruments:
• Creditrisk,
• Liquidityrisk,
• Marketriskand
• Currencyrisk
Credit risk Credit risk is the risk of financial loss to the Company if a customer or counterparty to a financial instrument fails to meet its contractual
obligations,andarisesprincipallyfromtheCompany’sreceivablesfromcustomersandloansandadvances.Thecarryingamountsoffollowing financial assets represent the maximum credit risk exposure:-
(Amount in Lakhs)
Particulars As at 31st March, 2019
As at 31st March, 2018
As at 1st April, 2017
Trade receivables 3,839.08 5,694.24 2,856.26
Cash and cash equivalents 151.69 619.26 15.78
Other Financial assets 75.87 74.97 67.69
Loan to Employees 47.44 19.70 37.70
Total 4,115.07 6,408.17 2,977.43
a. Credit quality analysis
The following table sets out the information about the credit quality of financial assets measured at amortized cost:
(Amount in lakhs)
Particulars As at 31st March, 2019 Total
12-month ECL Lifetime ECL not credit-
impaired
Lifetime ECL credit-
impaired
Trade receivables
Past due 1–30 days - 3,647.88 3,647.88
Past due 31–60 days - 109.20 109.20
Past due 61–90 days - 101.38 101.38
Past due 90 days - -
- 3,858.46 - 3,858.46
Impairment loss allowance - (19.38) (19.38)
Carrying amount - 3,839.09 - 3,839.09
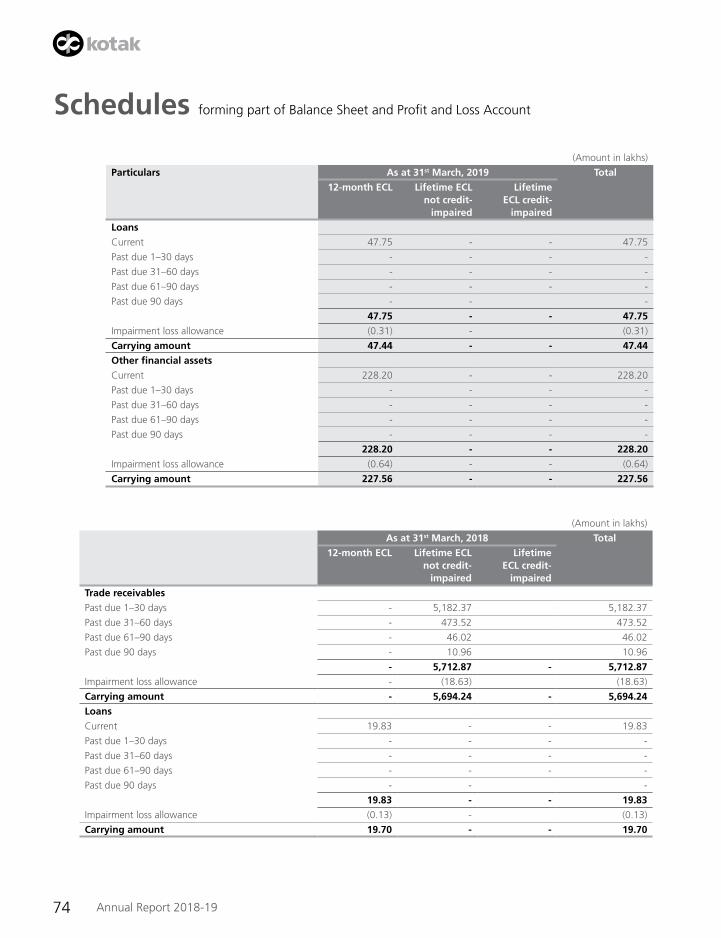
74 Annual Report 2018-19
Schedules forming part of Balance Sheet and Profit and Loss Account
(Amount in lakhs)
Particulars As at 31st March, 2019 Total
12-month ECL Lifetime ECL not credit-
impaired
Lifetime ECL credit-
impaired
Loans
Current 47.75 - - 47.75
Past due 1–30 days - - - -
Past due 31–60 days - - - -
Past due 61–90 days - - - -
Past due 90 days - - -
47.75 - - 47.75
Impairment loss allowance (0.31) - (0.31)
Carrying amount 47.44 - - 47.44
Other financial assets
Current 228.20 - - 228.20
Past due 1–30 days - - - -
Past due 31–60 days - - - -
Past due 61–90 days - - - -
Past due 90 days - - - -
228.20 - - 228.20
Impairment loss allowance (0.64) - - (0.64)
Carrying amount 227.56 - - 227.56
(Amount in lakhs)
As at 31st March, 2018 Total
12-month ECL Lifetime ECL not credit-
impaired
Lifetime ECL credit-
impaired
Trade receivables
Past due 1–30 days - 5,182.37 5,182.37
Past due 31–60 days - 473.52 473.52
Past due 61–90 days - 46.02 46.02
Past due 90 days - 10.96 10.96
- 5,712.87 - 5,712.87
Impairment loss allowance - (18.63) (18.63)
Carrying amount - 5,694.24 - 5,694.24
Loans
Current 19.83 - - 19.83
Past due 1–30 days - - - -
Past due 31–60 days - - - -
Past due 61–90 days - - - -
Past due 90 days - - -
19.83 - - 19.83
Impairment loss allowance (0.13) - (0.13)
Carrying amount 19.70 - - 19.70
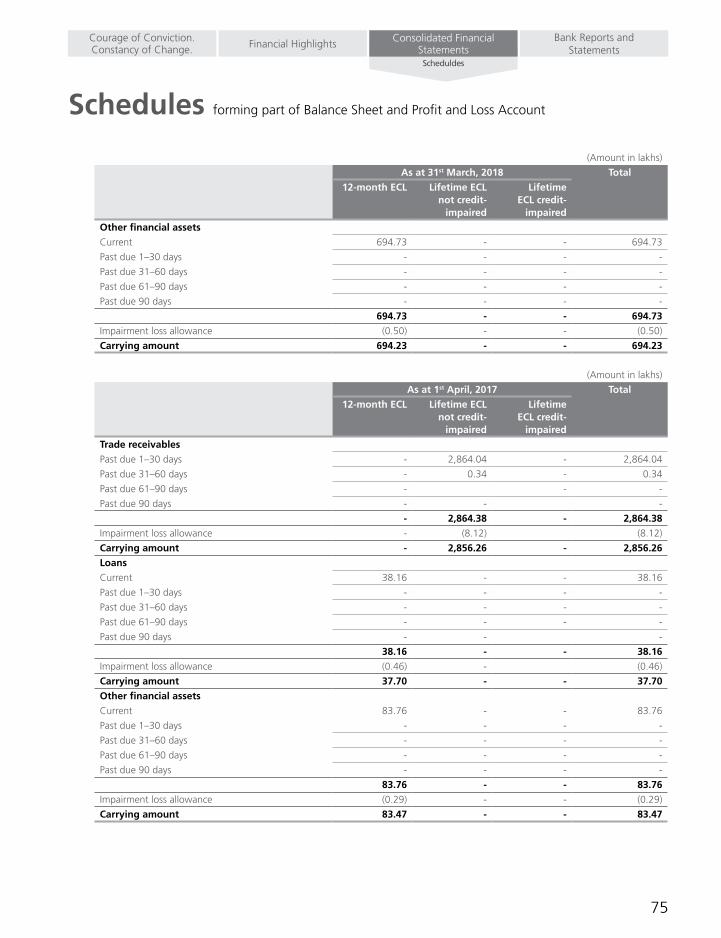
75
Schedules forming part of Balance Sheet and Profit and Loss Account
Bank Reports and Statements
Consolidated Financial StatementsFinancial HighlightsCourage of Conviction.
Constancy of Change.Scheduldes
(Amount in lakhs)
As at 31st March, 2018 Total
12-month ECL Lifetime ECL not credit-
impaired
Lifetime ECL credit-
impaired
Other financial assets
Current 694.73 - - 694.73
Past due 1–30 days - - - -
Past due 31–60 days - - - -
Past due 61–90 days - - - -
Past due 90 days - - - -
694.73 - - 694.73
Impairment loss allowance (0.50) - - (0.50)
Carrying amount 694.23 - - 694.23
(Amount in lakhs)
As at 1st April, 2017 Total
12-month ECL Lifetime ECL not credit-
impaired
Lifetime ECL credit-
impaired
Trade receivables
Past due 1–30 days - 2,864.04 - 2,864.04
Past due 31–60 days - 0.34 - 0.34
Past due 61–90 days - - -
Past due 90 days - - -
- 2,864.38 - 2,864.38
Impairment loss allowance - (8.12) (8.12)
Carrying amount - 2,856.26 - 2,856.26
Loans
Current 38.16 - - 38.16
Past due 1–30 days - - - -
Past due 31–60 days - - - -
Past due 61–90 days - - - -
Past due 90 days - - -
38.16 - - 38.16
Impairment loss allowance (0.46) - (0.46)
Carrying amount 37.70 - - 37.70
Other financial assets
Current 83.76 - - 83.76
Past due 1–30 days - - - -
Past due 31–60 days - - - -
Past due 61–90 days - - - -
Past due 90 days - - - -
83.76 - - 83.76
Impairment loss allowance (0.29) - - (0.29)
Carrying amount 83.47 - - 83.47

76 Annual Report 2018-19
Schedules forming part of Balance Sheet and Profit and Loss Account
Concentration of credit risk
c. Amounts arising from ECL
i. Inputs, assumptions and techniques used for estimating impairment
Inputs considered in the ECL model:
The Company applies various approaches to determine if there has been a significant increase in credit risk. In determining whether credit risk has increased significantly since initial recognition, The Company uses days past due information and forecast information to assess deterioration in credit quality of a financial asset.
The company categorizes Financial assets into stages based on the days past due status.
- Stage 1: 0-30 days past due
- Stage 2: 31- 90 days past due
- Stage 3: More than 90 days past due
The Company has used simplified approach to provide expected credit loss on trade receivables as prescribed by Ind AS 109 which permits use of lifetime expected credit loss provision for all trade receivables. The Company has historic credit loss data to compute ECL.”
Assumption considered in the ECL model:
- Loss given default”” (LGD) is an estimate of loss from a transaction given that a default occurs.
Probability of default”” (PD) is defined as the probability of whether the borrowers will default on their obligations in the future. For assets which are in Stage 1, a 12 month PD is required. For Stage 2 assets a lifetime PD is required while Stage 3 assets are considered to have a 100% PD.
- Exposure at default”” (EAD) represents the expected exposure in the event of a default and is the gross carrying amount in case of the financial assets held by the Company.
Forward looking information:
The Company incorporates forward looking information into both assessment of whether the credit risk of an instrument has increased significantly since its initial recognition and its measurement of ECL. Based on the consideration of a variety of external actual and forecastinformation,theCompanyformsa‘basecase’viewofthefuturedirectionofrelevanteconomicvariablessuchasGrossdomesticproduct, change in gross fixed investments. This process involves developing two or more additional economic scenarios and considering the relative probabilities of each outcome. The base case represents a most likely outcome while the other scenarios represent more optimistic and more pessimistic outcomes.
Assessment of significant increase in credit risk:
The credit risk on a financial asset of the Company are assumed to have increased significantly since initial recognition when contractual payments are more than 30 days past due. Accordingly the financial assets shall be classified as Stage 2, if on the reporting date, it has been 30 days past due.
Definition of default
A default on a financial asset is when the counterparty fails to make the contractual payments within 90 days of when they fall due. This definition of default is determined by considering the business environment in which the company operates and other micro-economic factors. Accordingly the financial assets shall be classified as Stage 3, if on the reporting date, it has been 90 days past due.

77
Schedules forming part of Balance Sheet and Profit and Loss Account
Bank Reports and Statements
Consolidated Financial StatementsFinancial HighlightsCourage of Conviction.
Constancy of Change.Scheduldes
ii. Impairment loss allowance
The following table shows reconciliations from the opening to the closing balance of the loss allowances and write offs:
Particulars Past due1–30 days
Past due31–60 days
Past due61–90 days
Past due more than 90 days
Trade receivables
Balance as at April 1, 2017 8.12 0.00 -
New financial assets originated during the year 7.37 0.67 0.07 0.02
Financial assets that have been derecognized during the period
(8.12) (0.00) - -
Balance as at 31st March, 2018 7.37 0.67 0.07 0.02
New financial assets originated during the year 0.53 17.62 0.49
Financial assets that have been derecognized during the period
(7.37) (0.67) (0.07) (0.02)
Balance as at 31st March, 2019 0.53 17.62 0.49 -
Particulars 12-month ECL
Employee loans
Balance as at April 1, 2017 0.46
New financial assets originated during the year 0.13
Financial assets that have been derecognized during the period (0.46)
Balance as at 31st March, 2018 0.13
New financial assets originated during the year 0.31
Financial assets that have been derecognized during the period (0.13)
Balance as at 31st March, 2019 0.31
Particulars 12-month ECL
Bank Balances & Other financial assets
Balance as at April 1, 2017 0.29
New financial assets originated during the year 0.50
Financial assets that have been derecognized during the period (0.29)
Balance as at 31st March, 2018 0.50
New financial assets originated during the year 0.64
Financial assets that have been derecognized during the period (0.50)
Balance as at 31st March, 2019 0.64
Liquidity risk is the risk that the Company will encounter difficulty in meeting the obligations associated with its financial liabilities thataresettledbydeliveringcashoranotherfinancialasset.TheCompany’sapproachtomanagingliquidityistoensure,asfaraspossible, that it will have sufficient liquidity to meet its liabilities when they are due, under both normal and stressed conditions, withoutincurringunacceptablelossesorriskingdamagetotheCompany’sreputation.
Maturity Profile of Financial Liabilities
The following are the remaining contractual maturities of financial liabilities at the reporting date. The amounts are gross and undiscounted, and include estimated interest payments and exclude the impact of netting agreements.

78 Annual Report 2018-19
Schedules forming part of Balance Sheet and Profit and Loss Account
Particulars Carrying amount
Total On Demand
Less than 6 months
6-12 months
1-2 years 2-5 years
More than 5 years
As at 31-Mar-19
Financial Assets
Cash and cash equivalents 151.69 151.69 151.69
Receivables -
(I) Trade receivables 3,839.08 3,839.08 3,839.08
(II) Other receivables 17.13 17.13 17.13
Loans 47.44 47.44 0.65 1.75 45.04
Investments 45,344.24 45,344.24 40,208.87 5,135.37
Other Financial assets 75.87 75.87 7.16 0.99 12.47 22.11 33.14
Total Financial Assets 49,475.43 49,475.43 40,360.56 3,864.02 2.74 57.51 22.11 5,168.51
Financial liabilities
Trade and other Payables 2,550.25 2,550.25 1,178.59 1,355.06 16.60
Other Financial Liabilities 1,300.00 1,300.00 1,300.00
Total Financial Liabilities 3,850.25 3,850.25 - 2,478.59 1,355.06 16.60 - -
Net 45,625.18 45,625.18 40,360.56 1,385.43 (1,352.32) 40.91 22.11 5,168.51
Particulars Carrying amount
Total On Demand
Less than 6 months
6-12 months
1-2 years 2-5 years
More than 5 years
As at 31-Mar-18
Financial Assets
Cash and cash equivalents 619.26 619.26 619.26
Receivables
(I) Trade receivables 5,694.24 5,694.24 5,694.24
(II) Other receivables 20.60 20.60 20.60
Loans 19.70 19.70 3.40 5.30 11.00
Investments 21,720.29 21,720.29 16,968.46 4,751.83
Other Financial assets 74.97 74.97 1.30 19.92 9.22 31.10 13.43
Total Financial Assets 28,149.06 28,149.06 17,587.72 5,719.54 25.22 20.22 31.10 4,765.26
Financial liabilities
Trade and other Payables 6,361.88 6,361.88 3,677.84 2,666.44 17.60 - -
Other Financial Liabilities 1,300.00 1,300.00 1,300.00
Total Financial Liabilities 7,661.88 7,661.88 - 4,977.84 2,666.44 17.60 - -
Net 20,487.19 20,487.19 17,587.72 741.70 (2,641.22) 2.62 31.10 4,765.26

79
Schedules forming part of Balance Sheet and Profit and Loss Account
Bank Reports and Statements
Consolidated Financial StatementsFinancial HighlightsCourage of Conviction.
Constancy of Change.Scheduldes
Particulars Carrying amount
Total On Demand
Less than 6 months
6-12 months 1-2 years 2-5 years More than 5 years
As at 1-Apr-17
Financial Assets
Cash and cash equivalents 15.78 15.78 15.78
Receivables
(I) Trade receivables 2,856.26 2,856.26 2,856.26
(II) Other receivables 16.95 16.95 16.95
Loans 37.70 37.70 0.96 13.22 23.51
Investments 13,043.30 13,043.30 8,389.44 4,653.86
Other Financial assets 67.69 67.69 2.81 0.50 20.41 34.41 9.55
Total Financial Assets 16,037.66 16,037.66 8,405.22 2,876.98 13.72 43.93 34.41 4,663.41
Financial liabilities
Trade and other Payables 3,611.33 3,611.33 2,200.42 1,389.06 0.72 21.13 -
Borrowings (Other than Debt Securities)
850.00 850.00 850.00
Other Financial Liabilities 900.00 900.00 900.00
Total Financial Liabilities 5,361.33 5,361.33 - 3,950.42 1,389.06 0.72 21.13 - Net 10,676.33 10,676.33 8,405.22 (1,073.45) (1,375.34) 43.21 13.28 4,663.41
Market risk
Market risk is the risk that changes in market prices – such as foreign exchange rates, interest rates and equity prices – will affect the Company’sincomeorthevalueofitsholdingsoffinancialinstruments.Marketriskisattributabletoallmarketrisksensitivefinancialinstruments including foreign currency receivables and payables and long term debt. We are exposed to market risk primarily related to foreign exchange rate risk, interest rate risk and the market value of our investments. Thus, our exposure to market risk is a function of investing and borrowing activities and revenue generating and operating activities in foreign currency. The objective of market risk management is to avoid excessive exposure in our foreign currency revenues and costs.
Currency risk
The Company is exposed to currency risk on account of its trade receivables in foreign currency. The functional currency of the Company is Indian Rupee i.e. INR.
Exposure to currency risk (Exposure in different currencies converted to functional currency i.e. INR)
The currency profile of financial assets and financial liabilities is as below:
Particulars 31st March, 2019 31st March, 2018 1st April, 2017
USD USD USD
Financial assets
Cash and cash equivalents - - -
Trade and other receivables - - -
- - -
Financial liabilities
Kotak Mahindra Financial Services Ltd - 0.68 1.75
- 0.68 1.75
- (0.68) (1.75)
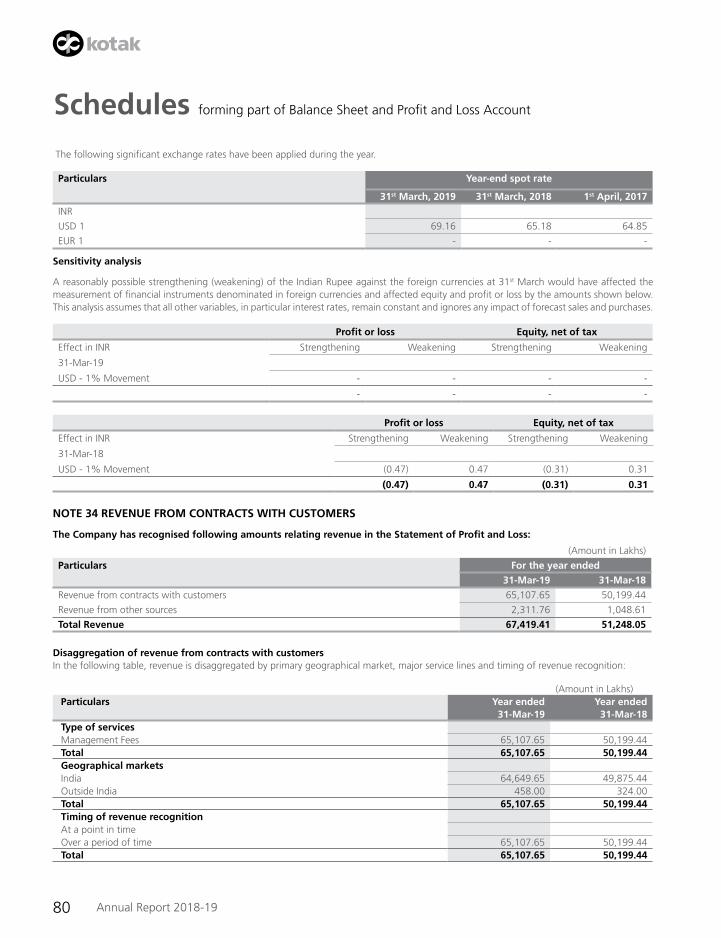
80 Annual Report 2018-19
Schedules forming part of Balance Sheet and Profit and Loss Account
The following significant exchange rates have been applied during the year.
Particulars Year-end spot rate
31st March, 2019 31st March, 2018 1st April, 2017
INR
USD 1 69.16 65.18 64.85
EUR 1 - - -
Sensitivity analysis
A reasonably possible strengthening (weakening) of the Indian Rupee against the foreign currencies at 31st March would have affected the measurement of financial instruments denominated in foreign currencies and affected equity and profit or loss by the amounts shown below. This analysis assumes that all other variables, in particular interest rates, remain constant and ignores any impact of forecast sales and purchases.
Profit or loss Equity, net of tax
Effect in INR Strengthening Weakening Strengthening Weakening
31-Mar-19
USD - 1% Movement - - - -
- - - -
Profit or loss Equity, net of tax
Effect in INR Strengthening Weakening Strengthening Weakening
31-Mar-18
USD - 1% Movement (0.47) 0.47 (0.31) 0.31
(0.47) 0.47 (0.31) 0.31
NOTE 34 REVENUE FROM CONTRACTS WITH CUSTOMERS
The Company has recognised following amounts relating revenue in the Statement of Profit and Loss:
(Amount in Lakhs)
Particulars For the year ended
31-Mar-19 31-Mar-18
Revenue from contracts with customers 65,107.65 50,199.44
Revenue from other sources 2,311.76 1,048.61
Total Revenue 67,419.41 51,248.05
Disaggregation of revenue from contracts with customersIn the following table, revenue is disaggregated by primary geographical market, major service lines and timing of revenue recognition:
(Amount in Lakhs) Particulars Year ended
31-Mar-19 Year ended
31-Mar-18 Type of services Management Fees 65,107.65 50,199.44 Total 65,107.65 50,199.44 Geographical markets India 64,649.65 49,875.44 Outside India 458.00 324.00 Total 65,107.65 50,199.44 Timing of revenue recognition At a point in time Over a period of time 65,107.65 50,199.44 Total 65,107.65 50,199.44

81
Schedules forming part of Balance Sheet and Profit and Loss Account
Bank Reports and Statements
Consolidated Financial StatementsFinancial HighlightsCourage of Conviction.
Constancy of Change.Scheduldes
Contract Balances
The following table provides information about receivables, contract assets and contract liabilities from contracts with customers:
(Amount in Lakhs)
Particulars As at 31-Mar-19 As at 31-Mar-18 As at 1-Apr-17
Receivables 3,839.08 5,694.24 2,856.26
NOTE 35 INVOLVEMENT WITH UNCONSOLIDATED STRUCTURED ENTITIESThe Company acts as the fund manager and therefore has a significant involvement with the funds.However, fund managers are subject to substantial investment restrictions and guidelines. In all cases, the Company could be removed without cause, by the majority of the unit holders. The Company does not have significant investments in the units of mutual funds. Therefore, the funds managed by the Company are not consolidated.
Thefollowingtablesshowtheincome&carryingamountofthecompany’srecordedinterestinthestructuredentitiesaswellasthemaximumexposure to risk due to these exposures in the unconsolidated structured entities and asset management activities:
(Amount in Lakhs)
Particulars As at 31st March, 2019 As at 31st March, 2018 As at 1st April, 2017
Total AUM of the schemes
Schemes subscribed by the Company
Total AUM of the schemes
Schemes subscribed by the Company
Total AUM of the schemes
Schemes subscribed by the Company
Financial investments classifiedasFVTPL
Kotak Mahindra Mutual Fund
6,543,076.81 42,659.24 4,886,147.54 19,035.29 3,811,433.55 10,299.35
The following table sets out an analysis of the carrying amounts of interests held by the Company in unconsolidated structured entities. The maximum exposure to loss is the carrying amount of the assets held.
(Amount in Lakhs)
Carrying amount As at 31st March, 2019
As at 31st March, 2018
As at 1st April, 2017
Investment in schemes 42,659.24 19,035.29 10,299.35
Fees Receivable 1,794.39 3,218.47 2,187.76
NOTE 36 CAPITAL DISCLOSUREForthepurposeofthecompany’scapitalmanagement,capitalincludesissuedcapitalandotherequityreserves.TheprimaryobjectiveoftheGroup’sCapitalManagementistomaximiseshareholdersvalue.TheGroupmanagesitscapitalstructureandmakesadjustmentsinthelightof changes in economic environment and the requirements of the financial covenants.
The Company monitors capital using Adjusted net debt to equity ratio. For this purpose, adjusted net debt is defined as total debt less cash and bank balances.
(Amount in Lakhs)
Sr.No.
Particulars As at 31-Mar-19
As at 31-Mar-18
As at 1-Apr-17
(A) Liabilities
Borrowings (Other than Debt Securities) - - 850.00
Gross Debt
Less: Cash and cash Equivalents - - (15.78)
Adjusted Net Debt - - 834.22
Total Equity 46,729.57 23,423.49 15,169.66
Adjusted Net debt to equity ratio 0.00% 0.00% 5.50%
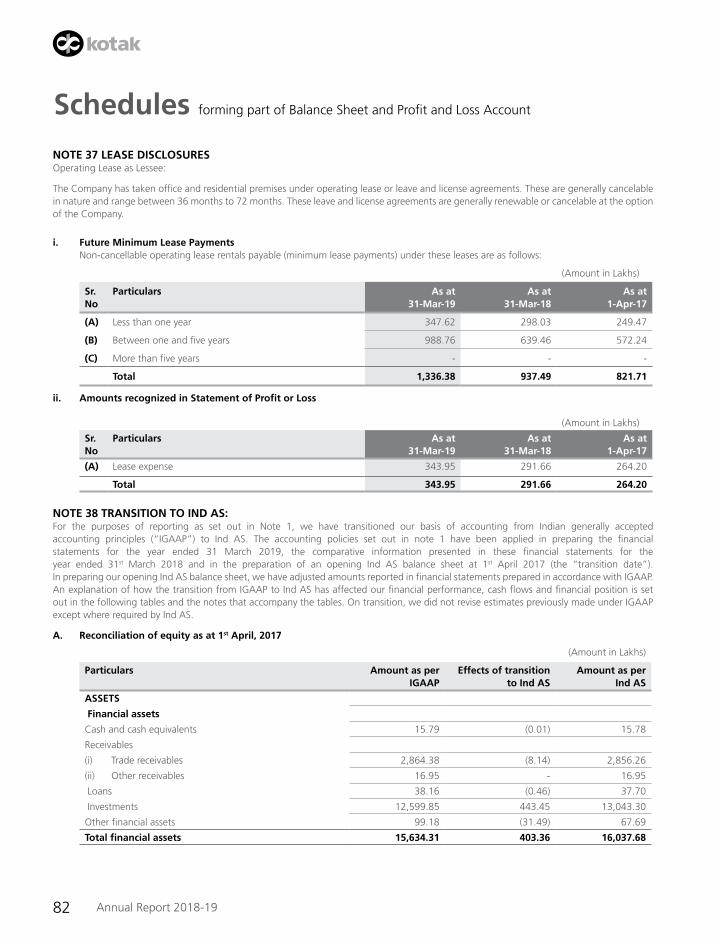
82 Annual Report 2018-19
Schedules forming part of Balance Sheet and Profit and Loss Account
NOTE 37 LEASE DISCLOSURESOperating Lease as Lessee:
The Company has taken office and residential premises under operating lease or leave and license agreements. These are generally cancelable in nature and range between 36 months to 72 months. These leave and license agreements are generally renewable or cancelable at the option of the Company.
i. Future Minimum Lease Payments Non-cancellable operating lease rentals payable (minimum lease payments) under these leases are as follows:
(Amount in Lakhs)
Sr.No
Particulars As at 31-Mar-19
As at 31-Mar-18
As at 1-Apr-17
(A) Less than one year 347.62 298.03 249.47
(B) Between one and five years 988.76 639.46 572.24
(C) More than five years - - -
Total 1,336.38 937.49 821.71
ii. Amounts recognized in Statement of Profit or Loss
(Amount in Lakhs)
Sr.No
Particulars As at 31-Mar-19
As at 31-Mar-18
As at 1-Apr-17
(A) Lease expense 343.95 291.66 264.20
Total 343.95 291.66 264.20
NOTE 38 TRANSITION TO IND AS:For the purposes of reporting as set out in Note 1, we have transitioned our basis of accounting from Indian generally accepted accounting principles (“IGAAP”) to Ind AS. The accounting policies set out in note 1 have been applied in preparing the financial statements for the year ended 31 March 2019, the comparative information presented in these financial statements for the year ended 31st March 2018 and in the preparation of an opening Ind AS balance sheet at 1st April 2017 (the “transition date”). In preparing our opening Ind AS balance sheet, we have adjusted amounts reported in financial statements prepared in accordance with IGAAP. An explanation of how the transition from IGAAP to Ind AS has affected our financial performance, cash flows and financial position is set out in the following tables and the notes that accompany the tables. On transition, we did not revise estimates previously made under IGAAP except where required by Ind AS.
A. Reconciliation of equity as at 1st April, 2017
(Amount in Lakhs)
Particulars Amount as per IGAAP
Effects of transition to Ind AS
Amount as per Ind AS
ASSETS
Financial assets
Cash and cash equivalents 15.79 (0.01) 15.78
Receivables
(i) Trade receivables 2,864.38 (8.14) 2,856.26
(ii) Other receivables 16.95 - 16.95
Loans 38.16 (0.46) 37.70
Investments 12,599.85 443.45 13,043.30
Other financial assets 99.18 (31.49) 67.69
Total financial assets 15,634.31 403.36 16,037.68
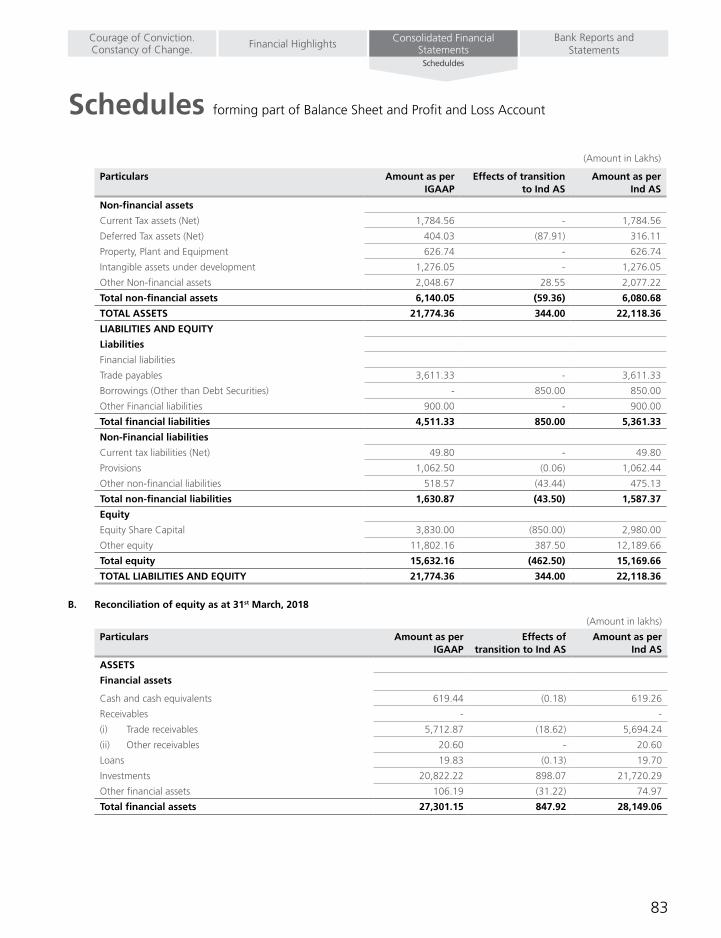
83
Schedules forming part of Balance Sheet and Profit and Loss Account
Bank Reports and Statements
Consolidated Financial StatementsFinancial HighlightsCourage of Conviction.
Constancy of Change.Scheduldes
(Amount in Lakhs)
Particulars Amount as per IGAAP
Effects of transition to Ind AS
Amount as per Ind AS
Non-financial assets
Current Tax assets (Net) 1,784.56 - 1,784.56
Deferred Tax assets (Net) 404.03 (87.91) 316.11
Property, Plant and Equipment 626.74 - 626.74
Intangible assets under development 1,276.05 - 1,276.05
Other Non-financial assets 2,048.67 28.55 2,077.22
Total non-financial assets 6,140.05 (59.36) 6,080.68
TOTAL ASSETS 21,774.36 344.00 22,118.36
LIABILITIES AND EqUITY
Liabilities
Financial liabilities
Trade payables 3,611.33 - 3,611.33
Borrowings (Other than Debt Securities) - 850.00 850.00
Other Financial liabilities 900.00 - 900.00
Total financial liabilities 4,511.33 850.00 5,361.33
Non-Financial liabilities
Current tax liabilities (Net) 49.80 - 49.80
Provisions 1,062.50 (0.06) 1,062.44
Other non-financial liabilities 518.57 (43.44) 475.13
Total non-financial liabilities 1,630.87 (43.50) 1,587.37
Equity
Equity Share Capital 3,830.00 (850.00) 2,980.00
Other equity 11,802.16 387.50 12,189.66
Total equity 15,632.16 (462.50) 15,169.66
TOTAL LIABILITIES AND EqUITY 21,774.36 344.00 22,118.36
B. Reconciliation of equity as at 31st March, 2018
(Amount in lakhs)
Particulars Amount as per IGAAP
Effects of transition to Ind AS
Amount as per Ind AS
ASSETS
Financial assets
Cash and cash equivalents 619.44 (0.18) 619.26
Receivables - -
(i) Trade receivables 5,712.87 (18.62) 5,694.24
(ii) Other receivables 20.60 - 20.60
Loans 19.83 (0.13) 19.70
Investments 20,822.22 898.07 21,720.29
Other financial assets 106.19 (31.22) 74.97
Total financial assets 27,301.15 847.92 28,149.06

84 Annual Report 2018-19
Schedules forming part of Balance Sheet and Profit and Loss Account
(Amount in lakhs)
Particulars Amount as per IGAAP
Effects of transition to Ind AS
Amount as per Ind AS
Non-financial assets
Current Tax assets (Net) 1,626.78 - 1,626.78
Deferred Tax assets (Net) 664.39 (236.29) 428.09
Property, Plant and Equipment 840.94 0.01 840.95
Other intangible assets 919.17 - 919.17
Other Non-financial assets 3,482.72 28.11 3,510.83
Total non-financial assets 7,534.00 (208.18) 7,325.82
TOTAL ASSETS 34,835.15 639.74 35,474.88
LIABILITIES AND EqUITY
Liabilities
Financial liabilities
Payables - -
Trade payables 6,361.88 - 6,361.88
Other Financial liabilities 1,300.00 - 1,300.00
Total financial liabilities 7,661.88 - 7,661.88
Non-Financial liabilities
Current tax liabilities (Net) 49.80 - 49.80
Provisions 1,317.95 (0.09) 1,317.85
Other non-financial liabilities 3,069.97 (48.11) 3,021.86
Total non-financial liabilities 4,437.72 (48.20) 4,389.51
Equity
Equity Share Capital 2,980.00 - 2,980.00
Other equity 19,755.55 687.94 20,443.49
Total equity 22,735.55 687.94 23,423.49
TOTAL LIABILITIES AND EqUITY 34,835.15 639.73 35,474.88
C. Reconciliation of Statement of Profit or Loss for the year ended 31st March, 2018
(Amount in lakhs)
Particulars Amount as per IGAAP
Effects of transition to Ind AS
Amount as per Ind AS
I. REVENUE FROM OPERATIONS
Interest income 2.45 3.41 5.86
Fees and commission income 50,199.44 - 50,199.44
Net gain on fair value changes 570.06 454.63 1,024.69
Total revenue from operations 50,771.95 458.04 51,229.99
II. Other income 18.06 - 18.06
III. Total Income (I+II) 50,790.01 458.04 51,248.05
IV. Expenses
Finance costs 11.17 167.83 179.00
Impairment on financial instruments - 10.38 10.38
Employee Benefits expenses 7,784.83 101.32 7,886.16
Depreciation, amortization and impairment 907.42 - 907.42
Other expenses 29,641.33 (1.12) 29,640.21
Total Expenses 38,344.75 278.41 38,623.17
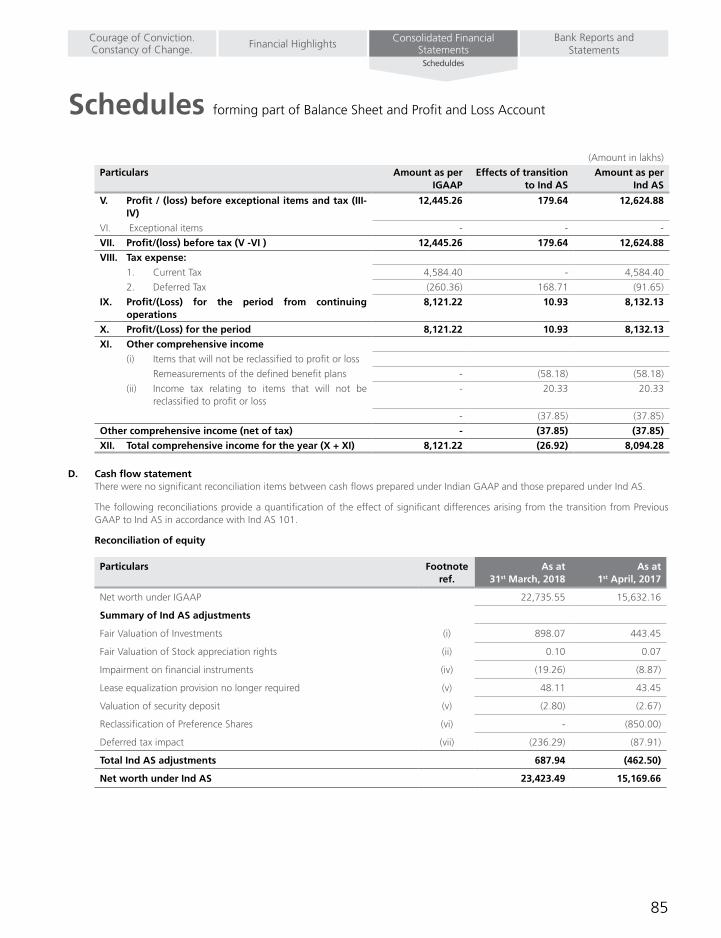
85
Schedules forming part of Balance Sheet and Profit and Loss Account
Bank Reports and Statements
Consolidated Financial StatementsFinancial HighlightsCourage of Conviction.
Constancy of Change.Scheduldes
(Amount in lakhs)
Particulars Amount as per IGAAP
Effects of transition to Ind AS
Amount as per Ind AS
V. Profit / (loss) before exceptional items and tax (III-IV)
12,445.26 179.64 12,624.88
VI. Exceptionalitems - - -
VII. Profit/(loss) before tax (V -VI ) 12,445.26 179.64 12,624.88
VIII. Tax expense:
1. Current Tax 4,584.40 - 4,584.40
2. Deferred Tax (260.36) 168.71 (91.65)
IX. Profit/(Loss) for the period from continuing operations
8,121.22 10.93 8,132.13
X. Profit/(Loss) for the period 8,121.22 10.93 8,132.13
XI. Other comprehensive income
(i) Items that will not be reclassified to profit or loss
Remeasurements of the defined benefit plans - (58.18) (58.18)
(ii) Income tax relating to items that will not be reclassified to profit or loss
- 20.33 20.33
- (37.85) (37.85)
Other comprehensive income (net of tax) - (37.85) (37.85)
XII. Total comprehensive income for the year (X + XI) 8,121.22 (26.92) 8,094.28
D. Cash flow statement There were no significant reconciliation items between cash flows prepared under Indian GAAP and those prepared under Ind AS.
The following reconciliations provide a quantification of the effect of significant differences arising from the transition from Previous GAAP to Ind AS in accordance with Ind AS 101.
Reconciliation of equity
Particulars Footnote ref.
As at 31st March, 2018
As at 1st April, 2017
Net worth under IGAAP 22,735.55 15,632.16
Summary of Ind AS adjustments
FairValuationofInvestments (i) 898.07 443.45
FairValuationofStockappreciationrights (ii) 0.10 0.07
Impairment on financial instruments (iv) (19.26) (8.87)
Lease equalization provision no longer required (v) 48.11 43.45
Valuationofsecuritydeposit (v) (2.80) (2.67)
Reclassification of Preference Shares (vi) - (850.00)
Deferred tax impact (vii) (236.29) (87.91)
Total Ind AS adjustments 687.94 (462.50)
Net worth under Ind AS 23,423.49 15,169.66

86 Annual Report 2018-19
Schedules forming part of Balance Sheet and Profit and Loss Account
Reconciliation of total comprehensive income
Particulars Footnote ref.
For the year ended 31st March, 2018
Net Profit After Tax as per IGAAP 8,121.22
FairValuationofInvestments (i) 454.62
FairValuationofEmployeestockoptionplan/Stockappreciationrights (ii) & (iii) (159.51)
Impairment on financial instruments (iv) (10.38)
Lease equalization provision no longer required (v) 4.67
Valuationofsecuritydeposit (v) (0.12)
Reclassification of preference share dividend and dividend distribution tax (vi) (86.96)
Premium paid on redemption on preference share (vi) (80.87)
Deferred tax impact (vii) (168.71)
Recognition of actuarial gain/loss in other comprehensive income (viii) 58.18
Total Ind AS adjustments 10.92
Net Profit After Tax as per Ind AS 8,132.14
Other comprehensive income (Net of tax) (37.85)
Total comprehensive income for the year as per Ind AS 8,094.29
Notes to the reconciliation:
(i) Under IGAAP, Mutual Funds Investments were carried at cost . Under Ind AS, Mutual Funds Investments are fair valued at the period end and resulting mark to market loss or gain is transferred to Statement of Profit and Loss.
(ii) Under IGAAP, expenses in relation to SARs were measured with reference to intrinsic value and the corresponding sum was reflected as part of the provision for SARs. Under Ind AS, the expense in relation to the SARs are required to be measured at fair value and to be presented as a liability.
(iii) The ESOP are granted by the Kotak Mahindra Bank Limited (Ultimate holding company) to the eligible employees of KMAMC. Under IGAAP, the company did not recognized the intrinsic value for the ESOP plan as an expense. Ind AS requires the fair value of the share options to be determined using an appropriate pricing model recognized over the vesting period.
(iv) Under IGAAP, the Company has not created provision for impairment of receivables and other financial assets. Under Ind AS, impairment allowance has been determined based on Expected Credit Loss (ECL) model.
(v) The difference between the fair value and the transaction price has been recognized as prepaid rent and is amortized over the period of the lease on straight-line basis. Subsequently, these security deposits have been measured at amortized cost using the effectiveinterestrate(‘EIR’)andtheresultantinterestisaccountedasfinanceincome.
(vi) Under IGAAP, convertible preference shares were disclosed at their carrying amount and classified as equity. Under Ind AS, these instruments are segregated into equity and financial liability measured at amortized cost as per Ind AS 32. Under IGAAP, dividend in respect of preference shares were recorded in retained earnings and the Statement of Profit and Loss respectively. Under Ind AS, since some of these convertible instruments are classified as financial liability, the dividend and tax thereon along with the premium paid on same has been recognized as finance cost in the Statement of Profit and Loss.
(vii) Deferred tax assets / (liabilities) :
IGAAP requires deferred tax accounting using the income statement approach, which focuses on differences between taxable profits and accounting profits for the period. Ind AS 12 requires entities to account for deferred taxes using the Balance Sheet approach, which focuses on temporary differences between the carrying amount of an asset or liability in the Balance Sheet and its tax base. The adjustment under Ind AS are resulted into recognition of deferred tax on new temporary differences which was not required under Indian GAAP.
(viii) Remeasurements on defined benefit liability:
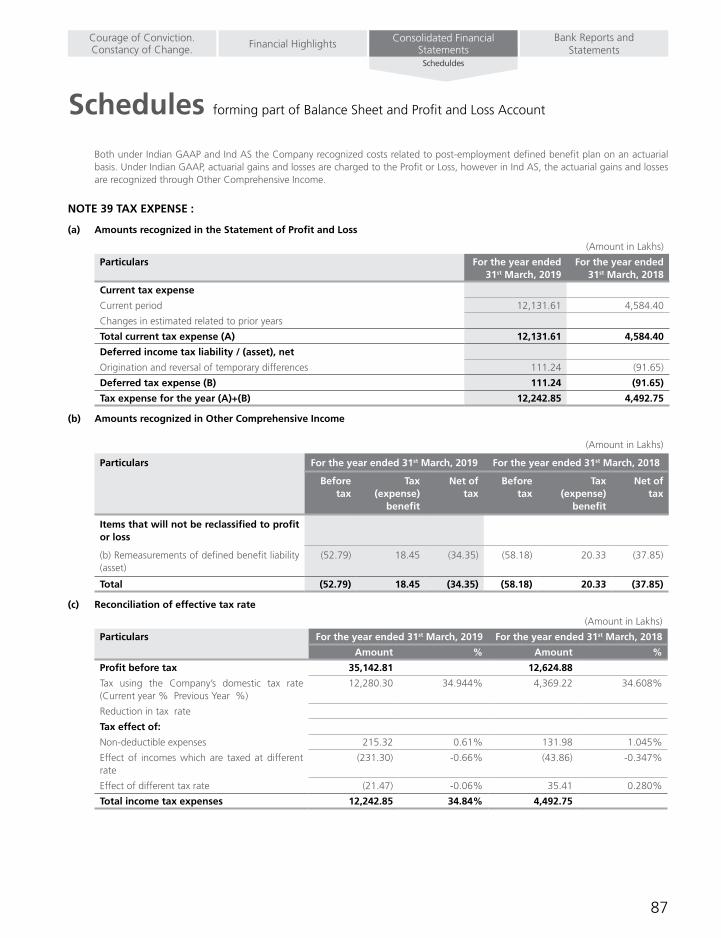
87
Schedules forming part of Balance Sheet and Profit and Loss Account
Bank Reports and Statements
Consolidated Financial StatementsFinancial HighlightsCourage of Conviction.
Constancy of Change.Scheduldes
Both under Indian GAAP and Ind AS the Company recognized costs related to post-employment defined benefit plan on an actuarial basis. Under Indian GAAP, actuarial gains and losses are charged to the Profit or Loss, however in Ind AS, the actuarial gains and losses are recognized through Other Comprehensive Income.
NOTE 39 TAX EXPENSE :
(a) Amounts recognized in the Statement of Profit and Loss
(Amount in Lakhs)
Particulars For the year ended 31st March, 2019
For the year ended 31st March, 2018
Current tax expense
Current period 12,131.61 4,584.40
Changes in estimated related to prior years
Total current tax expense (A) 12,131.61 4,584.40
Deferred income tax liability / (asset), net
Origination and reversal of temporary differences 111.24 (91.65)
Deferred tax expense (B) 111.24 (91.65)
Tax expense for the year (A)+(B) 12,242.85 4,492.75
(b) Amounts recognized in Other Comprehensive Income
(Amount in Lakhs)
Particulars For the year ended 31st March, 2019 For the year ended 31st March, 2018
Before tax
Tax (expense)
benefit
Net of tax
Before tax
Tax (expense)
benefit
Net of tax
Items that will not be reclassified to profit or loss
(b) Remeasurements of defined benefit liability (asset)
(52.79) 18.45 (34.35) (58.18) 20.33 (37.85)
Total (52.79) 18.45 (34.35) (58.18) 20.33 (37.85)
(c) Reconciliation of effective tax rate
(Amount in Lakhs)
Particulars For the year ended 31st March, 2019 For the year ended 31st March, 2018
Amount % Amount %
Profit before tax 35,142.81 12,624.88
Tax using the Company’s domestic tax rate(Current year % Previous Year %)
12,280.30 34.944% 4,369.22 34.608%
Reduction in tax rate
Tax effect of:
Non-deductible expenses 215.32 0.61% 131.98 1.045%
Effect of incomes which are taxed at different rate
(231.30) -0.66% (43.86) -0.347%
Effect of different tax rate (21.47) -0.06% 35.41 0.280%
Total income tax expenses 12,242.85 34.84% 4,492.75
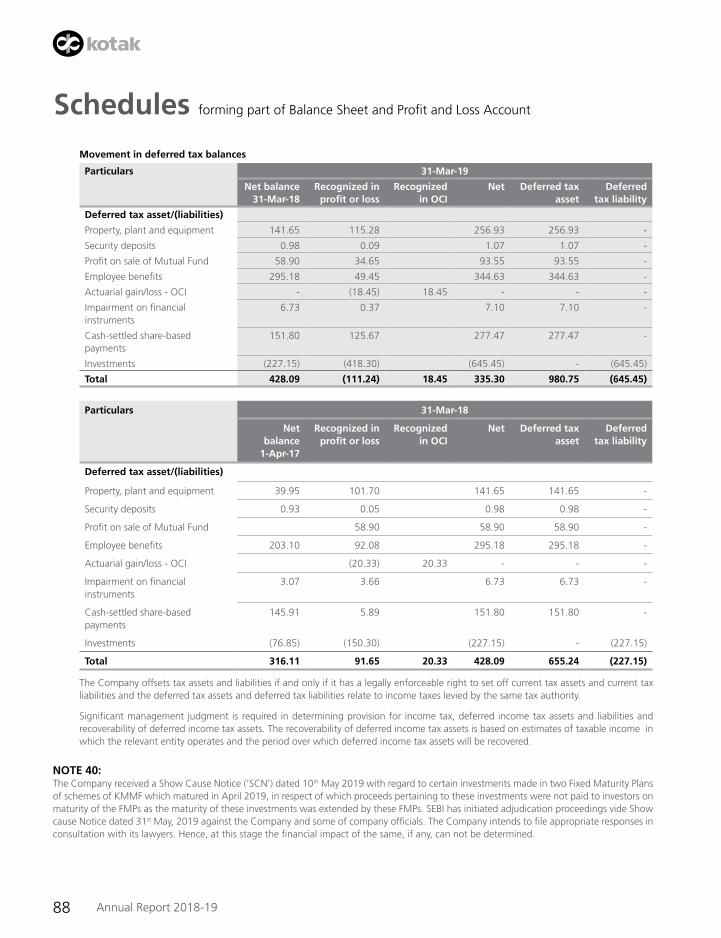
88 Annual Report 2018-19
Schedules forming part of Balance Sheet and Profit and Loss Account
Movement in deferred tax balances
Particulars 31-Mar-19
Net balance 31-Mar-18
Recognized in profit or loss
Recognized in OCI
Net Deferred tax asset
Deferred tax liability
Deferred tax asset/(liabilities)
Property, plant and equipment 141.65 115.28 256.93 256.93 -
Security deposits 0.98 0.09 1.07 1.07 -
Profit on sale of Mutual Fund 58.90 34.65 93.55 93.55 -
Employee benefits 295.18 49.45 344.63 344.63 -
Actuarial gain/loss - OCI - (18.45) 18.45 - - -
Impairment on financial instruments
6.73 0.37 7.10 7.10 -
Cash-settled share-based payments
151.80 125.67 277.47 277.47 -
Investments (227.15) (418.30) (645.45) - (645.45)
Total 428.09 (111.24) 18.45 335.30 980.75 (645.45)
Particulars 31-Mar-18
Net balance
1-Apr-17
Recognized in profit or loss
Recognized in OCI
Net Deferred tax asset
Deferred tax liability
Deferred tax asset/(liabilities)
Property, plant and equipment 39.95 101.70 141.65 141.65 -
Security deposits 0.93 0.05 0.98 0.98 -
Profit on sale of Mutual Fund 58.90 58.90 58.90 -
Employee benefits 203.10 92.08 295.18 295.18 -
Actuarial gain/loss - OCI (20.33) 20.33 - - -
Impairment on financial instruments
3.07 3.66 6.73 6.73 -
Cash-settled share-based payments
145.91 5.89 151.80 151.80 -
Investments (76.85) (150.30) (227.15) - (227.15)
Total 316.11 91.65 20.33 428.09 655.24 (227.15)
The Company offsets tax assets and liabilities if and only if it has a legally enforceable right to set off current tax assets and current tax liabilities and the deferred tax assets and deferred tax liabilities relate to income taxes levied by the same tax authority.
Significant management judgment is required in determining provision for income tax, deferred income tax assets and liabilities and recoverability of deferred income tax assets. The recoverability of deferred income tax assets is based on estimates of taxable income in which the relevant entity operates and the period over which deferred income tax assets will be recovered.
NOTE 40:TheCompanyreceivedaShowCauseNotice(‘SCN’)dated10th May 2019 with regard to certain investments made in two Fixed Maturity Plans of schemes of KMMF which matured in April 2019, in respect of which proceeds pertaining to these investments were not paid to investors on maturity of the FMPs as the maturity of these investments was extended by these FMPs. SEBI has initiated adjudication proceedings vide Show cause Notice dated 31st May, 2019 against the Company and some of company officials. The Company intends to file appropriate responses in consultation with its lawyers. Hence, at this stage the financial impact of the same, if any, can not be determined.
Annual Report 2018-19
Courage of Conviction.
Constancy of Change.
Kotak M
ahindra Bank Limited | Thirty Fourth A
nnual Report 2018-19
Kotak Mahindra Bank Limited, 27BKC, C 27, G Block, Bandra-Kurla Complex, Bandra (E),
Mumbai - 400 051Website: www.kotak.com
BSE: 500247 | NSE: KOTAKBANK | Bloomberg: KMB:IN
CIN: L65110MH1985PLC038137 conc
ept a
nd d
esig
n at
Wya
ttPr
ism C
omm
unic
atio
ns