indicador de desempenho oee - overall equipment effectiveness
Upload
marco-buenoCategory
view
95download
1
OEE on HANAOverview of the Solution Capability and ArchitectureSAP Manufacturing Performance ManagementAugust 2012
© 2011 SAP AG. All rights reserved. 2
What is OEE?
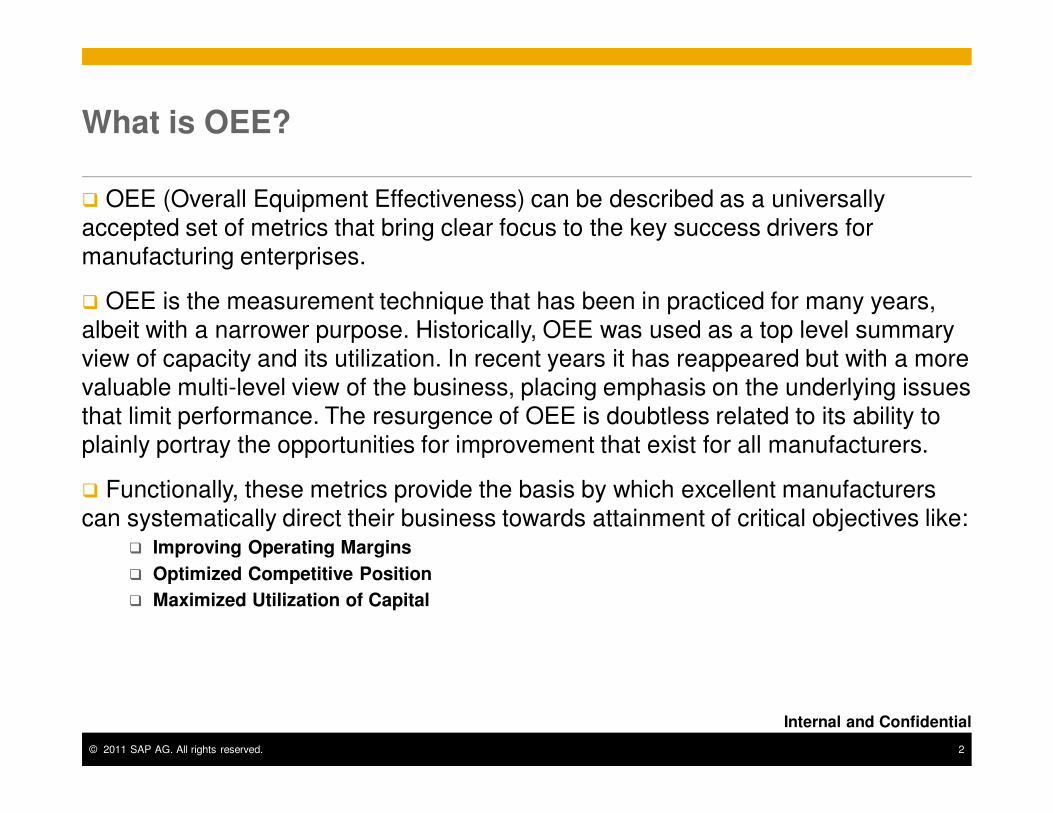
� OEE (Overall Equipment Effectiveness) can be described as a universally
accepted set of metrics that bring clear focus to the key success drivers for
manufacturing enterprises.
� OEE is the measurement technique that has been in practiced for many years,
albeit with a narrower purpose. Historically, OEE was used as a top level summary
view of capacity and its utilization. In recent years it has reappeared but with a more
valuable multi-level view of the business, placing emphasis on the underlying issues
that limit performance. The resurgence of OEE is doubtless related to its ability to
plainly portray the opportunities for improvement that exist for all manufacturers.
� Functionally, these metrics provide the basis by which excellent manufacturers
can systematically direct their business towards attainment of critical objectives like:� Improving Operating Margins
� Optimized Competitive Position
� Maximized Utilization of Capital
Internal and Confidential
© 2011 SAP AG. All rights reserved. 3
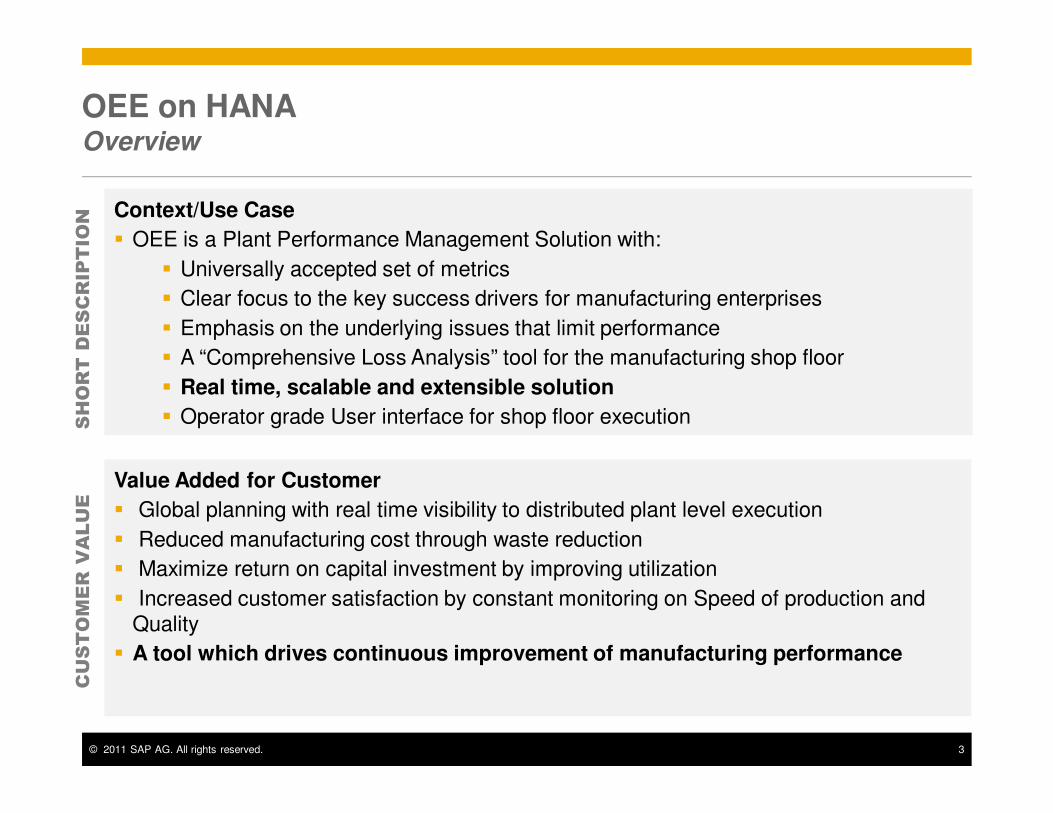
OEE on HANAOverview
Value Added for Customer
� Global planning with real time visibility to distributed plant level execution
� Reduced manufacturing cost through waste reduction
� Maximize return on capital investment by improving utilization
� Increased customer satisfaction by constant monitoring on Speed of production and Quality
� A tool which drives continuous improvement of manufacturing performance
CUSTOMER VALUE
SHORT DESCRIPTIO
N Context/Use Case
� OEE is a Plant Performance Management Solution with:
� Universally accepted set of metrics
� Clear focus to the key success drivers for manufacturing enterprises
� Emphasis on the underlying issues that limit performance
� A “Comprehensive Loss Analysis” tool for the manufacturing shop floor
� Real time, scalable and extensible solution
� Operator grade User interface for shop floor execution
© 2011 SAP AG. All rights reserved. 4
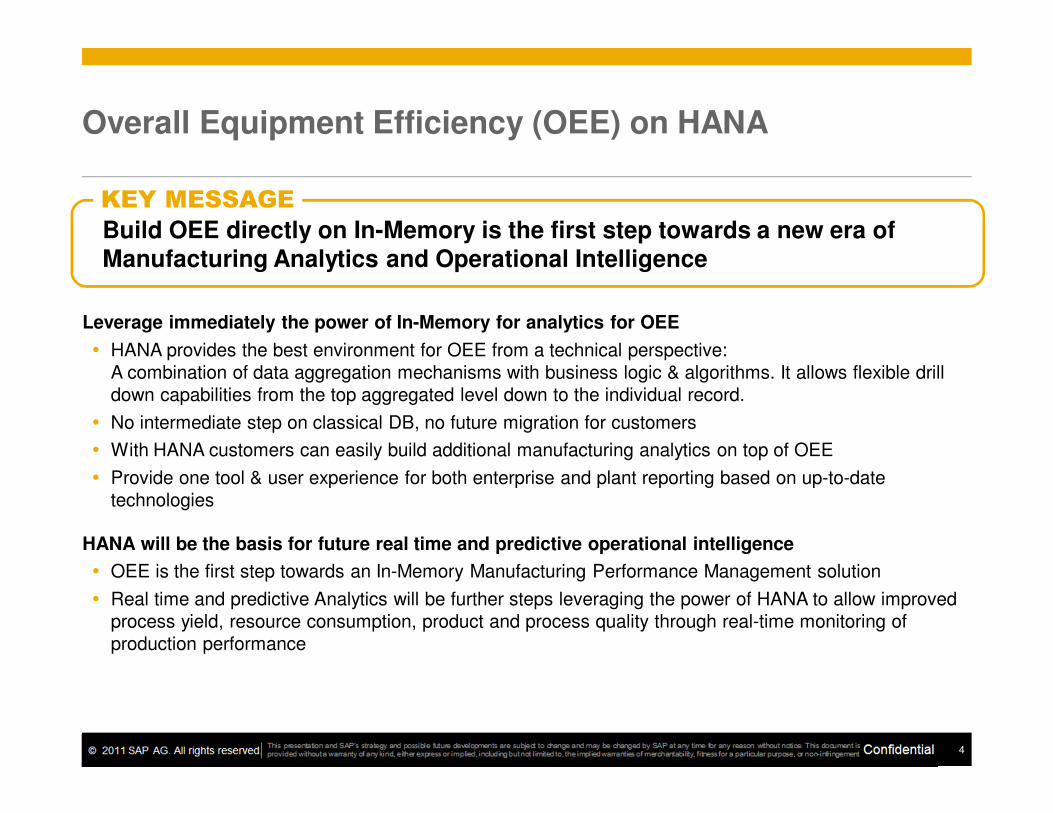
Overall Equipment Efficiency (OEE) on HANA
Leverage immediately the power of In-Memory for analytics for OEE
� HANA provides the best environment for OEE from a technical perspective:
A combination of data aggregation mechanisms with business logic & algorithms. It allows flexible drill
down capabilities from the top aggregated level down to the individual record.
� No intermediate step on classical DB, no future migration for customers
� With HANA customers can easily build additional manufacturing analytics on top of OEE
� Provide one tool & user experience for both enterprise and plant reporting based on up-to-date
technologies
HANA will be the basis for future real time and predictive operational intelligence
� OEE is the first step towards an In-Memory Manufacturing Performance Management solution
� Real time and predictive Analytics will be further steps leveraging the power of HANA to allow improved
process yield, resource consumption, product and process quality through real-time monitoring of
production performance
Build OEE directly on In-Memory is the first step towards a new era of Manufacturing Analytics and Operational Intelligence
KEY MESSAGE
© 2011 SAP AG. All rights reserved. 5
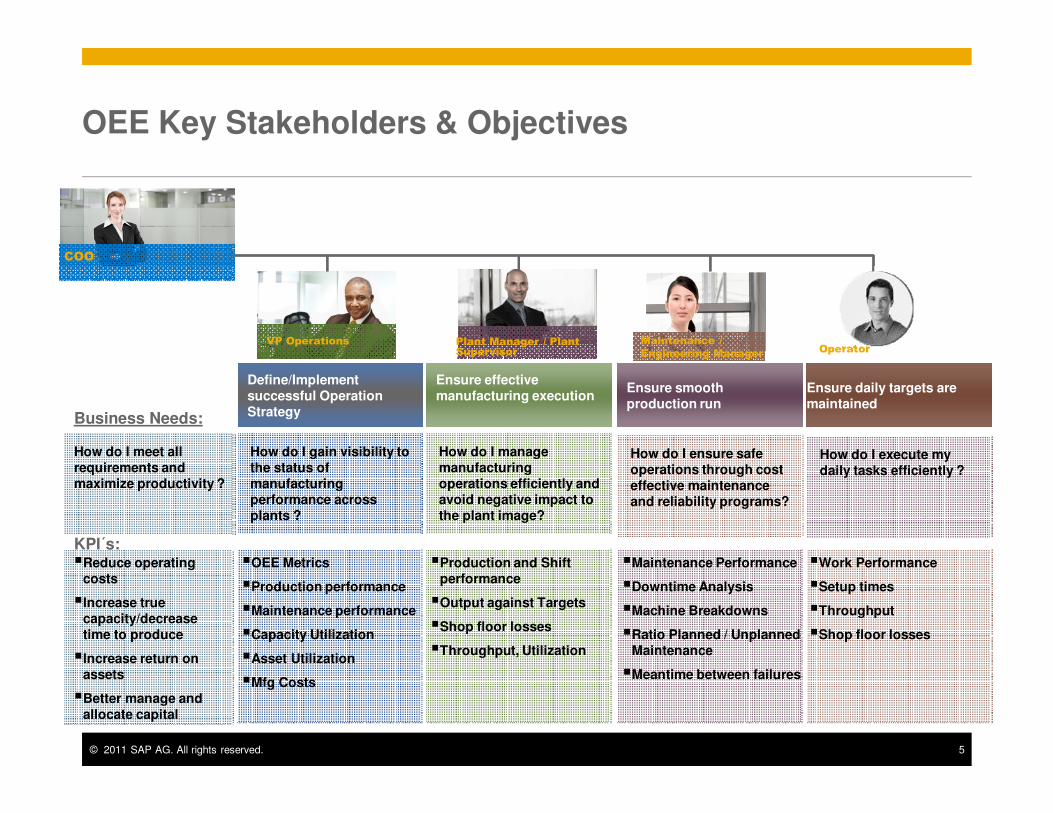
OEE Key Stakeholders & Objectives
Ensure effective manufacturing execution
Ensure smooth production run
Define/Implement successful Operation Strategy
How do I meet all requirements and maximize productivity ?
How do I gain visibility to the status of manufacturing performance across plants ?
How do I manage manufacturing operations efficiently and avoid negative impact to the plant image?
How do I execute my daily tasks efficiently ?
�Reduce operating costs
�Increase true capacity/decrease time to produce
�Increase return on assets
�Better manage and allocate capital
How do I ensure safe operations through cost effective maintenance and reliability programs?
Ensure daily targets are maintained
�OEE Metrics
�Production performance
�Maintenance performance
�Capacity Utilization
�Asset Utilization
�Mfg Costs
�Production and Shift performance
�Output against Targets
�Shop floor losses
�Throughput, Utilization
�Maintenance Performance
�Downtime Analysis
�Machine Breakdowns
�Ratio Planned / Unplanned Maintenance
�Meantime between failures
�Work Performance
�Setup times
�Throughput
�Shop floor losses
COO
Maintenance /
Engineering Manager
KPI´s:
Business Needs:
VP Operations Plant Manager / Plant Supervisor Operator
© 2011 SAP AG. All rights reserved. 6
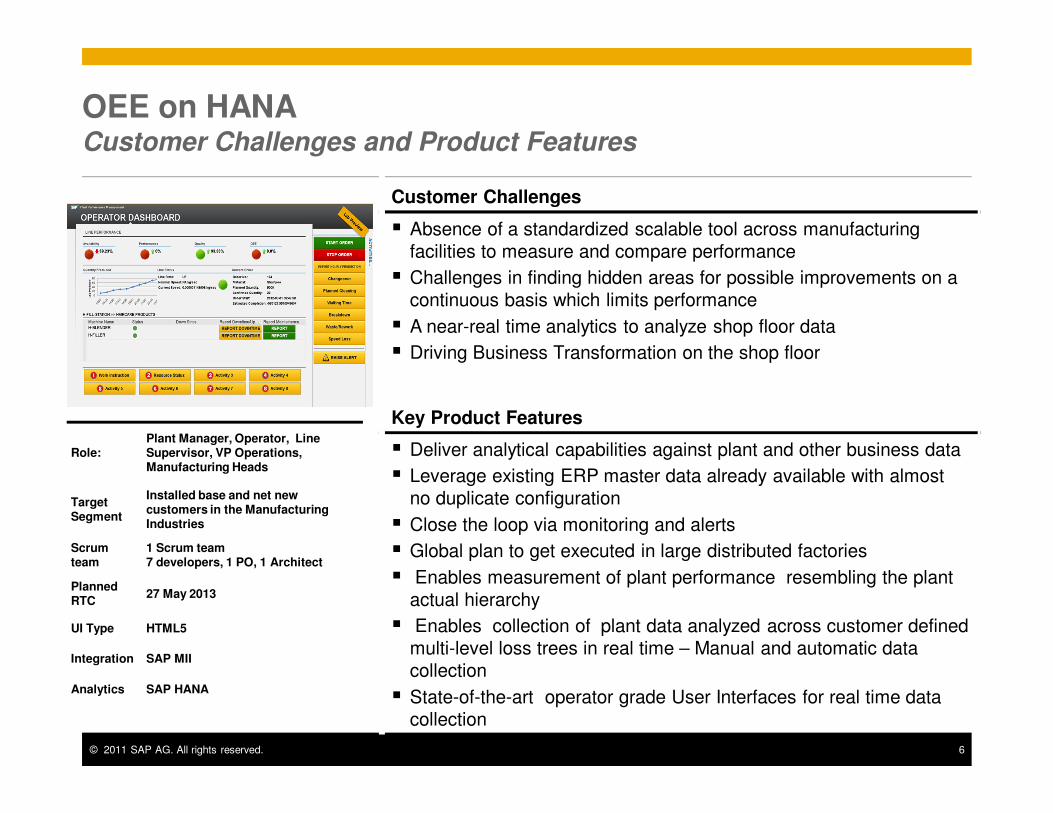
Customer Challenges
� Absence of a standardized scalable tool across manufacturing
facilities to measure and compare performance
� Challenges in finding hidden areas for possible improvements on a
continuous basis which limits performance
� A near-real time analytics to analyze shop floor data
� Driving Business Transformation on the shop floor
Key Product Features
� Deliver analytical capabilities against plant and other business data
� Leverage existing ERP master data already available with almost
no duplicate configuration
� Close the loop via monitoring and alerts
� Global plan to get executed in large distributed factories
� Enables measurement of plant performance resembling the plant
actual hierarchy
� Enables collection of plant data analyzed across customer defined
multi-level loss trees in real time – Manual and automatic data
collection
� State-of-the-art operator grade User Interfaces for real time data
collection
Role:Plant Manager, Operator, LineSupervisor, VP Operations, Manufacturing Heads
Target Segment
Installed base and net new customers in the Manufacturing Industries
Scrum team
1 Scrum team7 developers, 1 PO, 1 Architect
Planned RTC
27 May 2013
UI Type HTML5
Integration SAP MII
Analytics SAP HANA
OEE on HANA Customer Challenges and Product Features
© 2011 SAP AG. All rights reserved. 7
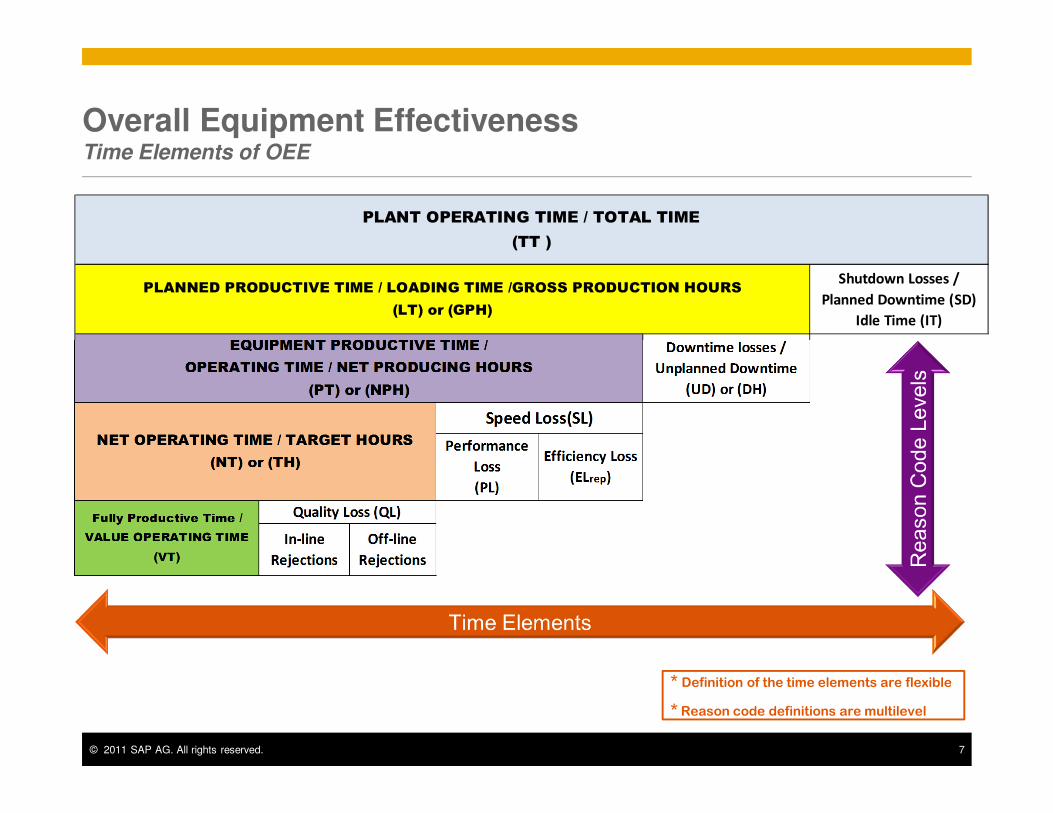
Overall Equipment EffectivenessTime Elements of OEE
Efficiency Loss
(ELrep)
Speed Loss(SL)
Quality Loss (QL)
In-line
Rejections
Off-line
Rejections
NET OPERATING TIME / TARGET HOURS
(NT) or (TH)
Fully Productive Time /
VALUE OPERATING TIME
(VT)
Performance
Loss
(PL)
PLANT OPERATING TIME / TOTAL TIME
(TT )
PLANNED PRODUCTIVE TIME / LOADING TIME /GROSS PRODUCTION HOURS
(LT) or (GPH)
Shutdown Losses /
Planned Downtime (SD)
Idle Time (IT)
EQUIPMENT PRODUCTIVE TIME /
OPERATING TIME / NET PRODUCING HOURS
(PT) or (NPH)
Downtime losses /
Unplanned Downtime
(UD) or (DH)
* Definition of the time elements are flexible
* Reason code definitions are multilevel
© 2011 SAP AG. All rights reserved. 8
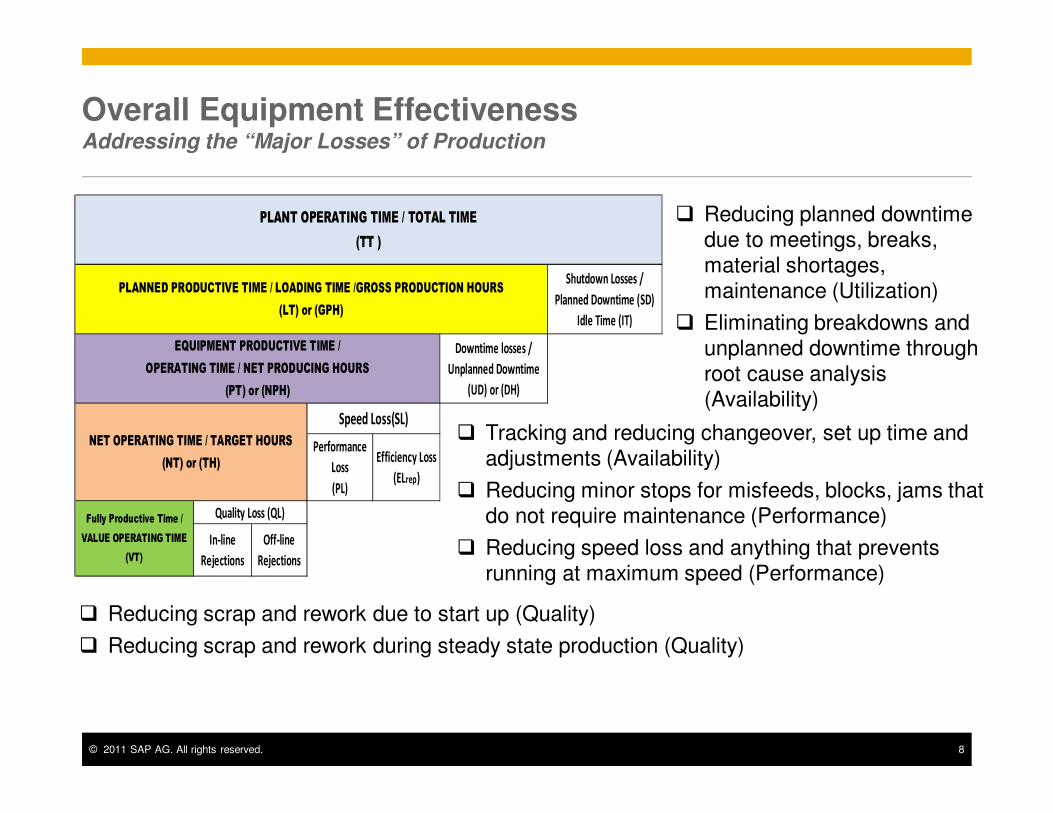
Overall Equipment EffectivenessAddressing the “Major Losses” of Production
� Reducing planned downtime due to meetings, breaks, material shortages, maintenance (Utilization)
� Eliminating breakdowns and unplanned downtime through root cause analysis (Availability)
� Tracking and reducing changeover, set up time and adjustments (Availability)
� Reducing minor stops for misfeeds, blocks, jams that do not require maintenance (Performance)
� Reducing speed loss and anything that prevents running at maximum speed (Performance)
� Reducing scrap and rework due to start up (Quality)
� Reducing scrap and rework during steady state production (Quality)
Efficiency Loss
(ELrep)
Speed Loss(SL)
Quality Loss (QL)
In-line
Rejections
Off-line
Rejections
NET OPERATING TIME / TARGET HOURS
(NT) or (TH)
Fully Productive Time /
VALUE OPERATING TIME
(VT)
Performance
Loss
(PL)
PLANT OPERATING TIME / TOTAL TIME
(TT )
PLANNED PRODUCTIVE TIME / LOADING TIME /GROSS PRODUCTION HOURS
(LT) or (GPH)
Shutdown Losses /
Planned Downtime (SD)
Idle Time (IT)
EQUIPMENT PRODUCTIVE TIME /
OPERATING TIME / NET PRODUCING HOURS
(PT) or (NPH)
Downtime losses /
Unplanned Downtime
(UD) or (DH)
© 2011 SAP AG. All rights reserved. 9
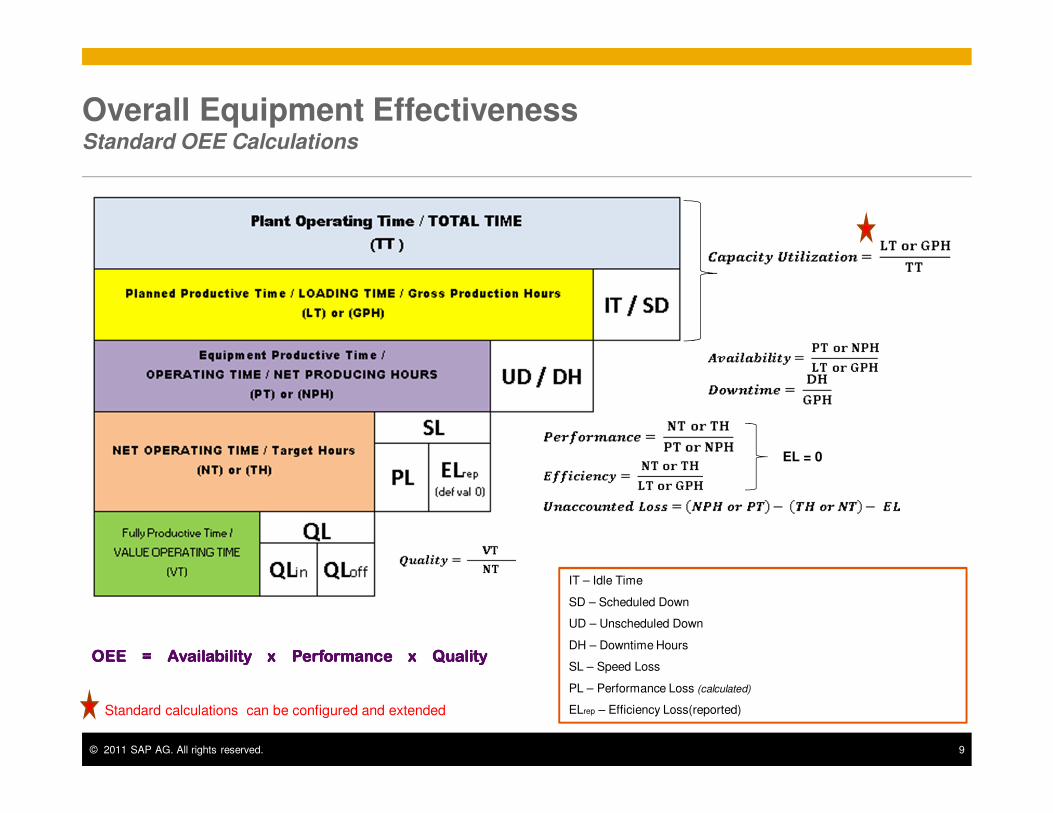
Overall Equipment EffectivenessStandard OEE Calculations
OEE = Availability x Performance x QualityOEE = Availability x Performance x QualityOEE = Availability x Performance x QualityOEE = Availability x Performance x Quality
IT – Idle Time
SD – Scheduled Down
UD – Unscheduled Down
DH – Downtime Hours
SL – Speed Loss
PL – Performance Loss (calculated)
ELrep – Efficiency Loss(reported)
EL = 0
Standard calculations can be configured and extended
OEE Operator UI
Contact information:
F name MI. L nameTitleAddressPhone number
© 2011 SAP AG. All rights reserved. 11
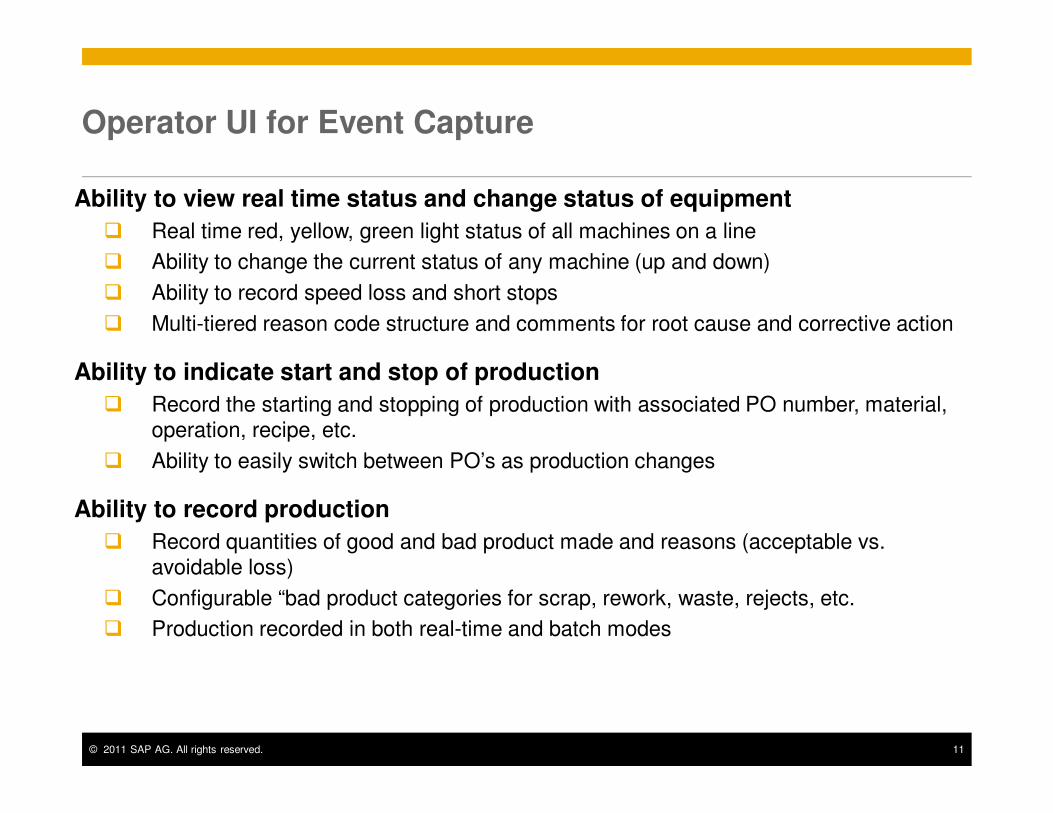
Operator UI for Event Capture
Ability to view real time status and change status of equipment
� Real time red, yellow, green light status of all machines on a line
� Ability to change the current status of any machine (up and down)
� Ability to record speed loss and short stops
� Multi-tiered reason code structure and comments for root cause and corrective action
Ability to indicate start and stop of production
� Record the starting and stopping of production with associated PO number, material, operation, recipe, etc.
� Ability to easily switch between PO’s as production changes
Ability to record production
� Record quantities of good and bad product made and reasons (acceptable vs. avoidable loss)
� Configurable “bad product categories for scrap, rework, waste, rejects, etc.
� Production recorded in both real-time and batch modes
© 2011 SAP AG. All rights reserved. 12
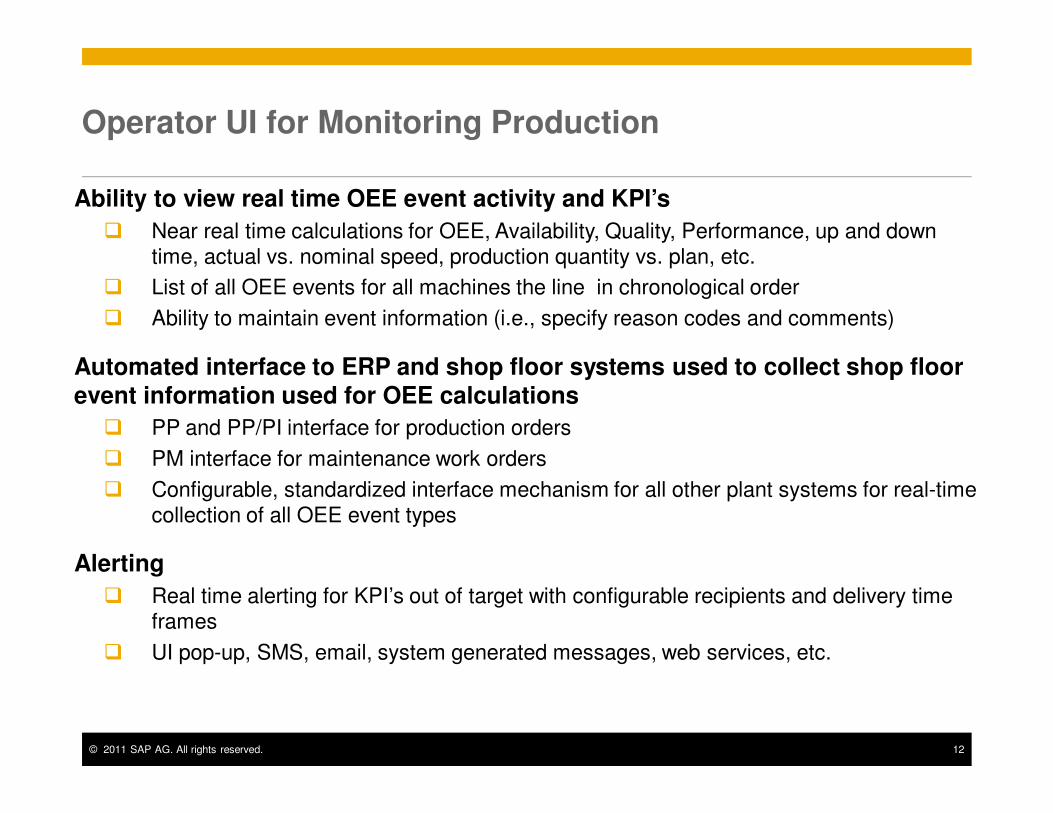
Operator UI for Monitoring Production
Ability to view real time OEE event activity and KPI’s
� Near real time calculations for OEE, Availability, Quality, Performance, up and down time, actual vs. nominal speed, production quantity vs. plan, etc.
� List of all OEE events for all machines the line in chronological order
� Ability to maintain event information (i.e., specify reason codes and comments)
Automated interface to ERP and shop floor systems used to collect shop floor event information used for OEE calculations
� PP and PP/PI interface for production orders
� PM interface for maintenance work orders
� Configurable, standardized interface mechanism for all other plant systems for real-time collection of all OEE event types
Alerting
� Real time alerting for KPI’s out of target with configurable recipients and delivery time frames
� UI pop-up, SMS, email, system generated messages, web services, etc.
© 2011 SAP AG. All rights reserved. 13
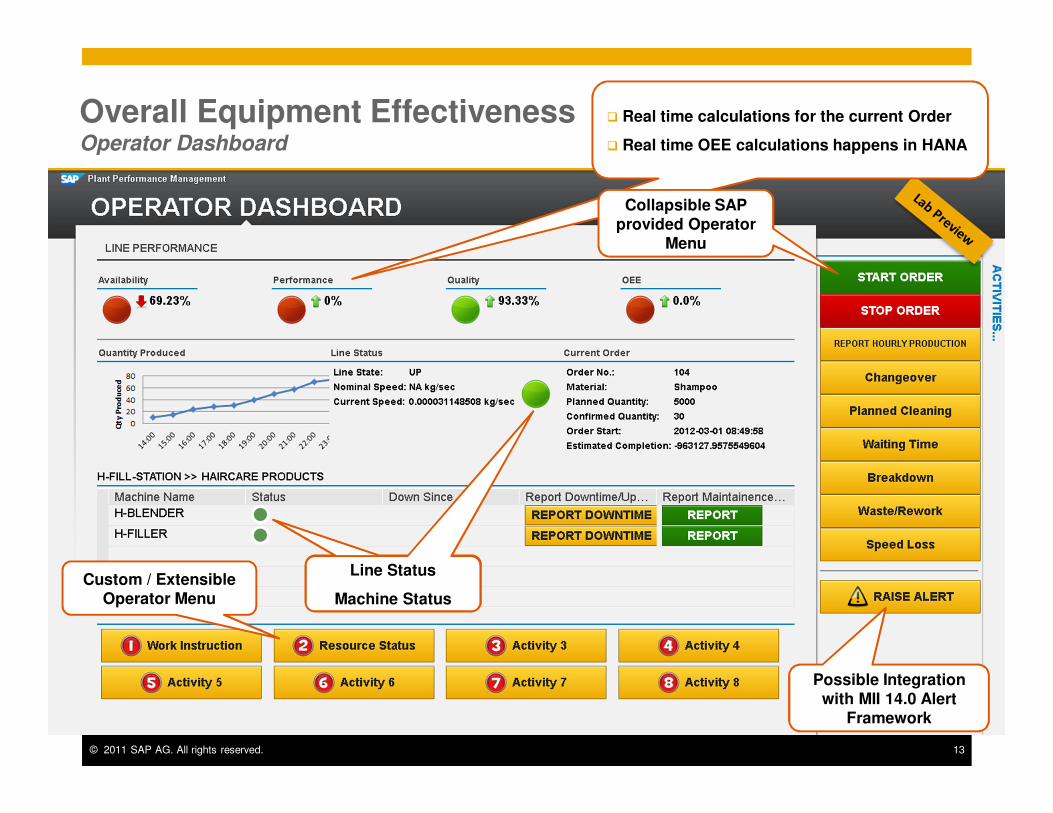
Overall Equipment EffectivenessOperator Dashboard
� Real time calculations for the current Order
� Real time OEE calculations happens in HANA
Custom / Extensible Operator Menu
Collapsible SAP provided Operator
Menu
Possible Integration with MII 14.0 Alert
Framework
Line Status
Machine Status
© 2011 SAP AG. All rights reserved. 14
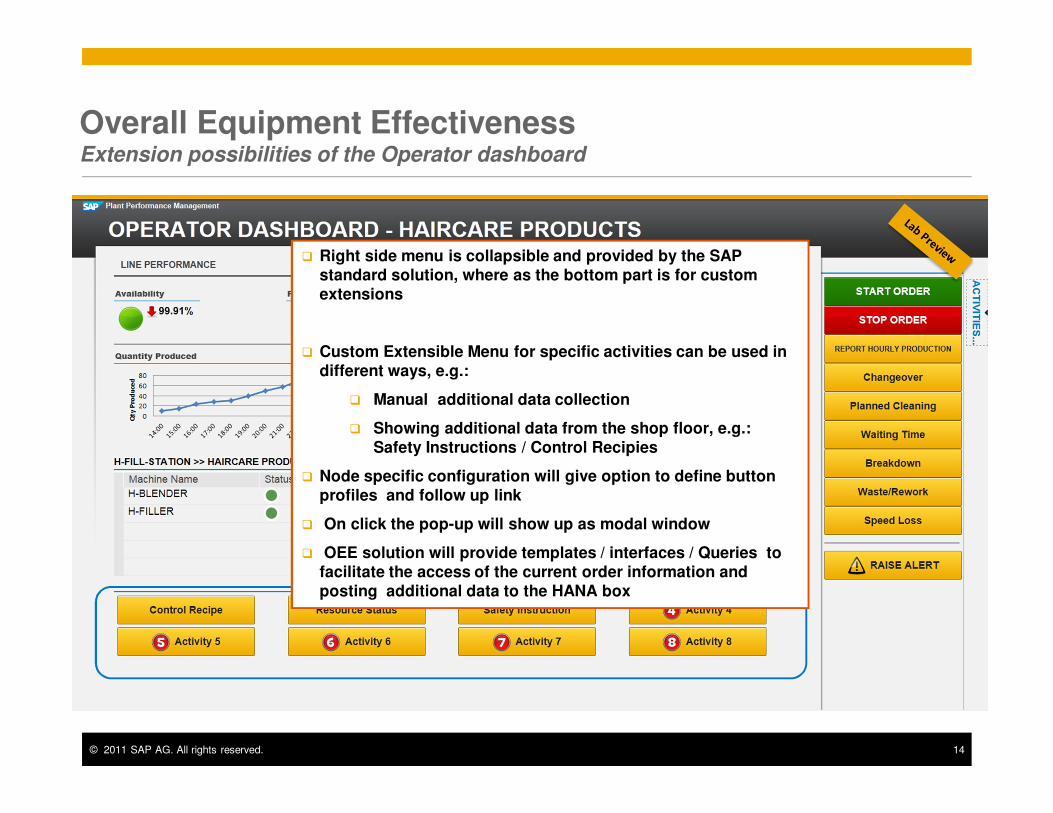
Overall Equipment EffectivenessExtension possibilities of the Operator dashboard
� Right side menu is collapsible and provided by the SAP standard solution, where as the bottom part is for custom extensions
� Custom Extensible Menu for specific activities can be used in different ways, e.g.:
� Manual additional data collection
� Showing additional data from the shop floor, e.g.: Safety Instructions / Control Recipies
� Node specific configuration will give option to define button profiles and follow up link
� On click the pop-up will show up as modal window
� OEE solution will provide templates / interfaces / Queries to facilitate the access of the current order information and posting additional data to the HANA box
© 2011 SAP AG. All rights reserved. 15
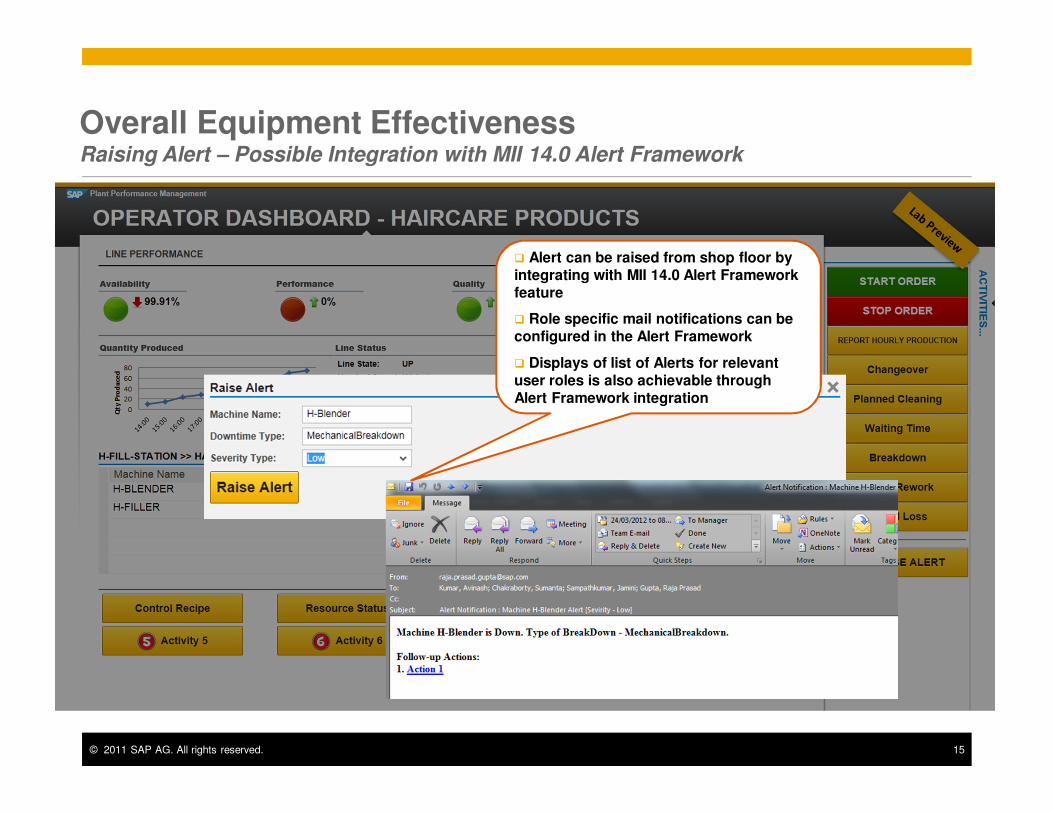
Overall Equipment EffectivenessRaising Alert – Possible Integration with MII 14.0 Alert Framework
� Alert can be raised from shop floor by integrating with MII 14.0 Alert Framework feature
� Role specific mail notifications can be configured in the Alert Framework
� Displays of list of Alerts for relevant user roles is also achievable through Alert Framework integration
OEE Dashboards and Analytics
Contact information:
F name MI. L nameTitleAddressPhone number
© 2011 SAP AG. All rights reserved. 17
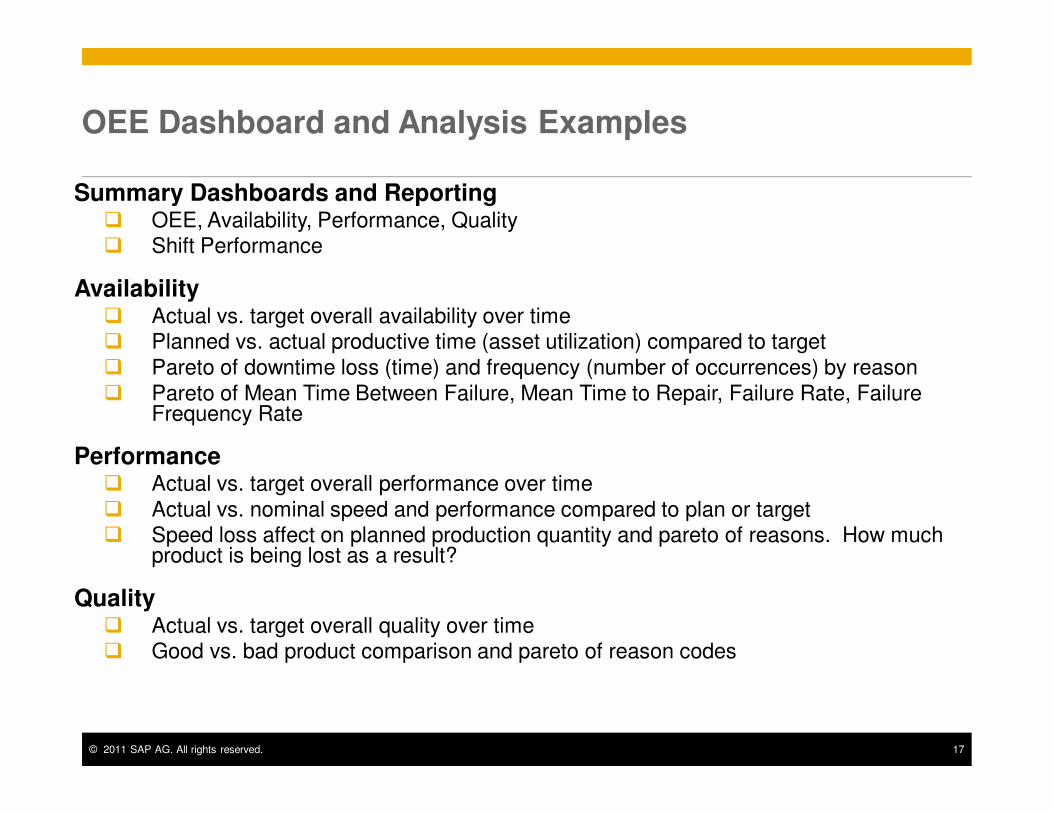
OEE Dashboard and Analysis Examples
Summary Dashboards and Reporting� OEE, Availability, Performance, Quality� Shift Performance
Availability� Actual vs. target overall availability over time� Planned vs. actual productive time (asset utilization) compared to target
� Pareto of downtime loss (time) and frequency (number of occurrences) by reason
� Pareto of Mean Time Between Failure, Mean Time to Repair, Failure Rate, Failure Frequency Rate
Performance� Actual vs. target overall performance over time
� Actual vs. nominal speed and performance compared to plan or target� Speed loss affect on planned production quantity and pareto of reasons. How much
product is being lost as a result?
Quality� Actual vs. target overall quality over time� Good vs. bad product comparison and pareto of reason codes
© 2011 SAP AG. All rights reserved. 18
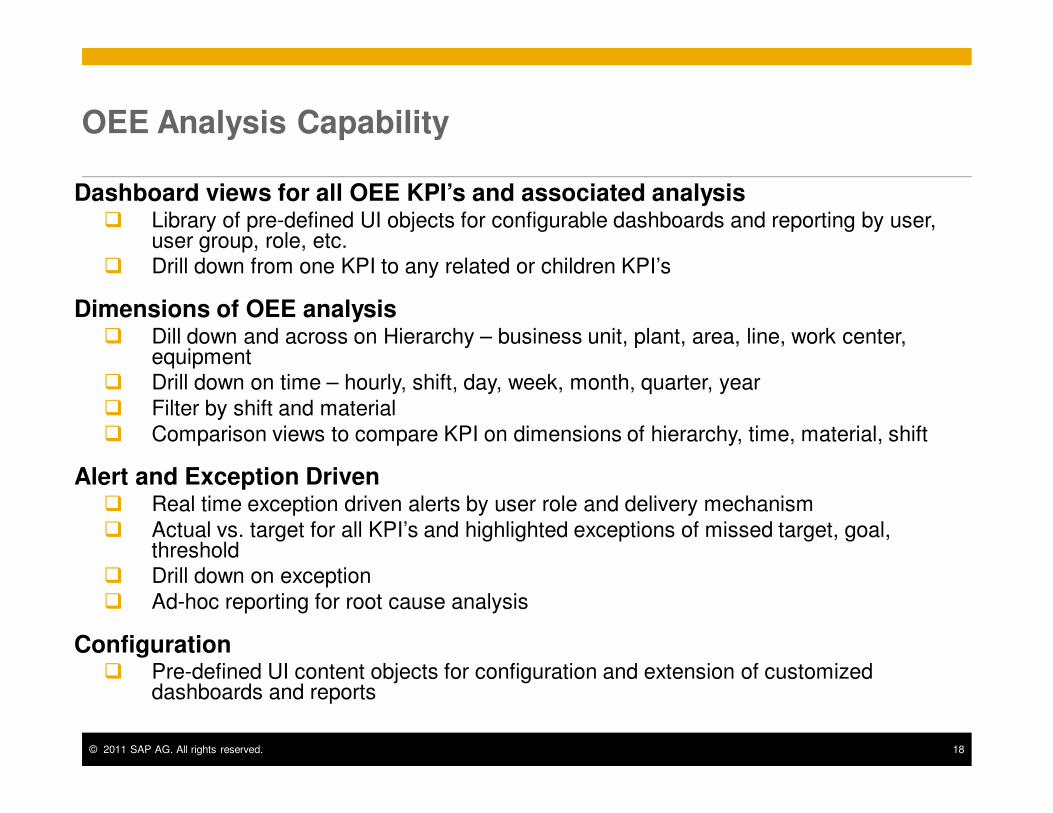
OEE Analysis Capability
Dashboard views for all OEE KPI’s and associated analysis� Library of pre-defined UI objects for configurable dashboards and reporting by user,
user group, role, etc.� Drill down from one KPI to any related or children KPI’s
Dimensions of OEE analysis� Dill down and across on Hierarchy – business unit, plant, area, line, work center,
equipment� Drill down on time – hourly, shift, day, week, month, quarter, year
� Filter by shift and material
� Comparison views to compare KPI on dimensions of hierarchy, time, material, shift
Alert and Exception Driven� Real time exception driven alerts by user role and delivery mechanism
� Actual vs. target for all KPI’s and highlighted exceptions of missed target, goal, threshold
� Drill down on exception
� Ad-hoc reporting for root cause analysis
Configuration� Pre-defined UI content objects for configuration and extension of customized
dashboards and reports
© 2011 SAP AG. All rights reserved. 19
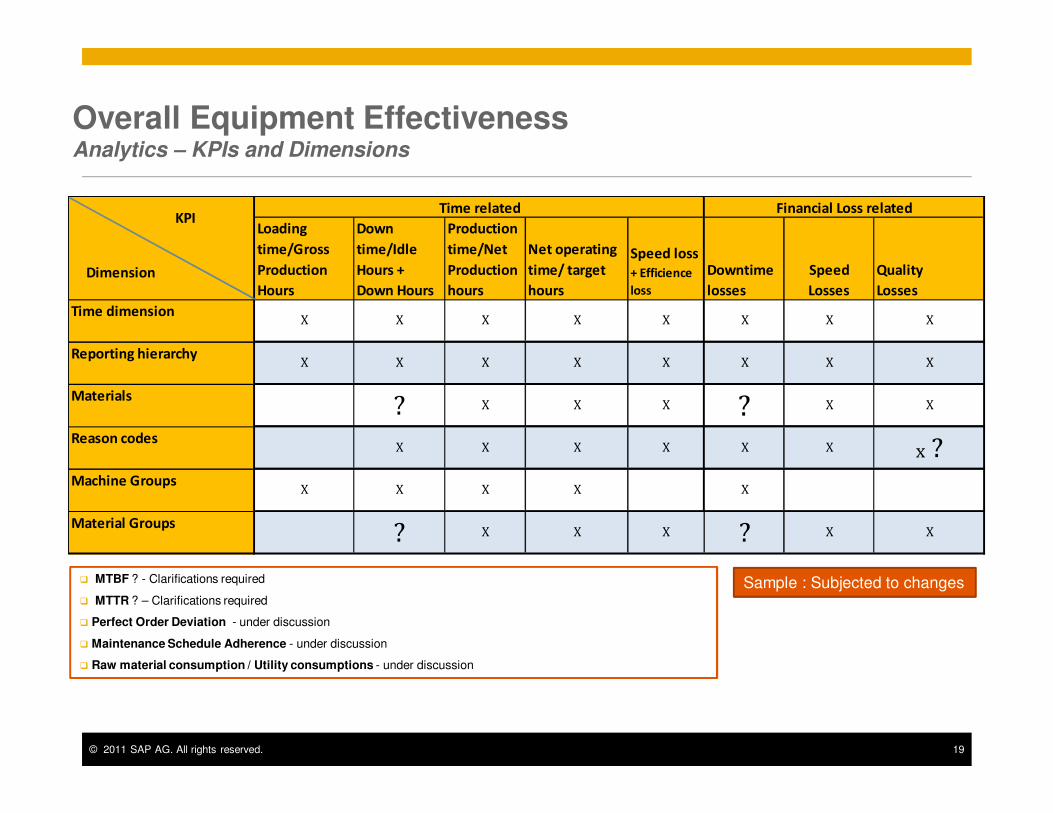
Loading
time/Gross
Production
Hours
Down
time/Idle
Hours +
Down Hours
Production
time/Net
Production
hours
Net operating
time/ target
hours
Speed loss
+ Efficience
loss
Downtime
losses
Speed
Losses
Quality
Losses
Time dimension
Reporting hierarchy
Materials
Reason codes
Machine Groups
Material Groups?XXX? XX
X X? X X X ?
X X x ?
XXXX
X X X X
X
XX X X X X X X
X XX X X X X X
Time related Financial Loss relatedKPI
Dimension
Overall Equipment EffectivenessAnalytics – KPIs and Dimensions
Sample : Subjected to changes� MTBF ? - Clarifications required
� MTTR ? – Clarifications required
� Perfect Order Deviation - under discussion
� Maintenance Schedule Adherence - under discussion
� Raw material consumption / Utility consumptions - under discussion
© 2011 SAP AG. All rights reserved. 20
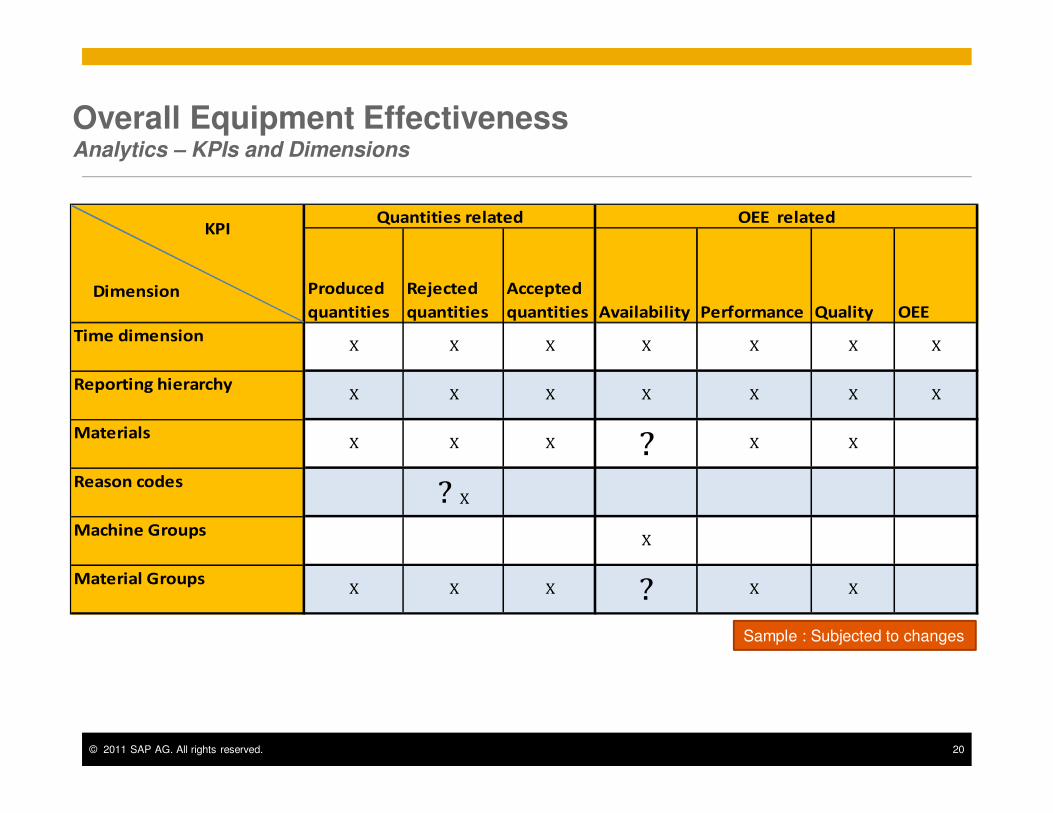
Overall Equipment EffectivenessAnalytics – KPIs and Dimensions
Produced
quantities
Rejected
quantities
Accepted
quantities Availability Performance Quality OEE
Time dimension
Reporting hierarchy
Materials
Reason codes
Machine Groups
Material Groups?XXX
X X
XX
X X X ?
? X
X X
X
X X X X X
X X XX X X X
Quantities related OEE relatedKPI
Dimension
Sample : Subjected to changes
© 2011 SAP AG. All rights reserved. 21
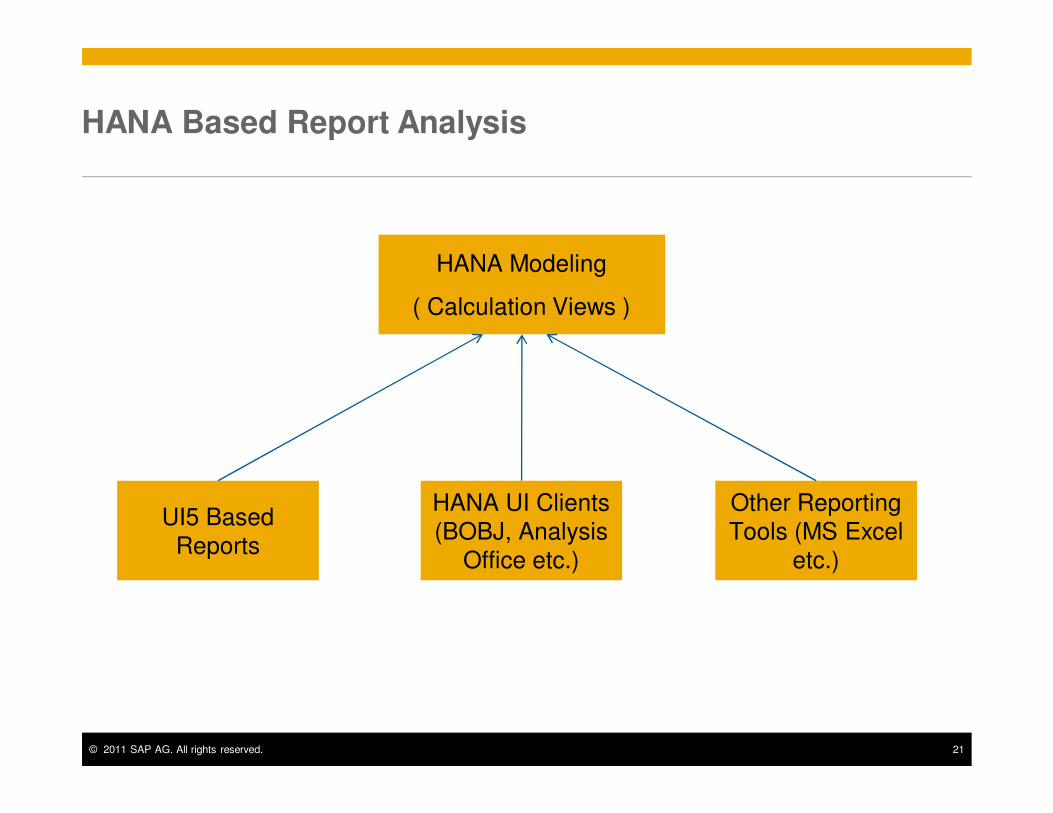
HANA Based Report Analysis
HANA Modeling
( Calculation Views )
UI5 Based
Reports
HANA UI Clients
(BOBJ, Analysis
Office etc.)
Other Reporting
Tools (MS Excel
etc.)
© 2011 SAP AG. All rights reserved. 22
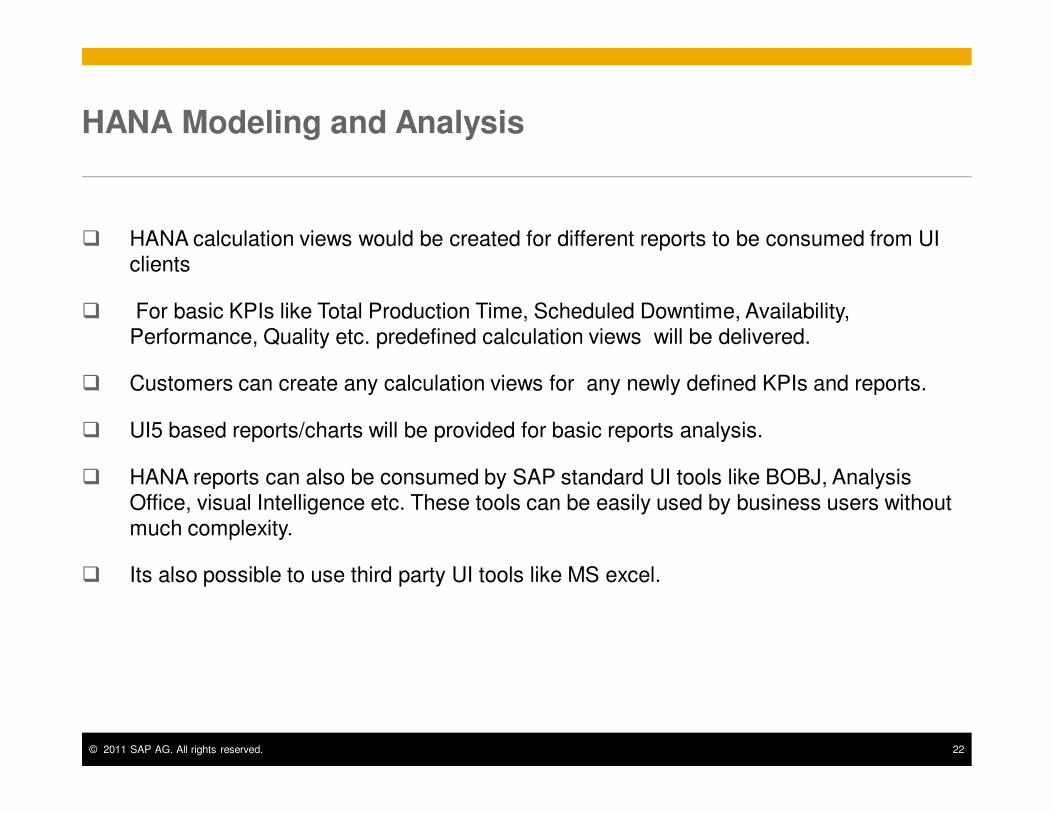
HANA Modeling and Analysis
� HANA calculation views would be created for different reports to be consumed from UI clients
� For basic KPIs like Total Production Time, Scheduled Downtime, Availability, Performance, Quality etc. predefined calculation views will be delivered.
� Customers can create any calculation views for any newly defined KPIs and reports.
� UI5 based reports/charts will be provided for basic reports analysis.
� HANA reports can also be consumed by SAP standard UI tools like BOBJ, Analysis Office, visual Intelligence etc. These tools can be easily used by business users without much complexity.
� Its also possible to use third party UI tools like MS excel.
© 2011 SAP AG. All rights reserved. 23
2011-12-
01
2011-12-
02
2011-12-
04
2011-12-
06
2011-12-
07
2011-12-
08
2011-12-
09
2011-12-
10
2011-12-
11
2011-12-
12
1200
004
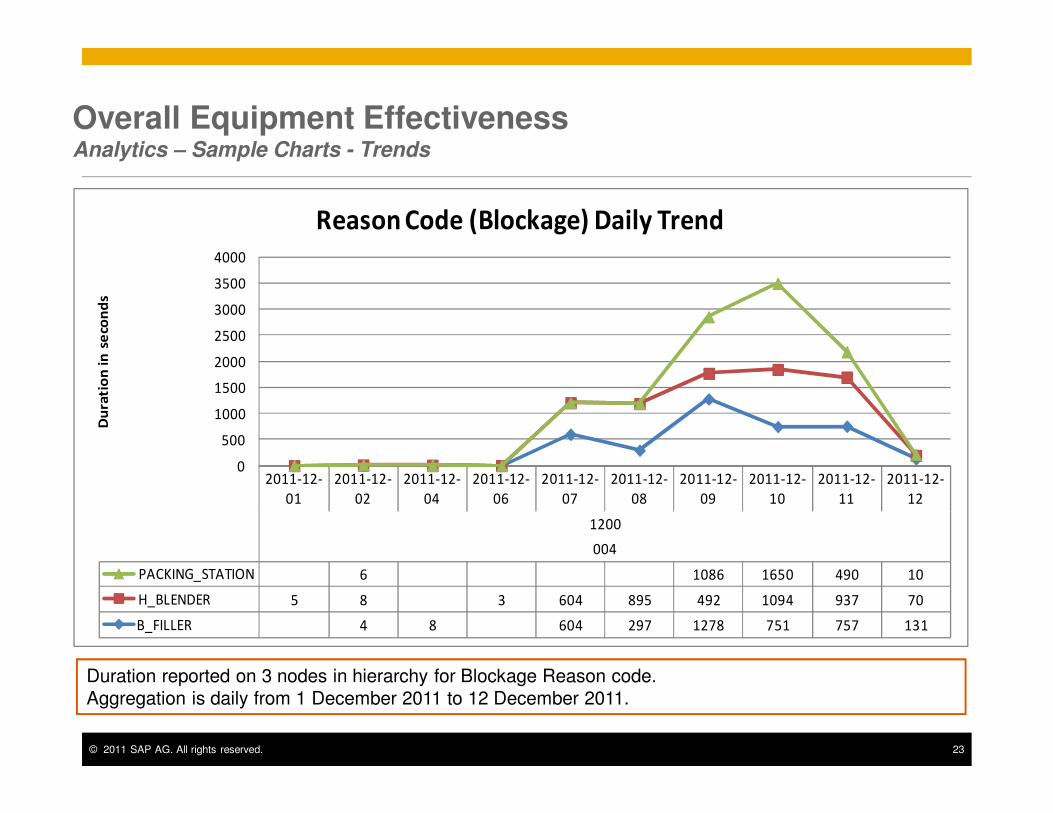
PACKING_STATION 6 1086 1650 490 10
H_BLENDER 5 8 3 604 895 492 1094 937 70
B_FILLER 4 8 604 297 1278 751 757 131
0
500
1000
1500
2000
2500
3000
3500
4000
Du
rati
on
in
se
con
ds
Reason Code (Blockage) Daily Trend
Duration reported on 3 nodes in hierarchy for Blockage Reason code.
Aggregation is daily from 1 December 2011 to 12 December 2011.
Overall Equipment EffectivenessAnalytics – Sample Charts - Trends
© 2011 SAP AG. All rights reserved. 24
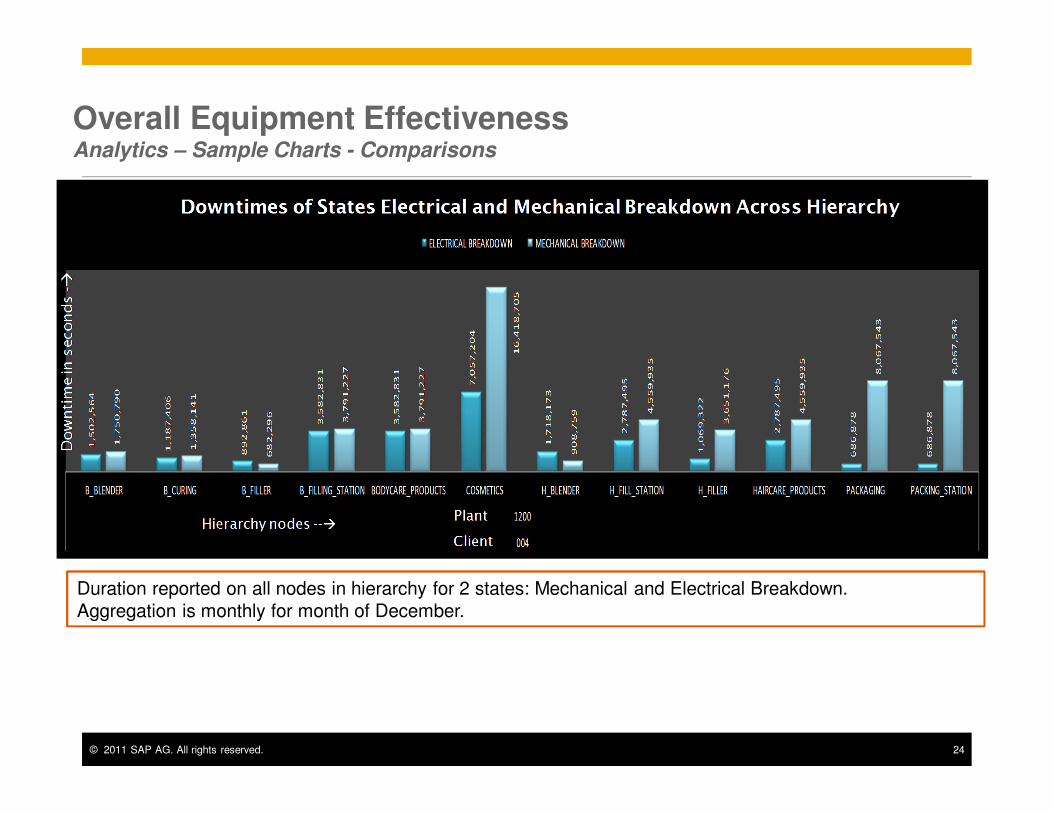
Overall Equipment EffectivenessAnalytics – Sample Charts - Comparisons
Duration reported on all nodes in hierarchy for 2 states: Mechanical and Electrical Breakdown.
Aggregation is monthly for month of December.
OEE Configuration
Contact information:
F name MI. L nameTitleAddressPhone number
© 2011 SAP AG. All rights reserved. 26
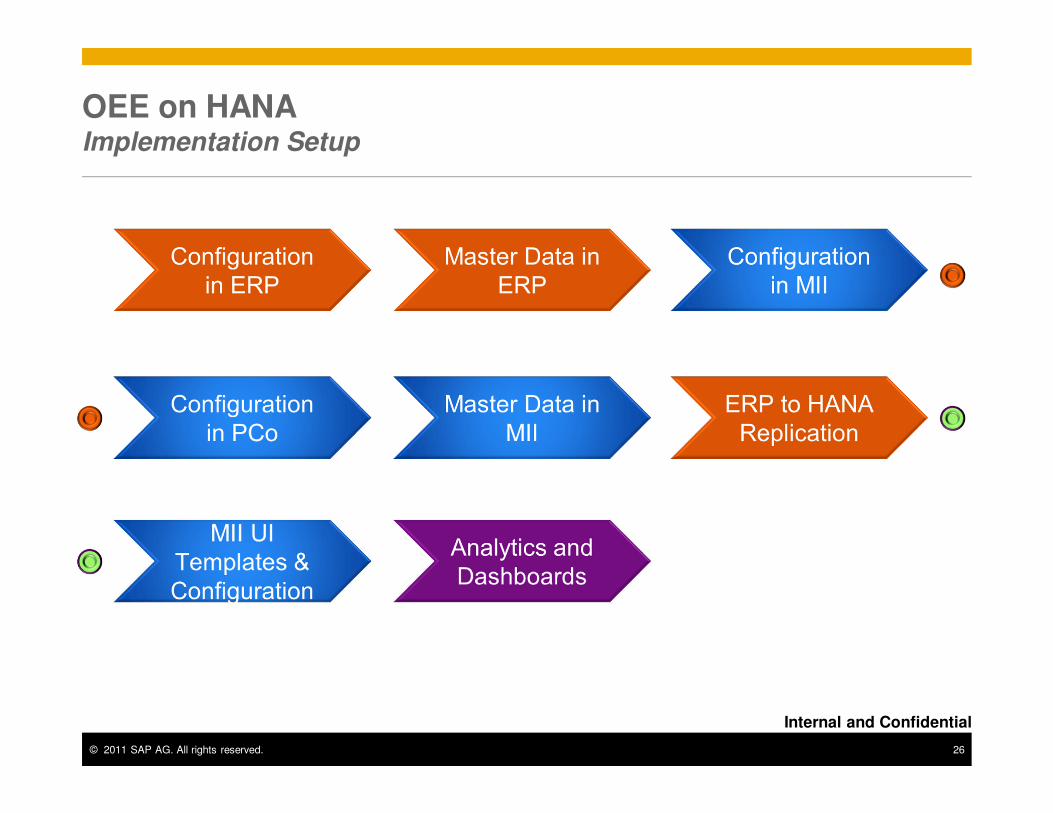
OEE on HANA Implementation Setup
Internal and Confidential
© 2011 SAP AG. All rights reserved. 27
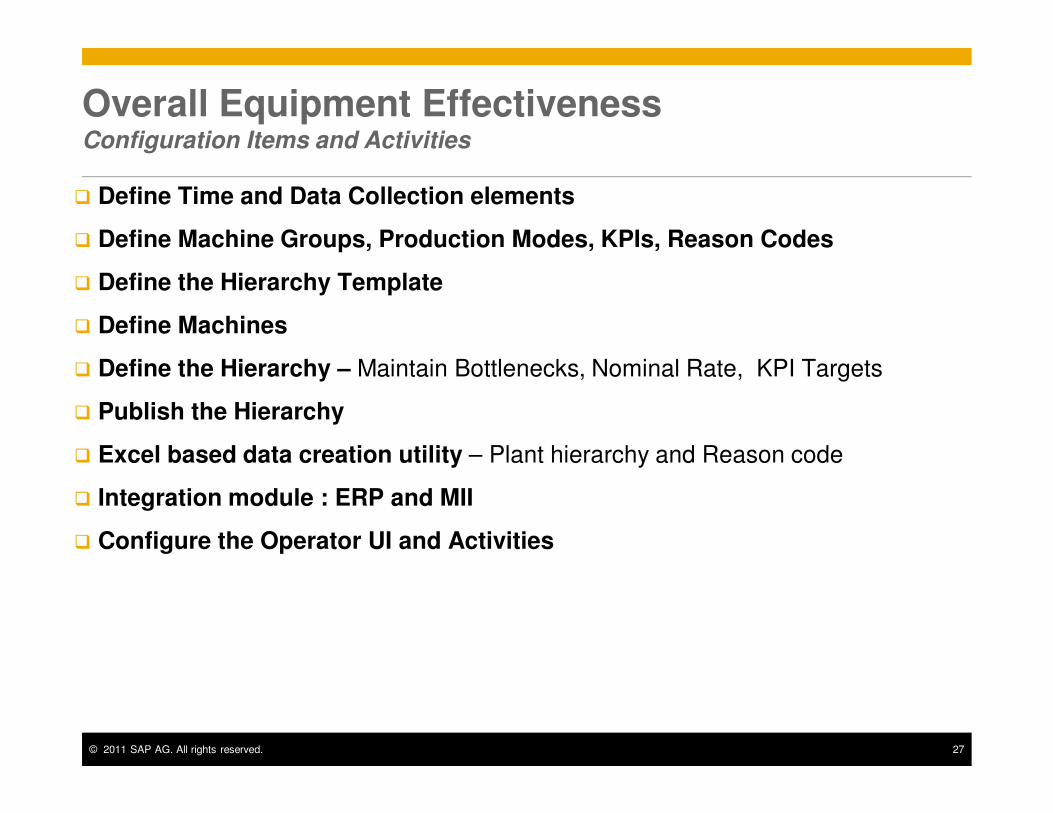
Overall Equipment EffectivenessConfiguration Items and Activities
� Define Time and Data Collection elements
� Define Machine Groups, Production Modes, KPIs, Reason Codes
� Define the Hierarchy Template
� Define Machines
� Define the Hierarchy – Maintain Bottlenecks, Nominal Rate, KPI Targets
� Publish the Hierarchy
� Excel based data creation utility – Plant hierarchy and Reason code
� Integration module : ERP and MII
� Configure the Operator UI and Activities
Architecture
Contact information:
F name MI. L nameTitleAddressPhone number
© 2011 SAP AG. All rights reserved. 29
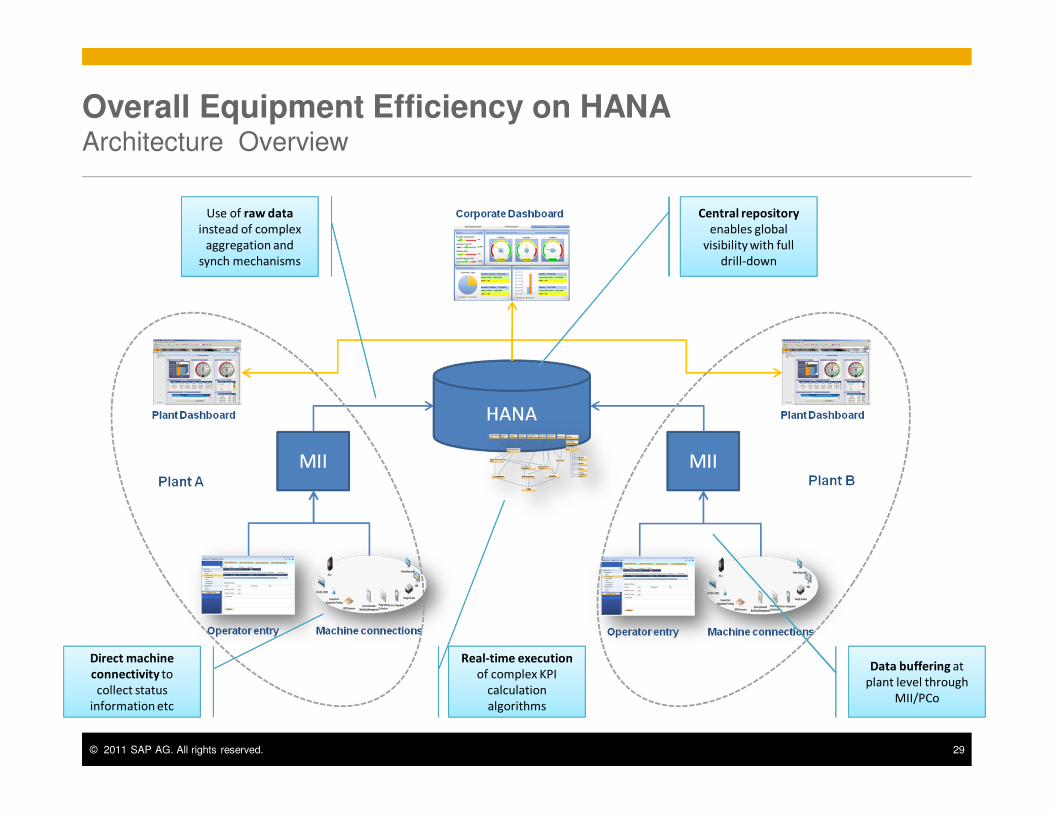
Overall Equipment Efficiency on HANA Architecture Overview
Central repository
enables global
visibility with full
drill-down
Use of raw data
instead of complex
aggregation and
synch mechanisms
Real-time execution
of complex KPI
calculation
algorithms
Direct machine
connectivity to
collect status
information etc
Data buffering at
plant level through
MII/PCo
© 2011 SAP AG. All rights reserved. 30
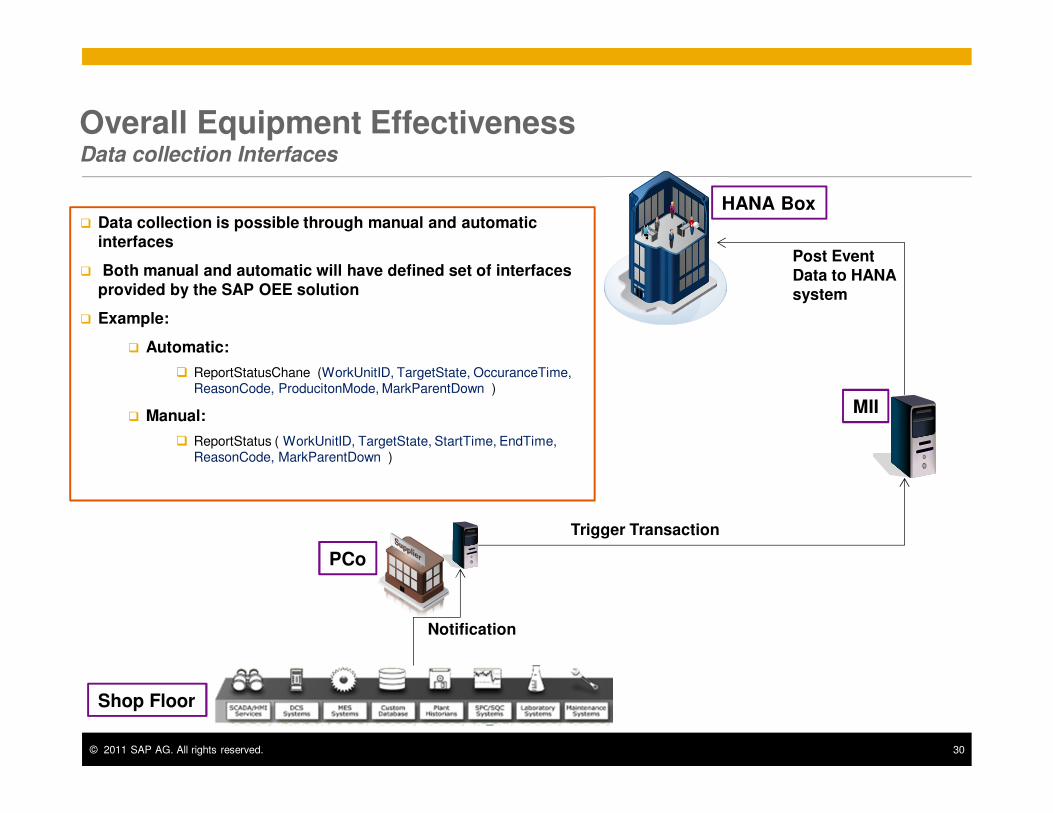
Shop Floor
HANA Box
PCo
MII
Notification
Trigger Transaction
Post Event Data to HANA system
� Data collection is possible through manual and automatic interfaces
� Both manual and automatic will have defined set of interfaces provided by the SAP OEE solution
� Example:
� Automatic:
� ReportStatusChane (WorkUnitID, TargetState, OccuranceTime, ReasonCode, ProducitonMode, MarkParentDown )
� Manual:
� ReportStatus ( WorkUnitID, TargetState, StartTime, EndTime, ReasonCode, MarkParentDown )
Overall Equipment EffectivenessData collection Interfaces
© 2011 SAP AG. All rights reserved. 31
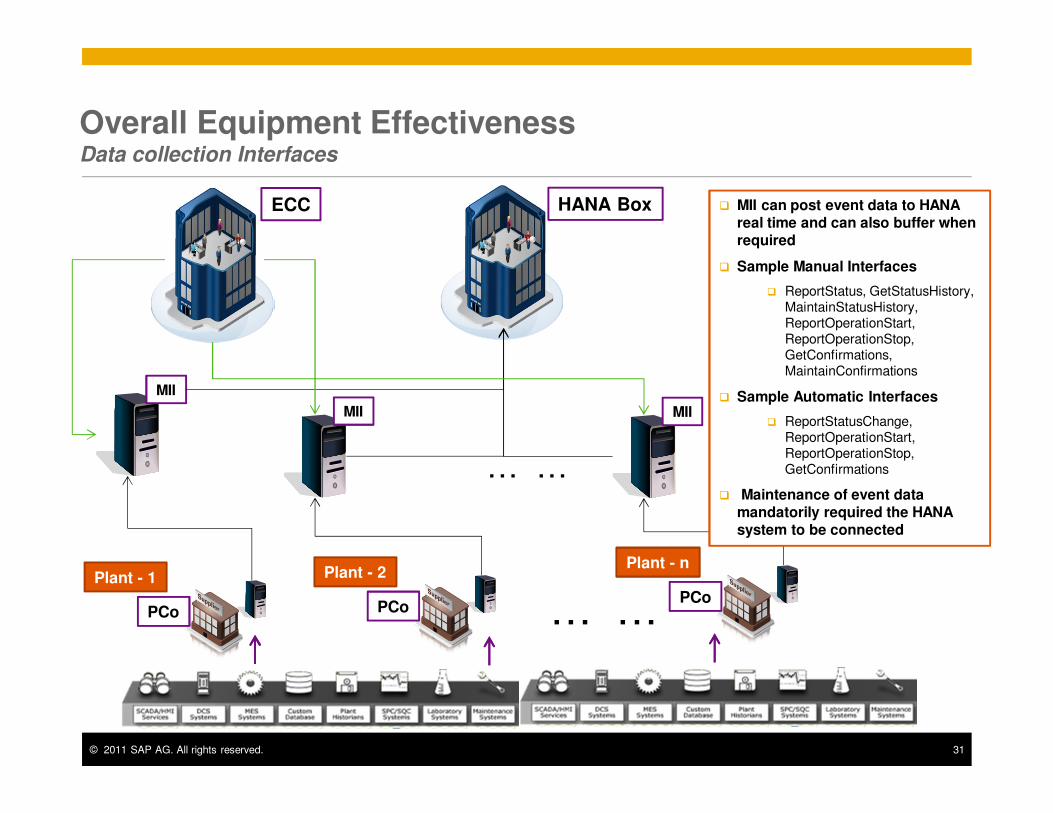
HANA Box
Plant - 1
PCo
Overall Equipment EffectivenessData collection Interfaces
Plant - 2
PCo … …
MII
MII MII
… …
ECC
Plant - n
PCo
� MII can post event data to HANA real time and can also buffer when required
� Sample Manual Interfaces
� ReportStatus, GetStatusHistory, MaintainStatusHistory, ReportOperationStart, ReportOperationStop, GetConfirmations, MaintainConfirmations
� Sample Automatic Interfaces
� ReportStatusChange, ReportOperationStart, ReportOperationStop, GetConfirmations
� Maintenance of event data mandatorily required the HANA system to be connected
© 2011 SAP AG. All rights reserved. 32
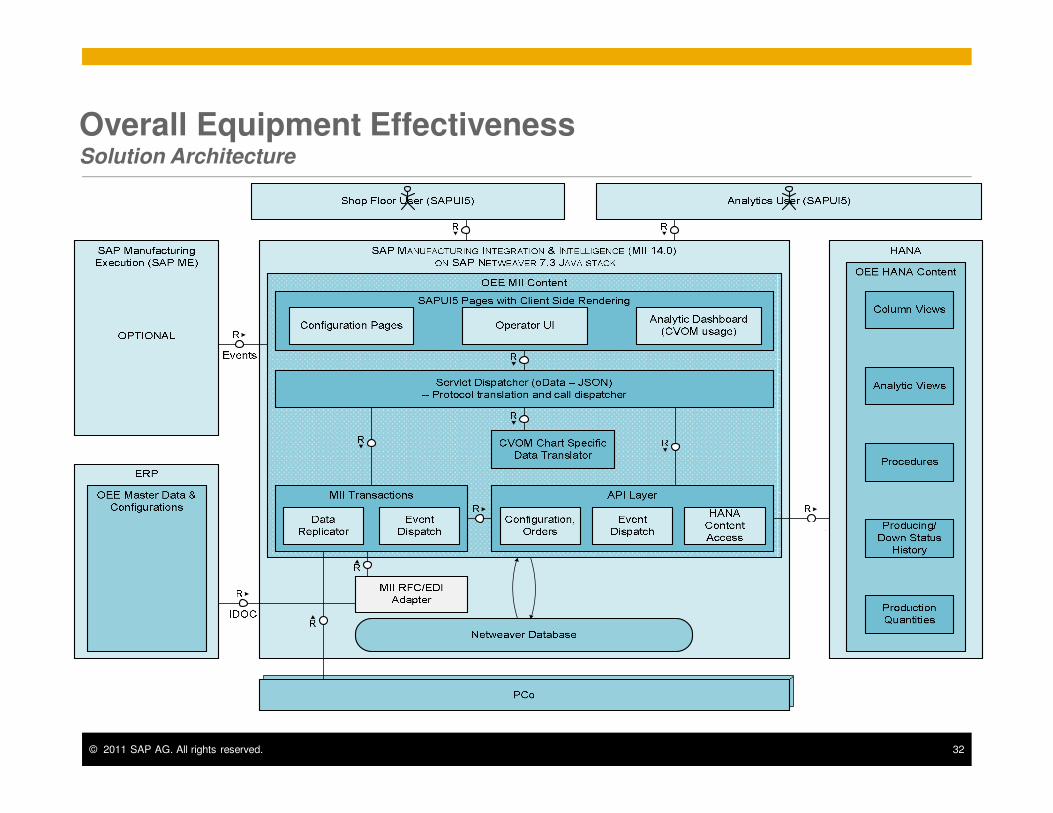
Overall Equipment EffectivenessSolution Architecture
Thank You!
Contact information:
F name MI. L nameTitleAddressPhone number
© 2011 SAP AG. All rights reserved. 34
No part of this publication may be reproduced or transmitted in any form or for any purpose without the express permission of SAP AG. The information contained herein may be changed without prior notice.
Some software products marketed by SAP AG and its distributors contain proprietary software components of other software vendors.
Microsoft, Windows, Excel, Outlook, and PowerPoint are registered trademarks of Microsoft Corporation.
IBM, DB2, DB2 Universal Database, System i, System i5, System p, System p5, System x, System z, System z10, System z9, z10, z9, iSeries, pSeries, xSeries, zSeries, eServer, z/VM, z/OS, i5/OS, S/390, OS/390, OS/400, AS/400, S/390 Parallel Enterprise Server, PowerVM, Power Architecture, POWER6+, POWER6, POWER5+, POWER5, POWER, OpenPower, PowerPC, BatchPipes, BladeCenter, System Storage, GPFS, HACMP, RETAIN, DB2 Connect, RACF, Redbooks, OS/2, Parallel Sysplex, MVS/ESA, AIX, Intelligent Miner, WebSphere, Netfinity, Tivoli and Informix are trademarks or registered trademarks of IBM Corporation.
Linux is the registered trademark of Linus Torvalds in the U.S. and other countries.
Adobe, the Adobe logo, Acrobat, PostScript, and Reader are either trademarks or registered trademarks of Adobe Systems Incorporated in the United States and/or other countries.
Oracle and Java are registered trademarks of Oracle and/or its affiliates.
UNIX, X/Open, OSF/1, and Motif are registered trademarks of the Open Group.
Citrix, ICA, Program Neighborhood, MetaFrame, WinFrame, VideoFrame, and MultiWin are trademarks or registered trademarks of Citrix Systems, Inc.
HTML, XML, XHTML and W3C are trademarks or registered trademarks of W3C®, World Wide Web Consortium, Massachusetts Institute of Technology.
© 2011 SAP AG. All rights reserved.
SAP, R/3, SAP NetWeaver, Duet, PartnerEdge, ByDesign, SAP BusinessObjects Explorer, StreamWork, and other SAP products and services mentioned herein as well as their respective logos are trademarks or registered trademarks of SAP AG in Germany and other countries.
Business Objects and the Business Objects logo, BusinessObjects, Crystal Reports, Crystal Decisions, Web Intelligence, Xcelsius, and other Business Objects products and services mentioned herein as well as their respective logos are trademarks or registered trademarks of Business Objects Software Ltd. Business Objects is an SAP company.
Sybase and Adaptive Server, iAnywhere, Sybase 365, SQL Anywhere, and other Sybase products and services mentioned herein as well as their respective logos are trademarks or registered trademarks of Sybase, Inc. Sybase is an SAP company.
All other product and service names mentioned are the trademarks of their respective companies. Data contained in this document serves informational purposes only. National product specifications may vary.
The information in this document is proprietary to SAP. No part of this document may be reproduced, copied, or transmitted in any form or for any purpose without the express prior written permission of SAP AG.
© 2011 SAP AG. All rights reserved. 35
Weitergabe und Vervielfältigung dieser Publikation oder von Teilen daraus sind, zu
welchem Zweck und in welcher Form auch immer, ohne die ausdrückliche schriftliche
Genehmigung durch SAP AG nicht gestattet. In dieser Publikation enthaltene Informationen
können ohne vorherige Ankündigung geändert werden.
Die von SAP AG oder deren Vertriebsfirmen angebotenen Softwareprodukte können
Softwarekomponenten auch anderer Softwarehersteller enthalten.
Microsoft, Windows, Excel, Outlook, und PowerPoint sind eingetragene Marken der
Microsoft Corporation.
IBM, DB2, DB2 Universal Database, System i, System i5, System p, System p5, System x,
System z, System z10, System z9, z10, z9, iSeries, pSeries, xSeries, zSeries, eServer,
z/VM, z/OS, i5/OS, S/390, OS/390, OS/400, AS/400, S/390 Parallel Enterprise Server,
PowerVM, Power Architecture, POWER6+, POWER6, POWER5+, POWER5, POWER,
OpenPower, PowerPC, BatchPipes, BladeCenter, System Storage, GPFS, HACMP,
RETAIN, DB2 Connect, RACF, Redbooks, OS/2, Parallel Sysplex, MVS/ESA, AIX,
Intelligent Miner, WebSphere, Netfinity, Tivoli und Informix sind Marken oder eingetragene
Marken der IBM Corporation.
Linux ist eine eingetragene Marke von Linus Torvalds in den USA und anderen Ländern.
Adobe, das Adobe-Logo, Acrobat, PostScript und Reader sind Marken oder eingetragene
Marken von Adobe Systems Incorporated in den USA und/oder anderen Ländern.
Oracle ist eine eingetragene Marke der Oracle Corporation.
UNIX, X/Open, OSF/1 und Motif sind eingetragene Marken der Open Group.
Citrix, ICA, Program Neighborhood, MetaFrame, WinFrame, VideoFrame und MultiWin sind
Marken oder eingetragene Marken von Citrix Systems, Inc.
HTML, XML, XHTML und W3C sind Marken oder eingetragene Marken des W3C®, World
Wide Web Consortium, Massachusetts Institute of Technology.
© 2011 SAP AG. Alle Rechte vorbehalten.
Java ist eine eingetragene Marke von Sun Microsystems, Inc.
JavaScript ist eine eingetragene Marke der Sun Microsystems, Inc., verwendet unter der
Lizenz der von Netscape entwickelten und implementierten Technologie.
SAP, R/3, SAP NetWeaver, Duet, PartnerEdge, ByDesign, SAP BusinessObjects Explorer,
StreamWork und weitere im Text erwähnte SAP-Produkte und Dienstleistungen sowie die
entsprechenden Logos sind Marken oder eingetragene Marken der SAP AG in Deutschland
und anderen Ländern.
Business Objects und das Business-Objects-Logo, BusinessObjects, Crystal Reports,
Crystal Decisions, Web Intelligence, Xcelsius und andere im Text erwähnte Business-
Objects-Produkte und Dienstleistungen sowie die entsprechenden Logos sind Marken oder
eingetragene Marken der Business Objects Software Ltd. Business Objects ist ein
Unternehmen der SAP AG.
Sybase und Adaptive Server, iAnywhere, Sybase 365, SQL Anywhere und weitere im Text
erwähnte Sybase-Produkte und -Dienstleistungen sowie die entsprechenden Logos sind
Marken oder eingetragene Marken der Sybase Inc. Sybase ist ein Unternehmen der SAP
AG.
Alle anderen Namen von Produkten und Dienstleistungen sind Marken der jeweiligen
Firmen. Die Angaben im Text sind unverbindlich und dienen lediglich zu
Informationszwecken. Produkte können länderspezifische Unterschiede aufweisen.
Die in dieser Publikation enthaltene Information ist Eigentum der SAP. Weitergabe und
Vervielfältigung dieser Publikation oder von Teilen daraus sind, zu welchem Zweck und in
welcher Form auch immer, nur mit ausdrücklicher schriftlicher Genehmigung durch SAP AG
gestattet.