

OECD Skills Outlook Global Launch - Skills and Global Value Chains
61
OECD Skills Outlook Global Launch Skills and Global Value Chains @UniofBathIPR, @OECDEduSkills #OECDSkills 4 May 2017 Andreas Schleicher Andrew Wyckoff
-
Upload
eduskills-oecd -
Category
Education
-
view
17.075 -
download
1
Transcript of OECD Skills Outlook Global Launch - Skills and Global Value Chains

OECD Skills Outlook
Global Launch
Skills and Global Value Chains
@UniofBathIPR, @OECDEduSkills
#OECDSkills
4 May 2017
Andreas Schleicher
Andrew Wyckoff

People are at the centre of Global Value Chains
2
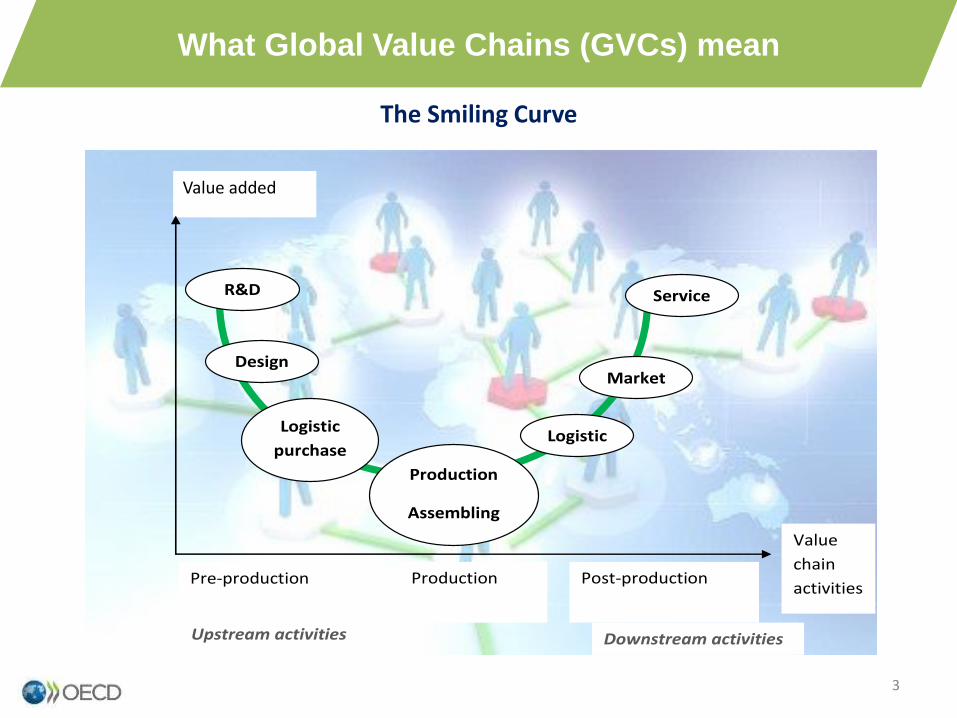
What Global Value Chains (GVCs) mean
Value added
The Smiling Curve
3
R&D
Design
Logistic
purchase
Production
Assembling
Logistic
s
Market
ing
Service
s
Pre-production
Upstream activities
Post-production
Downstream activities
Production
Value
chain
activities
4
A comprehensive approach
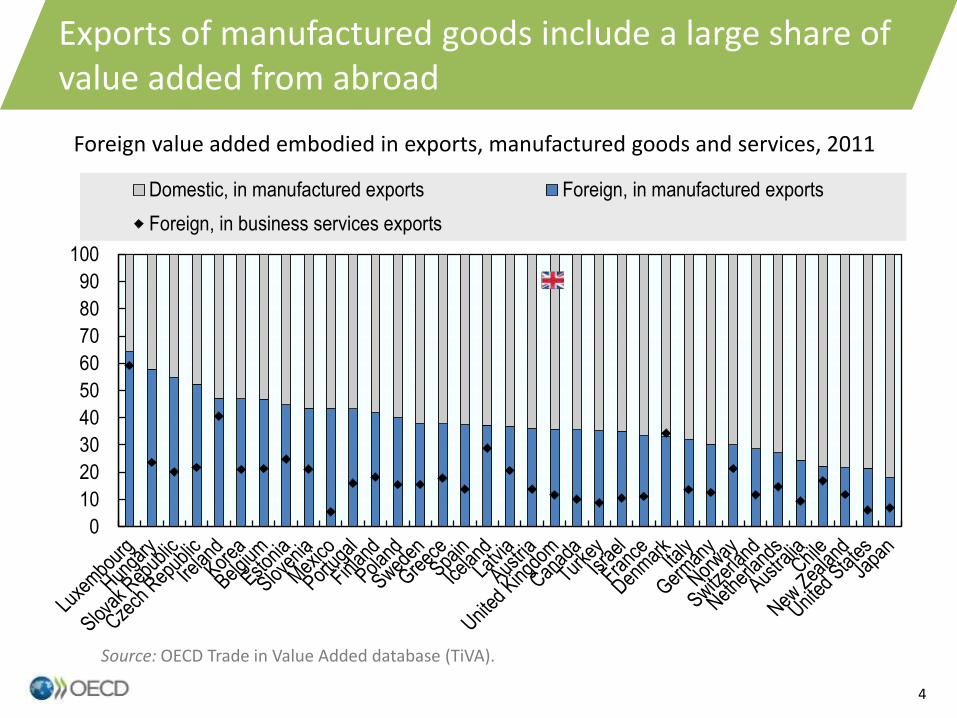
Exports of manufactured goods include a large share of value added from abroad
Foreign value added embodied in exports, manufactured goods and services, 2011
0
10
20
30
40
50
60
70
80
90
100
Domestic, in manufactured exports Foreign, in manufactured exports
Foreign, in business services exports
Source: OECD Trade in Value Added database (TiVA).
0102030405060708090
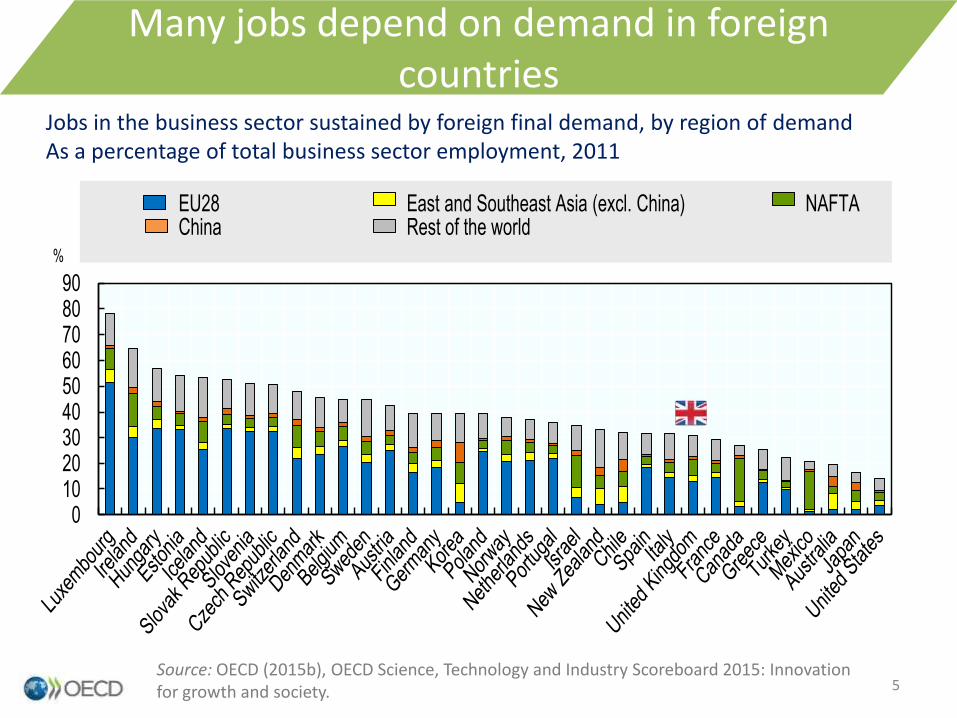
%
EU28 East and Southeast Asia (excl. China) NAFTAChina Rest of the world
Many jobs depend on demand in foreign countries
Source: OECD (2015b), OECD Science, Technology and Industry Scoreboard 2015: Innovation for growth and society.
Jobs in the business sector sustained by foreign final demand, by region of demandAs a percentage of total business sector employment, 2011
5
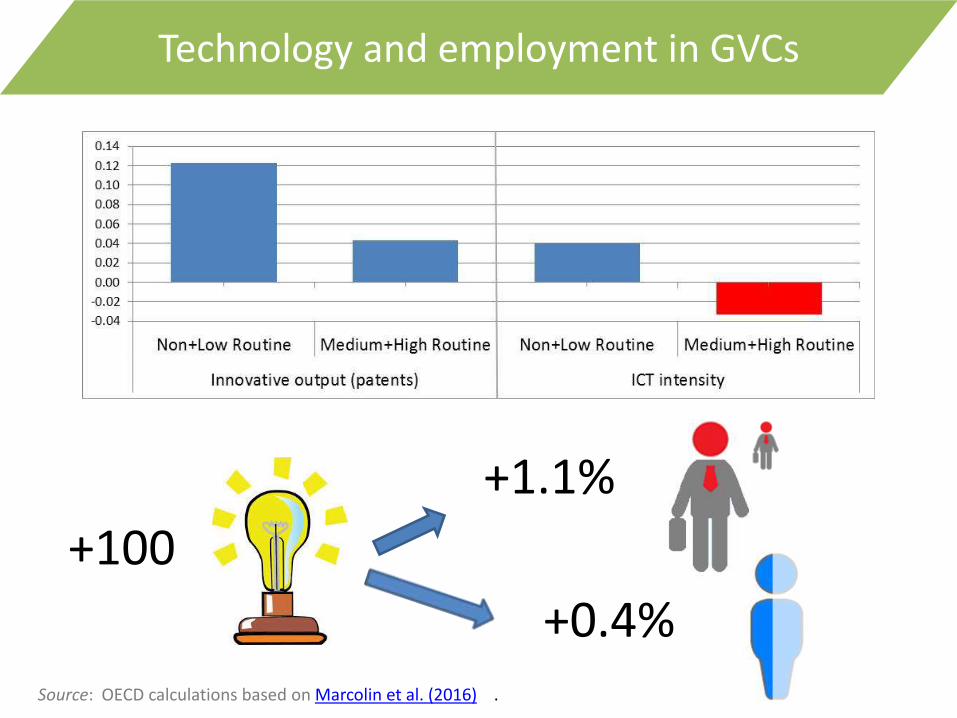
+100
+1.1%
+0.4%Source: OECD calculations based on Marcolin et al. (2016) .
Technology and employment in GVCs
7
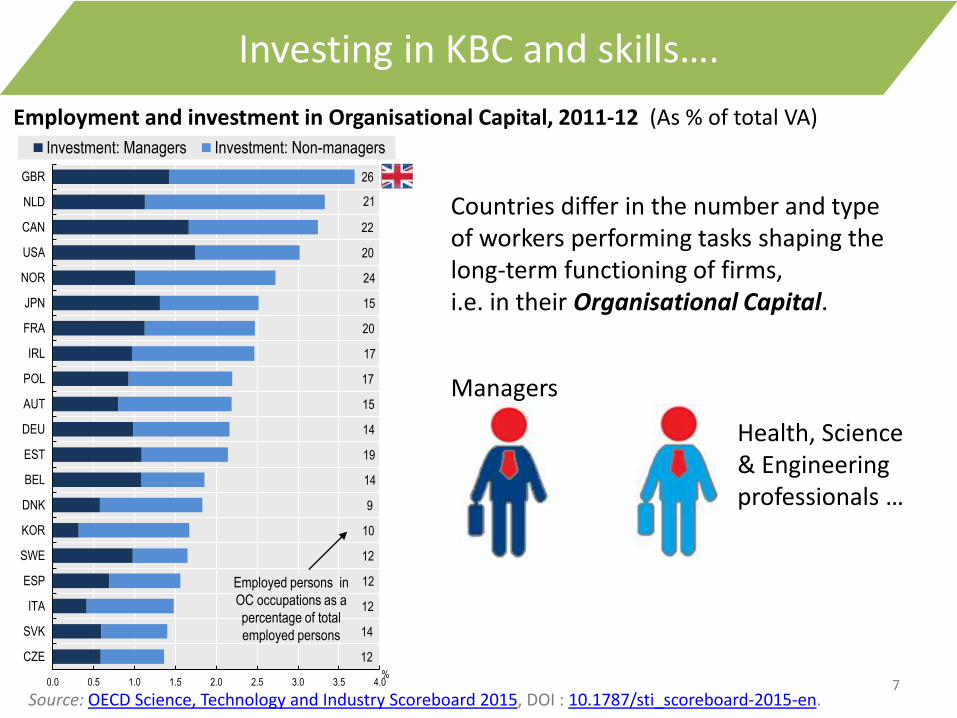
Investing in KBC and skills….
Countries differ in the number and type of workers performing tasks shaping the long-term functioning of firms, i.e. in their Organisational Capital.
Health, Science & Engineering professionals …
12
14
12
12
12
10
9
14
19
14
15
17
17
20
15
24
20
22
21
26
0.0 0.5 1.0 1.5 2.0 2.5 3.0 3.5 4.0
CZE
SVK
ITA
ESP
SWE
KOR
DNK
BEL
EST
DEU
AUT
POL
IRL
FRA
JPN
NOR
USA
CAN
NLD
GBR
%
Investment: Managers Investment: Non-managers
Employed persons in
OC occupations as a
percentage of total
employed persons
Employment and investment in Organisational Capital, 2011-12 (As % of total VA)
Source: OECD Science, Technology and Industry Scoreboard 2015, DOI : 10.1787/sti_scoreboard-2015-en.
Managers
8
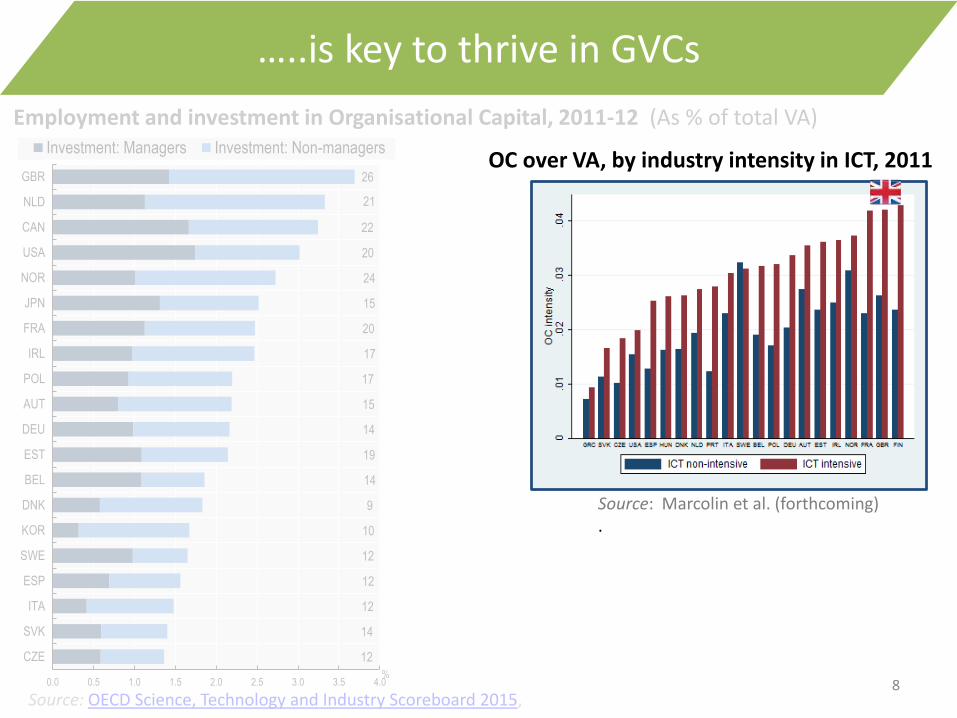
…..is key to thrive in GVCs
Source: OECD Science, Technology and Industry Scoreboard 2015,
12
14
12
12
12
10
9
14
19
14
15
17
17
20
15
24
20
22
21
26
0.0 0.5 1.0 1.5 2.0 2.5 3.0 3.5 4.0
CZE
SVK
ITA
ESP
SWE
KOR
DNK
BEL
EST
DEU
AUT
POL
IRL
FRA
JPN
NOR
USA
CAN
NLD
GBR
%
Investment: Managers Investment: Non-managers
Employment and investment in Organisational Capital, 2011-12 (As % of total VA)
Source: Marcolin et al. (forthcoming) .
OC over VA, by industry intensity in ICT, 2011
9
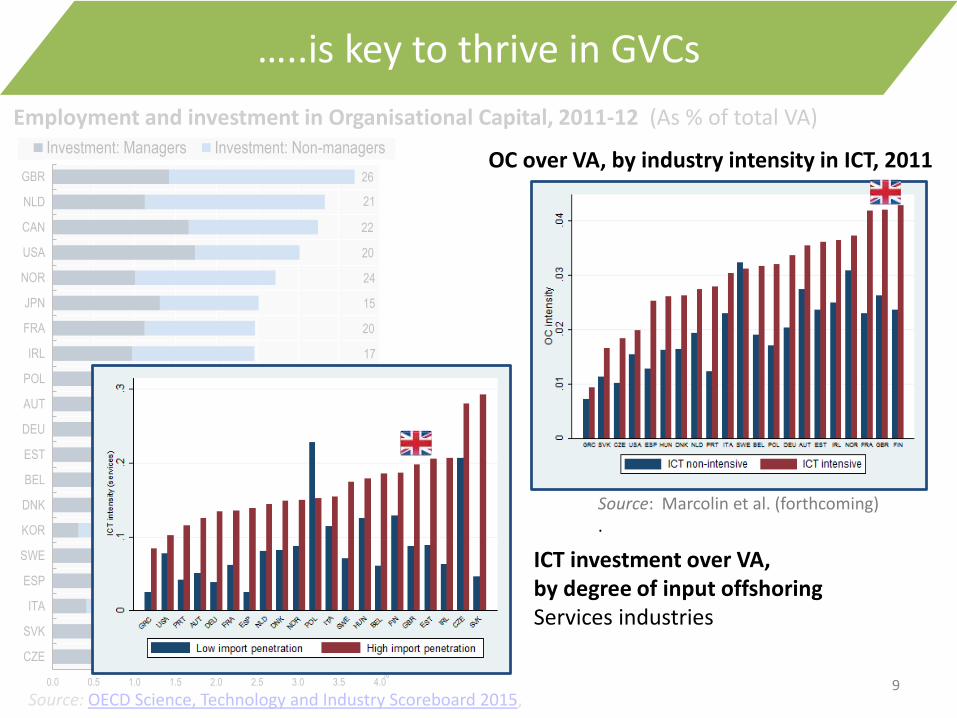
…..is key to thrive in GVCs
Source: OECD Science, Technology and Industry Scoreboard 2015,
ICT investment over VA, by degree of input offshoringServices industries
12
14
12
12
12
10
9
14
19
14
15
17
17
20
15
24
20
22
21
26
0.0 0.5 1.0 1.5 2.0 2.5 3.0 3.5 4.0
CZE
SVK
ITA
ESP
SWE
KOR
DNK
BEL
EST
DEU
AUT
POL
IRL
FRA
JPN
NOR
USA
CAN
NLD
GBR
%
Investment: Managers Investment: Non-managers
Employment and investment in Organisational Capital, 2011-12 (As % of total VA)
Source: Marcolin et al. (forthcoming) .
OC over VA, by industry intensity in ICT, 2011
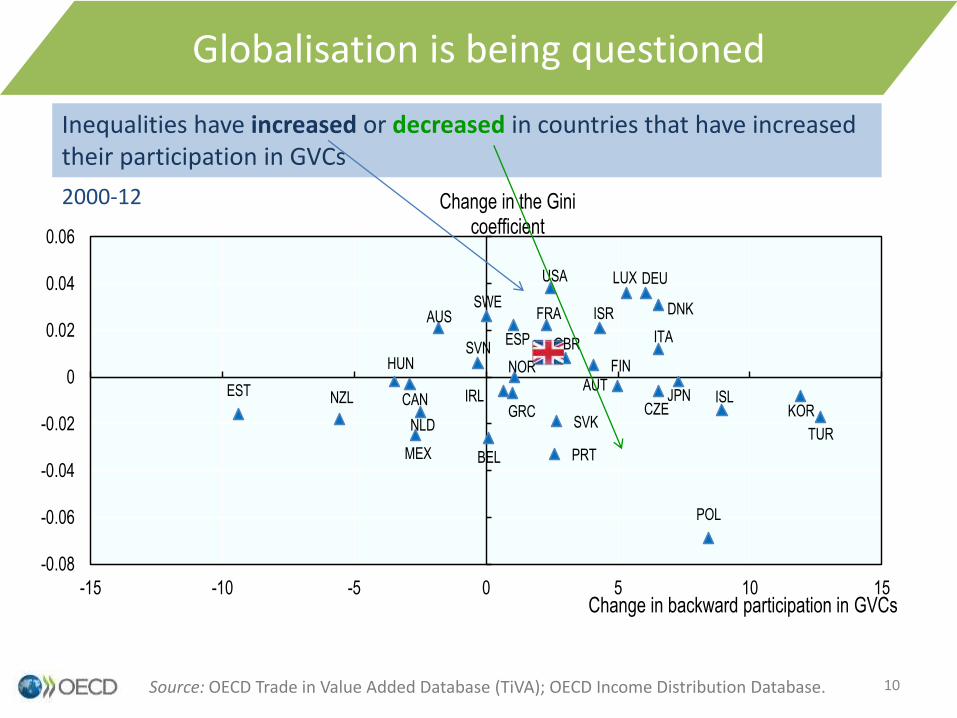
Globalisation is being questioned
AUS
AUT
BEL
CANCZE
DNK
EST
FIN
FRA
DEU
GRC
HUN
ISL
ISR
ITA
JPNKOR
LUX
MEX
NLD
NZL
NOR
POL
PRT
SVK
SVNESP
SWE
TUR
GBR
USA
-0.08
-0.06
-0.04
-0.02
0
0.02
0.04
0.06
-15 -10 -5 0 5 10 15
Change in the Gini coefficient
Change in backward participation in GVCs
IRL
Inequalities have increased or decreased in countries that have increased their participation in GVCs
Source: OECD Trade in Value Added Database (TiVA); OECD Income Distribution Database.
2000-12
10

Skills Matter for globalisation
11

• Realise productivity gains – offered by new technologies and participation in GVCs
• Protect workers against negative impact– Job losses, lower job quality
• Specialise in advanced industries and services– Innovation, higher productivity, job creation
12Why skills?
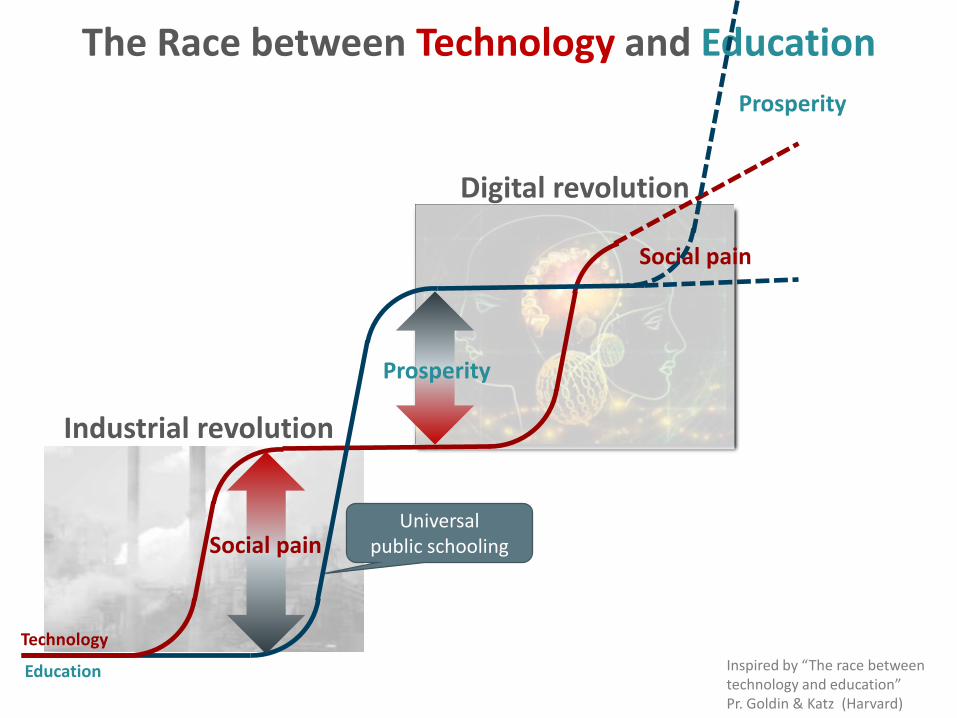
The Race between Technology and Education
Inspired by “The race between technology and education” Pr. Goldin & Katz (Harvard)
Industrial revolution
Digital revolution
Social pain
Universal public schooling
Technology
Education
Prosperity
Social pain
Prosperity
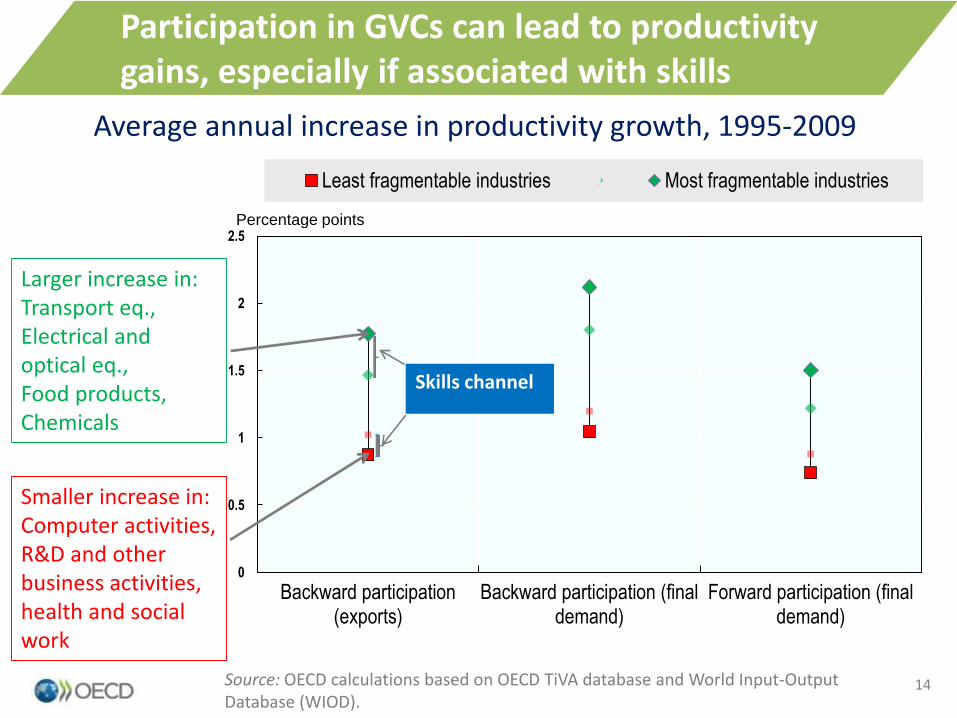
0
0.5
1
1.5
2
2.5
Backward participation(exports)
Backward participation (finaldemand)
Forward participation (finaldemand)
Least fragmentable industries Most fragmentable industries
Percentage points
Average annual increase in productivity growth, 1995-2009
Larger increase in: Transport eq., Electrical and optical eq., Food products, Chemicals
Smaller increase in:Computer activities, R&D and other business activities, health and social work
Source: OECD calculations based on OECD TiVA database and World Input-Output Database (WIOD).
Participation in GVCs can lead to productivity gains, especially if associated with skills
14
Skills channel
15
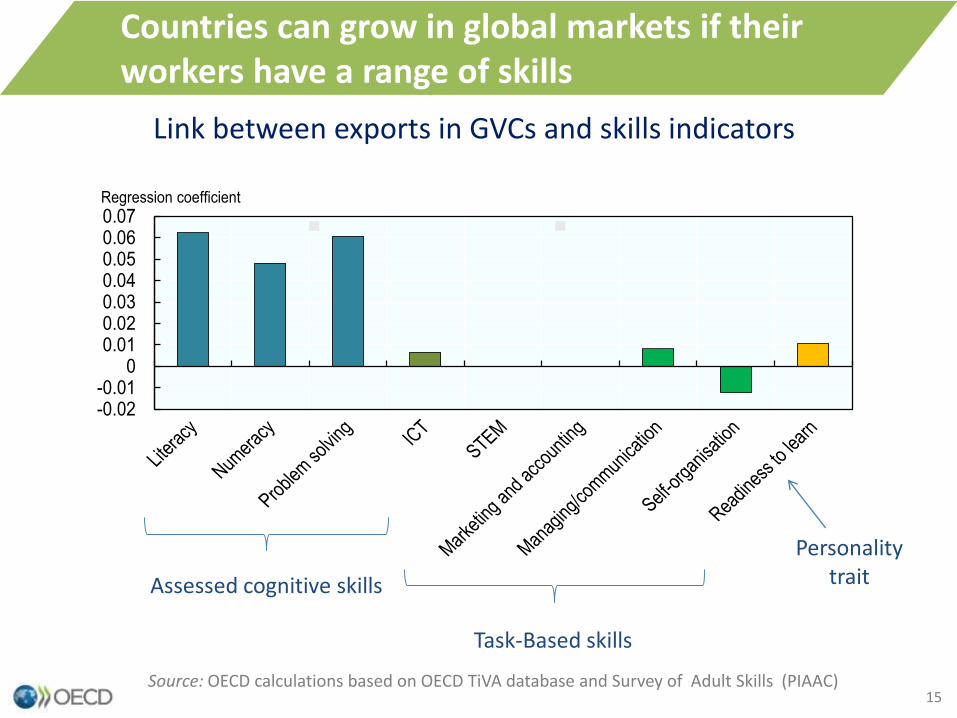
Link between exports in GVCs and skills indicators
Source: OECD calculations based on OECD TiVA database and Survey of Adult Skills (PIAAC)
Countries can grow in global markets if their workers have a range of skills
-0.02-0.01
00.010.020.030.040.050.060.07Regression coefficient
Assessed cognitive skills
Task-Based skills
Personality trait
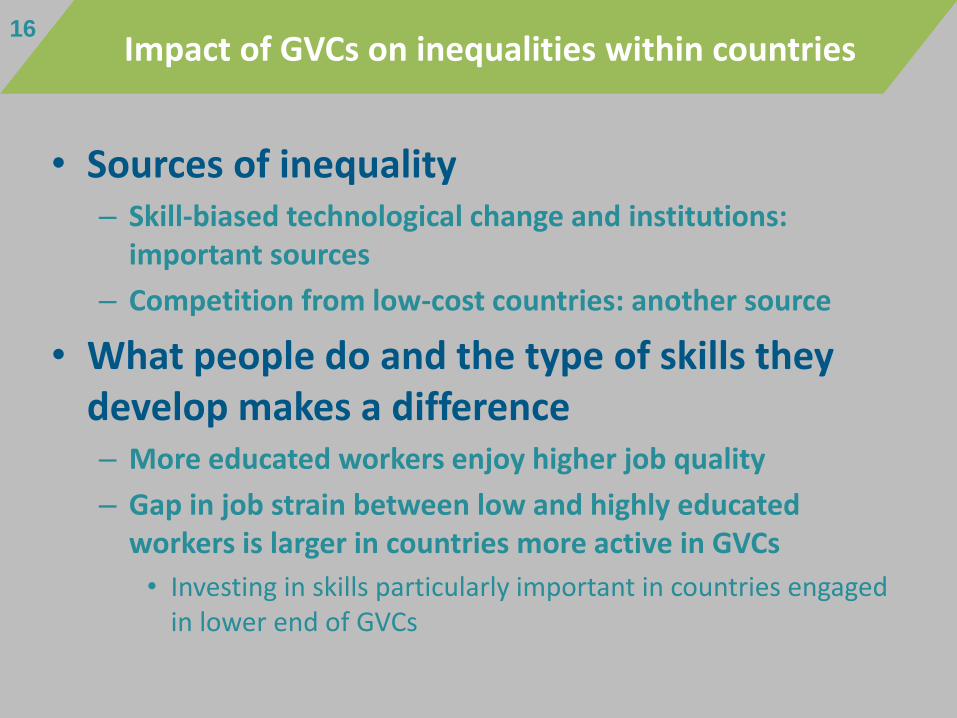
• Sources of inequality– Skill-biased technological change and institutions:
important sources
– Competition from low-cost countries: another source
• What people do and the type of skills they develop makes a difference– More educated workers enjoy higher job quality
– Gap in job strain between low and highly educated workers is larger in countries more active in GVCs
• Investing in skills particularly important in countries engaged in lower end of GVCs
16Impact of GVCs on inequalities within countries
17
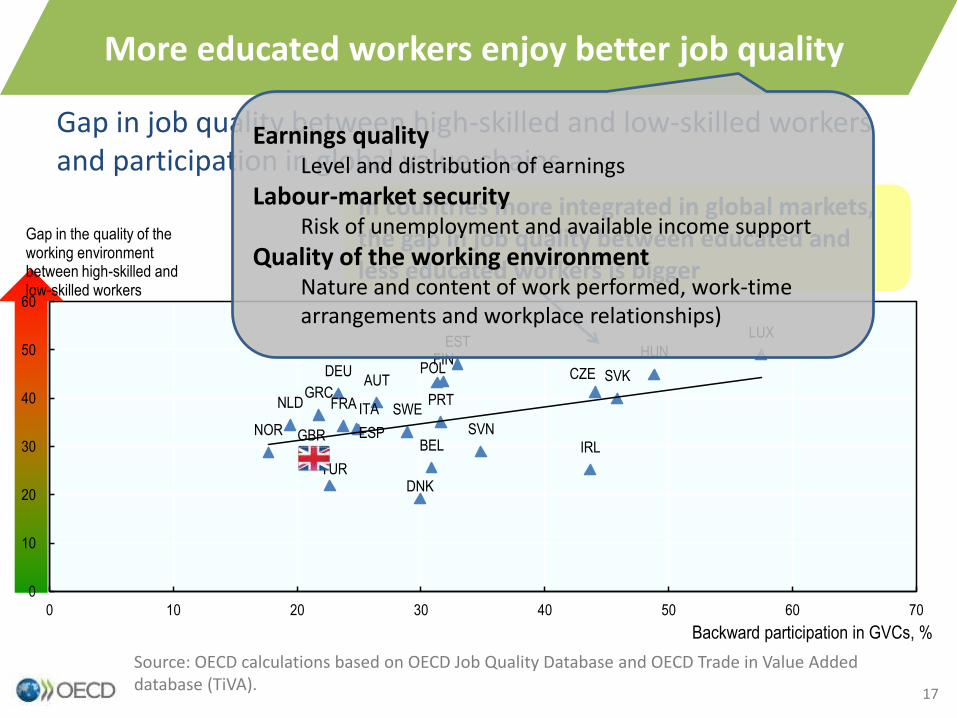
Gap in job quality between high-skilled and low-skilled workersand participation in global value chains
More educated workers enjoy better job quality
AUT
BEL
CZE
DNK
ESTFIN
FRA
DEU
GRC
HUN
IRL
ITA
LUX
NLD
NOR
POL
PRT
SVK
SVNESP
SWE
TUR
GBR
0
10
20
30
40
50
60
0 10 20 30 40 50 60 70
Gap in the quality of the working environment between high-skilled and low-skilled workers
Backward participation in GVCs, %
In countries more integrated in global markets, the gap in job quality between educated and less educated workers is bigger
Source: OECD calculations based on OECD Job Quality Database and OECD Trade in Value Added database (TiVA).
Earnings qualityLevel and distribution of earnings
Labour-market securityRisk of unemployment and available income support
Quality of the working environmentNature and content of work performed, work-time arrangements and workplace relationships)
18
Production
Marketing
Services
Design
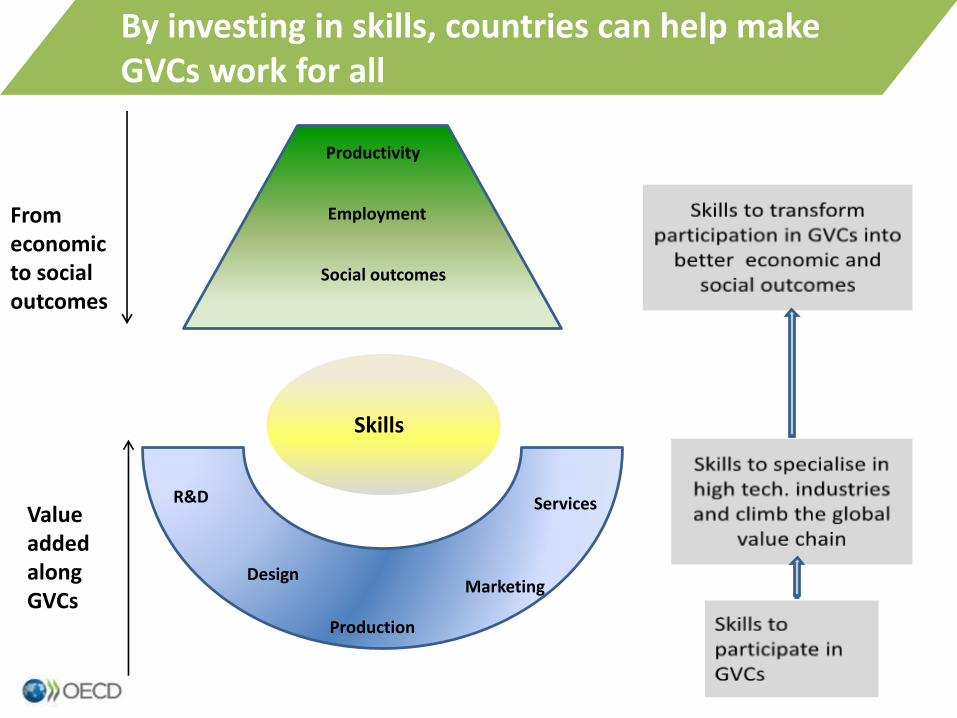
R&DValue added along GVCs
From economic to social outcomes
By investing in skills, countries can help make GVCs work for all
Skills
Employment
Social outcomes
Productivity
19
Lim
ite
d s
har
e o
f lo
w-s
kille
d w
ork
ers
De
velo
pin
g sk
ills
Ad
van
ced
ski
lls
Incr
eas
ing
par
tici
pat
ion
in
GV
Cs
Spe
cial
ised
in
adva
nce
d in
du
stri
es
Incr
eas
ing
spe
cial
isat
ion
in
adva
nce
d in
du
stri
es
Incr
eas
ing
pro
du
ctiv
ity
Incr
eas
ing
em
plo
ymen
t
Imp
rovi
ng
soci
al
ou
tco
me
s
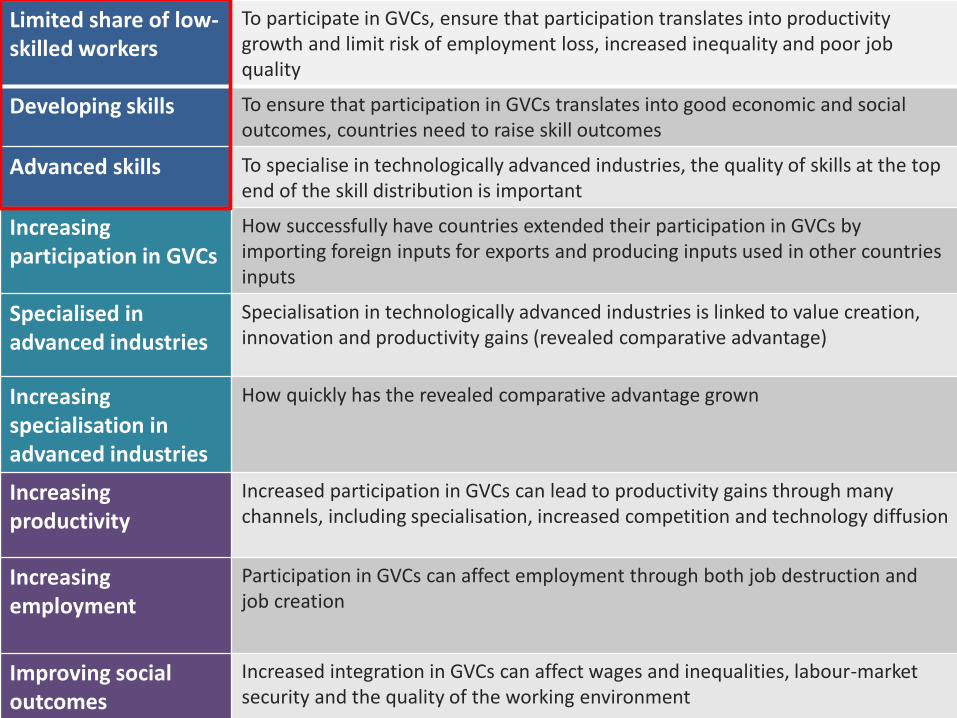
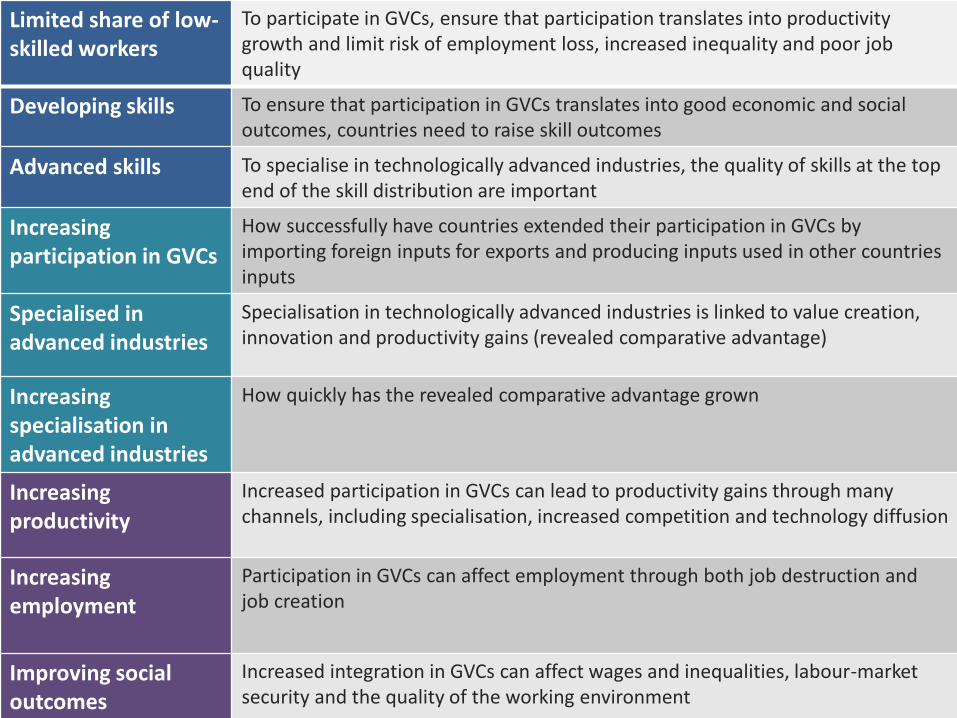
Limited share of low-skilled workers
To participate in GVCs, ensure that participation translates into productivity growth and limit risk of employment loss, increased inequality and poor job quality
Developing skills To ensure that participation in GVCs translates into good economic and social outcomes, countries need to raise skill outcomes
Advanced skills To specialise in technologically advanced industries, the quality of skills at the top end of the skill distribution is important
Increasing participation in GVCs
How successfully have countries extended their participation in GVCs by importing foreign inputs for exports and producing inputs used in other countries inputs
Specialised in advanced industries
Specialisation in technologically advanced industries is linked to value creation, innovation and productivity gains (revealed comparative advantage)
Increasing specialisation in advanced industries
How quickly has the revealed comparative advantage grown
Increasing productivity
Increased participation in GVCs can lead to productivity gains through many channels, including specialisation, increased competition and technology diffusion
Increasing employment
Participation in GVCs can affect employment through both job destruction and job creation
Improving social outcomes
Increased integration in GVCs can affect wages and inequalities, labour-market security and the quality of the working environment
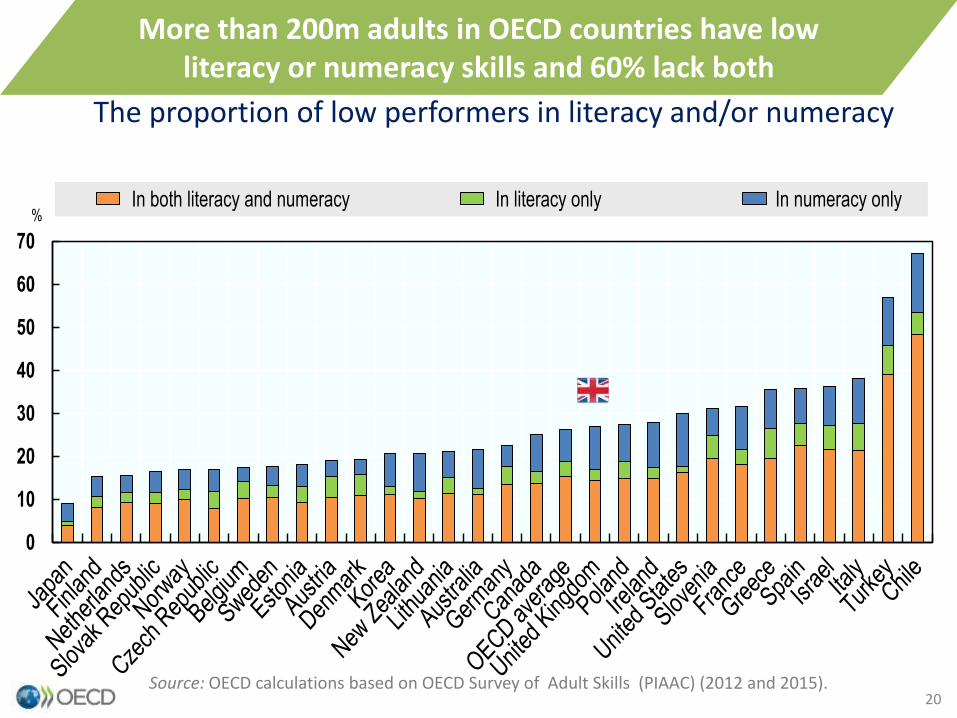
0
10
20
30
40
50
60
70
%
Workers
In both literacy and numeracy In literacy only In numeracy only
The proportion of low performers in literacy and/or numeracy
Source: OECD calculations based on OECD Survey of Adult Skills (PIAAC) (2012 and 2015).20
More than 200m adults in OECD countries have low literacy or numeracy skills and 60% lack both
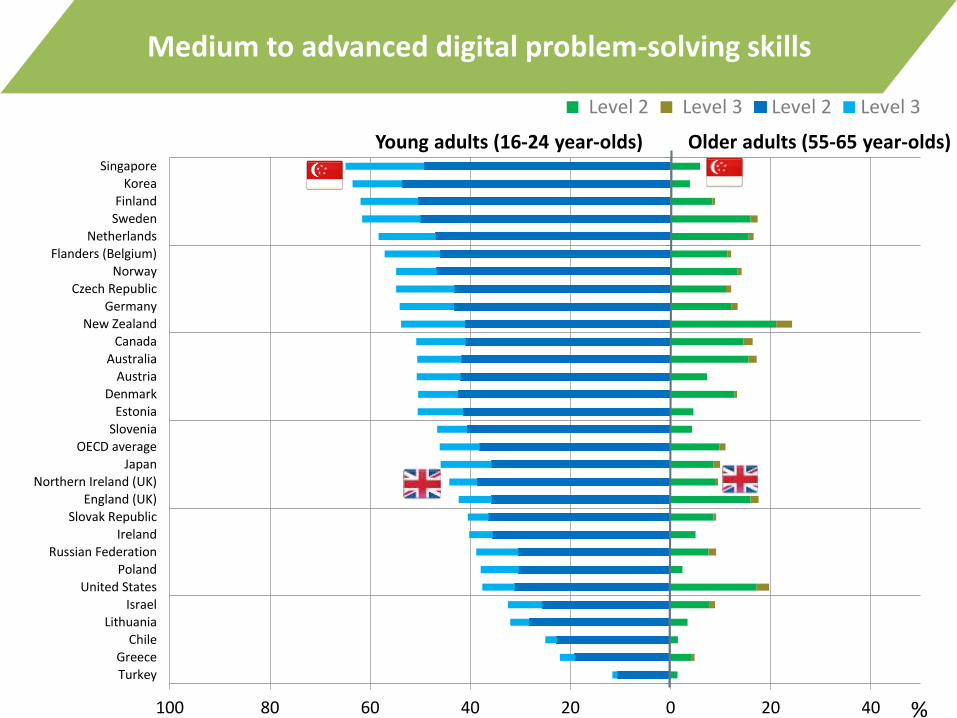
100 80 60 40 20 0 20 40
TurkeyGreece
ChileLithuania
Israel
United StatesPoland
Russian FederationIreland
Slovak RepublicEngland (UK)
Northern Ireland (UK)Japan
OECD averageSlovenia
EstoniaDenmark
AustriaAustralia
CanadaNew Zealand
Germany
Czech RepublicNorway
Flanders (Belgium)Netherlands
SwedenFinland
KoreaSingapore
Level 2 Level 3 Level 2 Level 3
Young adults (16-24 year-olds) Older adults (55-65 year-olds)
%
Medium to advanced digital problem-solving skills
-0.6
-0.5
-0.4
-0.3
-0.2
-0.1
0
0.1
0.2
0.3
0.4
0.5
Literacy skills Numeracy skills Problem solving skillsin technology-rich
environments
Physical skills
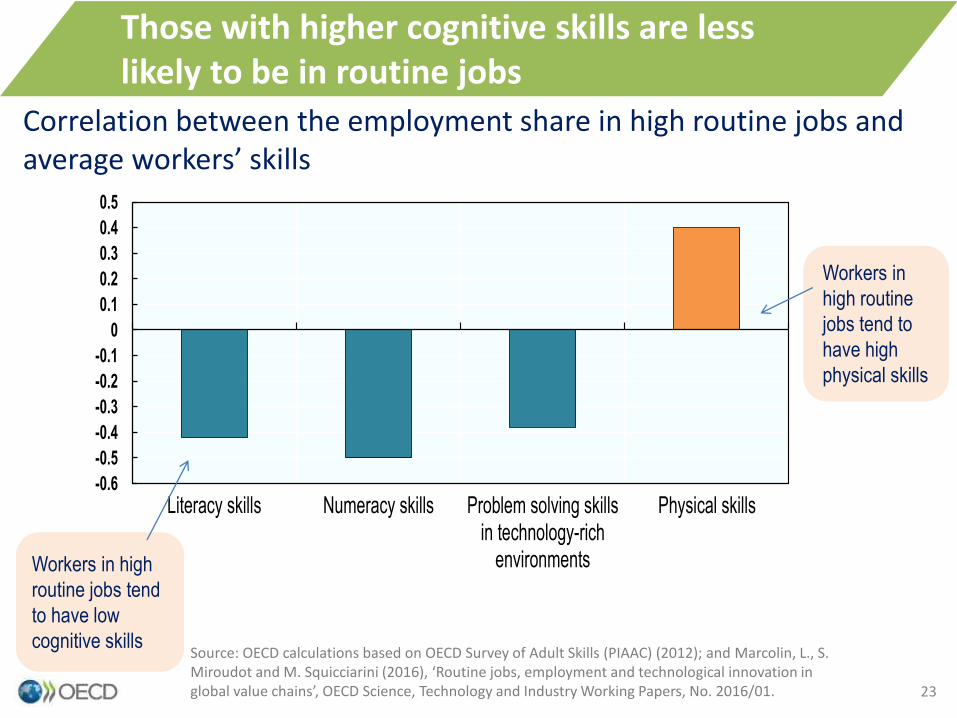
Correlation between the employment share in high routine jobs and average workers’ skills
Workers in high
routine jobs tend
to have low
cognitive skillsSource: OECD calculations based on OECD Survey of Adult Skills (PIAAC) (2012); and Marcolin, L., S. Miroudot and M. Squicciarini (2016), ‘Routine jobs, employment and technological innovation in global value chains’, OECD Science, Technology and Industry Working Papers, No. 2016/01.
Workers in
high routine
jobs tend to
have high
physical skills
23
Those with higher cognitive skills are less likely to be in routine jobs

24
Lim
ite
d s
har
e o
f lo
w-s
kille
d w
ork
ers
De
velo
pin
g sk
ills
Ad
van
ced
ski
lls
Incr
eas
ing
par
tici
pat
ion
in
GV
Cs
Spe
cial
ised
in
adva
nce
d in
du
stri
es
Incr
eas
ing
spe
cial
isat
ion
in
adva
nce
d in
du
stri
es
Incr
eas
ing
pro
du
ctiv
ity
Incr
eas
ing
em
plo
ymen
t
Imp
rovi
ng
soci
al
ou
tco
me
s
Limited share of low-skilled workers
To participate in GVCs, ensure that participation translates into productivity growth and limit risk of employment loss, increased inequality and poor job quality
Developing skills To ensure that participation in GVCs translates into good economic and social outcomes, countries need to raise skill outcomes
Advanced skills To specialise in technologically advanced industries, the quality of skills at the top end of the skill distribution is important
Increasing participation in GVCs
How successfully have countries extended their participation in GVCs by importing foreign inputs for exports and producing inputs used in other countries inputs
Specialised in advanced industries
Specialisation in technologically advanced industries is linked to value creation, innovation and productivity gains (revealed comparative advantage)
Increasing specialisation in advanced industries
How quickly has the revealed comparative advantage grown
Increasing productivity
Increased participation in GVCs can lead to productivity gains through many channels, including specialisation, increased competition and technology diffusion
Increasing employment
Participation in GVCs can affect employment through both job destruction and job creation
Improving social outcomes
Increased integration in GVCs can affect wages and inequalities, labour-market security and the quality of the working environment
Countries can shape their specialisation within global value chains through the skills of their populations
25
26
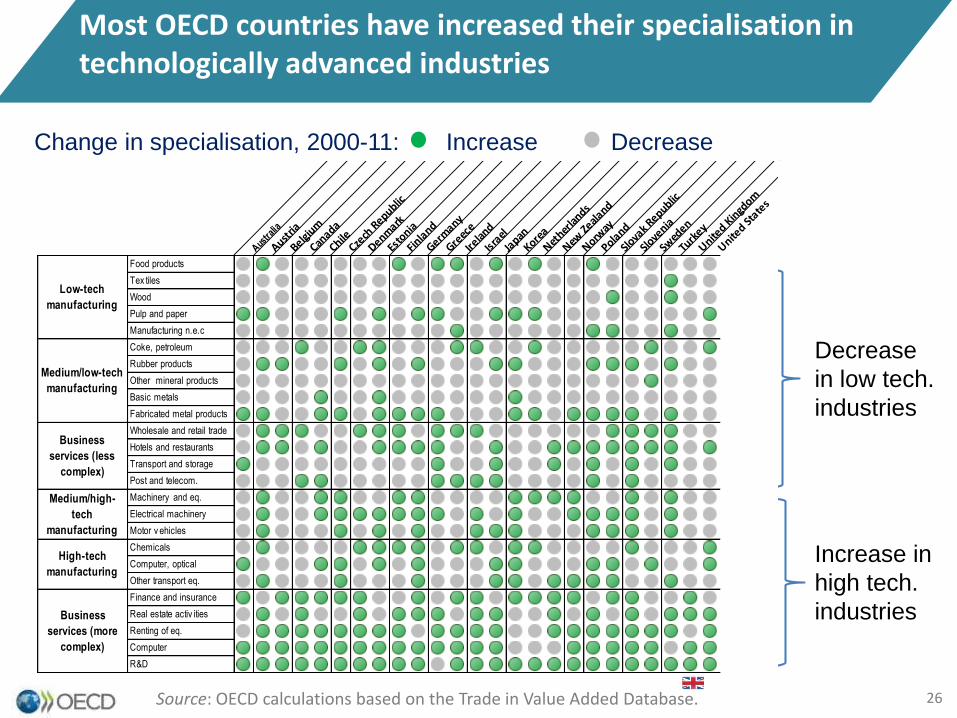
Change in specialisation, 2000-11: Increase Decrease
Source: OECD calculations based on the Trade in Value Added Database.
Most OECD countries have increased their specialisation in technologically advanced industries
Decrease
in low tech.
industries
Increase in
high tech.
industries
Austra
lia
Austria
Belgium
Canada
ChileCze
ch R
epublic
Denmark
Esto
nia
Finla
nd
Germany
Greec
e
Irelan
d
Israel
Japan
Korea
Nether
lands
New Ze
aland
Norway
Poland
Slova
k Republic
Slove
nia
Swed
en
Turk
ey
United K
ingd
om
United St
ates
Low-tech
manufacturing
Food products
Tex tiles
Wood
Pulp and paper
Manufacturing n.e.c
Coke, petroleum
Rubber products
Other mineral products
Basic metals
Fabricated metal products
Wholesale and retail trade
Hotels and restaurants
Transport and storage
Post and telecom.
Machinery and eq.
Electrical machinery
Motor v ehicles
Chemicals
Computer, optical
Other transport eq.
Finance and insurance
Real estate activ ities
Renting of eq.
Computer
R&D
Low-tech
manufacturing
Medium/low-tech
manufacturing
Business
services (less
complex)
Medium/high-
tech
manufacturing
High-tech
manufacturing
Business
services (more
complex)
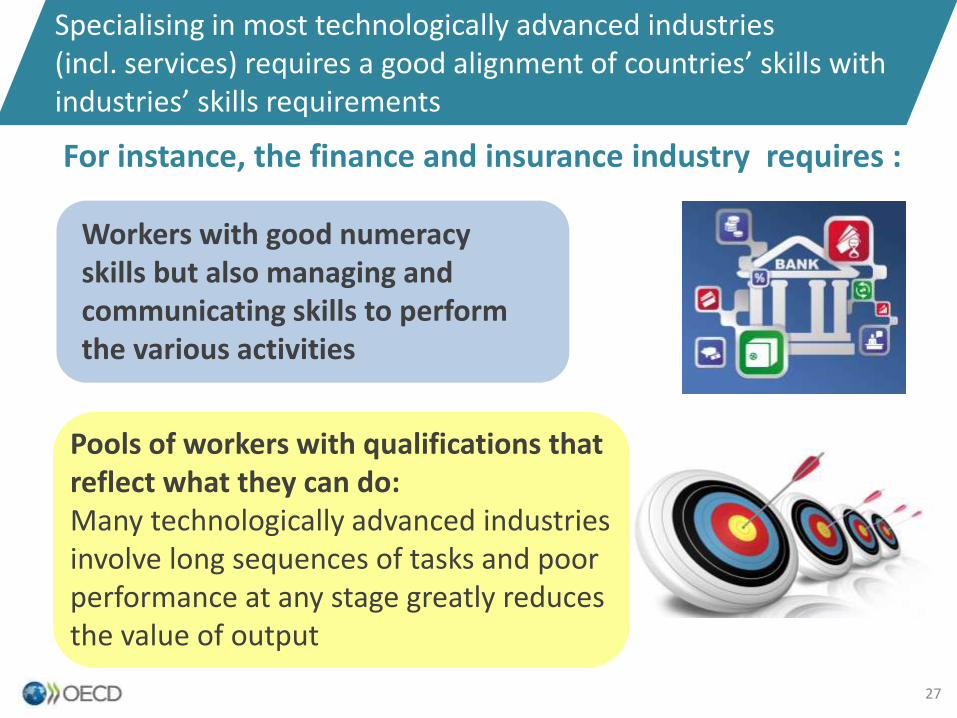
Specialising in most technologically advanced industries (incl. services) requires a good alignment of countries’ skills with industries’ skills requirements
For instance, the finance and insurance industry requires :
Workers with good numeracy skills but also managing and communicating skills to perform the various activities
Pools of workers with qualifications that reflect what they can do:Many technologically advanced industries involve long sequences of tasks and poor performance at any stage greatly reduces the value of output
27
30
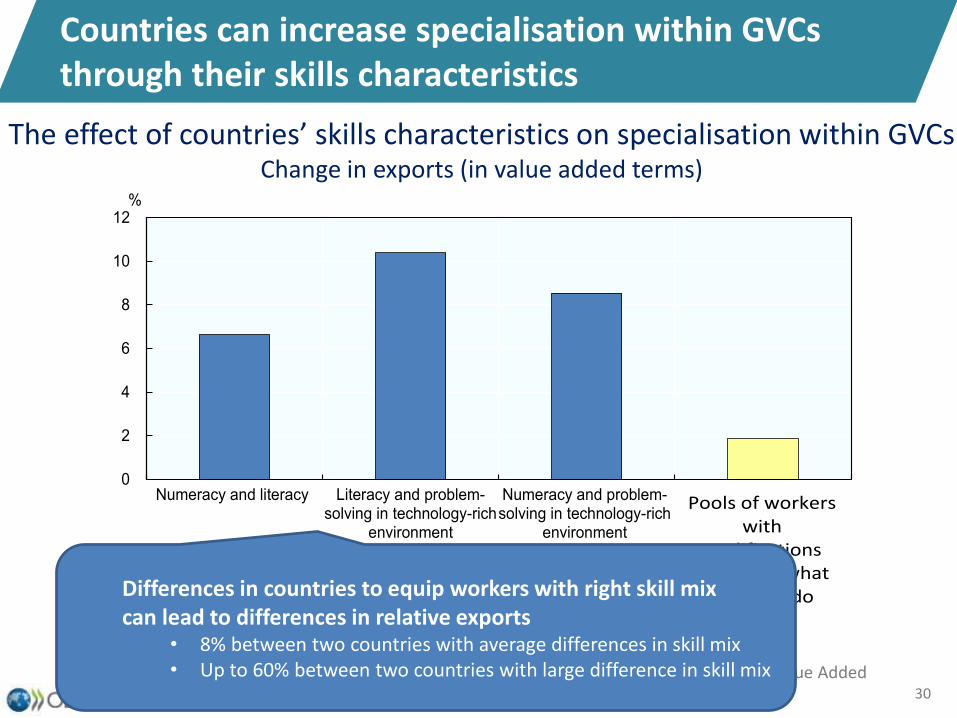
Countries can increase specialisation within GVCs through their skills characteristics
The effect of countries’ skills characteristics on specialisation within GVCsChange in exports (in value added terms)
Source: OECD calculations based on the Survey of Adult Skills (PIAAC) and Trade in Value Added Database.
0
2
4
6
8
10
12
Numeracy and literacy Literacy and problem-solving in technology-rich
environment
Numeracy and problem-solving in technology-rich
environment
%
Skills mix
Pools of workers with
qualifications reflecting what
they can doDifferences in countries to equip workers with right skill mix can lead to differences in relative exports
• 8% between two countries with average differences in skill mix• Up to 60% between two countries with large difference in skill mix
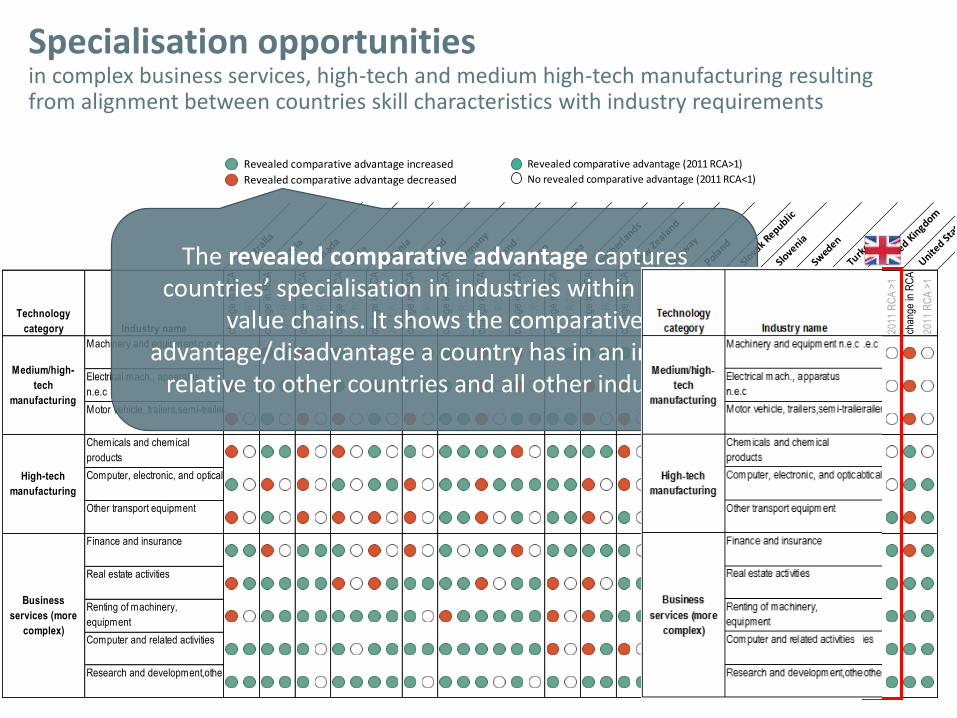
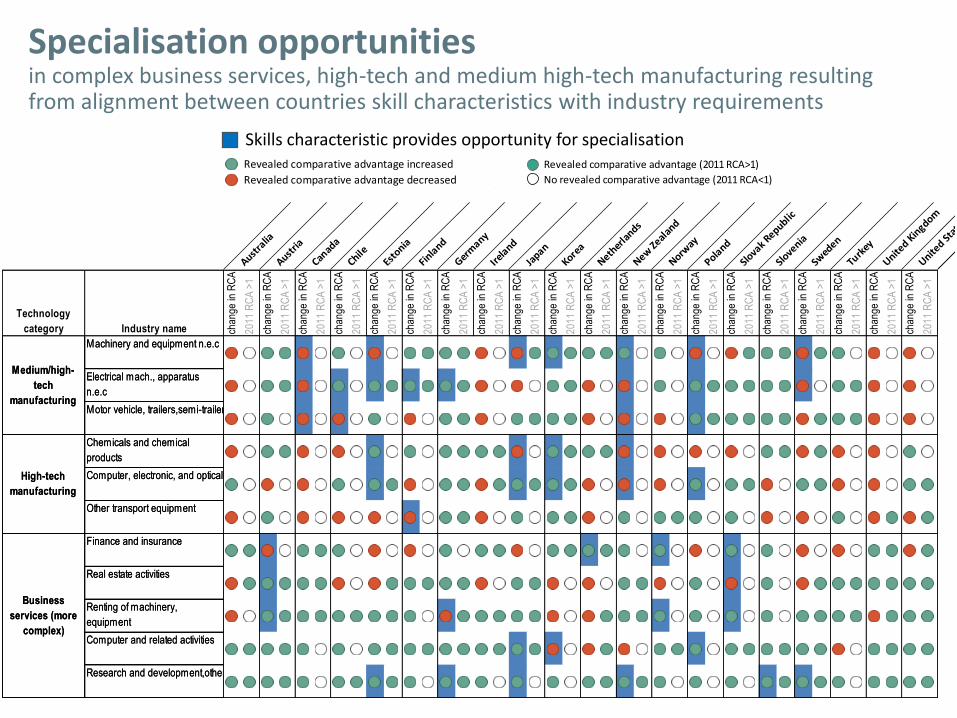
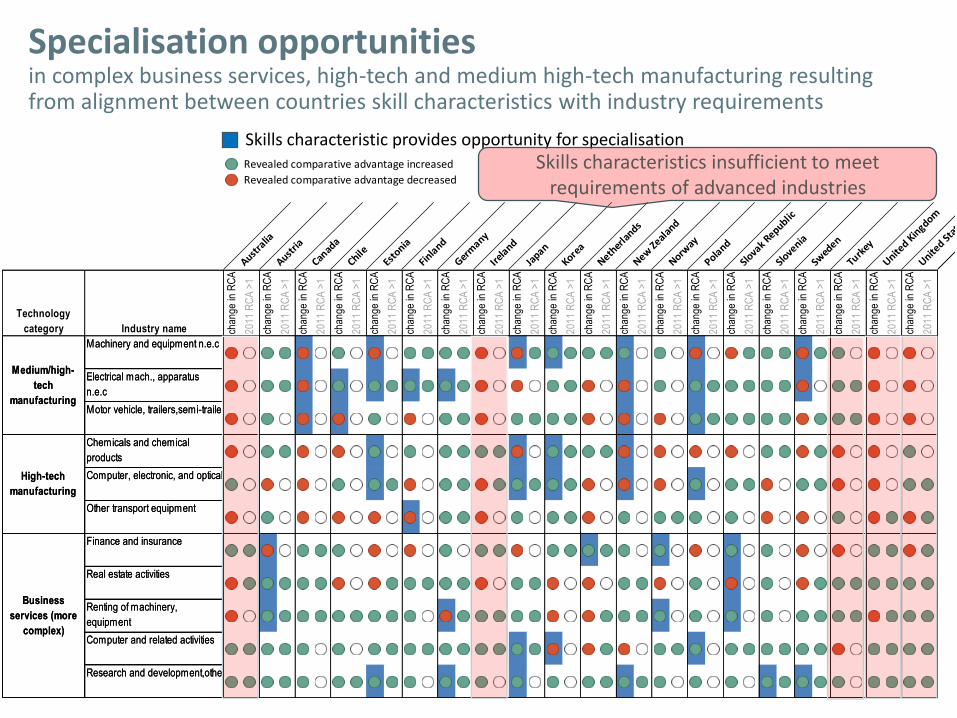
Specialisation opportunitiesin complex business services, high-tech and medium high-tech manufacturing resulting from alignment between countries skill characteristics with industry requirements
Revealed comparative advantage increased
Revealed comparative advantage decreased
Austra
lia
Austria
Canad
a
ChileEs
tonia
Finla
nd
Germ
any
Irela
nd
Japan
Korea
Nether
lands
New Zeal
and
Norway
Poland
Slova
k Republic
Slove
nia
Swed
en
Turk
ey
United K
ingdom
United St
ates
Technology
category Industry name chan
ge in
RC
A
2011
RC
A >
1
chan
ge in
RC
A
2011
RC
A >
1
chan
ge in
RC
A
2011
RC
A >
1
chan
ge in
RC
A
2011
RC
A >
1
chan
ge in
RC
A
2011
RC
A >
1
chan
ge in
RC
A
2011
RC
A >
1
chan
ge in
RC
A
2011
RC
A >
1
chan
ge in
RC
A
2011
RC
A >
1
chan
ge in
RC
A
2011
RC
A >
1
chan
ge in
RC
A
2011
RC
A >
1
chan
ge in
RC
A
2011
RC
A >
1
chan
ge in
RC
A
2011
RC
A >
1
chan
ge in
RC
A
2011
RC
A >
1
chan
ge in
RC
A
2011
RC
A >
1
chan
ge in
RC
A
2011
RC
A >
1
chan
ge in
RC
A
2011
RC
A >
1
chan
ge in
RC
A
2011
RC
A >
1
chan
ge in
RC
A
2011
RC
A >
1
chan
ge in
RC
A
2011
RC
A >
1
chan
ge in
RC
A
2011
RC
A >
1
Machinery and equipment n.e.c
Electrical mach., apparatus
n.e.c
Motor vehicle, trailers,semi-trailers
Chemicals and chemical
products
Computer, electronic, and optical
Other transport equipment
Finance and insurance
Real estate activities
Renting of machinery,
equipment
Computer and related activities
Research and development,others
Medium/high-
tech
manufacturing
High-tech
manufacturing
Business
services (more
complex)
The revealed comparative advantage captures countries’ specialisation in industries within global
value chains. It shows the comparative advantage/disadvantage a country has in an industry
relative to other countries and all other industries
Revealed comparative advantage (2011 RCA>1)
No revealed comparative advantage (2011 RCA<1)
Specialisation opportunitiesin complex business services, high-tech and medium high-tech manufacturing resulting from alignment between countries skill characteristics with industry requirements
Revealed comparative advantage increased
Revealed comparative advantage decreased
Austra
lia
Austria
Canad
a
ChileEs
tonia
Finla
nd
Germ
any
Irela
nd
Japan
Korea
Nether
lands
New Zeal
and
Norway
Poland
Slova
k Republic
Slove
nia
Swed
en
Turk
ey
United K
ingdom
United St
ates
Technology
category Industry name chan
ge in
RC
A
2011
RC
A >
1
chan
ge in
RC
A
2011
RC
A >
1
chan
ge in
RC
A
2011
RC
A >
1
chan
ge in
RC
A
2011
RC
A >
1
chan
ge in
RC
A
2011
RC
A >
1
chan
ge in
RC
A
2011
RC
A >
1
chan
ge in
RC
A
2011
RC
A >
1
chan
ge in
RC
A
2011
RC
A >
1
chan
ge in
RC
A
2011
RC
A >
1
chan
ge in
RC
A
2011
RC
A >
1
chan
ge in
RC
A
2011
RC
A >
1
chan
ge in
RC
A
2011
RC
A >
1
chan
ge in
RC
A
2011
RC
A >
1
chan
ge in
RC
A
2011
RC
A >
1
chan
ge in
RC
A
2011
RC
A >
1
chan
ge in
RC
A
2011
RC
A >
1
chan
ge in
RC
A
2011
RC
A >
1
chan
ge in
RC
A
2011
RC
A >
1
chan
ge in
RC
A
2011
RC
A >
1
chan
ge in
RC
A
2011
RC
A >
1
Machinery and equipment n.e.c
Electrical mach., apparatus
n.e.c
Motor vehicle, trailers,semi-trailers
Chemicals and chemical
products
Computer, electronic, and optical
Other transport equipment
Finance and insurance
Real estate activities
Renting of machinery,
equipment
Computer and related activities
Research and development,others
Medium/high-
tech
manufacturing
High-tech
manufacturing
Business
services (more
complex)
Skills characteristic provides opportunity for specialisationRevealed comparative advantage (2011 RCA>1)
No revealed comparative advantage (2011 RCA<1)
Specialisation opportunitiesin complex business services, high-tech and medium high-tech manufacturing resulting from alignment between countries skill characteristics with industry requirements
Revealed comparative advantage increased
Revealed comparative advantage decreased
Austra
lia
Austria
Canad
a
ChileEs
tonia
Finla
nd
Germ
any
Irela
nd
Japan
Korea
Nether
lands
New Zeal
and
Norway
Poland
Slova
k Republic
Slove
nia
Swed
en
Turk
ey
United K
ingdom
United St
ates
Technology
category Industry name chan
ge in
RC
A
2011
RC
A >
1
chan
ge in
RC
A
2011
RC
A >
1
chan
ge in
RC
A
2011
RC
A >
1
chan
ge in
RC
A
2011
RC
A >
1
chan
ge in
RC
A
2011
RC
A >
1
chan
ge in
RC
A
2011
RC
A >
1
chan
ge in
RC
A
2011
RC
A >
1
chan
ge in
RC
A
2011
RC
A >
1
chan
ge in
RC
A
2011
RC
A >
1
chan
ge in
RC
A
2011
RC
A >
1
chan
ge in
RC
A
2011
RC
A >
1
chan
ge in
RC
A
2011
RC
A >
1
chan
ge in
RC
A
2011
RC
A >
1
chan
ge in
RC
A
2011
RC
A >
1
chan
ge in
RC
A
2011
RC
A >
1
chan
ge in
RC
A
2011
RC
A >
1
chan
ge in
RC
A
2011
RC
A >
1
chan
ge in
RC
A
2011
RC
A >
1
chan
ge in
RC
A
2011
RC
A >
1
chan
ge in
RC
A
2011
RC
A >
1
Machinery and equipment n.e.c
Electrical mach., apparatus
n.e.c
Motor vehicle, trailers,semi-trailers
Chemicals and chemical
products
Computer, electronic, and optical
Other transport equipment
Finance and insurance
Real estate activities
Renting of machinery,
equipment
Computer and related activities
Research and development,others
Medium/high-
tech
manufacturing
High-tech
manufacturing
Business
services (more
complex)
Revealed comparative advantage increased
Revealed comparative advantage decreased
Austra
lia
Austria
Canad
a
ChileEs
tonia
Finla
nd
Germ
any
Irela
nd
Japan
Korea
Nether
lands
New Zeal
and
Norway
Poland
Slova
k Republic
Slove
nia
Swed
en
Turk
ey
United K
ingdom
United St
ates
Technology
category Industry name chan
ge in
RC
A
2011
RC
A >
1
chan
ge in
RC
A
2011
RC
A >
1
chan
ge in
RC
A
2011
RC
A >
1
chan
ge in
RC
A
2011
RC
A >
1
chan
ge in
RC
A
2011
RC
A >
1
chan
ge in
RC
A
2011
RC
A >
1
chan
ge in
RC
A
2011
RC
A >
1
chan
ge in
RC
A
2011
RC
A >
1
chan
ge in
RC
A
2011
RC
A >
1
chan
ge in
RC
A
2011
RC
A >
1
chan
ge in
RC
A
2011
RC
A >
1
chan
ge in
RC
A
2011
RC
A >
1
chan
ge in
RC
A
2011
RC
A >
1
chan
ge in
RC
A
2011
RC
A >
1
chan
ge in
RC
A
2011
RC
A >
1
chan
ge in
RC
A
2011
RC
A >
1
chan
ge in
RC
A
2011
RC
A >
1
chan
ge in
RC
A
2011
RC
A >
1
chan
ge in
RC
A
2011
RC
A >
1
chan
ge in
RC
A
2011
RC
A >
1
Machinery and equipment n.e.c
Electrical mach., apparatus
n.e.c
Motor vehicle, trailers,semi-trailers
Chemicals and chemical
products
Computer, electronic, and optical
Other transport equipment
Finance and insurance
Real estate activities
Renting of machinery,
equipment
Computer and related activities
Research and development,others
Medium/high-
tech
manufacturing
High-tech
manufacturing
Business
services (more
complex)
Skills characteristic provides opportunity for specialisationSkills characteristics insufficient to meet
requirements of advanced industries
Specialisation opportunitiesin complex business services, high-tech and medium high-tech manufacturing resulting from alignment between countries skill characteristics with industry requirements
Revealed comparative advantage increased
Revealed comparative advantage decreased
Austra
lia
Austria
Canad
a
ChileEs
tonia
Finla
nd
Germ
any
Irela
nd
Japan
Korea
Nether
lands
New Zeal
and
Norway
Poland
Slova
k Republic
Slove
nia
Swed
en
Turk
ey
United K
ingdom
United St
ates
Technology
category Industry name chan
ge in
RC
A
2011
RC
A >
1
chan
ge in
RC
A
2011
RC
A >
1
chan
ge in
RC
A
2011
RC
A >
1
chan
ge in
RC
A
2011
RC
A >
1
chan
ge in
RC
A
2011
RC
A >
1
chan
ge in
RC
A
2011
RC
A >
1
chan
ge in
RC
A
2011
RC
A >
1
chan
ge in
RC
A
2011
RC
A >
1
chan
ge in
RC
A
2011
RC
A >
1
chan
ge in
RC
A
2011
RC
A >
1
chan
ge in
RC
A
2011
RC
A >
1
chan
ge in
RC
A
2011
RC
A >
1
chan
ge in
RC
A
2011
RC
A >
1
chan
ge in
RC
A
2011
RC
A >
1
chan
ge in
RC
A
2011
RC
A >
1
chan
ge in
RC
A
2011
RC
A >
1
chan
ge in
RC
A
2011
RC
A >
1
chan
ge in
RC
A
2011
RC
A >
1
chan
ge in
RC
A
2011
RC
A >
1
chan
ge in
RC
A
2011
RC
A >
1
Machinery and equipment n.e.c
Electrical mach., apparatus
n.e.c
Motor vehicle, trailers,semi-trailers
Chemicals and chemical
products
Computer, electronic, and optical
Other transport equipment
Finance and insurance
Real estate activities
Renting of machinery,
equipment
Computer and related activities
Research and development,others
Medium/high-
tech
manufacturing
High-tech
manufacturing
Business
services (more
complex)
Revealed comparative advantage increased
Revealed comparative advantage decreased
Austra
lia
Austria
Canad
a
ChileEs
tonia
Finla
nd
Germ
any
Irela
nd
Japan
Korea
Nether
lands
New Zeal
and
Norway
Poland
Slova
k Republic
Slove
nia
Swed
en
Turk
ey
United K
ingdom
United St
ates
Technology
category Industry name chan
ge in
RC
A
2011
RC
A >
1
chan
ge in
RC
A
2011
RC
A >
1
chan
ge in
RC
A
2011
RC
A >
1
chan
ge in
RC
A
2011
RC
A >
1
chan
ge in
RC
A
2011
RC
A >
1
chan
ge in
RC
A
2011
RC
A >
1
chan
ge in
RC
A
2011
RC
A >
1
chan
ge in
RC
A
2011
RC
A >
1
chan
ge in
RC
A
2011
RC
A >
1
chan
ge in
RC
A
2011
RC
A >
1
chan
ge in
RC
A
2011
RC
A >
1
chan
ge in
RC
A
2011
RC
A >
1
chan
ge in
RC
A
2011
RC
A >
1
chan
ge in
RC
A
2011
RC
A >
1
chan
ge in
RC
A
2011
RC
A >
1
chan
ge in
RC
A
2011
RC
A >
1
chan
ge in
RC
A
2011
RC
A >
1
chan
ge in
RC
A
2011
RC
A >
1
chan
ge in
RC
A
2011
RC
A >
1
chan
ge in
RC
A
2011
RC
A >
1
Machinery and equipment n.e.c
Electrical mach., apparatus
n.e.c
Motor vehicle, trailers,semi-trailers
Chemicals and chemical
products
Computer, electronic, and optical
Other transport equipment
Finance and insurance
Real estate activities
Renting of machinery,
equipment
Computer and related activities
Research and development,others
Medium/high-
tech
manufacturing
High-tech
manufacturing
Business
services (more
complex)
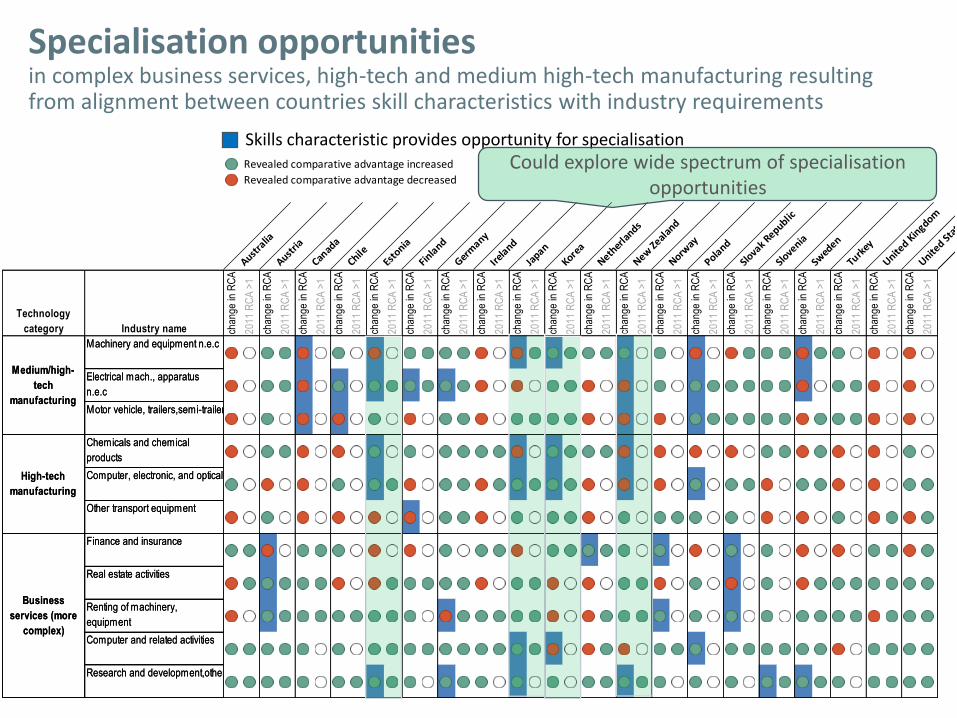
Skills characteristic provides opportunity for specialisationCould explore wide spectrum of specialisation
opportunities
Specialisation opportunitiesin complex business services, high-tech and medium high-tech manufacturing resulting from alignment between countries skill characteristics with industry requirements
Revealed comparative advantage increased
Revealed comparative advantage decreased
Austra
lia
Austria
Canad
a
ChileEs
tonia
Finla
nd
Germ
any
Irela
nd
Japan
Korea
Nether
lands
New Zeal
and
Norway
Poland
Slova
k Republic
Slove
nia
Swed
en
Turk
ey
United K
ingdom
United St
ates
Technology
category Industry name chan
ge in
RC
A
2011
RC
A >
1
chan
ge in
RC
A
2011
RC
A >
1
chan
ge in
RC
A
2011
RC
A >
1
chan
ge in
RC
A
2011
RC
A >
1
chan
ge in
RC
A
2011
RC
A >
1
chan
ge in
RC
A
2011
RC
A >
1
chan
ge in
RC
A
2011
RC
A >
1
chan
ge in
RC
A
2011
RC
A >
1
chan
ge in
RC
A
2011
RC
A >
1
chan
ge in
RC
A
2011
RC
A >
1
chan
ge in
RC
A
2011
RC
A >
1
chan
ge in
RC
A
2011
RC
A >
1
chan
ge in
RC
A
2011
RC
A >
1
chan
ge in
RC
A
2011
RC
A >
1
chan
ge in
RC
A
2011
RC
A >
1
chan
ge in
RC
A
2011
RC
A >
1
chan
ge in
RC
A
2011
RC
A >
1
chan
ge in
RC
A
2011
RC
A >
1
chan
ge in
RC
A
2011
RC
A >
1
chan
ge in
RC
A
2011
RC
A >
1
Machinery and equipment n.e.c
Electrical mach., apparatus
n.e.c
Motor vehicle, trailers,semi-trailers
Chemicals and chemical
products
Computer, electronic, and optical
Other transport equipment
Finance and insurance
Real estate activities
Renting of machinery,
equipment
Computer and related activities
Research and development,others
Medium/high-
tech
manufacturing
High-tech
manufacturing
Business
services (more
complex)
Revealed comparative advantage increased
Revealed comparative advantage decreased
Austra
lia
Austria
Canad
a
ChileEs
tonia
Finla
nd
Germ
any
Irela
nd
Japan
Korea
Nether
lands
New Zeal
and
Norway
Poland
Slova
k Republic
Slove
nia
Swed
en
Turk
ey
United K
ingdom
United St
ates
Technology
category Industry name chan
ge in
RC
A
2011
RC
A >
1
chan
ge in
RC
A
2011
RC
A >
1
chan
ge in
RC
A
2011
RC
A >
1
chan
ge in
RC
A
2011
RC
A >
1
chan
ge in
RC
A
2011
RC
A >
1
chan
ge in
RC
A
2011
RC
A >
1
chan
ge in
RC
A
2011
RC
A >
1
chan
ge in
RC
A
2011
RC
A >
1
chan
ge in
RC
A
2011
RC
A >
1
chan
ge in
RC
A
2011
RC
A >
1
chan
ge in
RC
A
2011
RC
A >
1
chan
ge in
RC
A
2011
RC
A >
1
chan
ge in
RC
A
2011
RC
A >
1
chan
ge in
RC
A
2011
RC
A >
1
chan
ge in
RC
A
2011
RC
A >
1
chan
ge in
RC
A
2011
RC
A >
1
chan
ge in
RC
A
2011
RC
A >
1
chan
ge in
RC
A
2011
RC
A >
1
chan
ge in
RC
A
2011
RC
A >
1
chan
ge in
RC
A
2011
RC
A >
1
Machinery and equipment n.e.c
Electrical mach., apparatus
n.e.c
Motor vehicle, trailers,semi-trailers
Chemicals and chemical
products
Computer, electronic, and optical
Other transport equipment
Finance and insurance
Real estate activities
Renting of machinery,
equipment
Computer and related activities
Research and development,others
Medium/high-
tech
manufacturing
High-tech
manufacturing
Business
services (more
complex)
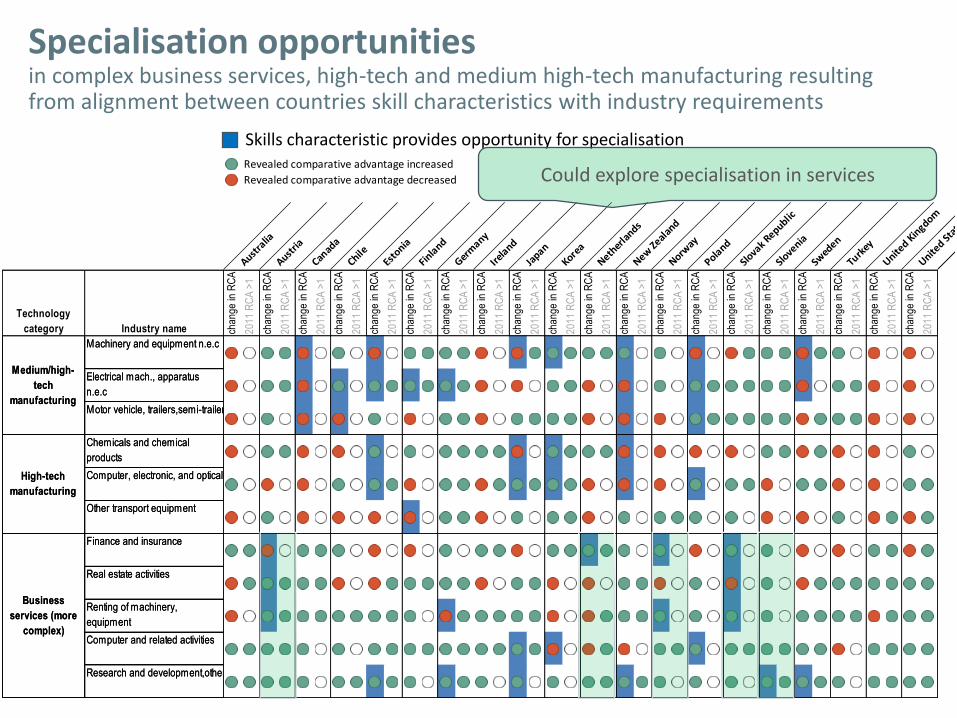
Skills characteristic provides opportunity for specialisation
Could explore specialisation in services
Specialisation opportunitiesin complex business services, high-tech and medium high-tech manufacturing resulting from alignment between countries skill characteristics with industry requirements
Revealed comparative advantage increased
Revealed comparative advantage decreased
Austra
lia
Austria
Canad
a
ChileEs
tonia
Finla
nd
Germ
any
Irela
nd
Japan
Korea
Nether
lands
New Zeal
and
Norway
Poland
Slova
k Republic
Slove
nia
Swed
en
Turk
ey
United K
ingdom
United St
ates
Technology
category Industry name chan
ge in
RC
A
2011
RC
A >
1
chan
ge in
RC
A
2011
RC
A >
1
chan
ge in
RC
A
2011
RC
A >
1
chan
ge in
RC
A
2011
RC
A >
1
chan
ge in
RC
A
2011
RC
A >
1
chan
ge in
RC
A
2011
RC
A >
1
chan
ge in
RC
A
2011
RC
A >
1
chan
ge in
RC
A
2011
RC
A >
1
chan
ge in
RC
A
2011
RC
A >
1
chan
ge in
RC
A
2011
RC
A >
1
chan
ge in
RC
A
2011
RC
A >
1
chan
ge in
RC
A
2011
RC
A >
1
chan
ge in
RC
A
2011
RC
A >
1
chan
ge in
RC
A
2011
RC
A >
1
chan
ge in
RC
A
2011
RC
A >
1
chan
ge in
RC
A
2011
RC
A >
1
chan
ge in
RC
A
2011
RC
A >
1
chan
ge in
RC
A
2011
RC
A >
1
chan
ge in
RC
A
2011
RC
A >
1
chan
ge in
RC
A
2011
RC
A >
1
Machinery and equipment n.e.c
Electrical mach., apparatus
n.e.c
Motor vehicle, trailers,semi-trailers
Chemicals and chemical
products
Computer, electronic, and optical
Other transport equipment
Finance and insurance
Real estate activities
Renting of machinery,
equipment
Computer and related activities
Research and development,others
Medium/high-
tech
manufacturing
High-tech
manufacturing
Business
services (more
complex)
Revealed comparative advantage increased
Revealed comparative advantage decreased
Austra
lia
Austria
Canad
a
ChileEs
tonia
Finla
nd
Germ
any
Irela
nd
Japan
Korea
Nether
lands
New Zeal
and
Norway
Poland
Slova
k Republic
Slove
nia
Swed
en
Turk
ey
United K
ingdom
United St
ates
Technology
category Industry name chan
ge in
RC
A
2011
RC
A >
1
chan
ge in
RC
A
2011
RC
A >
1
chan
ge in
RC
A
2011
RC
A >
1
chan
ge in
RC
A
2011
RC
A >
1
chan
ge in
RC
A
2011
RC
A >
1
chan
ge in
RC
A
2011
RC
A >
1
chan
ge in
RC
A
2011
RC
A >
1
chan
ge in
RC
A
2011
RC
A >
1
chan
ge in
RC
A
2011
RC
A >
1
chan
ge in
RC
A
2011
RC
A >
1
chan
ge in
RC
A
2011
RC
A >
1
chan
ge in
RC
A
2011
RC
A >
1
chan
ge in
RC
A
2011
RC
A >
1
chan
ge in
RC
A
2011
RC
A >
1
chan
ge in
RC
A
2011
RC
A >
1
chan
ge in
RC
A
2011
RC
A >
1
chan
ge in
RC
A
2011
RC
A >
1
chan
ge in
RC
A
2011
RC
A >
1
chan
ge in
RC
A
2011
RC
A >
1
chan
ge in
RC
A
2011
RC
A >
1
Machinery and equipment n.e.c
Electrical mach., apparatus
n.e.c
Motor vehicle, trailers,semi-trailers
Chemicals and chemical
products
Computer, electronic, and optical
Other transport equipment
Finance and insurance
Real estate activities
Renting of machinery,
equipment
Computer and related activities
Research and development,others
Medium/high-
tech
manufacturing
High-tech
manufacturing
Business
services (more
complex)
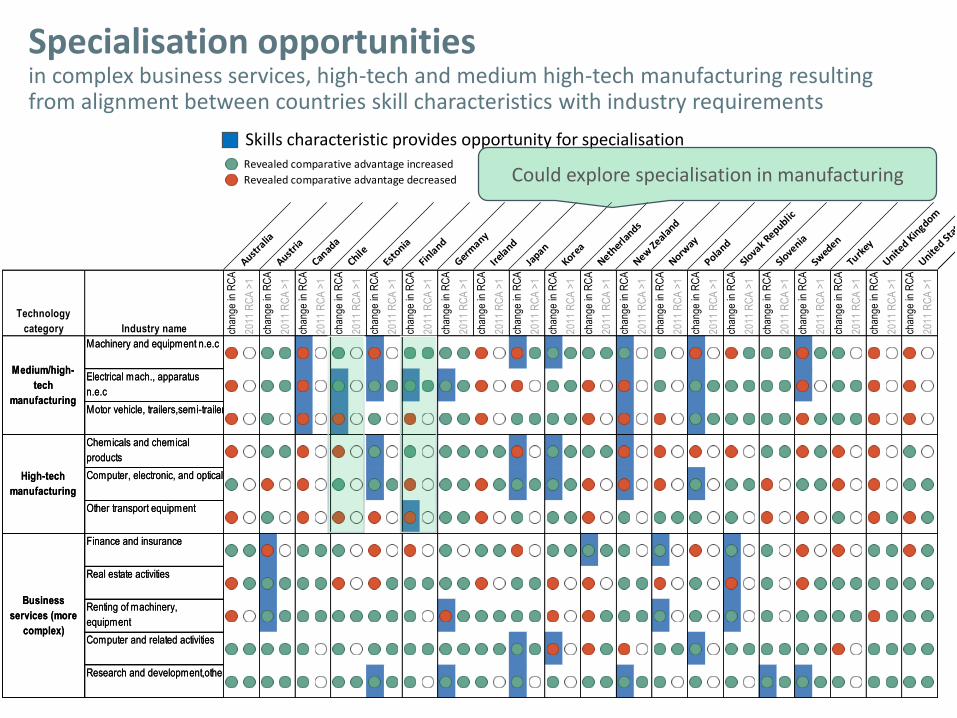
Skills characteristic provides opportunity for specialisation
Could explore specialisation in manufacturing
37
Lim
ite
d s
har
e o
f lo
w-s
kille
d w
ork
ers
De
velo
pin
g sk
ills
Ad
van
ced
ski
lls
Incr
eas
ing
par
tici
pat
ion
in
GV
Cs
Spe
cial
ised
in
adva
nce
d in
du
stri
es
Incr
eas
ing
spe
cial
isat
ion
in
adva
nce
d in
du
stri
es
Incr
eas
ing
pro
du
ctiv
ity
Incr
eas
ing
em
plo
ymen
t
Imp
rovi
ng
soci
al
ou
tco
me
s
Limited share of low-skilled workers
To participate in GVCs, ensure that participation translates into productivity growth and limit risk of employment loss, increased inequality and poor job quality
Developing skills To ensure that participation in GVCs translates into good economic and social outcomes, countries need to raise skill outcomes
Advanced skills To specialise in technologically advanced industries, the quality of skills at the top end of the skill distribution are important
Increasing participation in GVCs
How successfully have countries extended their participation in GVCs by importing foreign inputs for exports and producing inputs used in other countries inputs
Specialised in advanced industries
Specialisation in technologically advanced industries is linked to value creation, innovation and productivity gains (revealed comparative advantage)
Increasing specialisation in advanced industries
How quickly has the revealed comparative advantage grown
Increasing productivity
Increased participation in GVCs can lead to productivity gains through many channels, including specialisation, increased competition and technology diffusion
Increasing employment
Participation in GVCs can affect employment through both job destruction and job creation
Improving social outcomes
Increased integration in GVCs can affect wages and inequalities, labour-market security and the quality of the working environment
38
Lim
ite
d s
har
e o
f lo
w-s
kille
d w
ork
ers
De
velo
pin
g sk
ills
Ad
van
ced
ski
lls
Incr
eas
ing
par
tici
pat
ion
in
GV
Cs
Spe
cial
ised
in
adva
nce
d in
du
stri
es
Incr
eas
ing
spe
cial
isat
ion
in
adva
nce
d in
du
stri
es
Incr
eas
ing
pro
du
ctiv
ity
Incr
eas
ing
em
plo
ymen
t
Imp
rovi
ng
soci
al
ou
tco
me
s

39
Lim
ite
d s
har
e o
f lo
w-s
kille
d w
ork
ers
De
velo
pin
g sk
ills
Ad
van
ced
ski
lls
Incr
eas
ing
par
tici
pat
ion
in
GV
Cs
Spe
cial
ised
in
adva
nce
d in
du
stri
es
Incr
eas
ing
spe
cial
isat
ion
in
adva
nce
d in
du
stri
es
Incr
eas
ing
pro
du
ctiv
ity
Incr
eas
ing
em
plo
ymen
t
Imp
rovi
ng
soci
al
ou
tco
me
s
UK
40
Lim
ite
d s
har
e o
f lo
w-s
kille
d w
ork
ers
De
velo
pin
g sk
ills
Ad
van
ced
ski
lls
Incr
eas
ing
par
tici
pat
ion
in
GV
Cs
Spe
cial
ised
in
adva
nce
d in
du
stri
es
Incr
eas
ing
spe
cial
isat
ion
in
adva
nce
d in
du
stri
es
Incr
eas
ing
pro
du
ctiv
ity
Incr
eas
ing
em
plo
ymen
t
Imp
rovi
ng
soci
al
ou
tco
me
s
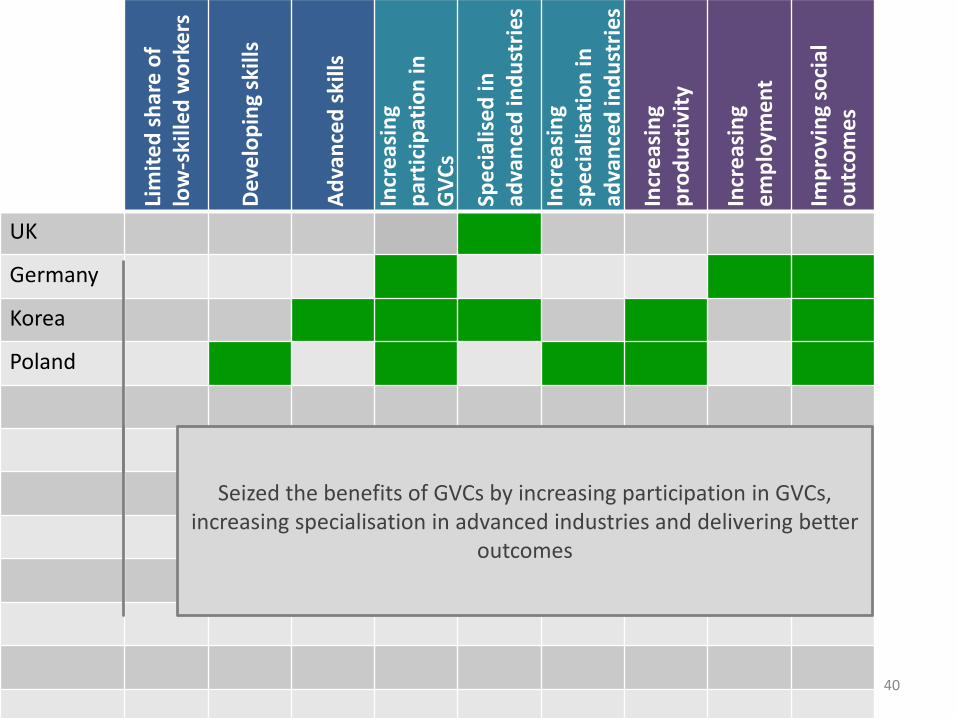
UK
Germany
Korea
Poland
Seized the benefits of GVCs by increasing participation in GVCs, increasing specialisation in advanced industries and delivering better
outcomes
41
Lim
ite
d s
har
e o
f lo
w-s
kille
d w
ork
ers
De
velo
pin
g sk
ills
Ad
van
ced
ski
lls
Incr
eas
ing
par
tici
pat
ion
in
GV
Cs
Spe
cial
ised
in
adva
nce
d in
du
stri
es
Incr
eas
ing
spe
cial
isat
ion
in
adva
nce
d in
du
stri
es
Incr
eas
ing
pro
du
ctiv
ity
Incr
eas
ing
em
plo
ymen
t
Imp
rovi
ng
soci
al
ou
tco
me
s
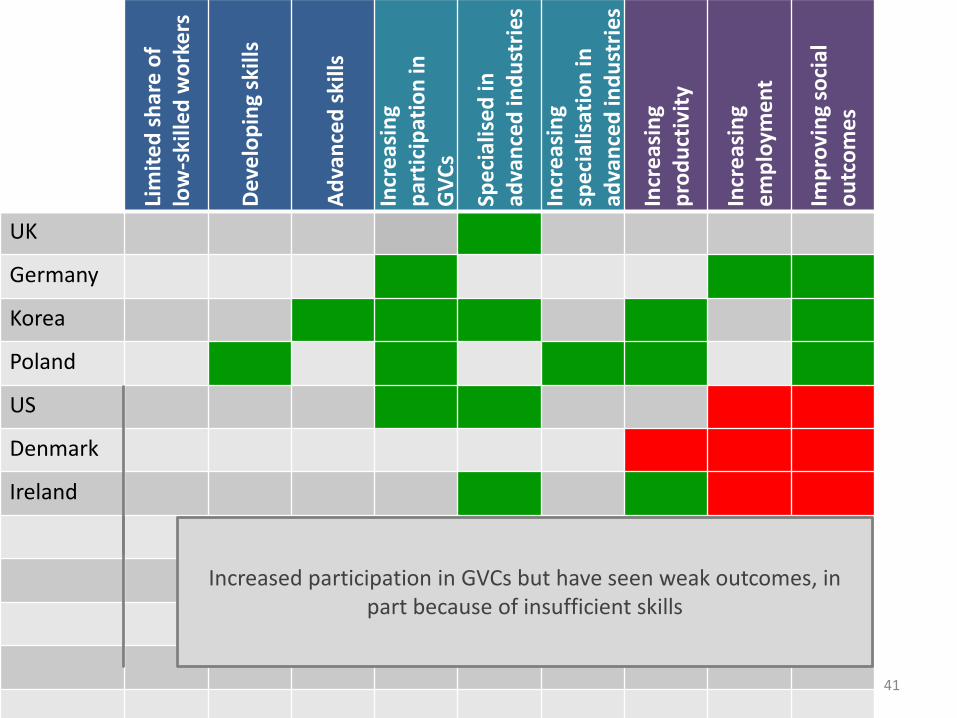
UK
Germany
Korea
Poland
US
Denmark
Ireland
Increased participation in GVCs but have seen weak outcomes, in part because of insufficient skills
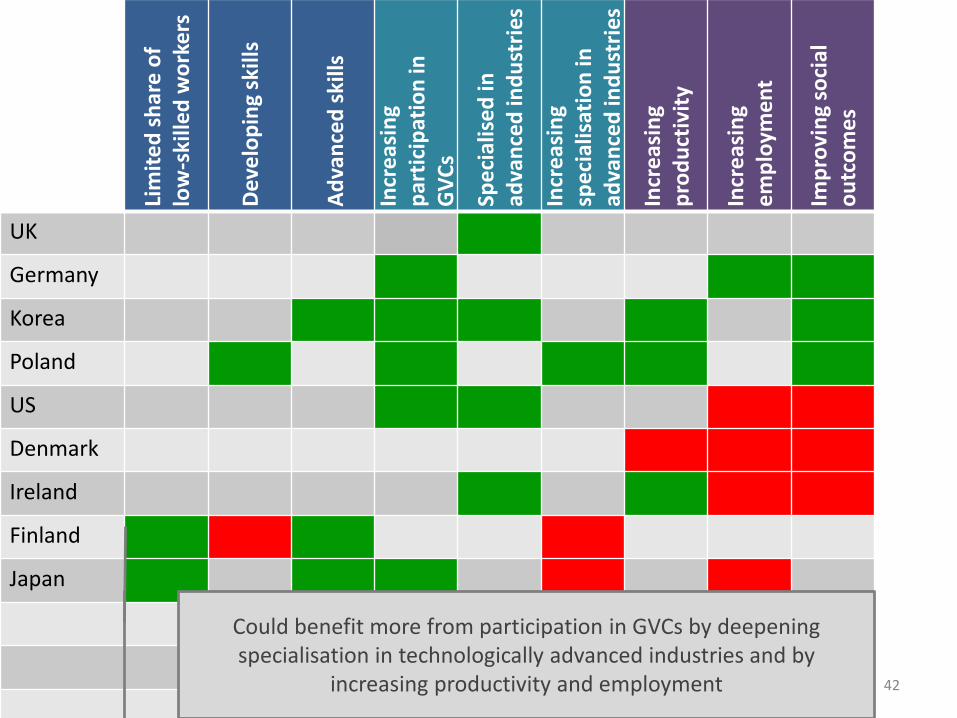
42
Lim
ite
d s
har
e o
f lo
w-s
kille
d w
ork
ers
De
velo
pin
g sk
ills
Ad
van
ced
ski
lls
Incr
eas
ing
par
tici
pat
ion
in
GV
Cs
Spe
cial
ised
in
adva
nce
d in
du
stri
es
Incr
eas
ing
spe
cial
isat
ion
in
adva
nce
d in
du
stri
es
Incr
eas
ing
pro
du
ctiv
ity
Incr
eas
ing
em
plo
ymen
t
Imp
rovi
ng
soci
al
ou
tco
me
s
UK
Germany
Korea
Poland
US
Denmark
Ireland
Finland
Japan
Could benefit more from participation in GVCs by deepening specialisation in technologically advanced industries and by
increasing productivity and employment
43
Lim
ite
d s
har
e o
f lo
w-s
kille
d w
ork
ers
De
velo
pin
g sk
ills
Ad
van
ced
ski
lls
Incr
eas
ing
par
tici
pat
ion
in
GV
Cs
Spe
cial
ised
in
adva
nce
d in
du
stri
es
Incr
eas
ing
spe
cial
isat
ion
in
adva
nce
d in
du
stri
es
Incr
eas
ing
pro
du
ctiv
ity
Incr
eas
ing
em
plo
ymen
t
Imp
rovi
ng
soci
al
ou
tco
me
s
UK
Germany
Korea
Poland
US
Denmark
Ireland
Finland
Japan
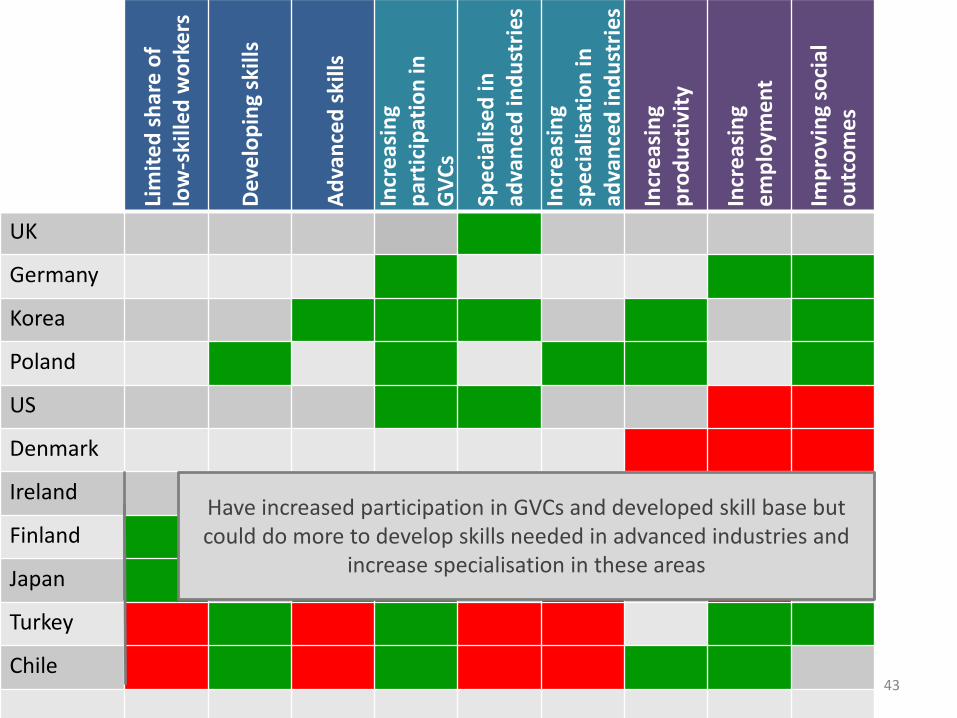
Turkey
Chile
Have increased participation in GVCs and developed skill base but could do more to develop skills needed in advanced industries and
increase specialisation in these areas

Implications for education and training policies
Implications for: Education and training policies
44
• Improve quality of education and training
• Better connect the worlds of learning and work– Countries comparative advantage emerges from interactions between skills
characteristics and industry requirements
• Remove barriers to further skills development– Don’t expect workers to accept they lose their jobs if they don’t feel
prepared to get or create a new one
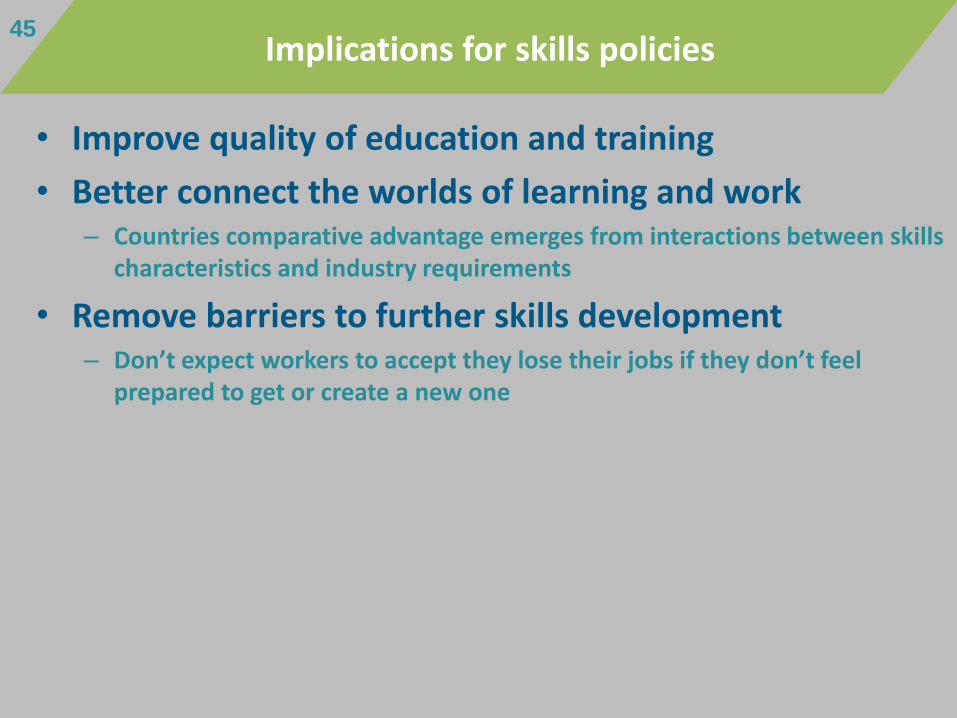
45Implications for skills policies
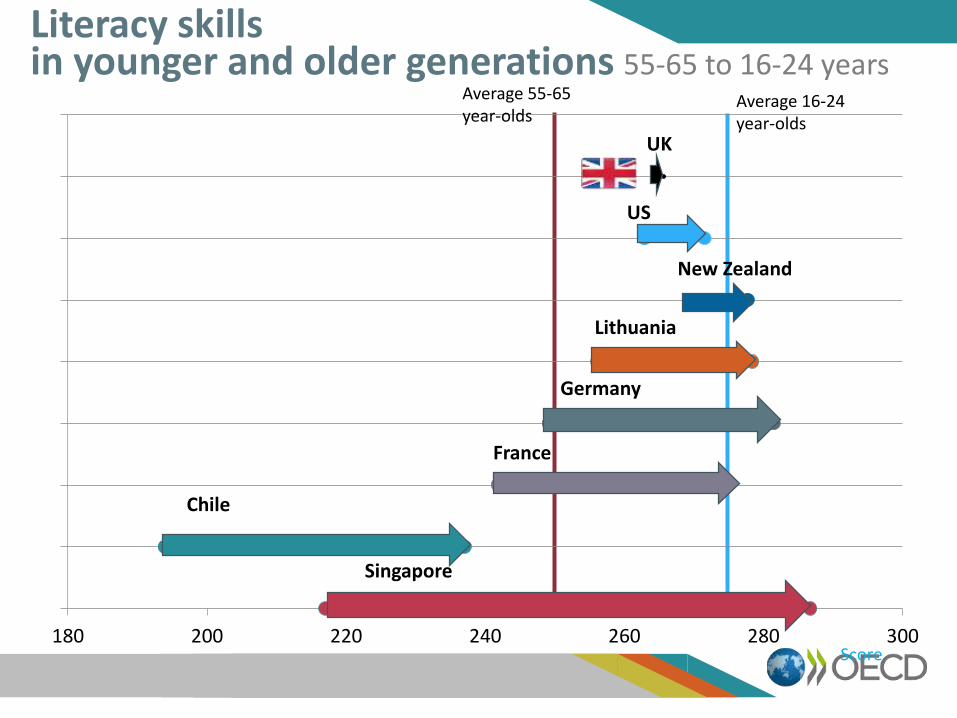
180 200 220 240 260 280 300Score
Literacy skillsin younger and older generations 55-65 to 16-24 years
Average 55-65 year-olds
Average 16-24 year-olds
Chile
Singapore
Lithuania
France
Germany
New Zealand
US
UK
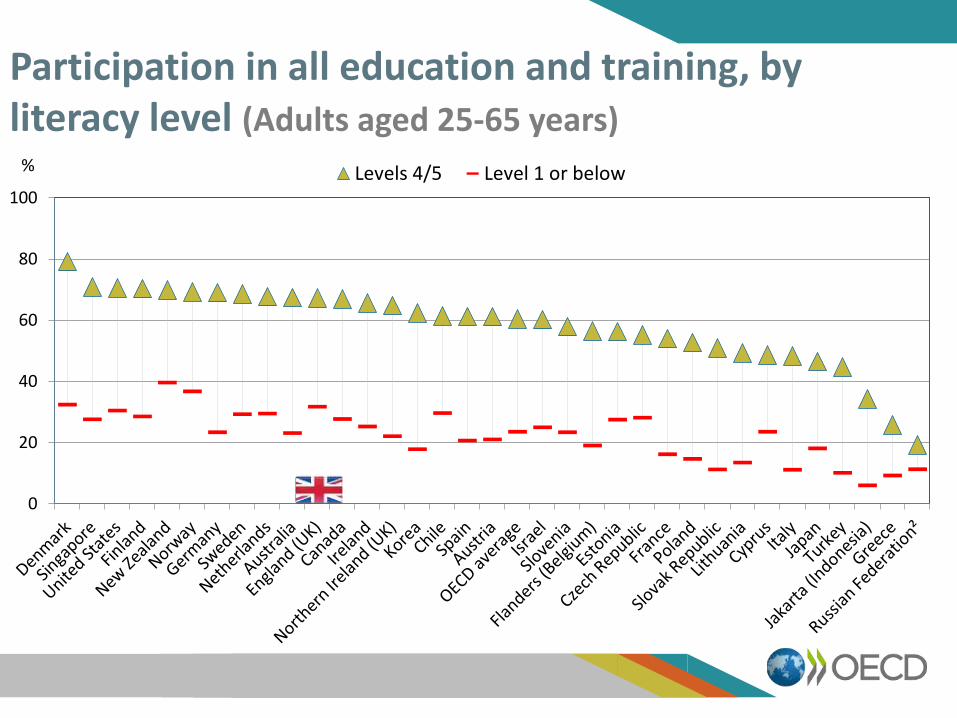
Participation in all education and training, by literacy level (Adults aged 25-65 years)
0
20
40
60
80
100
Levels 4/5 Level 1 or below%
• Improve quality of education and training
• Better connect the worlds of learning and work– Countries comparative advantage emerges from interactions between skills
characteristics and industry requirements
• Remove barriers to further skills development– Don’t expect workers to accept they lose their jobs if they don’t feel
prepared to get or create a new one
• Ensure relevant and reliable qualifications– There is huge variation in the skills of people with similar qualifications
48Implications for skills policies
49
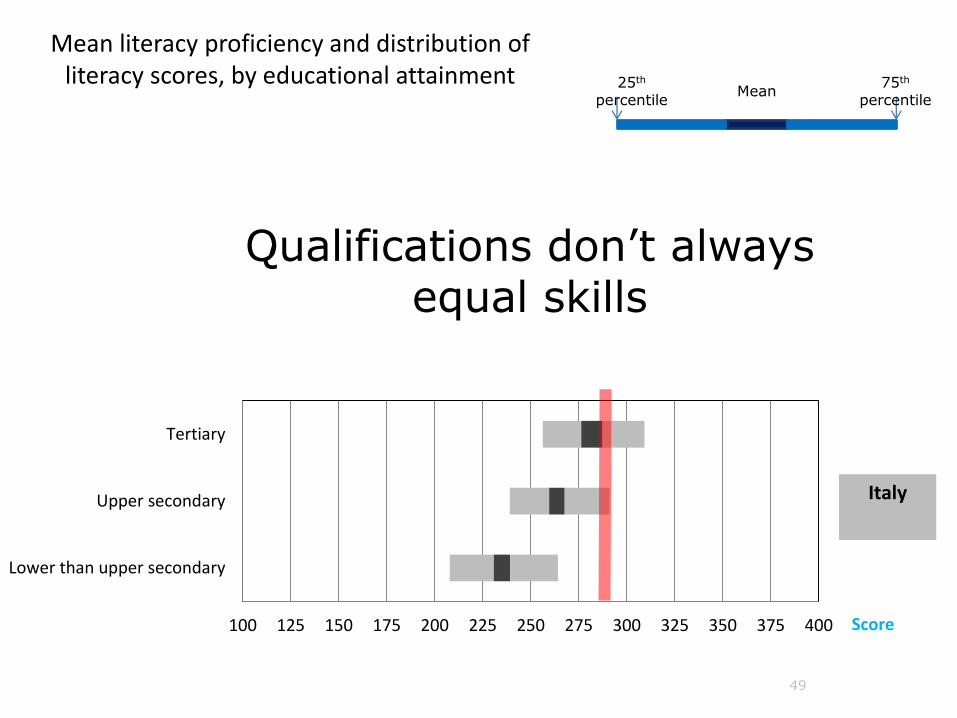
Mean literacy proficiency and distribution of literacy scores, by educational attainment
100 125 150 175 200 225 250 275 300 325 350 375 400
Lower than upper secondary
Upper secondary
Tertiary
Italy
Score
25th
percentileMean
75th
percentile
Lower than upper secondary
Upper secondary
Tertiary
100 125 150 175 200 225 250 275 300 325 350 375 400
Japan
Score
Qualifications don’t alwaysequal skills
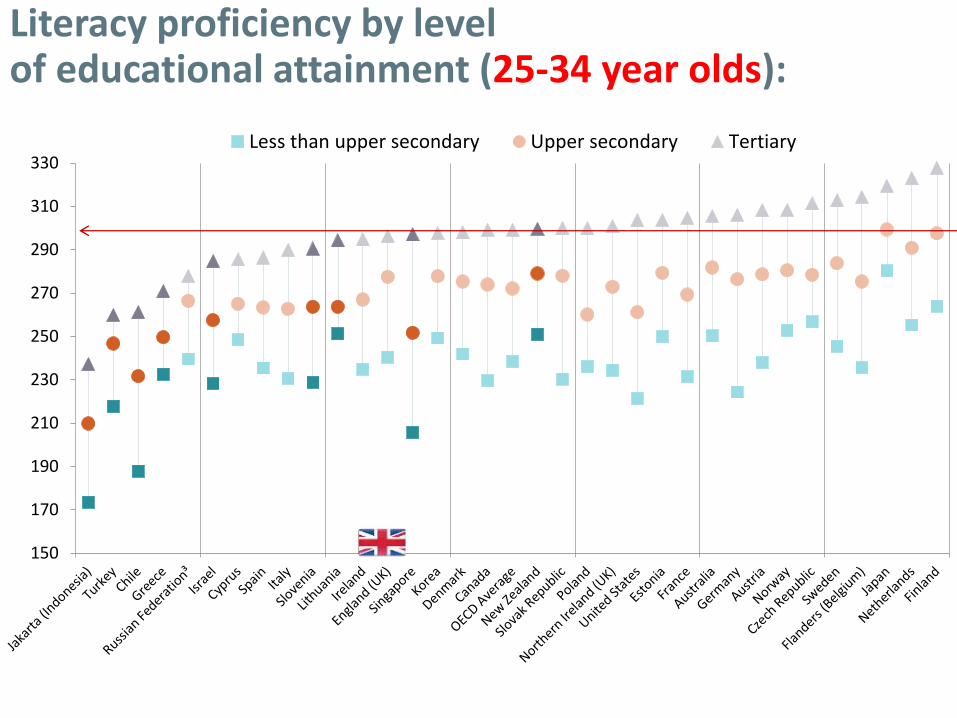
150
170
190
210
230
250
270
290
310
330Less than upper secondary Upper secondary Tertiary
Literacy proficiency by levelof educational attainment (25-34 year olds):
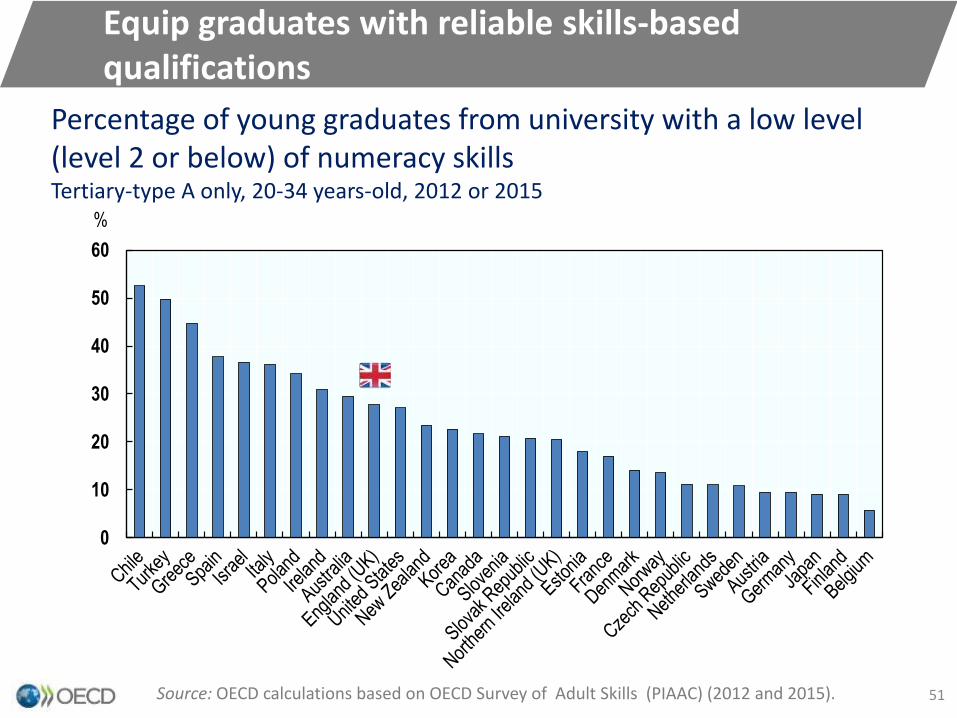
Equip graduates with reliable skills-based qualifications
0
10
20
30
40
50
60
%
Percentage of young graduates from university with a low level (level 2 or below) of numeracy skillsTertiary-type A only, 20-34 years-old, 2012 or 2015
Source: OECD calculations based on OECD Survey of Adult Skills (PIAAC) (2012 and 2015). 51
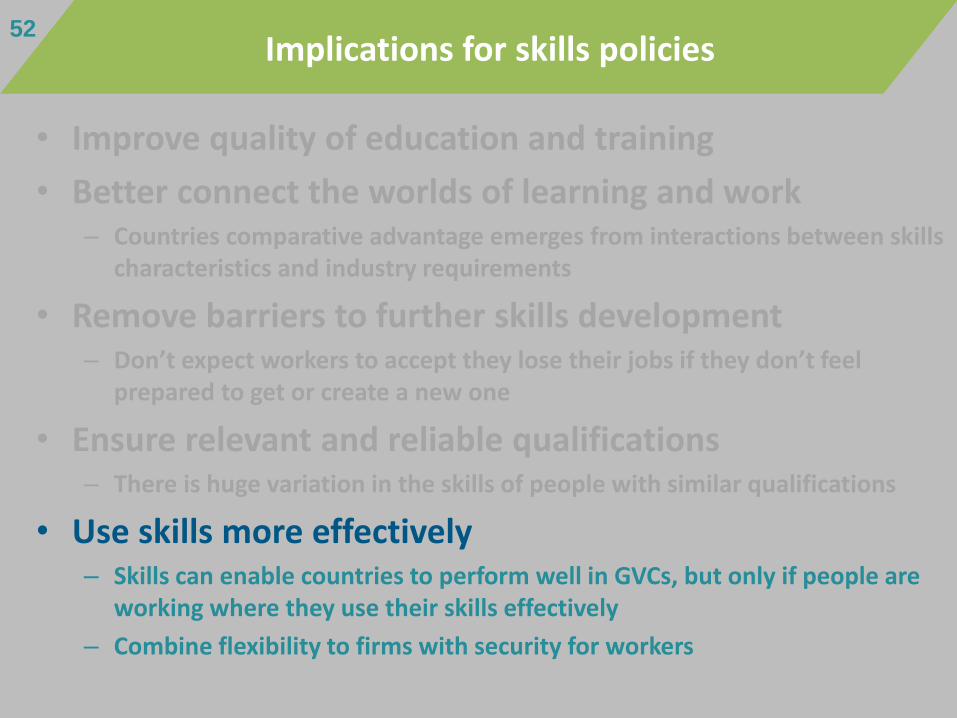
• Improve quality of education and training
• Better connect the worlds of learning and work– Countries comparative advantage emerges from interactions between skills
characteristics and industry requirements
• Remove barriers to further skills development– Don’t expect workers to accept they lose their jobs if they don’t feel
prepared to get or create a new one
• Ensure relevant and reliable qualifications– There is huge variation in the skills of people with similar qualifications
• Use skills more effectively– Skills can enable countries to perform well in GVCs, but only if people are
working where they use their skills effectively
– Combine flexibility to firms with security for workers
52Implications for skills policies
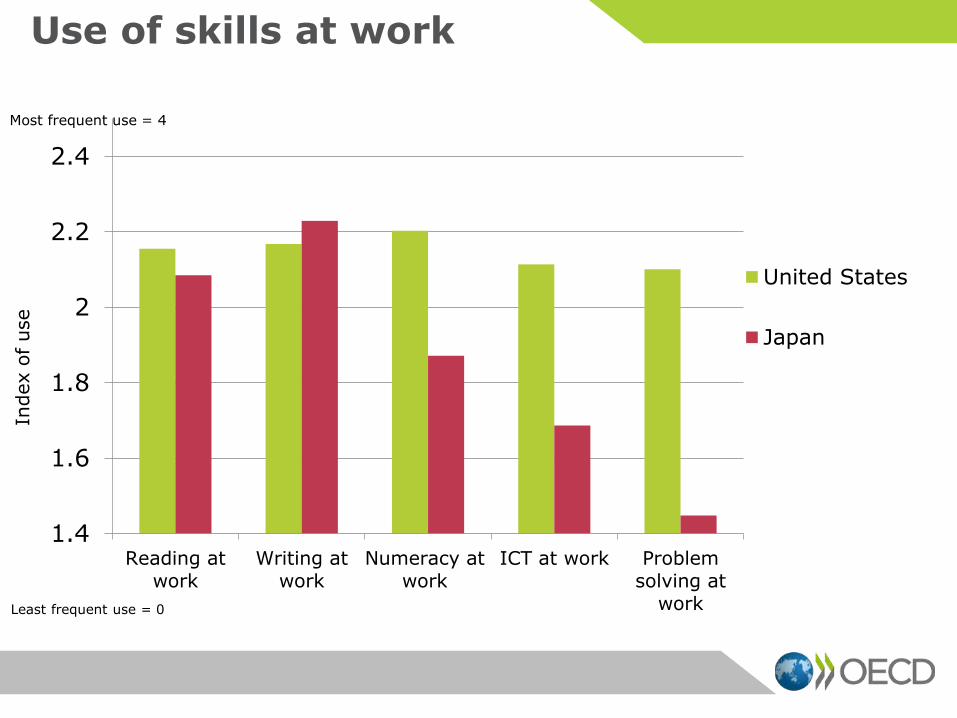
Use of skills at work
1.4
1.6
1.8
2
2.2
2.4
Reading atwork
Writing atwork
Numeracy atwork
ICT at work Problemsolving at
work
United States
Japan
Most frequent use = 4
Least frequent use = 0
Index o
f use
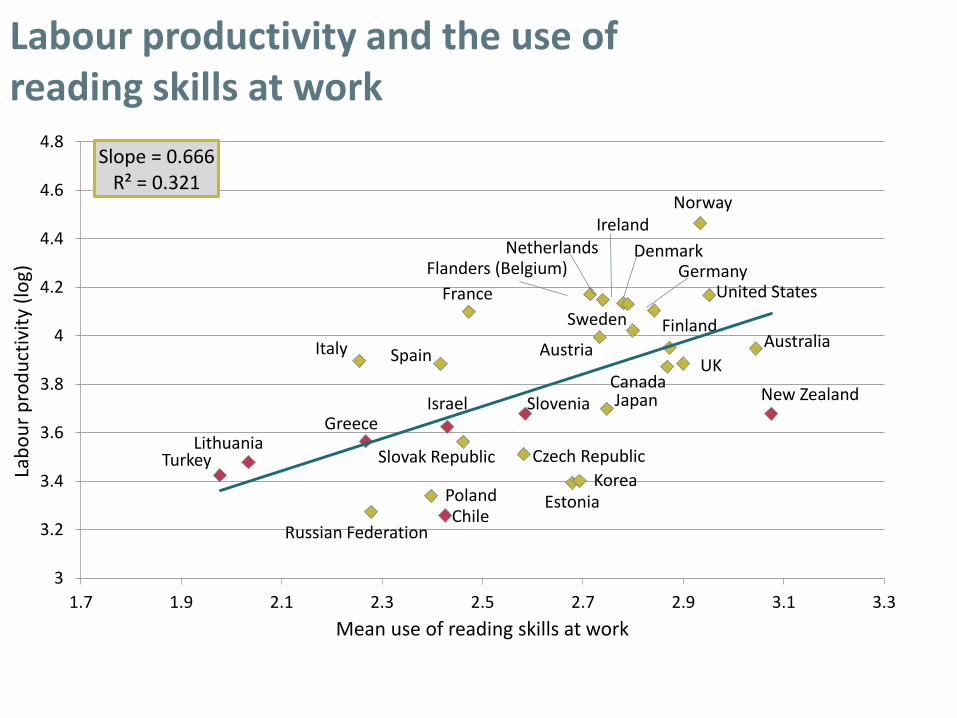
Labour productivity and the use of reading skills at work
AustraliaAustria
Canada
Chile
Czech Republic
Denmark
Estonia
Finland
Flanders (Belgium)
FranceGermany
Greece
Ireland
Israel
Italy
Japan
Korea
Lithuania
Netherlands
New Zealand
Norway
Poland
Russian Federation
Slovak Republic
Slovenia
Spain
Sweden
Turkey
UK
United States
Slope = 0.666R² = 0.321
3
3.2
3.4
3.6
3.8
4
4.2
4.4
4.6
4.8
1.7 1.9 2.1 2.3 2.5 2.7 2.9 3.1 3.3
Lab
ou
r p
rod
uct
ivit
y (l
og)
Mean use of reading skills at work
2.0
2.5
3.0
3.5
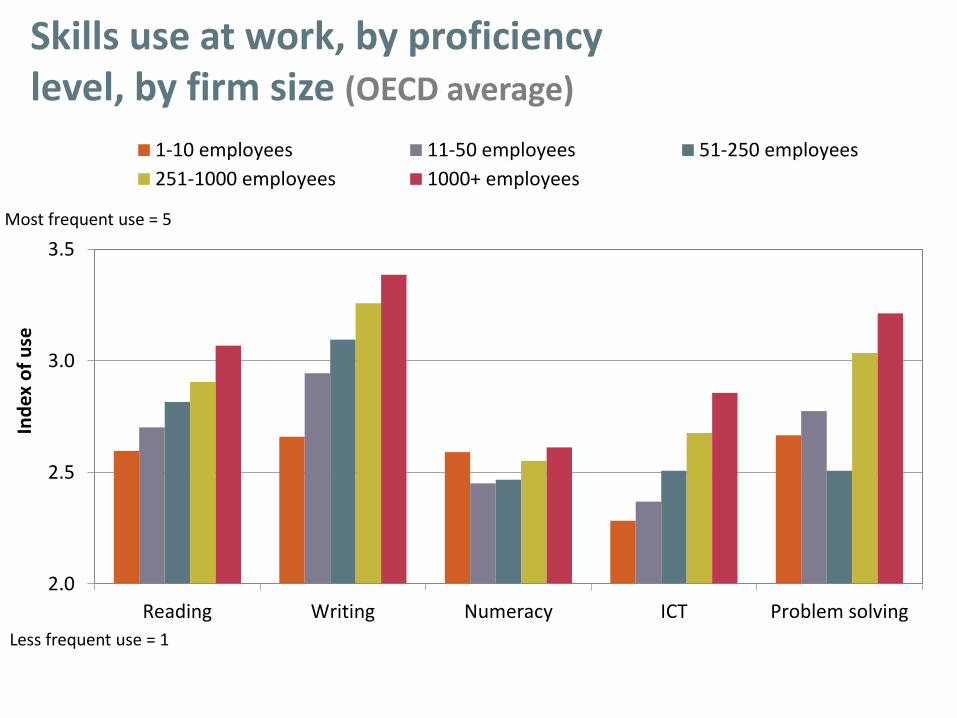
Reading Writing Numeracy ICT Problem solving
Ind
ex o
f u
se
1-10 employees 11-50 employees 51-250 employees
251-1000 employees 1000+ employees
Skills use at work, by proficiency level, by firm size (OECD average)
Most frequent use = 5
Less frequent use = 1
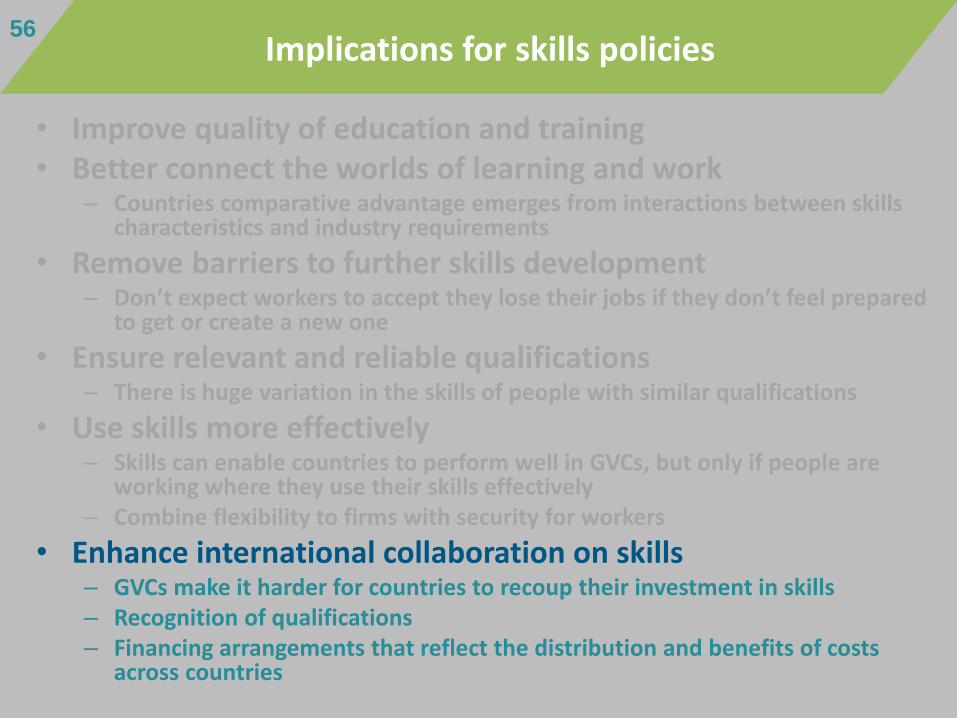
• Improve quality of education and training• Better connect the worlds of learning and work
– Countries comparative advantage emerges from interactions between skills characteristics and industry requirements
• Remove barriers to further skills development– Don’t expect workers to accept they lose their jobs if they don’t feel prepared
to get or create a new one
• Ensure relevant and reliable qualifications– There is huge variation in the skills of people with similar qualifications
• Use skills more effectively– Skills can enable countries to perform well in GVCs, but only if people are
working where they use their skills effectively– Combine flexibility to firms with security for workers
• Enhance international collaboration on skills– GVCs make it harder for countries to recoup their investment in skills– Recognition of qualifications– Financing arrangements that reflect the distribution and benefits of costs
across countries
56Implications for skills policies

Implications for education and training policies
Policy effort has to go beyond education and training policies
57
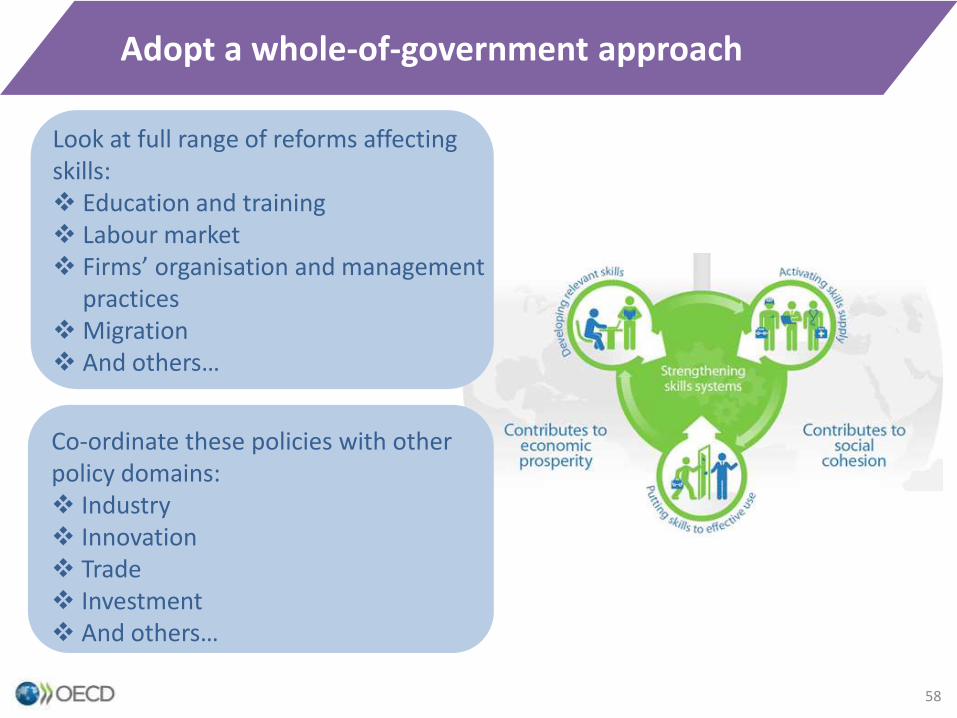
Adopt a whole-of-government approach
58
Co-ordinate these policies with other policy domains: Industry Innovation Trade Investment And others…
Look at full range of reforms affecting skills: Education and training Labour market Firms’ organisation and management
practices Migration And others…
59
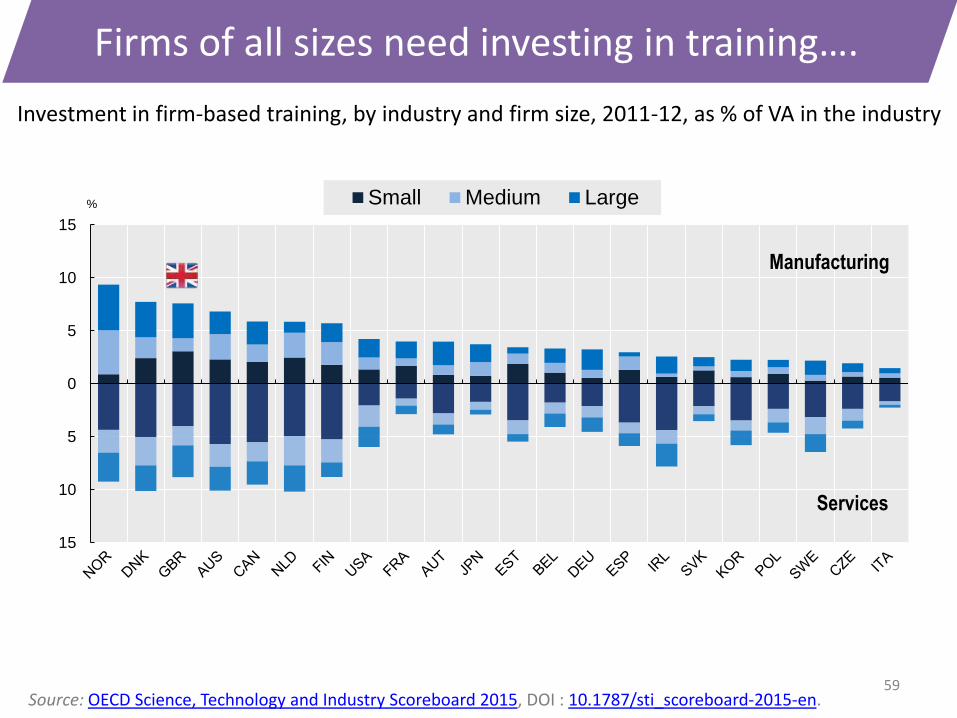
Firms of all sizes need investing in training….
15
10
5
0
5
10
15
% Small Medium Large
Manufacturing
Services
Investment in firm-based training, by industry and firm size, 2011-12, as % of VA in the industry
Source: OECD Science, Technology and Industry Scoreboard 2015, DOI : 10.1787/sti_scoreboard-2015-en.
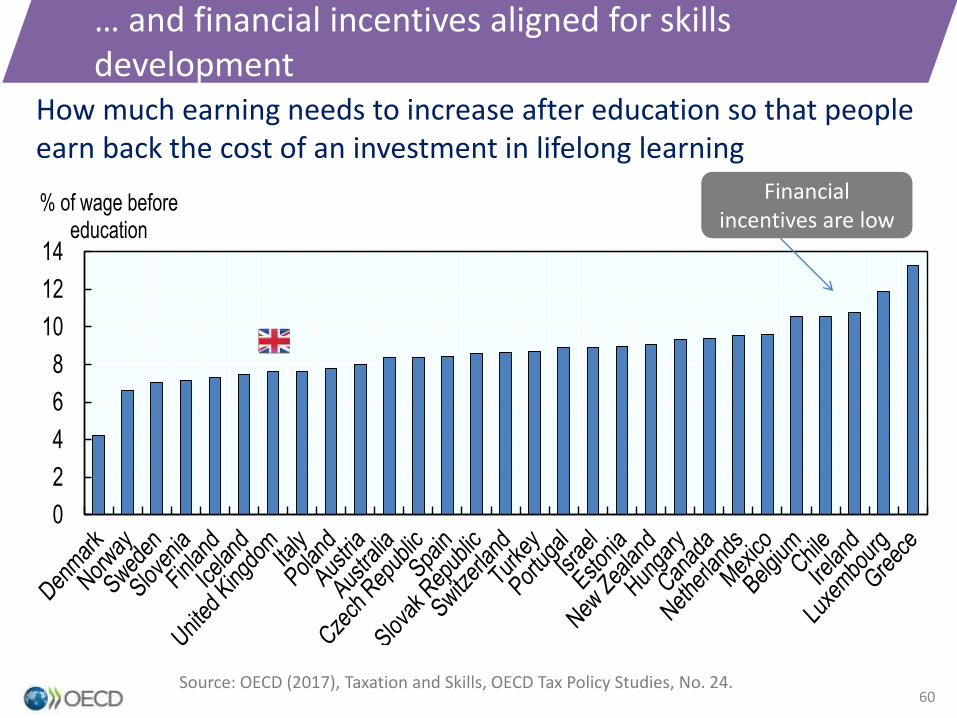
… and financial incentives aligned for skills development
0
2
4
6
8
10
12
14
% of wage before education
How much earning needs to increase after education so that people earn back the cost of an investment in lifelong learning
Source: OECD (2017), Taxation and Skills, OECD Tax Policy Studies, No. 24.
Financial incentives are low
60
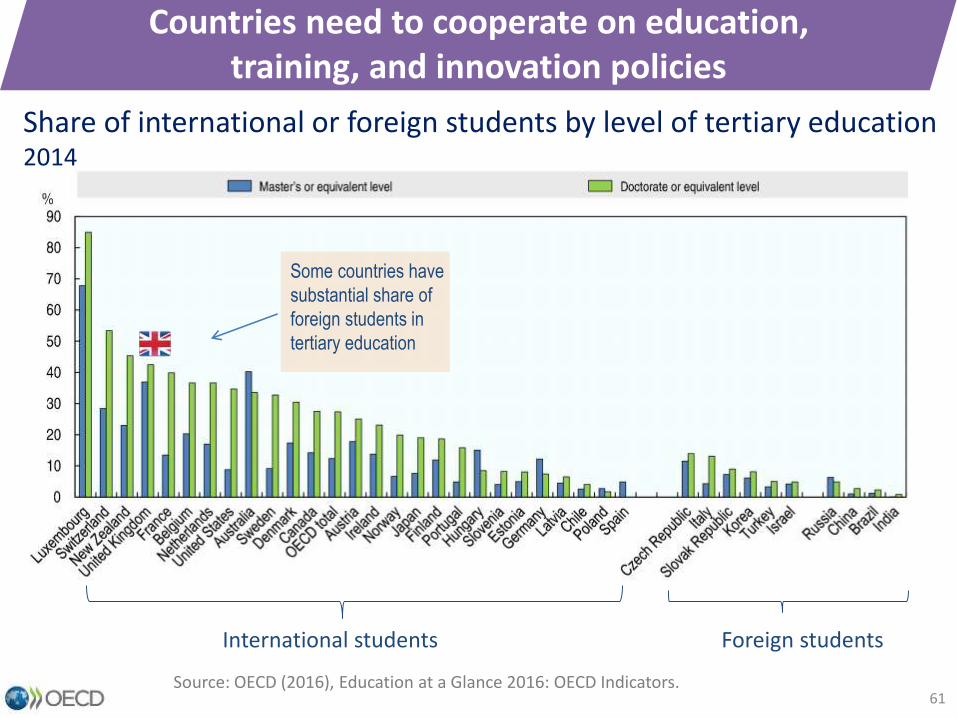
Countries need to cooperate on education, training, and innovation policies
Share of international or foreign students by level of tertiary education 2014
International students Foreign students
Some countries have
substantial share of
foreign students in
tertiary education
Source: OECD (2016), Education at a Glance 2016: OECD Indicators.61
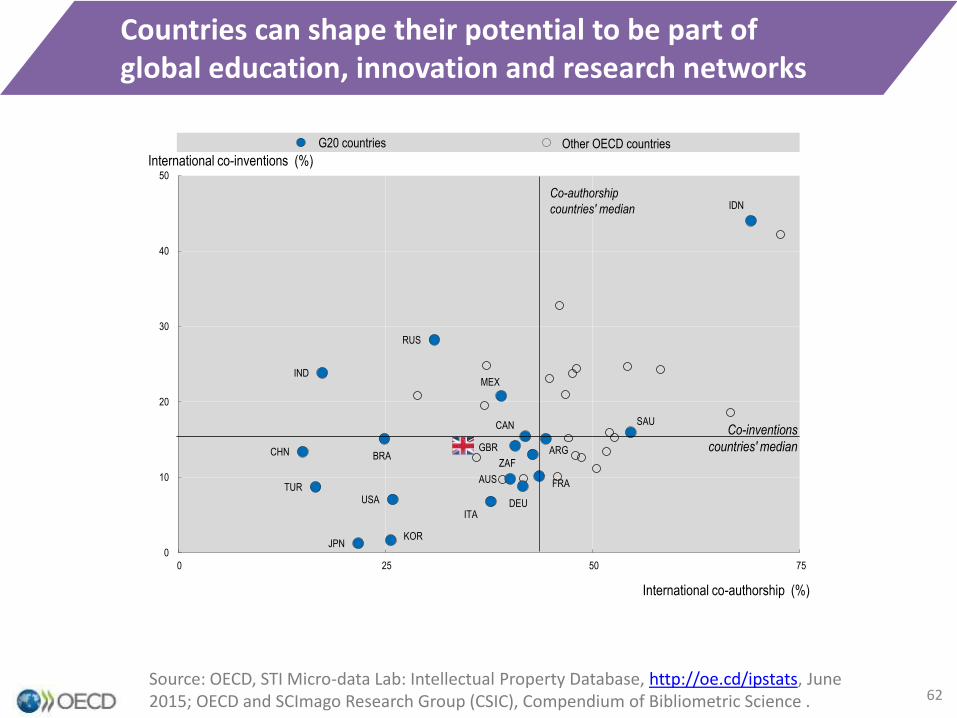
Countries can shape their potential to be part of global education, innovation and research networks
Source: OECD, STI Micro-data Lab: Intellectual Property Database, http://oe.cd/ipstats, June 2015; OECD and SCImago Research Group (CSIC), Compendium of Bibliometric Science . 62
ARG
AUS
BRA
CAN
CHN
FRA
DEU
IND
IDN
ITA
JPNKOR
MEX
RUS
SAU
ZAF
TUR
GBR
USA
0
10
20
30
40
50
0 25 50 75
International co-inventions (%)
International co-authorship (%)
G20 countries Other OECD countries
Co-inventions
countries' median
Co-authorship
countries' median
Implications for education and training policies
Implications for: Education and training policies
63
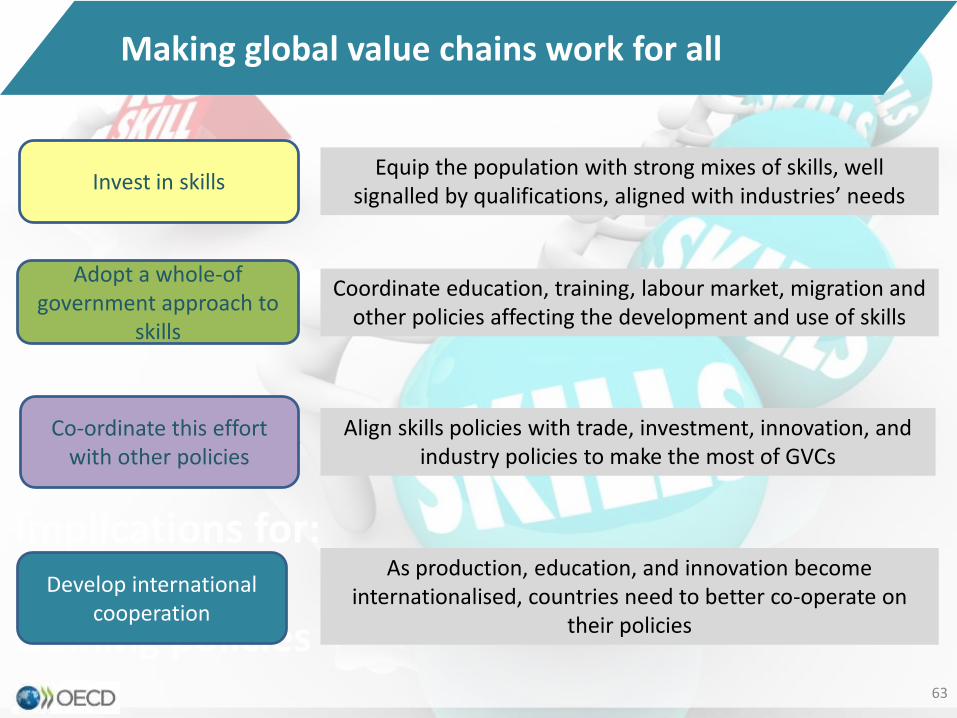
Making global value chains work for all
Invest in skills
Adopt a whole-of government approach to
skills
Co-ordinate this effort with other policies
Develop international cooperation
Equip the population with strong mixes of skills, well signalled by qualifications, aligned with industries’ needs
Coordinate education, training, labour market, migration and other policies affecting the development and use of skills
Align skills policies with trade, investment, innovation, and industry policies to make the most of GVCs
As production, education, and innovation become internationalised, countries need to better co-operate on
their policies