1 public private partnerships in canadian healthcare a case - OECD
Upload
lucia-hildebrandCategory
view
219download
3
OECD PresentationResources and Transfer Pricing: A Canadian PerspectiveSan Jose31 March – 4 April 2014

2
Overview
Transfer pricing and resource economics
Audit considerations
The Canadian resource tax environment
Case studies
• Commodity marketing transactions
• Business restructures and expansion
• Intangibles in the mining sector
3
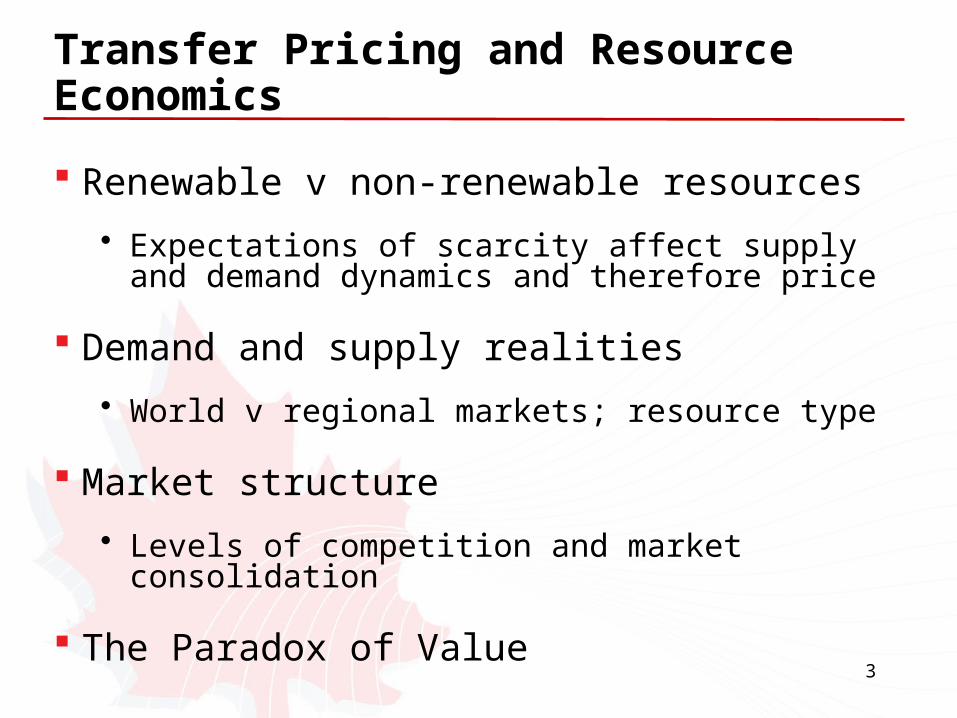
Transfer Pricing and Resource Economics
Renewable v non-renewable resources
• Expectations of scarcity affect supply and demand dynamics and therefore price
Demand and supply realities
• World v regional markets; resource type
Market structure
• Levels of competition and market consolidation
The Paradox of Value

4
Consideration for Extractive Industries
Facts and circumstances
• All mines are unique – geography; risk; ore quality
Capital intensity
• Significant sunk cost investment required
Continued investment
• Need for continual, often significant, injections of capital over life of project
5
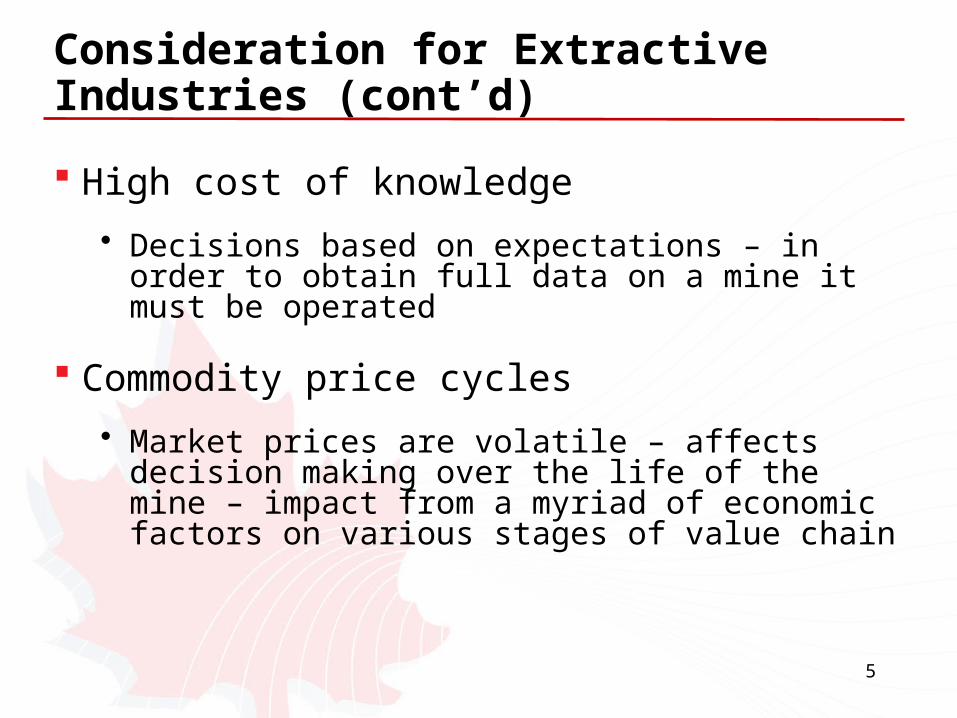
Consideration for Extractive Industries (cont’d)
High cost of knowledge
• Decisions based on expectations – in order to obtain full data on a mine it must be operated
Commodity price cycles
• Market prices are volatile – affects decision making over the life of the mine – impact from a myriad of economic factors on various stages of value chain

6
Consideration for Extractive Industries (cont’d)
How do such factors affect the market, investment decisions, inter-company pricing and taxation?

7
Mineral Extraction: Stages and Functions
Exploration and
Feasibility
Exploration:- reconnaisance; locate mineral anomalies- discovery, samplingFeasibility:- decision about economic fesability of mining
Planning:- mine planning- environmental/social planning- closure plan- environmental assessment- evironmental and other permitsConstruction:- clearing, stripping, blasting, infrastructure
- ore extraction- crushing, grinding, concentrating- waste rock and tailings management- wastewater management- progressive reclamation
- site clean- upl reclamaton;rehabilitation- maintenance; environemtnal monitoring
Planning and
Constructi
Operations
Closure

8
Price Determination
In the short-run, price of an intermediate natural resource is a function of the price of the final product
Price differences exist between stages of extraction, processing and distribution
For certain resources market prices exist for the intermediate product – oil quoted as $ / barrel
Crucial to understate stage of pricing in the value chain
• Microeconomic and macroeconomic, endogenous and exogenous, factors impact expected market pricing
9
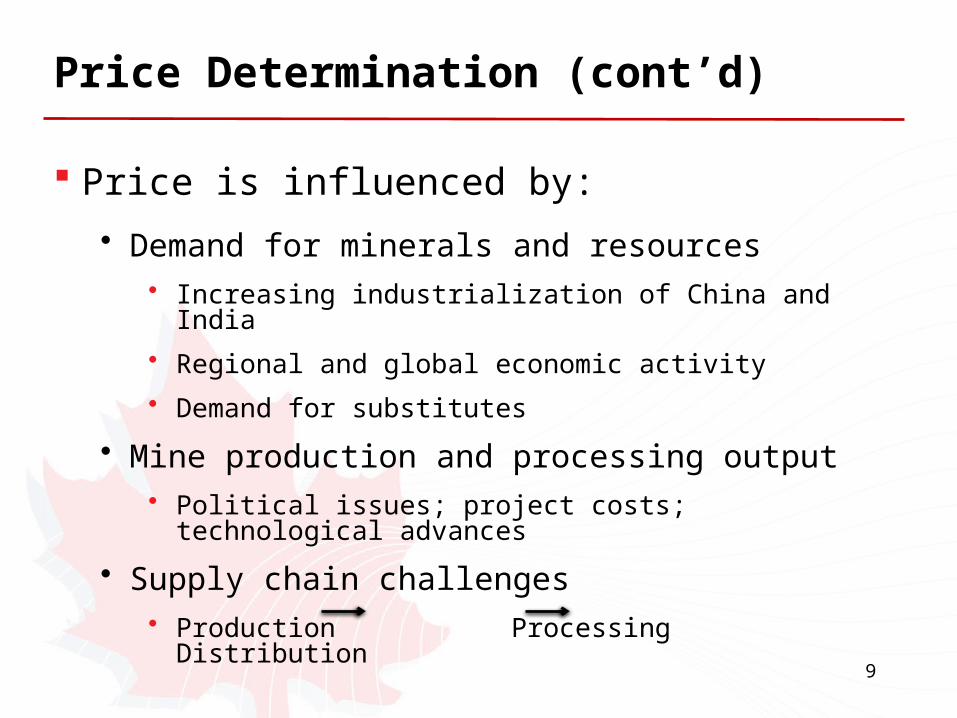
Price Determination (cont’d)
Price is influenced by:
• Demand for minerals and resources• Increasing industrialization of China and India
• Regional and global economic activity
• Demand for substitutes
• Mine production and processing output• Political issues; project costs; technological advances
• Supply chain challenges• Production Processing Distribution

10
Source of Price Changes
Final product price fluctuations
The price of inputs remain unchanged (inelastic)
Cost of labor and industrial inputs
Transportation costs – may be affected by market changes
Distribution and marketing costs
Technology and machinery - efficiency and availability
11
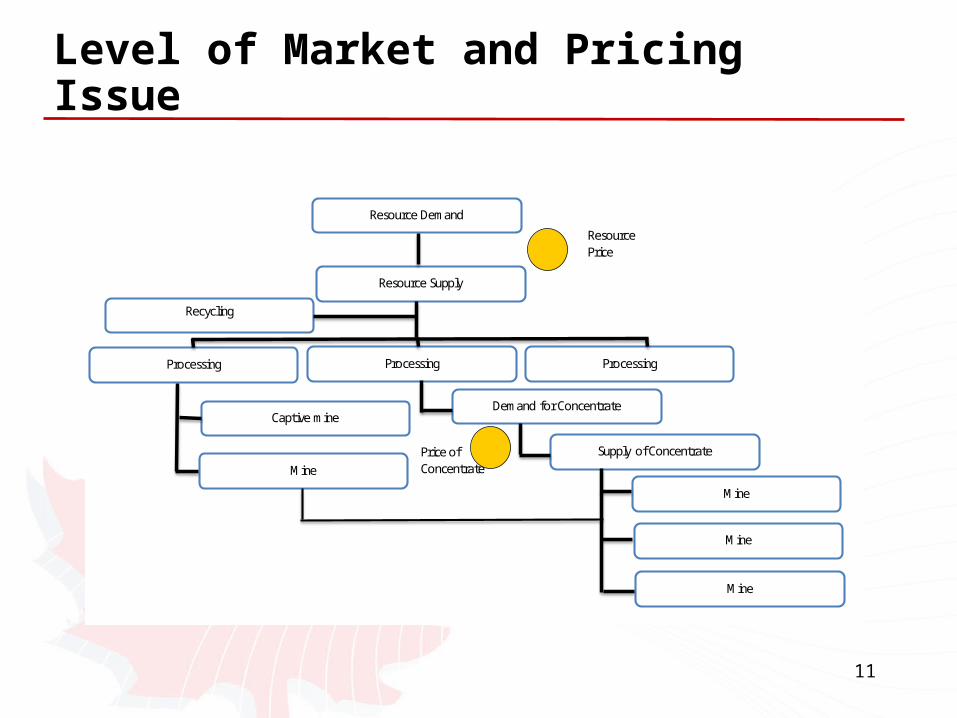
Level of Market and Pricing Issue
ResourcePrice
Price ofConcentrate
Mine
Mine
Mine
Supply of Concentrate
Resource Demand
Recycling
Processing
Mine
Captive mine
Processing Processing
Demand for Concentrate
Resource Supply

12
Level of Market and Price Issue (cont’d)
Identify and understand potential difference in price at various stages of the value chain
Stage of value chain impacts:
• Function, asset and risk contribution
• Comparability
• Market prices and benchmarking
Look to market for reasonable arm’s length pricing and transaction models
13
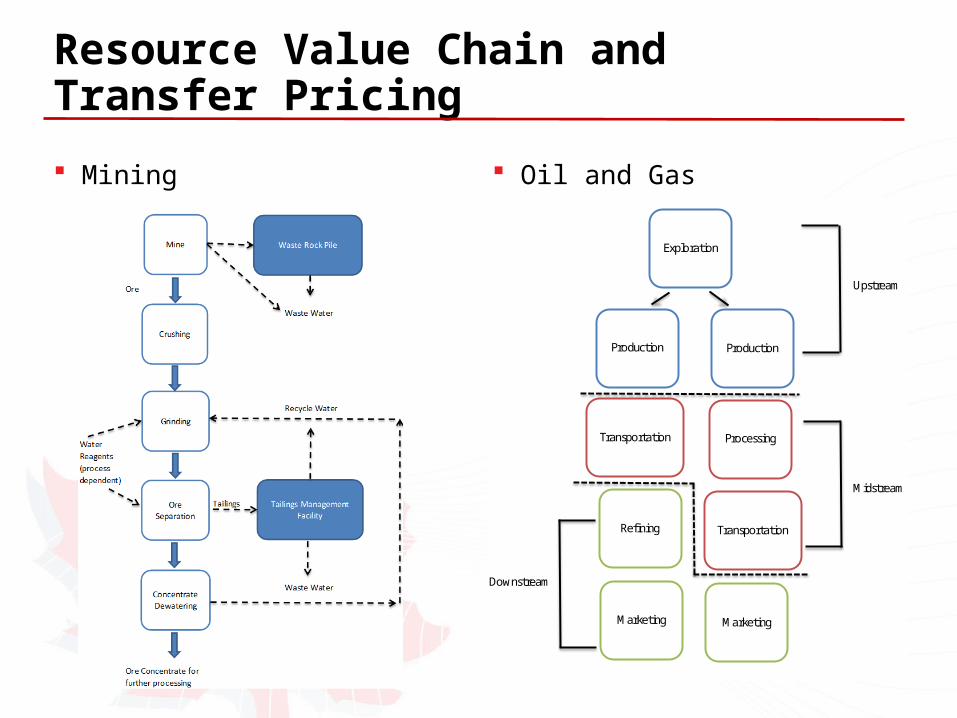
Resource Value Chain and Transfer Pricing
Mining Oil and Gas
Upstream
Midstream
Downstream
Exploration
ProductionProduction
Transportation Processing
MarketingMarketing
Refining Transportation

14
Economic Rent
Typical v atypical returns – excess returns above normal levels
Economic rent as the returns realized after paying for all factors of production, including funds committed to the project
Not uncommon for resource sectors to accrue economic rent
• Commodity boom – periods of ‘excessive’ returns
15
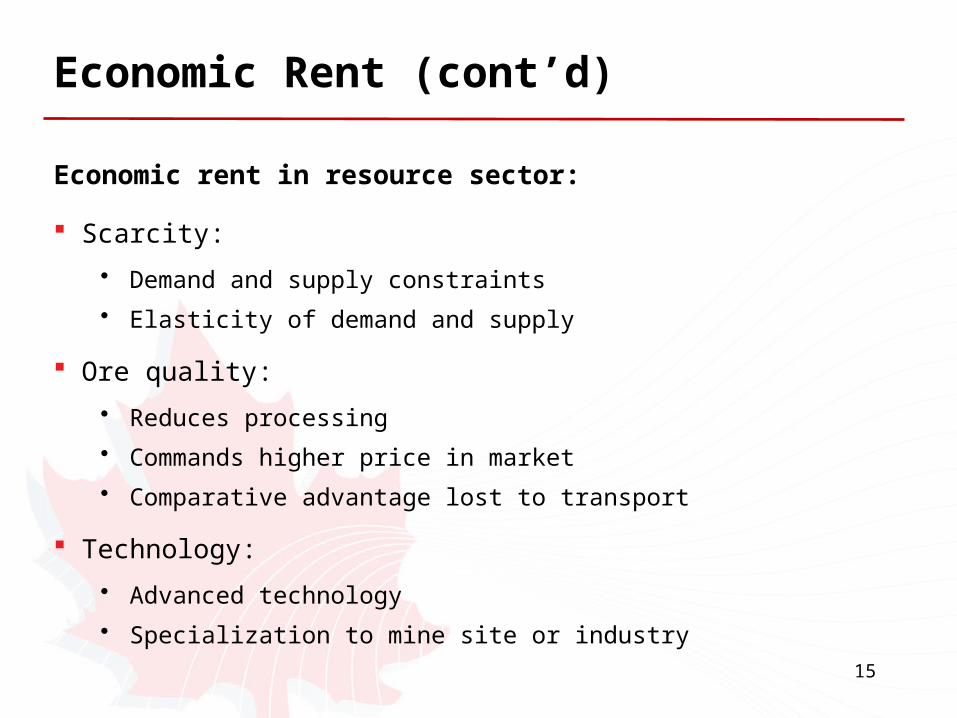
Economic Rent (cont’d)
Economic rent in resource sector:
Scarcity:
• Demand and supply constraints
• Elasticity of demand and supply
Ore quality:
• Reduces processing
• Commands higher price in market
• Comparative advantage lost to transport
Technology:
• Advanced technology
• Specialization to mine site or industry

16
Example: Economic Rent from Scarcity
Low price
Turnover $80
Fresh extraction 20
Grinding costs 10
Development costs 18
Management fees 8
Marketing costs 5
Freight 9
Operating income 10
‘Normal’ earnings 30
Differential (20)
High price
Turnover $130
Fresh extraction 22
Grinding costs 10
Development costs 18
Management fees 8
Marketing costs 6
Freight 9
Operating income 57
‘Normal’ earnings 30
Differential 27
17
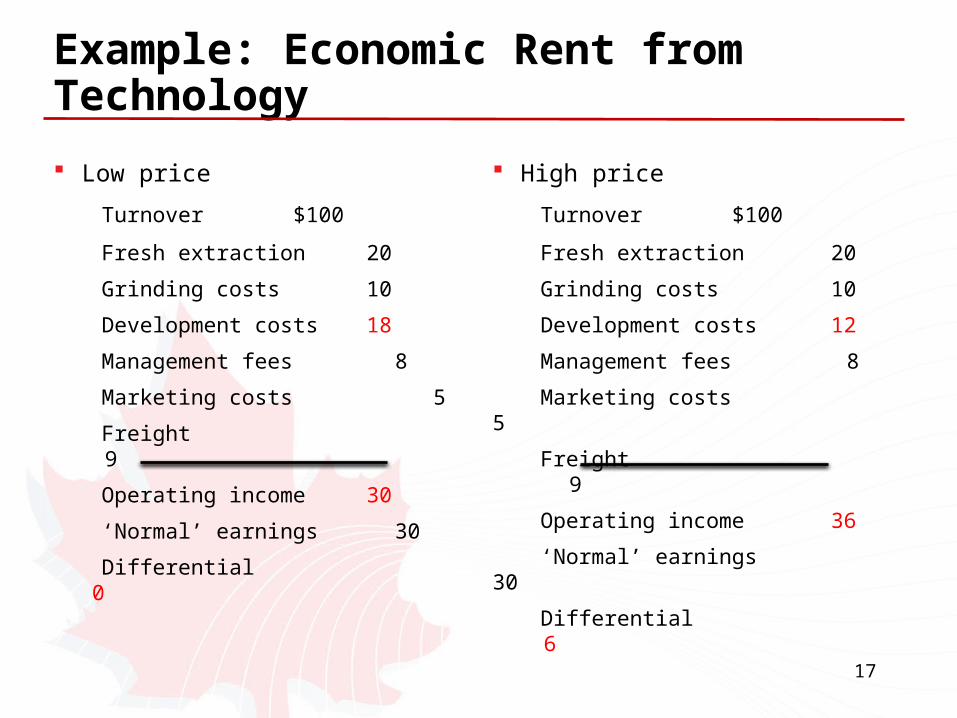
Example: Economic Rent from Technology
Low price
Turnover $100
Fresh extraction 20
Grinding costs 10
Development costs 18
Management fees 8
Marketing costs 5
Freight 9
Operating income 30
‘Normal’ earnings 30
Differential 0
High price
Turnover $100
Fresh extraction 20
Grinding costs 10
Development costs 12
Management fees 8
Marketing costs 5
Freight 9
Operating income 36
‘Normal’ earnings 30
Differential 6
18
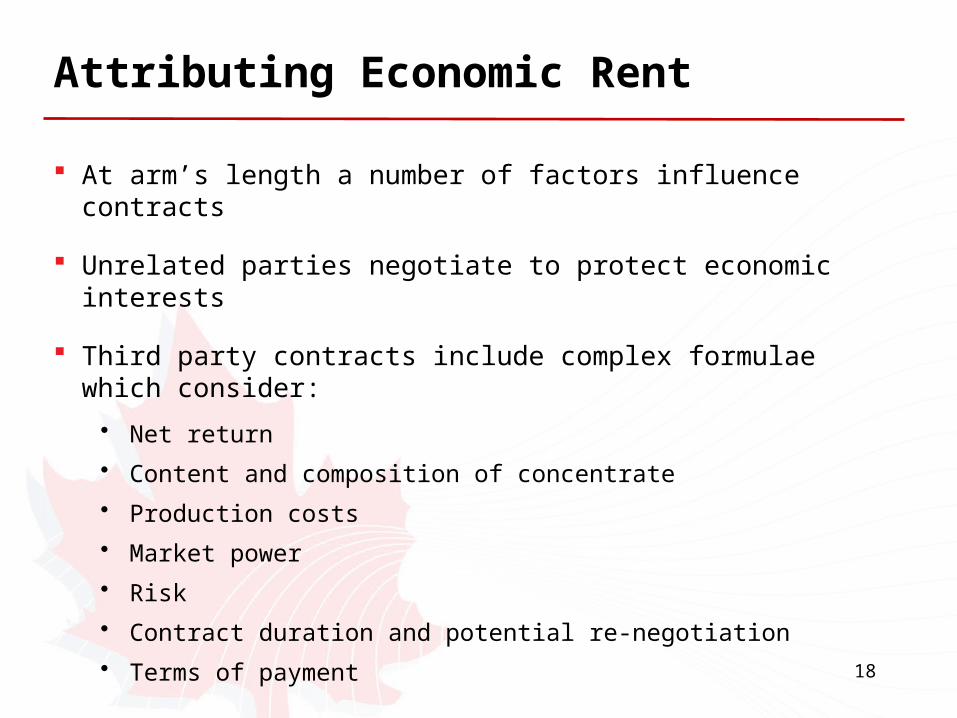
Attributing Economic Rent
At arm’s length a number of factors influence contracts
Unrelated parties negotiate to protect economic interests
Third party contracts include complex formulae which consider:
• Net return
• Content and composition of concentrate
• Production costs
• Market power
• Risk
• Contract duration and potential re-negotiation
• Terms of payment

19
Arm’s Length Contracts
Recall: Nature of contract is dependent on resource and industry
1. Price paid:Zinc: $1.02/lb x 2 204.6 = $2 250 /MT (average LME spot price)Silver: $17.00 / oz
2. Expected value of resource realized by processingZinc: 55% x 85% = 46.75% x $2 250 = $1 051.88Silver: (5oz – 3oz) x 70% x $17.00 = 23.80 Total Payable = $1 075.68
3. Processing deductionsProcessing Costs: Base fee = $275.00Adjust for price change: $2 250 – 2 500 = 250 x 4C/1$ = $ 10.00Penalty for Fe 8.5% - 8% = 0.5% x $1.50 $/1% = (0.75)Penalty for MgO 0.5% - 0.35% = .015% x 2.00 $/0.1% = (3.00)Total deductions = (268.75)
Paid to mine = $ 806.93Percentage realized by mine = 75%

20
Arm’s Length Contract (cont’d)
Terms are dependent on mineral/resource and bargaining power of mine and processor
Key elements
• Expected prices – primary and secondary metals
• Expected production output – 55% and 85%
• ‘Penalties’ for impurities
• Price adjustments accounting for additional metals and changes in market price
Comparable Uncontrolled Transaction (CUT)

21
Audit Considerations
Types of transactions:
• Resource sales – final product and/or concentrate
• Financial transactions – debt; equity; derivatives
• Equipment transfer – sales and leases
• Intangibles – creation and transfer of know-how
Nature of resource
• Understanding demand and supply dynamics; levels of competition and regulation
Industry and market value chain
• Note: Oil and gas markets have changed significantly since the 1980s

22
Audit Considerations (cont’d)
Pricing benchmarks
• Market indices and posted rates
• Comparability at concentrate level as a significant challenge
Mining project life cycle
• Differences in cost, market price over time
Functional roles and capacity of related parties
• With consideration of the assets used and the risks expected by the market

23
Canadian Resource Tax Environment
Income taxes
• Federal and provincial levels
Mining taxes
• Provincial level – including royalties
Three distinct stages:
• Exploration and development
• Commercial production
• Processing

24
Canadian Resources
25
Provincial Resource Royalties
Provinces and territories administer royalties
Royalty rates and calculations differ across regions and mineral/resource
Royalties are intended to be non-distortionary
• Taxes on economic rents do not affect investment and operational decisions
Link between various levels and form of taxation
• Can help identify transfer pricing issue and Taxpayer motivation

26
Provincial Resource Royalties (cont’d)
Example: Saskatchewan Resource Royalty
Base payment:
Net base payment = Gross base payment – [Crown royalties + Freehold royalties + Saskatchewan resource credit – Excess deductions] – Tax credits (prior year)
Profit Tax:
Net profit tax = Gross profit tax – Base payment credits – Tax credits
27
‘Half-time’ Thoughts
Understanding the resource market
• World vs. regional markets
Economic factors unique to resource industry and mining company transactions
The resource value chain and system profits
Identifying the stage of the transfer pricing issue: extraction, processing, distribution
Economic rents
Types and form of taxes typically applied to resources
28
Case Studies
Commodity marketing (1) – Related marketer
Commodity marketing (2) – Functional deficiency
Commodity marketing (3) – Financial transactions
Business restructuring / expansion
Mining and intangibles

29
Commodity Marketing - General
North American oil and gas industry as wonderfully transparent source of arm’s length terms, conditions and pricing
• Deregulated and highly competitive
Marketers exist to facilitate trade
• Interested in underlying value of resource
• Paid on a per volume basis: $X / BTU or / ST
• Marketers enter into financial transactions – speculative and hedges
• Various types of marketers, depending on functional and risk capacity – impacts value and pricing
30
Commodity Marketing – General (cont’d)
Arm’s length contracts historically based on netback pricing terms and conditions – resale price
Inter-company commodity marketing
• Centralization of functions and risks
• Emphasis on Parent company’s control and intangibles
• Location of activity v signed contract
• What is/are value added activity?
Ultimately transactions occur given demand for the resource in question

31
Case Study 1: Commodity Marketing – Related Party Marketer
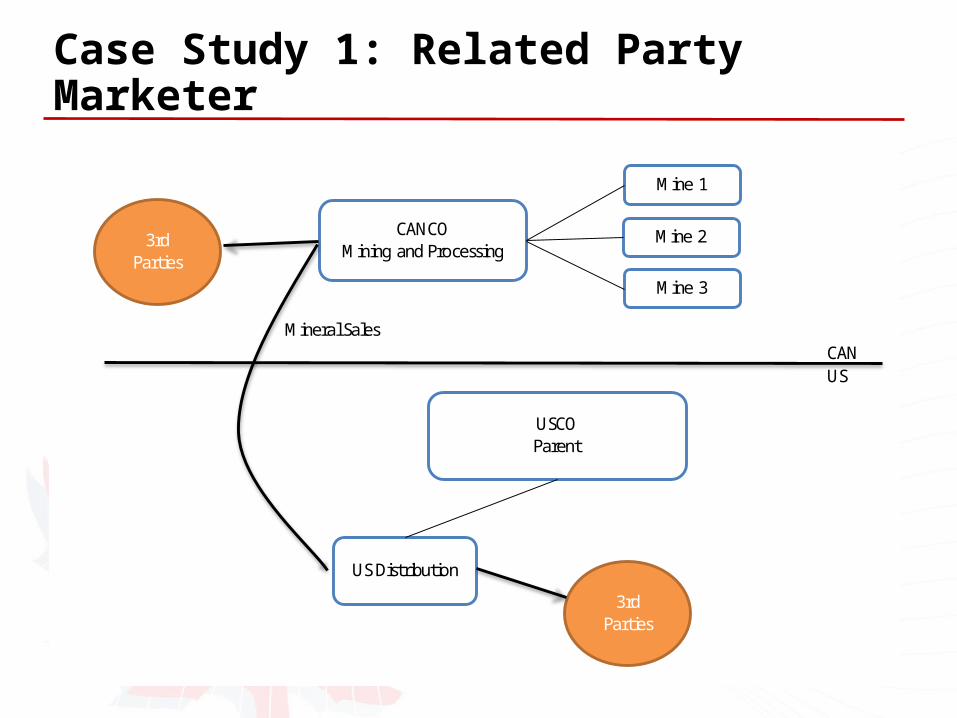
Facts:
• US Parent
• USCO distributes Canadian Resource A in US
• CANCO is a mining entity
• Three mines in Canada - oligopoly
• CANCO distributes Resource B in Canada for USCO
• Canadian operations account for more than 30% of world production of Resource A
32
Case Study 1: Related Party Marketer
Mineral SalesCANUS
CANCOMining and Processing
USCOParent
US Distribution
Mine 2
Mine 3
Mine 1
3rdParties
3rdParties

33
Case Study 1: Related Party Marketer
Taxpayer model
• Fixed commission fee based on netback pricing (NBP)
• NBP = End Selling Price – Marketing Fee – Costs (agreed to in contract negotiation)
• Essentially resale price:
Jun-01 Dec-01 Dec-02
Third party freight and logistical 3.35 3.34 3.43
SG&A 7.65 7.54 6.56
Total Cost per ST 11 10.88 9.99
Commission Rate 21.09 18.50 18.50
Mark-up 10.09 7.77 8.51
Percentage return 91.70% 85.20% 70.00%
34
Case Study 1: Related Party Marketer
Taxpayer Rationale:
• “The ultimate discount...is based on the principle that the gross margin to be earned...must cover operating costs and earn a reasonable return for the functions.” (CDocs)
Did not use arm’s length distribution fee comparables
Provided little economic rationale or analysis of fees
Commission fees selected by the Taxpayer resulted in a profit split of 55 / 45 in favour of the mine (CANCO)
The Taxpayer used a Profit Split comparability analysis to verify the commission fees – assumed the answer
35
Case Study 1: Related Party Marketer
The CRA challenged the validity of the fees and the usefulness of the profit split analysis given the differences in industry and commodity resource
The Taxpayer intimated that they would use the profit split analysis on a go-forward basis
The profit split was a ‘sanity’ check for the CRA – clearly the results were not arm’s length

36
Case Study 1: Related Party Marketer
Characterization:
• CANCO as producer/processor of Resource A
• USCO as a ‘routine’ commodity distributor
Taxpayer claimed USCO provided much more than distribution functions
• Supply and product management
• Integration of activity required application of profit split
37
Case Study 1: Related Party Marketer
‘Routine’ implying no significant intangibles
• Processes
• Technology
Taxpayer’s claim of non-routine or high integration counter to market data and realities
USCO carries same expectations and risks, and completes the same functions as comparables
Corporate reality v arm’s length expectations
38
Case Study 1: Related Party Marketer
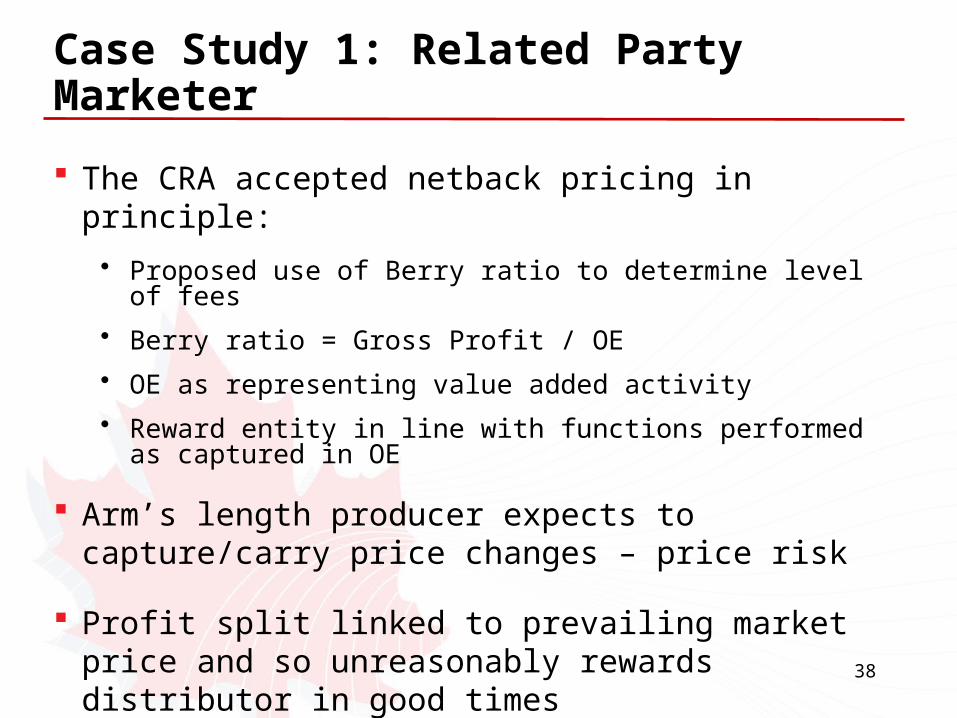
The CRA accepted netback pricing in principle:
• Proposed use of Berry ratio to determine level of fees
• Berry ratio = Gross Profit / OE
• OE as representing value added activity
• Reward entity in line with functions performed as captured in OE
Arm’s length producer expects to capture/carry price changes – price risk
Profit split linked to prevailing market price and so unreasonably rewards distributor in good times
• An issue of Base Erosion (BEPS) – think of royalty calculation
39
Case Study 1: Related Party Marketer
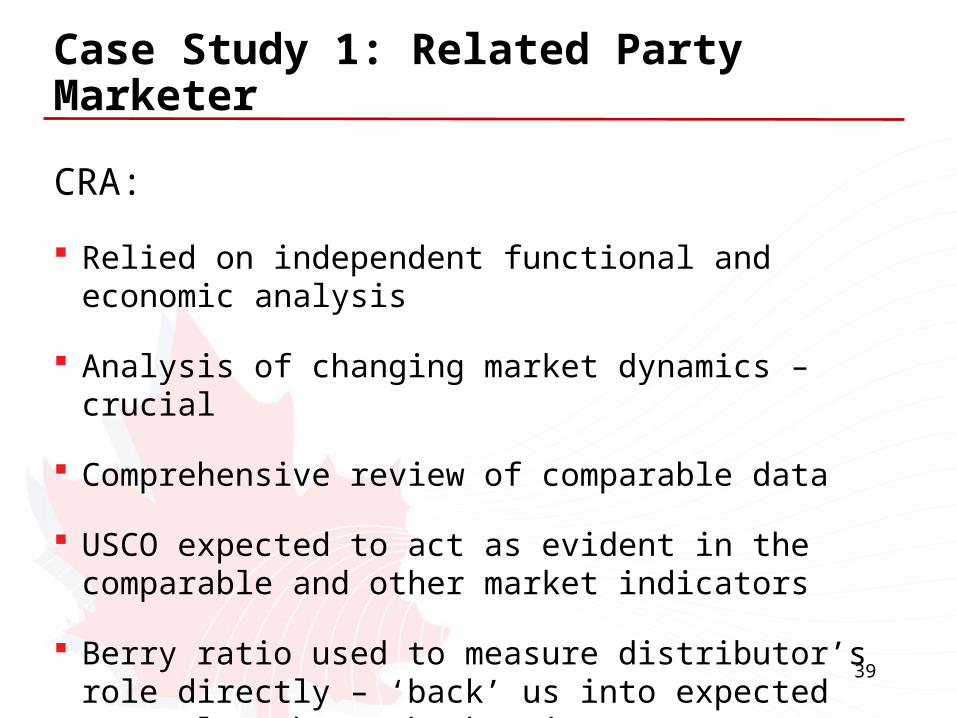
CRA:
Relied on independent functional and economic analysis
Analysis of changing market dynamics – crucial
Comprehensive review of comparable data
USCO expected to act as evident in the comparable and other market indicators
Berry ratio used to measure distributor’s role directly – ‘back’ us into expected arm’s length net back price
40
Case Study 1: Related Party Marketer
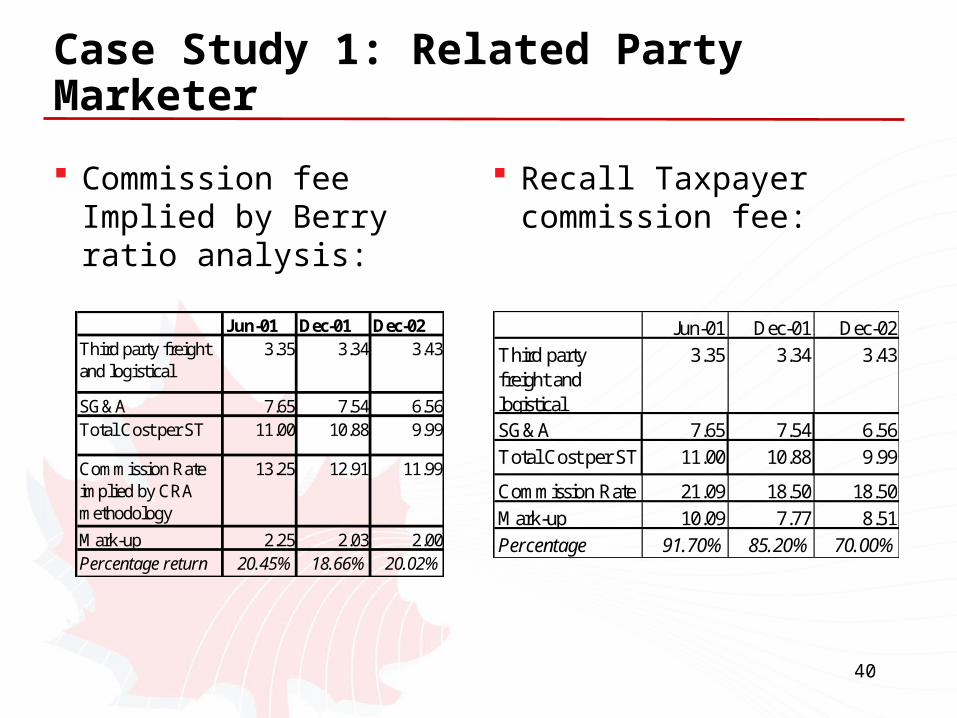
Commission fee Implied by Berry ratio analysis:
Recall Taxpayer commission fee:
Jun-01 Dec-01 Dec-02Third party freight and logistical
3.35 3.34 3.43
SG&A 7.65 7.54 6.56Total Cost per ST 11.00 10.88 9.99
Commission Rate implied by CRA methodology
13.25 12.91 11.99
Mark-up 2.25 2.03 2.00Percentage return 20.45% 18.66% 20.02%
Jun-01 Dec-01 Dec-02
Third party freight and logistical
3.35 3.34 3.43
SG&A 7.65 7.54 6.56
Total Cost per ST 11.00 10.88 9.99
Commission Rate 21.09 18.50 18.50
Mark-up 10.09 7.77 8.51
Percentage return
91.70% 85.20% 70.00%
41
Case Study 1: Related Party Marketer
Taxpayer argued ‘strategic management’ of Parent
Oligopolistic nature of industry
Assessment is under consideration in competent authority
Future years under an APA are also part of the negotiation process
Fingers crossed

42
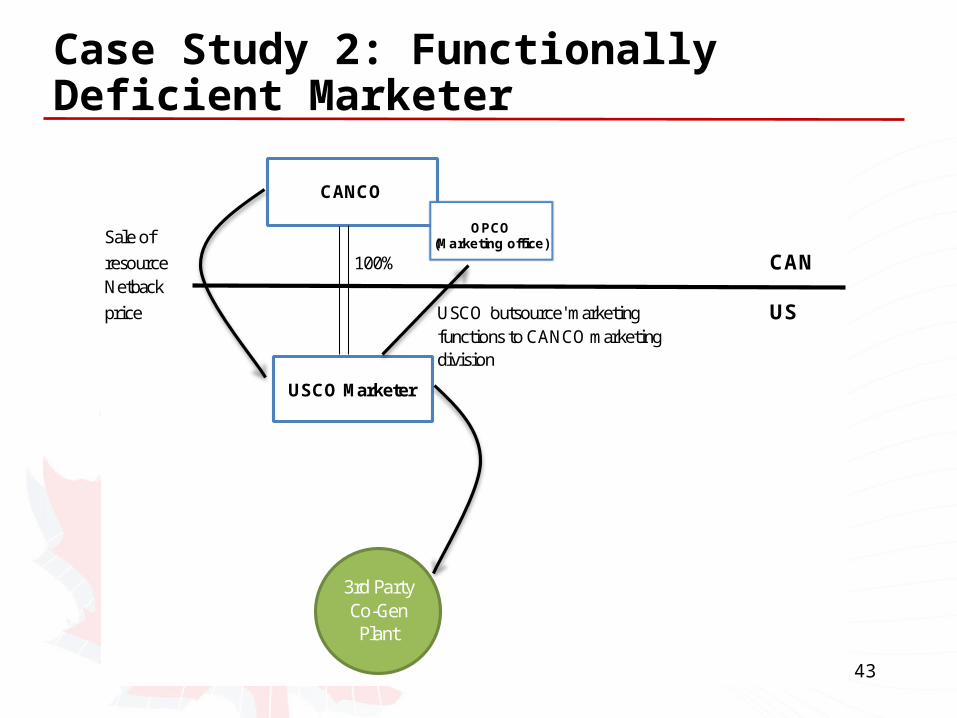
Case Study 2: Commodity Marketing – Functionally Deficient Marketer
Facts:
• Resource extracted in Canada
• Sell Resource into US market through USCO – transfer of ownership at border
• US marketing hub contracts with 3rd party end users throughout US
• US marketing hub has no employees or physical office
• Marketing is outsourced to division of CANCO
• Contracts are signed by US company
43
Case Study 2: Functionally Deficient Marketer
Sale of
resource 100% CANNetback
price USCO 'outsource' marketing USfunctions to CANCO marketingdivision
CANCO
USCO Marketer
OPCO(Marketing office)
3rd Party Co-Gen
Plant

44
Case Study 2: Functionally Deficient Marketer
Issues
• Transfer price of resource
• Transfer price for US ‘marketing’
CRA audit
• Completed functional analysis
• Industry review and analysis
Assessing positions considered
• Transfer pricing
• Permanent Establishment

45
Case Study 2: Functionally Deficient Marketer
Taxpayer model:
Provided market CUPs for net back price of resource
• Net Back Price = End Selling Price – Transportation – Marketing Fee
Outsource marketing functions to Canada – paid Canada its Cost
• Changed to Cost + 7.5% based on comparability analysis

46
Case Study 2: Functional Deficient Marketer
CRA position:
Verified marketing fee CUPs and transportation costs
• Accepted terms of sale of resource
Challenged remuneration of USCO for marketing functions
• US did not complete functions of marketer
• Assets were routine if valuable
• Marketing risks are mitigated by the netback pricing terms

47
Case Study 2: Functional Deficient Marketer
Considered two assessing positions
Permanent establishment
• Mind and management was clearly in Canada
Transfer pricing
• Did not accept ‘outsourcing’ model
• Marketing fee CUPs are the benchmark for Canada’s functional role
• Taxpayer’s representations for PE defence supported CRA transfer pricing model

48
Case Study 2: Functional Deficient Marketer
Taxpayer argued that US profits were attributable to three assets:
• Import license
• Transportation assets
• Sales contracts
CRA argued all three contracts were routine for this transaction and that Functions were the key determinant of profit
• Industry and Taxpayer documentation supported position
• Risks limited by the netback formula – essential for resource distribution transactions

49
Case Study 2: Functionally Deficient Marketer
Re-assessed Taxpayer based on transfer pricing legislation
Relied on third party contracts
• Unrelated marketing contracts
• Unrelated delivery and distribution contracts
Position was up-held in Competent Authority negotiations

50
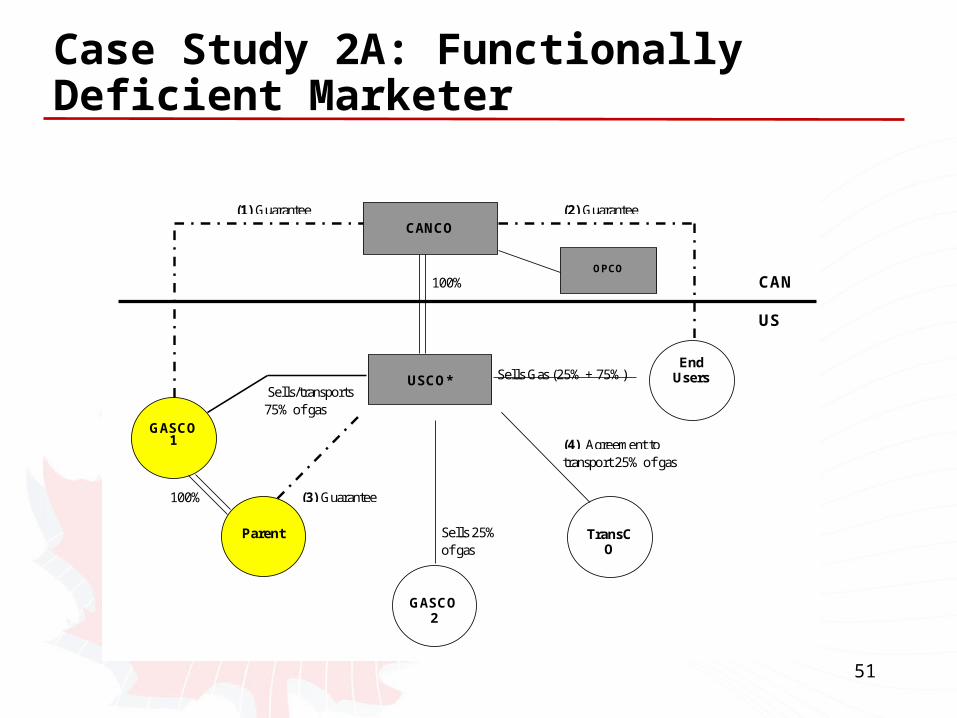
Case Study 2A: Functionally Deficient Marketer
Similar fact base as above
• Resource extracted in Canada
• Resource sold into US market through US marketing hub with no employees
• USCO ‘outsources’ marketing functions to CANCO
• US signed import license, transportation and sales contracts
Audit challenges
• Statue barred dates
• Incomplete functional analysis
• Limited Taxpayer documentation
51
Case Study 2A: Functionally Deficient Marketer
(1) Guarantee (2) Guarantee
100% CAN
US
Sells Gas (25% + 75%) Sells/transports 75% of gas
(4) Agreement totransport 25% of gas
100% (3) Guarantee
Sells 25% of gas
CANCO
USCO*
Parent
GASCO1
GASCO2
TransCO
End Users
OPCO

52
Case Study 2A: Functionally Deficient Marketer
Taxpayer position:
Reasonable to ‘outsource’ functions
Key profit drivers: right to deliver and sell gas
USCO exploited ‘arbitrage’ opportunities

53
Case Study 3: Functional Deficient Marketer
Relied on industry knowledge
Appealed to function, asset and risk profiles of related parties
• Functions as key determinant of the marketers profit
• Assets as non-contributory
• Risks as limited, but identifiable in US
Contracts
• Multiple performance guarantees – internal and external

54
Case Study 3: Functional Deficient Marketer
CRA analysis and position
Important fact difference – ability to exploit arbitrage opportunities
• Relies on functions – people on the ground
• However, does create risk in this transaction
• USCO had signed contracts – though guarantees were in place
Required to measure risk of USCO

55
Case Study 2A: Functionally Deficient Marketer
For any transaction to exist, rational parties must recognize value in the arrangement
• This is reinforced by the arrangement itself: consider why GasCo1 would not sell to lake and End User directly
Identified types of risks associated with the transaction and accorded each party a share of these risks
56
Case Study 2A: Functionally Deficient Marketer
Consider:
Two sources of gas: GasCo 1(75%) and CasCo 2 (25%)
Four types of risk:
• ¾ GasCo 1; ¼ GasCo 2
• Sales risk
• Purchase risk
• Transport risk
• Supply risk

57
Case Study 2A: Functionally Deficient Marketer
Appealing to the shares of risk determined by our analysis, we attributed the following to USCO:
Assume USCO/CANCO bear risk of supply:
• 1/16 of all risk = 6.25% of π
Assume supply risk bore by third parties:
• 1/12 of all risk = 8.33% of π
Quantum implied was supported by arm’s length contracts
58
Case Study 3: Commodity Marketing Financial Transactions
At arm’s length commodity marketers often enter into financial transactions
• Transportation optimization
• Arbitrage – speculative transactions
Generally resource owners seek to mitigate risk – only enter into hedge contracts
In related party context risk will be shifted
For the marketer, however, functions remain the key determinant of profit

59
Case Study 3: Commodity Marketing Financial Transactions
Sale of
resource 100% CANNetback
price USCO 'outsource' marketing USfunctions to CANCO marketing
division
The marketers 'trade' supply to reduce transport costs
Creates gains and losses
CANCO
USCO Marketer
OPCO(Marketing office)
3rd Party Marketer

60
Case Study 3: Commodity Marketing Financial Transactions
Issue:
• Transfer of risk
• Functional capacity
• Legal ownership – contracts
• Speculative transactions are ‘notional’ don’t require supply
Assessing positions:
• Pricing – profit splits: rely on arm’s length contracts
• Re-characterization: would parties enter into this transaction

61
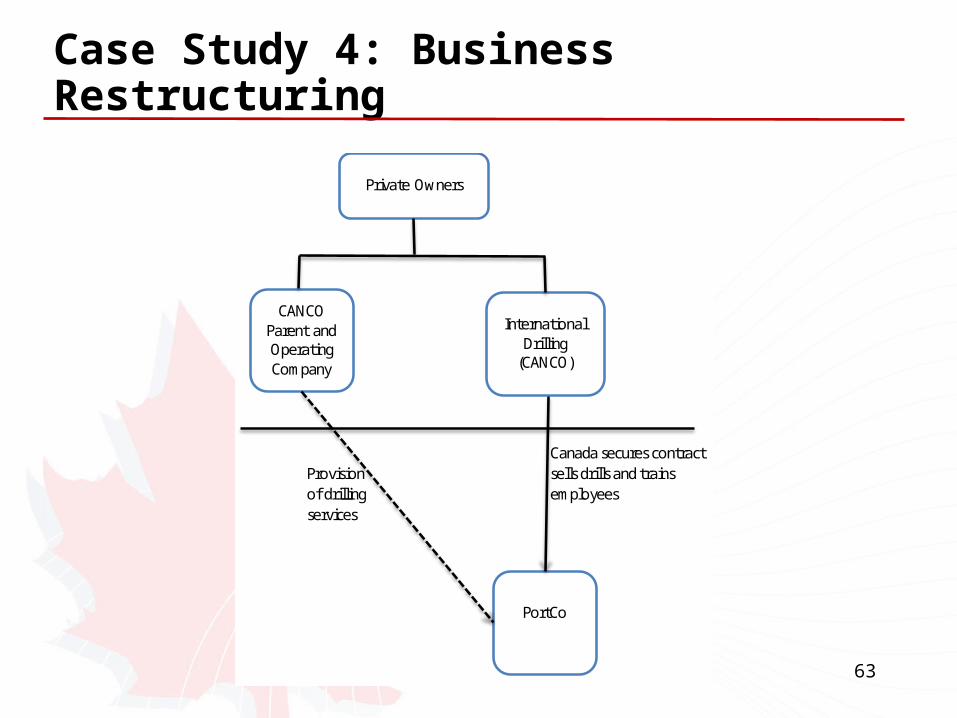
Case Study 4: Business Restructuring
Canadian drilling company
Secures drilling contract in Europe
Establishes European subsidiary
Local labour regulations require employment of local drilling apprentices
Drilling contract for 5-year project

62
Case Study 4: Business Restructuring
Related party transactions
• Sale of drills from CANCO to EuroCO
• Provision of management by CANCO
• Provision of drilling services by CANCO
• CANCO hired and trained EuroCO employees
Taxpayer model:
• Drills sold at Cost + 10%
• Management fee of Cost + 10%
• CANCO drilling services of Cost + 10%
63
Case Study 4: Business Restructuring
Canada secures contractProvision sells drills and trains of drilling employeesservices
PortCo
Private Owners
CANCOParent and Operating Company
InternationalDrilling
(CANCO)

64
Case Study 4: Business Restructuring
CRA audit position
Sale of drills problematic but reasonable
Transaction really restructuring or a business expansion – CANCO as ‘entrepreneur’
Implied profit split
• Tested PortCo contribution – ‘residual’ earned by CANCO
• Weighed heavily to CANCO in early years, but allows for adjustment to account for increased PortCo role

65
Case Study 4: Business Restructuring
A variation:
CAN Canada secures contract Luxembourg sells drills
Provisionof drilling services
Employeetraining
PortCo
Private Owners
CANCOParent and Operating Company
InternationalDrilling
(CANCO)
LuxCo
66
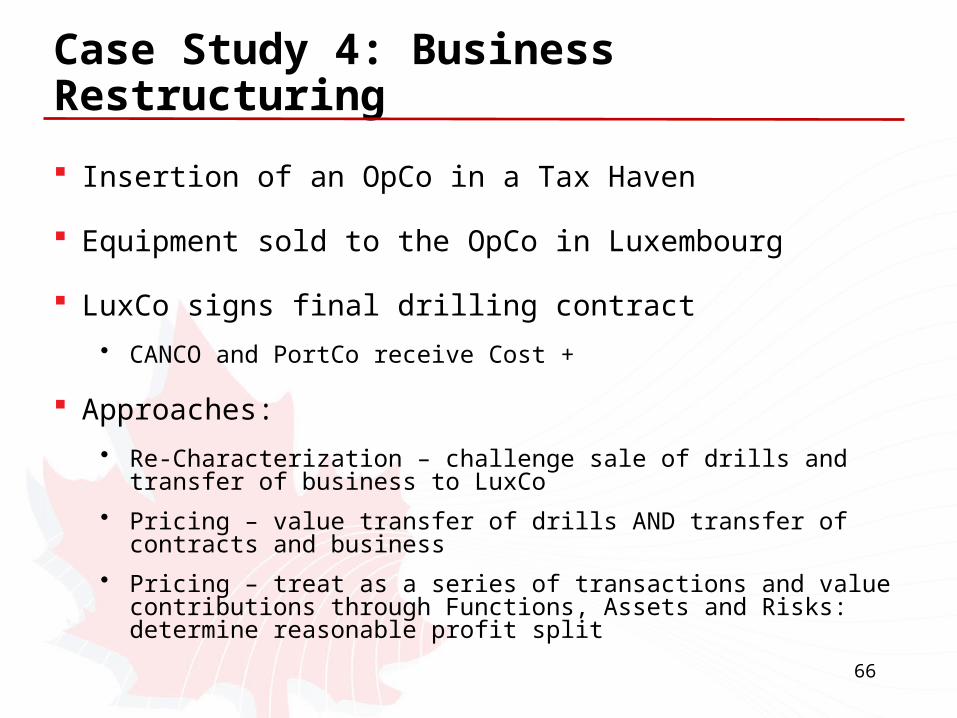
Case Study 4: Business Restructuring
Insertion of an OpCo in a Tax Haven
Equipment sold to the OpCo in Luxembourg
LuxCo signs final drilling contract
• CANCO and PortCo receive Cost +
Approaches:
• Re-Characterization – challenge sale of drills and transfer of business to LuxCo
• Pricing – value transfer of drills AND transfer of contracts and business
• Pricing – treat as a series of transactions and value contributions through Functions, Assets and Risks: determine reasonable profit split

67
Mining and Intangibles
Identification of the intangible
Differentiation of the nature of intangible
Intangible transfer or service provision
Contribution to operational profitability
Contribution of the development
Application of profit split methodologies
Generally technology and know-how
68
Case Study 5: Technology Royalty
Facts:
Non-AL royalty payment for technological know-how
Know-how involved the application of a mining process
Process was developed in the early 1960s and built off publicly available concept
Canadian involvement in technology’s development
69
Case Study 5: Technology Royalty (cont’d)
Patents relating to the process expired by the late 1970s
Taxpayer had failed to license the technology at AL
Taxpayer argued that the payment was linked to ‘core technology’

70
Case Study 5: Technology Royalty (cont’d)
Q: Is a royalty payment reasonable?
A: It depends
Fundamental considerations
• Diffusion of technological know-how
• In-house skilled personnel
• Cost and financing

71
Case Study 5: Technology Royalty (cont’d)
Diffusion of Technology
• CANCO used technology for 30+ years
• Expired patents
Personnel
• CAN involved in development
• CAN responsible for enhancements
Cost
• ?
72
Case Study 5: Technology Royalty (cont’d)Example (cont’d)
Challenged
• Reasonableness of payment
• Duration of agreements
• Economic circumstances
Favourable conclusion achieved – just about

73
Case Studies: Final Thoughts
Importance of industry and company data
Thorough functional analysis
Sound application of economic theory to facts of the file
Significance of individual case’s facts and circumstances

74
Case Studies: Final Thoughts (cont’d)
Identify internal value chain and system profits
CUPs may be difficult to obtain
• Request information from foreign entity
• Arm’s length processing contracts
• Third party sales contracts
Industry knowledge to create framework for transfer pricing model
Useful to consider more than one methodology – verification of results

75
Mining, Resources and Transfer Pricing
Unique economic factors to be considered
Comparable prices
• Minerals, equipment, processing and distribution
Third party and market data as essential
• Independent research; industry annual reports
Mining is a geographically specific operation
Control of resource is essential to realizing value

76
¿Preguntas?