OECD Infrastructure – Outlook & Trends -...
25
STRICTLY PRIVATE | CONFIDENTIAL FOR INSTITUTIONAL/WHOLESALE/PROFESSIONAL CLIENTS AND QUALIFIED INVESTORS ONLY - NOT FOR RETAIL USE OR DISTRIBUTION OECD Infrastructure – Outlook & Trends J.P. Morgan Asset Management – Global Real Assets | November 2015 Matt LeBlanc, Managing Director Chief Investment Officer – OECD Infrastructure
Transcript of OECD Infrastructure – Outlook & Trends -...

STRICTLY PRIVATE | CONFIDENTIAL
FOR INSTITUTIONAL/WHOLESALE/PROFESSIONAL CLIENTS AND QUALIFIED INVESTORS ONLY - NOT FOR RETAIL USE OR DISTRIBUTION
OECD Infrastructure – Outlook & TrendsJ.P. Morgan Asset Management – Global Real Assets | November 2015
Matt LeBlanc, Managing DirectorChief Investment Officer – OECD Infrastructure

STRICTLY PRIVATE | CONFIDENTIAL
1 | FOR INSTITUTIONAL/WHOLESALE/PROFESSIONAL CLIENTS AND QUALIFIED INVESTORS ONLY - NOT FOR RETAIL USE OR DISTRIBUTION
Why Core Infrastructure?
Beauty is in the Eye of the Beholder
Infrastructure – Past Performance & Future Expectations
Other Topical Trends in Infrastructure
Outline
2

2 | FOR INSTITUTIONAL/WHOLESALE/PROFESSIONAL CLIENTS AND QUALIFIED INVESTORS ONLY - NOT FOR RETAIL USE OR DISTRIBUTION
STRICTLY PRIVATE | CONFIDENTIAL
Why Global Core Infrastructure?

3 | FOR INSTITUTIONAL/WHOLESALE/PROFESSIONAL CLIENTS AND QUALIFIED INVESTORS ONLY - NOT FOR RETAIL USE OR DISTRIBUTION
STRICTLY PRIVATE | CONFIDENTIAL
Core Infrastructure in a Diversified Portfolio
Institutional investors continue to increase their allocations to infrastructure based on1:
1. Diversification – low correlation to other major asset classes
2. Inflation Protection – core infrastructure typically exhibits strong inflation linkage
3. Yield – core infrastructure typically exhibits strong cash flow generation
1Preqin, Infrastructure Spotlight, May 20152 Refers to years when inflation was lower than 3.2% and increased during the year, which occurred in 7 of the years since 1972.
STRICTLY PRIVATE | CONFIDENTIAL
4 | FOR INSTITUTIONAL/WHOLESALE/PROFESSIONAL CLIENTS AND QUALIFIED INVESTORS ONLY - NOT FOR RETAIL USE OR DISTRIBUTION
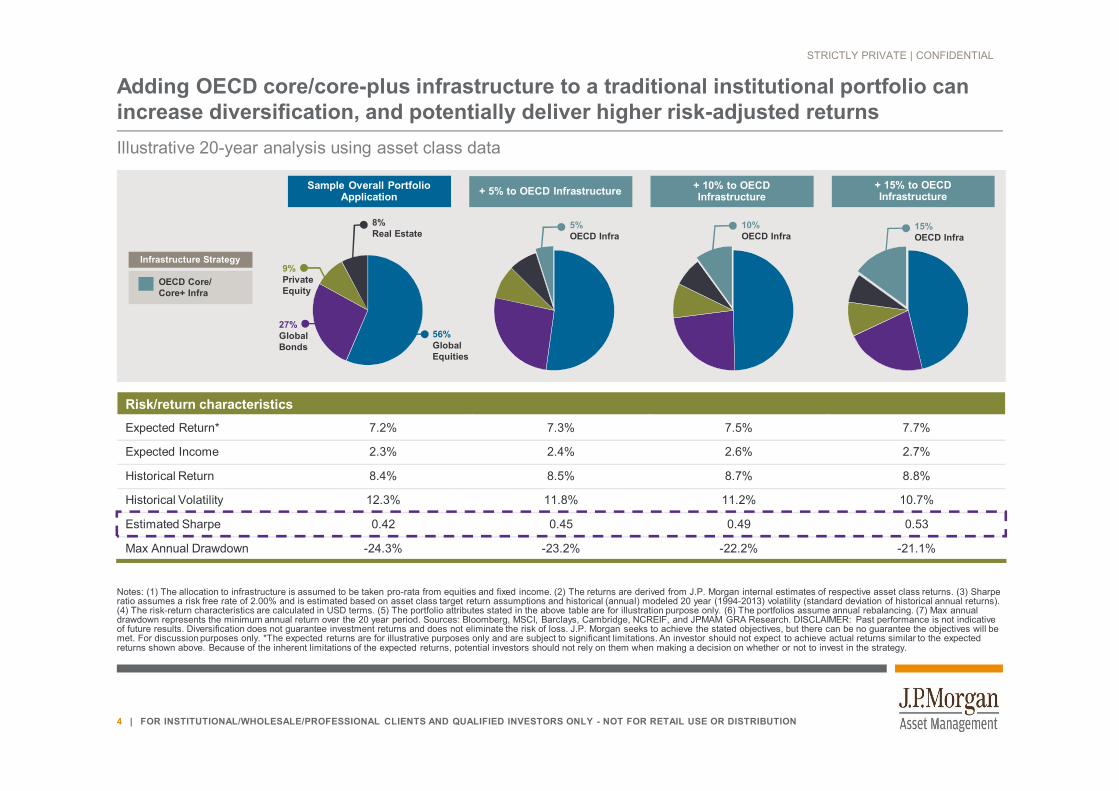
Adding OECD core/core-plus infrastructure to a traditional institutional portfolio can increase diversification, and potentially deliver higher risk-adjusted returnsIllustrative 20-year analysis using asset class data
Notes: (1) The allocation to infrastructure is assumed to be taken pro-rata from equities and fixed income. (2) The returns are derived from J.P. Morgan internal estimates of respective asset class returns. (3) Sharpe ratio assumes a risk free rate of 2.00% and is estimated based on asset class target return assumptions and historical (annual) modeled 20 year (1994-2013) volatility (standard deviation of historical annual returns). (4) The risk-return characteristics are calculated in USD terms. (5) The portfolio attributes stated in the above table are for illustration purpose only. (6) The portfolios assume annual rebalancing. (7) Max annual drawdown represents the minimum annual return over the 20 year period. Sources: Bloomberg, MSCI, Barclays, Cambridge, NCREIF, and JPMAM GRA Research. DISCLAIMER: Past performance is not indicative of future results. Diversification does not guarantee investment returns and does not eliminate the risk of loss. J.P. Morgan seeks to achieve the stated objectives, but there can be no guarantee the objectives will be met. For discussion purposes only. *The expected returns are for illustrative purposes only and are subject to significant limitations. An investor should not expect to achieve actual returns similar to the expected returns shown above. Because of the inherent limitations of the expected returns, potential investors should not rely on them when making a decision on whether or not to invest in the strategy.
27%Global Bonds
9%PrivateEquity
8%Real Estate
56%GlobalEquities
5%OECD Infra
10%OECD Infra
15%OECD Infra
Sample Overall Portfolio Application + 5% to OECD Infrastructure + 10% to OECD
Infrastructure+ 15% to OECD Infrastructure
Infrastructure Strategy
OECD Core/Core+ Infra
Risk/return characteristicsExpected Return* 7.2% 7.3% 7.5% 7.7%
Expected Income 2.3% 2.4% 2.6% 2.7%
Historical Return 8.4% 8.5% 8.7% 8.8%
Historical Volatility 12.3% 11.8% 11.2% 10.7%
Estimated Sharpe 0.42 0.45 0.49 0.53
Max Annual Drawdown -24.3% -23.2% -22.2% -21.1%

STRICTLY PRIVATE | CONFIDENTIAL
5 | FOR INSTITUTIONAL/WHOLESALE/PROFESSIONAL CLIENTS AND QUALIFIED INVESTORS ONLY - NOT FOR RETAIL USE OR DISTRIBUTION
Beauty is in the eye of the beholder….

STRICTLY PRIVATE | CONFIDENTIAL
6 | FOR INSTITUTIONAL/WHOLESALE/PROFESSIONAL CLIENTS AND QUALIFIED INVESTORS ONLY - NOT FOR RETAIL USE OR DISTRIBUTION
Relative Economic Sensitivity
A short history of the Great Recession – the infrastructure view
Source: Energy Information Administration (Electricity and Natural Gas consumption), Federal Highway Administration (VMT), Bureau of Transportation Statistics (Passenger enplanements), Ports of LA, Long Beach, NY-NJ, Oakland, Savannah, Seattle, Tacoma (collectively handling more than 70% of the container traffic in the U.S.), and J.P. Morgan Asset Management. Natural gas and electricity consumption by residential and commercial consumers only. Data as of May 2010.
0%
-1%-4% -5%
-17%
0%
2% 2% 2%
17%
-20%
-15%
-10%
-5%
0%
5%
10%
15%
20%
Natural GasConsumption
ElectricityConsumption
Vehicle MilesTraveled
PassengerEnplanements
Port ContainerVolumes
2009 vs 2007-2008 2010 vs 2009
Infrastructure usage in the U.S. 2007 to 2010

STRICTLY PRIVATE | CONFIDENTIAL
7 | FOR INSTITUTIONAL/WHOLESALE/PROFESSIONAL CLIENTS AND QUALIFIED INVESTORS ONLY - NOT FOR RETAIL USE OR DISTRIBUTION
How do we define core infrastructure? – Sector BreakdownInfrastructure assets provide essential services to society, such as the movement and storage of goods, people, data or resources. In many instances, these assets operate on a monopolistic basis
REGULATED ASSETS Water and wastewater Electricity distribution/
transmission Natural gas distribution
SOCIAL INFRASTRUCTURE Hospitals Schools Courts/Prisons
TRANSPORTATION Toll Roads Airports Seaports
POWER GENERATION Wind and solar power Natural gas fired power generation Contracted Merchant
COMMUNICATIONS Cell towers Cable networks Satellite systems
MIDSTREAM Pipelines Storage Gathering Processing
/
For illustrative purposes only.

STRICTLY PRIVATE | CONFIDENTIAL
8 | FOR INSTITUTIONAL/WHOLESALE/PROFESSIONAL CLIENTS AND QUALIFIED INVESTORS ONLY - NOT FOR RETAIL USE OR DISTRIBUTION
Expected returns vary significantly by sector
Sector Relative risk assessment Avg. cash yield2 Avg. expected
return2
Capital appreciation
potentialSocial infrastructure/ PPPs and PFIs3 Low 3-4% 4-6% Low
Contracted power generation4 Low 5-8% 6-10% Low
Regulated utilities Low-medium 4-7% 8-10% Low-medium
Toll roads Low-medium 3-5% 7-11% Low-medium
Airports Medium 4-6% 9-13% Medium
Seaports Medium 4-6% 10-14% Medium
Freight rail Medium-high 5-7% 10-14% Medium-high
Telecommunication infrastructure High 5-7% 10-15% High
Merchant power generation High 0-4% 14-20% High
Illustrative expected returns for core infrastructure assets by sectors1
Source: J.P. Morgan Asset Management Infrastructure Research, as of Q2-2015.1 Core infrastructure consists of mature assets with established operational histories in transparent and consistent regulatory environments.
2 Assumes sector average loan-to-value ratios, ranging between 40% and 80%.3 PPP stands for Public Private Partnership and PFI stands for Private Finance Initiative; both terms describe assets with government guaranteed payment mechanisms.
4 Assumes contract length of 10 or more years.

9 | FOR INSTITUTIONAL/WHOLESALE/PROFESSIONAL CLIENTS AND QUALIFIED INVESTORS ONLY - NOT FOR RETAIL USE OR DISTRIBUTION
STRICTLY PRIVATE | CONFIDENTIAL
Infrastructure Investments – Past and Future Performance

10 | FOR INSTITUTIONAL/WHOLESALE/PROFESSIONAL CLIENTS AND QUALIFIED INVESTORS ONLY - NOT FOR RETAIL USE OR DISTRIBUTION
STRICTLY PRIVATE | CONFIDENTIAL
Population growth is diminishing – lowering long term growth potentialImmigration-friendly OECD economies are bound to grow faster.
Source: OECD Statistics, as of October 2015.
-0.5%
0.0%
0.5%
1.0%
1.5%
2.0%
2.5%
3.0%
3.5% Population growth rates, historical and OECD forecasts
US
AustraliaCanada

STRICTLY PRIVATE | CONFIDENTIAL
11 | FOR INSTITUTIONAL/WHOLESALE/PROFESSIONAL CLIENTS AND QUALIFIED INVESTORS ONLY - NOT FOR RETAIL USE OR DISTRIBUTION
Future expectations for all asset classes have been revised downwardThe consensus view (including JPM view) is (i) low inflation, (ii) lower than long term average interest rates, and (iii) low economic growth for the next decade.
Source: JPMAM Long Term Capital Market Assumptions, versions 2010 and 2015.
(-1%) (-2%)
(-5%)
(-1%)
(-2%) (-2%)(-4%) (-3%) (-3%)
(-3%)
0%2%4%6%8%
10%12%14%
JPMAM Long Term Capital Market Assumptions, change from 2010 to 2015

12 | FOR INSTITUTIONAL/WHOLESALE/PROFESSIONAL CLIENTS AND QUALIFIED INVESTORS ONLY - NOT FOR RETAIL USE OR DISTRIBUTION
STRICTLY PRIVATE | CONFIDENTIAL
Global allocations to infrastructure continue to grow
3.5% 3.3% 3.6%4.3% 4.3%
4.9% 5.0% 5.1%5.7%
6.3%
0%
1%
2%
3%
4%
5%
6%
7%
2011 2012 2013 2014 2015
Aver
age
Allo
catio
n to
In
fras
truc
ture
(As a
% o
f AU
M)
Average Current AllocationAverage Target Allocation
Source: Preqin Investor Outook: Infrastructure H2 2015
44%
44%
11%
Increase AllocationMaintain Allocation
Average Current and Target Allocations to Infrastructure over Time, 2011 - 2015
Investors’ Intentions for their Infrastructure Allocations over the Longer Term

STRICTLY PRIVATE | CONFIDENTIAL
13 | FOR INSTITUTIONAL/WHOLESALE/PROFESSIONAL CLIENTS AND QUALIFIED INVESTORS ONLY - NOT FOR RETAIL USE OR DISTRIBUTION
Core infrastructure values are increasing with declining discount rates, however the premium over bonds remains robust
0%
2%
4%
6%
8%
10%
12%
14%
Sources: Bloomberg and JPMAM GRA Infrastructure Research estimates; data as of January 2015.
ESTIMATES FOR CORE INFRASTRUCTURE DISCOUNT RATES IN THE LISTED MARKETS VS. RISK-FREE RATE PROXIES
US 10-yr govt bond yieldUK 10-yr govt bond yield

STRICTLY PRIVATE | CONFIDENTIAL
14 | FOR INSTITUTIONAL/WHOLESALE/PROFESSIONAL CLIENTS AND QUALIFIED INVESTORS ONLY - NOT FOR RETAIL USE OR DISTRIBUTION
Allowed returns in regulated assets are declining
0%
2%
4%
6%
8%
10%
12%
14%
16%
197019731976197919821985198819911994199720002003200620092012
Electric allowed RoENatural Gas allowed RoE10-year Treasury rateUtility bond yields (Credit grade, long-term)
Recess
Average Allowed Return on Equity for regulated utilities and interest rates in the US
Sources: Regulatory Research Associates, Barclays Capital and J.P. Morgan Asset Management; data as of September 2015RoE represents the Return On Equity i.e. the amount of net income returned as a percentage of shareholders equity.
8%
9%
10%
11%
12%
1998200020022004200620082010201220142016
France UK NorwayGermany Finland Italy
Estimates for Allowed Return on Equity in the EU

STRICTLY PRIVATE | CONFIDENTIAL
15 | FOR INSTITUTIONAL/WHOLESALE/PROFESSIONAL CLIENTS AND QUALIFIED INVESTORS ONLY - NOT FOR RETAIL USE OR DISTRIBUTION
The projections in the chart above is based on J.P. Morgan Asset Management’s (JPMAM) proprietary long term capital markets assumptions (10 – 15 years) for risk, return and correlations between major asset classes. The resulting projections include only the benchmark return associated with the portfolio and does not include alpha from the underlying product strategies within each asset class. The assumptions are presented for illustrative purposes only. They must not be used, or relied upon, to make investment decisions. The assumptions are not meant to be a representation of, nor should they be interpreted as JPMAM investment recommendations. Allocations, assumptions, and expected returns are not meant to represent JPMAM performance. Please note all information shown is based on assumptions, therefore, exclusive reliance on these assumptions is incomplete and not advised. The individual asset class assumptions are not a promise of future performance. Note that these asset class assumptions are passive-only; they do not consider the impact of active management.
Infrastructure is anticipated to continue to sit near the efficient frontier
US inflation
US Aggregate
WGBI unhedged
US Large CapJapan Large Cap
Emerging Market Equity
Asia ex-Japan Equity
US Private Equity
US Direct Real Estate
US REITs
OECD Infrastructure
CommoditiesGold
0%
2%
4%
6%
8%
10%
12%
0% 5% 10% 15% 20% 25% 30%Expe
cted
com
poun
d re
turn
Expected annualized volatility
JPMAM LONG-TERM CAPITAL MARKET RETURN ASSUMPTIONS - 2015(Basic risk and return expectations for various asset classes over the next ten to fifteen years)
Source: J.P. Morgan Asset Management as of November 2014.

16 | FOR INSTITUTIONAL/WHOLESALE/PROFESSIONAL CLIENTS AND QUALIFIED INVESTORS ONLY - NOT FOR RETAIL USE OR DISTRIBUTION
STRICTLY PRIVATE | CONFIDENTIAL
Core infrastructure outperformed major asset classes with less volatility since inception
$0.5
$1.0
$1.5
2007
Q2
2007
Q3
2007
Q4
2008
Q1
2008
Q2
2008
Q3
2008
Q4
2009
Q1
2009
Q2
2009
Q3
2009
Q4
2010
Q1
2010
Q2
2010
Q3
2010
Q4
2011
Q1
2011
Q2
2011
Q3
2011
Q4
2012
Q1
2012
Q2
2012
Q3
2012
Q4
2013
Q1
2013
Q2
2013
Q3
2013
Q4
2014
Q1
2014
Q2
2014
Q3
2014
Q4
2015
Q1
2015
Q2
Core Infrastructure (GRA Modelled) MSCI WorldListed Infrastructure Barclays Global AggUS Real Estate
EVOLUTION OF $1 INVESTED IN Q2 2007 TO Q2 2015
Listed Infrastructure and US Real Estate are measured by Macquarie Global Infrastructure Index and NCREIF ODCE, respectively, and JPMAM GRA Infrastructure Research estimates. Sources: Bloomberg, Barclays, NCREIF, J.P.Morgan. As of August 24, 2015. Past performance is not indicative of future results. Indices do not include fees or operating expenses and are not available for actual
investment

17 | FOR INSTITUTIONAL/WHOLESALE/PROFESSIONAL CLIENTS AND QUALIFIED INVESTORS ONLY - NOT FOR RETAIL USE OR DISTRIBUTION
STRICTLY PRIVATE | CONFIDENTIAL
Over the medium to long-term, exchange rates for currencies in countries with similar inflation rates are expected to revert to the mean
Diversified currency portfolio is based on 32% USD, 34% GBP, 16% EUR, 10% AUD, and 7% CAD.
Volatility estimates are based on historical exchange rates data between 1980 and 2015 (weighted averages of European currencies at fixed rates are used to proxy for euro).The chart shows annualized volatility estimates for currency impact at various holding periods. With a 5-year hold, the return would vary by +/- 1.57% 66% of the time (1 standard deviation shown on the chart), and 95% of the time it would vary by +/- 3.14% (2 standard deviations). If the assets returned 12%, and currency impact was included in the return, the return would be 10.5% - 13.5% sixty-six percent of the time, and 9.0% - 15.0% ninety-five percent of the time.
Annualized volatility of currency impact against USD for selected currencies and a diversified portfolio
Source: J.P. Morgan Asset Management GRA Research, as of October 2015
0%
2%
4%
6%
8%
10%
12%
1 2 3 4 5 6 7 8 9 10 11 12
Sta
ndar
d de
viat
ion
Holding period in years
GBP only AUD only EUR only Diversified

STRICTLY PRIVATE | CONFIDENTIAL
18 | FOR INSTITUTIONAL/WHOLESALE/PROFESSIONAL CLIENTS AND QUALIFIED INVESTORS ONLY - NOT FOR RETAIL USE OR DISTRIBUTION
We continue to see relative value in the mid-market and in the U.S./Europe
Source: J.P. Morgan Asset Management and Preqin as of July 2015
TRANSACTION SIZE
CO
MPE
TITI
ON
& V
ALU
ATIO
N P
REM
IUM
S
$100 million $1 billion
Broad and deep middle
market opportunity
FOCUS ON THE MIDDLE MARKET ATTRACTIVE RELATIVE VALUE IN THE U.S./EUROPE
POWER, ENERGY, AND UTILITY OPPORTUNITIES
Control positions
Buy and build
Balanced return composition
Bilateral and partnerships
Renewable and thermal generation
Utilities
Midstream
Power development
Other energy development
$55 billion
Seaports
Toll roads
Utilities
Midstream
$1.7 trillion
$1.5T in investable assets

19 | FOR INSTITUTIONAL/WHOLESALE/PROFESSIONAL CLIENTS AND QUALIFIED INVESTORS ONLY - NOT FOR RETAIL USE OR DISTRIBUTION
STRICTLY PRIVATE | CONFIDENTIAL
Other Topical Trends in Infrastructure

STRICTLY PRIVATE | CONFIDENTIAL
20 | FOR INSTITUTIONAL/WHOLESALE/PROFESSIONAL CLIENTS AND QUALIFIED INVESTORS ONLY - NOT FOR RETAIL USE OR DISTRIBUTION
Internal research forecast: Oil price will not reach $100
Source: Bloomberg; data as of September 2015.
-20000
2000400060008000
10000 Increase in crude oil production over 2006 levels, thousand barrels per dayOthers
OPECUS conventional
40
90
Crude oil price, USD/bblWTI
Brent

STRICTLY PRIVATE | CONFIDENTIAL
21 | FOR INSTITUTIONAL/WHOLESALE/PROFESSIONAL CLIENTS AND QUALIFIED INVESTORS ONLY - NOT FOR RETAIL USE OR DISTRIBUTION
Solar power has experienced a regime change
Sources: NREL and U.S. Department of Energy; data as of September 2014.
2009, $7.5
2013, $1.7
$0
$2
$4
$6
$8
$10
$12AVERAGE COST OF INSTALLED PV IN THE US, CAPACITY-
WEIGHTED, $/watt
PV represents a system designed to supply a usable solar power by means of Photovoltaics.

STRICTLY PRIVATE | CONFIDENTIAL
22 | FOR INSTITUTIONAL/WHOLESALE/PROFESSIONAL CLIENTS AND QUALIFIED INVESTORS ONLY - NOT FOR RETAIL USE OR DISTRIBUTION
Solar power installations caught up with wind in 2013
Source: International Energy Agency; data as of April 2015
17 24 31 33 34 33 31 29 41 33 3665 3 4 8 6 7 7
67 8
1114
1925
35 35 38 4535 39
43
33
47
9 1827
32 40 4653
0
20
40
60
80
100
120
140
2005 2006 2007 2008 2009 2010 2011 2012 2013 2014 2015F
RENEWABLE ELECTRICITY NEW CAPACITY ADDITIONS IN THE WORLD (in GW)
Hydro Bioenergy Wind Solar Other

STRICTLY PRIVATE | CONFIDENTIAL
23 | FOR INSTITUTIONAL/WHOLESALE/PROFESSIONAL CLIENTS AND QUALIFIED INVESTORS ONLY - NOT FOR RETAIL USE OR DISTRIBUTION
0.6
0.7
0.8
0.9
1
1.1
1.2
1.3
Jan-14 Apr-14 Jul-14 Oct-14 Jan-15 Apr-15 Jul-15 Oct-15
S&P 500 Alerian MLP Indxx Yieldco
The good times and not so good times for MLPs & Yield-cos
Source: Bloomberg; data as of October 2015Past performance is not indicative of future results. Indices do not include fees or operating expenses and are not available for actual investment. .
Correlation coefficients S&P500 MLPs Yieldcos
MLPs 0.49Yieldcos 0.57 0.66
Annualized volatility 10% 16% 18%

24 | FOR INSTITUTIONAL/WHOLESALE/PROFESSIONAL CLIENTS AND QUALIFIED INVESTORS ONLY - NOT FOR RETAIL USE OR DISTRIBUTION
STRICTLY PRIVATE | CONFIDENTIAL
Risks and disclosures
FOR PROFESSIONAL AND WHOLESALE CLIENTS ONLY – NOT FOR RETAIL USE OR DISTRIBUTION.
This document is confidential and intended only for the wholesale clients, person or entity to which it has been provided. This document is not intended to be distributed or passed on, directly or indirectly, to any person who is not a wholesale client as defined in the Corporations Act. It is not for public or retail distribution or use.
Any reproduction, retransmission, dissemination or other unauthorised use of this document or the information contained herein by any person or entity is strictly prohibited. It is being provided solely for information and discussion purposes and is subject to any updating, completion, modification and amendment without reference or notification to you.
This document contains only factual information, which is not intended to be and must not be taken as financial product advice. Independent advice must be obtained before making any financial decisions.
It is a promotional document and as such the views contained herein are not to be taken as advice or recommendation to buy or sell any investment or interest thereto. It is not intended and is not to be taken as an offer or solicitation to buy or sell any security or interest to anyone in any jurisdiction or to acquire any security or interest. Furthermore, nothing in this document constitutes or should be taken as an advice or recommendation to buy or sell any investment and the material should not be relied upon as containing sufficient information to support an investment decision. Any investment decision should be based solely upon the information contained in the product’s offering materials. Reliance upon information in this material is at the sole discretion of the reader. Any research in this document has been obtained and may have been acted upon by J.P. Morgan Asset Management for its own purpose. The results of such research are being made available as additional information and do not necessarily reflect the views of J.P. Morgan Asset Management. Any forecasts, figures, opinions, views and investment techniques, unless otherwise stated, are those of the investment manager/adviser/J.P. Morgan Asset Management’s own at the time of this document. They are considered to be accurate and reliable at the time of writing, may not necessarily be all–inclusive and no warranty of accuracy is given and no liability in respect of any error or omission is accepted. They may be subject to change without reference or notification to you.
It should be noted that the value of investments and the income from them may fluctuate in accordance with market conditions and taxation agreements and investors may not get back the full amount invested. Changes in exchange rates may have an adverse effect on the value, price or income of the product(s) or underlying overseas investments. Both past performance and yield may not be a reliable guide to future performance. There is no guarantee that any forecast made will come to pass. Furthermore, whilst it is the intention to achieve the investment objective of the investment product(s), there can be no assurance that those objectives will be met.
J.P. Morgan Asset Management is the brand name for the asset management business of JPMorgan Chase & Co and its affiliates worldwide. You should take note that information and data from communications with you will be collected, stored and processed by J.P. Morgan Asset Management in accordance with the EMEA Privacy Policy which can be accessed through the following website http://www.jpmorganassetmanagement.lu/ENG/Privacy_Policy. This document is issued by JPMorgan Asset Management (Australia) Limited (ABN 55143832080) (AFSL 376919), which is regulated by the Australian Securities and Investments Commission.
For further information, any questions and for copies of the offering material you can contact your usual J.P. Morgan Asset Management representative.
J.P. Morgan Asset Management is the brand for the asset management business of JPMorgan Chase & Co. and its affiliates worldwide.