OECD, FDI in Figures, April 2018 · FDI IN FIGURES April 2018 FDI drops 18% in 2017 as corporate...
12
FDI IN FIGURES April 2018 FDI drops 18% in 2017 as corporate restructurings decline Global FDI flows decreased by 18% to USD 1 411 billion in 2017 compared to 2016. In the fourth quarter of 2017, FDI flows reached their lowest level since 2013 (USD 280 billion). Inflows to the OECD decreased by 37%, largely driven by decreases in the United Kingdom and the United States from high levels in 2016. Outflows from the OECD decreased by a more modest 4%. In contrast, FDI inflows to non-OECD G20 economies increased by 3% while FDI outflows decreased by 33% as FDI outflows from China declined for the first time since 2005. The United States remained the largest source of FDI worldwide by a long stretch, followed by Japan, China, the United Kingdom, Germany and Canada. China, after being a net outward direct investor for the first time in 2016, became a net inward investor in 2017. Although the majority of OECD countries account for a smaller share of global GDP than they did at the start of the global financial crisis, most still account for a larger share of global inward and outward FDI, indicating that they remain among the more financially integrated economies in the world. In this issue Recent developments FDI in resident SPEs Spotlight on FDI by ultimate investor Spotlight on FDI since the financial crisis Tables of FDI statistics Recent developments In 2017, global FDI flows 1 decreased by 18% compared to 2016, to USD 1 411 billion. This represents 1.8% of global GDP, compared to 2.3% in 2016 and 2.5% in 2015, but is comparable to levels recorded between 2012 and 2014. FDI flows into the United States dropped to USD 287 billion after reaching more than USD 450 billion in 2015 and 2016. The high levels in 2015 and 2016 were partly due to financial and corporate restructuring, but it is also likely that the possibility of tax reform decreased incentives to engage in these types of transactions in 2017. The US tax reform will have both immediate and long term impacts on direct investment. For example, it probably boosted FDI flows in 2017 by increasing the amount of earnings US MNEs reinvested in their foreign affiliates as repatriations fell in the fourth quarter in anticipation of more favourable tax treatment in 2018. Looking ahead, this is likely to reduce FDI flows in 2018 as US companies repatriate cash due to the one-time tax on undistributed foreign earnings included in the tax reform. Estimates of the amount of overseas 1 By definition, inward and outward FDI worldwide should be equal, but in practice, there are statistical discrepancies between inward and outward FDI. Unless otherwise specified, references to ‘global FDI flows’ refer to the average of these two figures. 1 Find latest FDI data online Detailed FDI statistics by partner country and by industry are available from OECD’s online FDI database (see pre- defined queries). Find detailed information on inward and outward FDI flows, income and positions by main destination or source country, and by industry sector, as well as detailed information for resident SPEs and information on inward FDI positions by ultimate investing country. New data for 2016 are available since January 2018.
Transcript of OECD, FDI in Figures, April 2018 · FDI IN FIGURES April 2018 FDI drops 18% in 2017 as corporate...

FDI IN FIGURES April 2018
FDI drops 18% in 2017 as corporate restructurings decline
Global FDI flows decreased by 18% to USD 1 411 billion in 2017 compared to 2016.
In the fourth quarter of 2017, FDI flows reached their lowest level since 2013 (USD 280 billion).
Inflows to the OECD decreased by 37%, largely driven by decreases in the United Kingdom and the United States from high levels in 2016. Outflows from the OECD decreased by a more modest 4%.
In contrast, FDI inflows to non-OECD G20 economies increased by 3% while FDI outflows decreased by 33% as FDI outflows from China declined for the first time since 2005.
The United States remained the largest source of FDI worldwide by a long stretch, followed by Japan, China, the United Kingdom, Germany and Canada.
China, after being a net outward direct investor for the first time in 2016, became a net inward investor in 2017.
Although the majority of OECD countries account for a smaller share of global GDP than they did at the start of the global financial crisis, most still account for a larger share of global inward and outward FDI, indicating that they remain among the more financially integrated economies in the world.
In this issue
Recent developments
FDI in resident SPEs
Spotlight on FDI by ultimate
investor
Spotlight on FDI since the financial
crisis
Tables of FDI statistics
Recent developments
In 2017, global FDI flows1 decreased by 18% compared to 2016, to USD 1 411 billion. This
represents 1.8% of global GDP, compared to 2.3% in 2016 and 2.5% in 2015, but is comparable to
levels recorded between 2012 and 2014. FDI flows into the United States dropped to USD 287 billion
after reaching more than USD 450 billion in 2015 and 2016. The high levels in 2015 and 2016 were
partly due to financial and corporate restructuring, but it is also likely that the possibility of tax reform
decreased incentives to engage in these types of transactions in 2017. The US tax reform will have
both immediate and long term impacts on direct investment. For example, it probably boosted FDI
flows in 2017 by increasing the amount of earnings US MNEs reinvested in their foreign affiliates as
repatriations fell in the fourth quarter in anticipation of more favourable tax treatment in 2018. Looking
ahead, this is likely to reduce FDI flows in 2018 as US companies repatriate cash due to the one-time
tax on undistributed foreign earnings included in the tax reform. Estimates of the amount of overseas
1 By definition, inward and outward FDI worldwide should be equal, but in practice, there are statistical discrepancies between
inward and outward FDI. Unless otherwise specified, references to ‘global FDI flows’ refer to the average of these two figures.
1
Find latest FDI data online
Detailed FDI statistics by partner country and by industry are
available from OECD’s online FDI database (see pre-
defined queries). Find detailed information on inward and
outward FDI flows, income and positions by main destination
or source country, and by industry sector, as well as detailed
information for resident SPEs and information on inward FDI
positions by ultimate investing country. New data for 2016
are available since January 2018.
cash held by US MNEs vary, but all indications are that it is substantial.2 However, the impact of these
repatriations of cash on the foreign operations of US MNEs is likely to be minimal because they
involve the sale or disposal of financial, as opposed to real, assets. The longer term effects of the tax
reform are more difficult to predict. Apart from developments in the United States, the United Kingdom
recorded its lowest level of FDI inflows since 2005 (USD 15 billion) after reaching a record level in
2016, largely due to Anheuser-Busch InBev acquiring SABMiller (FDI in Figures – April 2017).
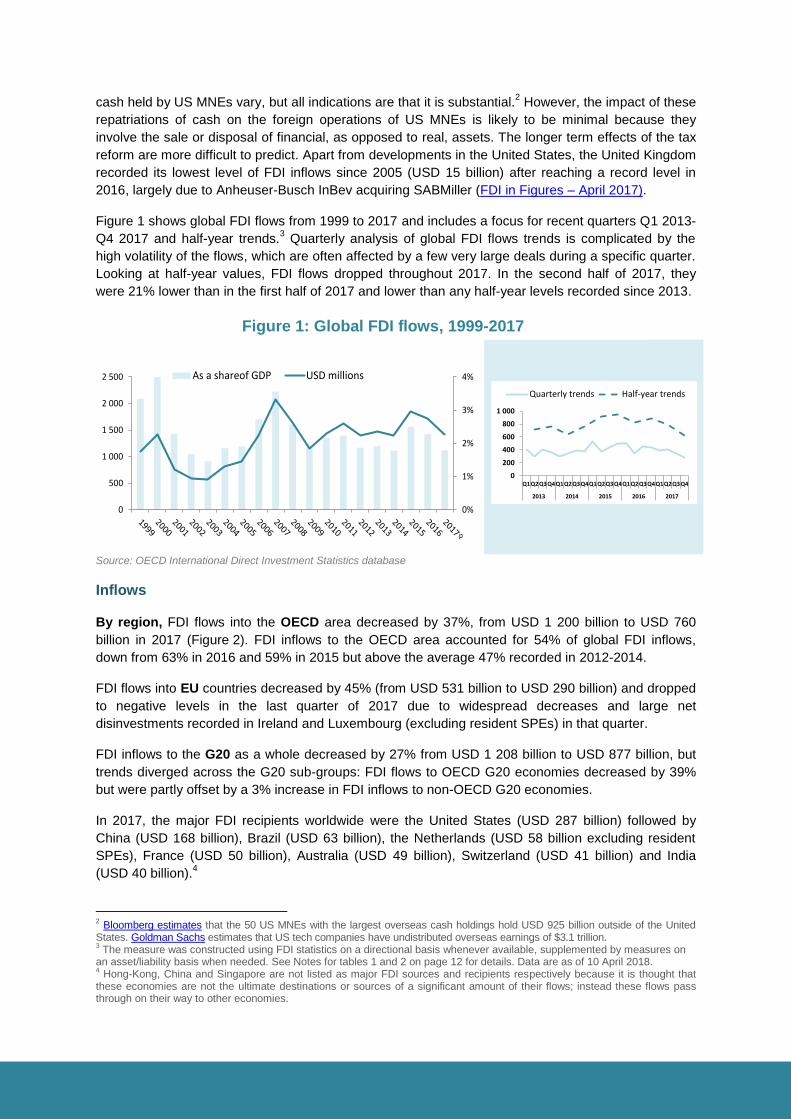
Figure 1 shows global FDI flows from 1999 to 2017 and includes a focus for recent quarters Q1 2013-
Q4 2017 and half-year trends.3 Quarterly analysis of global FDI flows trends is complicated by the
high volatility of the flows, which are often affected by a few very large deals during a specific quarter.
Looking at half-year values, FDI flows dropped throughout 2017. In the second half of 2017, they
were 21% lower than in the first half of 2017 and lower than any half-year levels recorded since 2013.
Source: OECD International Direct Investment Statistics database
Inflows
By region, FDI flows into the OECD area decreased by 37%, from USD 1 200 billion to USD 760
billion in 2017 (Figure 2). FDI inflows to the OECD area accounted for 54% of global FDI inflows,
down from 63% in 2016 and 59% in 2015 but above the average 47% recorded in 2012-2014.
FDI flows into EU countries decreased by 45% (from USD 531 billion to USD 290 billion) and dropped
to negative levels in the last quarter of 2017 due to widespread decreases and large net
disinvestments recorded in Ireland and Luxembourg (excluding resident SPEs) in that quarter.
FDI inflows to the G20 as a whole decreased by 27% from USD 1 208 billion to USD 877 billion, but
trends diverged across the G20 sub-groups: FDI flows to OECD G20 economies decreased by 39%
but were partly offset by a 3% increase in FDI inflows to non-OECD G20 economies.
In 2017, the major FDI recipients worldwide were the United States (USD 287 billion) followed by
China (USD 168 billion), Brazil (USD 63 billion), the Netherlands (USD 58 billion excluding resident
SPEs), France (USD 50 billion), Australia (USD 49 billion), Switzerland (USD 41 billion) and India
(USD 40 billion).4
2 Bloomberg estimates that the 50 US MNEs with the largest overseas cash holdings hold USD 925 billion outside of the United
States. Goldman Sachs estimates that US tech companies have undistributed overseas earnings of $3.1 trillion. 3 The measure was constructed using FDI statistics on a directional basis whenever available, supplemented by measures on
an asset/liability basis when needed. See Notes for tables 1 and 2 on page 12 for details. Data are as of 10 April 2018. 4 Hong-Kong, China and Singapore are not listed as major FDI sources and recipients respectively because it is thought that
these economies are not the ultimate destinations or sources of a significant amount of their flows; instead these flows pass through on their way to other economies.
0%
1%
2%
3%
4%
0
500
1 000
1 500
2 000
2 500 As a shareof GDP USD millions
p
0
200
400
600
800
1 000
Q1Q2Q3Q4Q1Q2Q3Q4Q1Q2Q3Q4Q1Q2Q3Q4Q1Q2Q3Q4
2013 2014 2015 2016 2017
Quarterly trends Half-year trends
Figure 1: Global FDI flows, 1999-2017
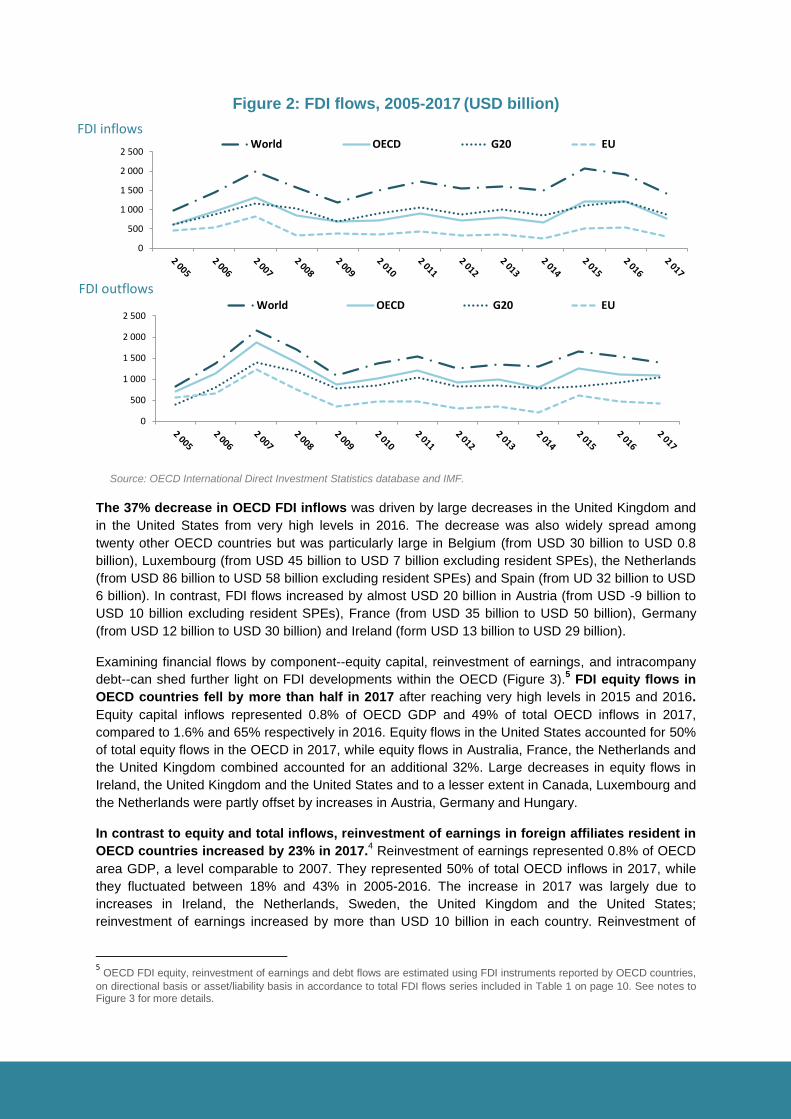
Figure 2: FDI flows, 2005-2017 (USD billion)
The 37% decrease in OECD FDI inflows was driven by large decreases in the United Kingdom and
in the United States from very high levels in 2016. The decrease was also widely spread among
twenty other OECD countries but was particularly large in Belgium (from USD 30 billion to USD 0.8
billion), Luxembourg (from USD 45 billion to USD 7 billion excluding resident SPEs), the Netherlands
(from USD 86 billion to USD 58 billion excluding resident SPEs) and Spain (from UD 32 billion to USD
6 billion). In contrast, FDI flows increased by almost USD 20 billion in Austria (from USD -9 billion to
USD 10 billion excluding resident SPEs), France (from USD 35 billion to USD 50 billion), Germany
(from USD 12 billion to USD 30 billion) and Ireland (form USD 13 billion to USD 29 billion).
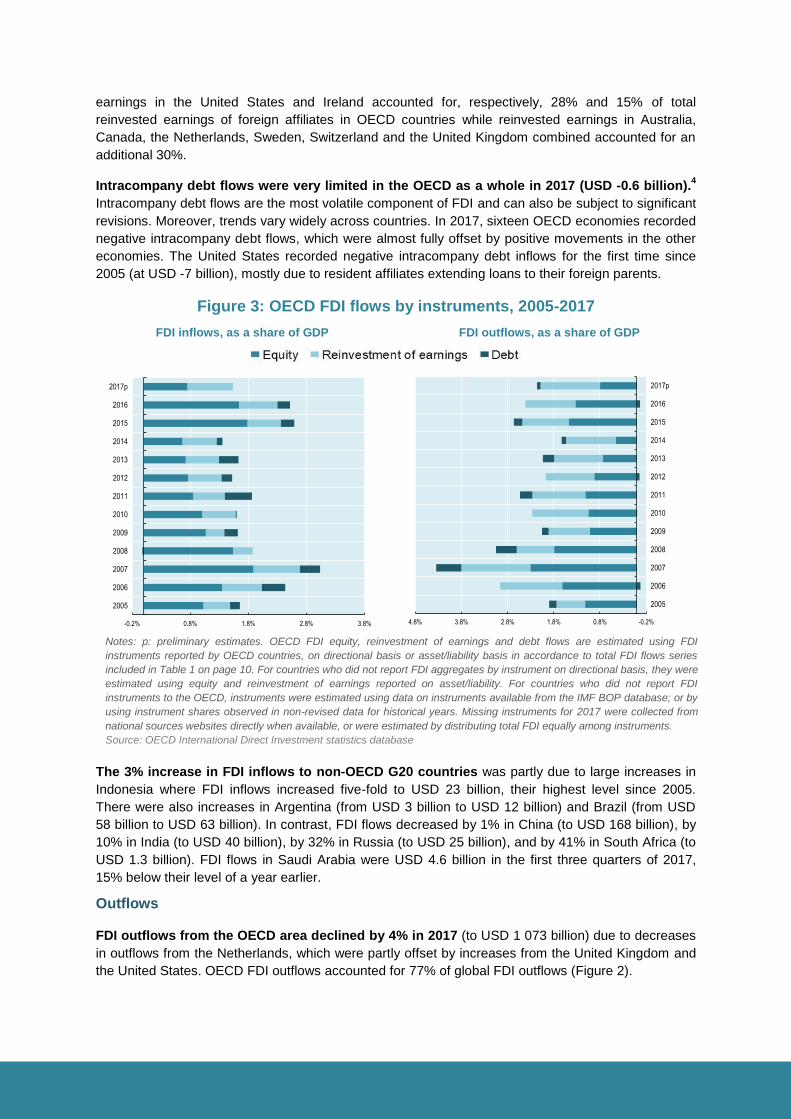
Examining financial flows by component--equity capital, reinvestment of earnings, and intracompany
debt--can shed further light on FDI developments within the OECD (Figure 3).5 FDI equity flows in
OECD countries fell by more than half in 2017 after reaching very high levels in 2015 and 2016.
Equity capital inflows represented 0.8% of OECD GDP and 49% of total OECD inflows in 2017,
compared to 1.6% and 65% respectively in 2016. Equity flows in the United States accounted for 50%
of total equity flows in the OECD in 2017, while equity flows in Australia, France, the Netherlands and
the United Kingdom combined accounted for an additional 32%. Large decreases in equity flows in
Ireland, the United Kingdom and the United States and to a lesser extent in Canada, Luxembourg and
the Netherlands were partly offset by increases in Austria, Germany and Hungary.
In contrast to equity and total inflows, reinvestment of earnings in foreign affiliates resident in
OECD countries increased by 23% in 2017.4 Reinvestment of earnings represented 0.8% of OECD
area GDP, a level comparable to 2007. They represented 50% of total OECD inflows in 2017, while
they fluctuated between 18% and 43% in 2005-2016. The increase in 2017 was largely due to
increases in Ireland, the Netherlands, Sweden, the United Kingdom and the United States;
reinvestment of earnings increased by more than USD 10 billion in each country. Reinvestment of
5 OECD FDI equity, reinvestment of earnings and debt flows are estimated using FDI instruments reported by OECD countries,
on directional basis or asset/liability basis in accordance to total FDI flows series included in Table 1 on page 10. See notes to Figure 3 for more details.
0
500
1 000
1 500
2 000
2 500World OECD G20 EU
0
500
1 000
1 500
2 000
2 500World OECD G20 EU
FDI inflows
FDI outflows
Source: OECD International Direct Investment Statistics database and IMF.
earnings in the United States and Ireland accounted for, respectively, 28% and 15% of total
reinvested earnings of foreign affiliates in OECD countries while reinvested earnings in Australia,
Canada, the Netherlands, Sweden, Switzerland and the United Kingdom combined accounted for an
additional 30%.
Intracompany debt flows were very limited in the OECD as a whole in 2017 (USD -0.6 billion).4
Intracompany debt flows are the most volatile component of FDI and can also be subject to significant
revisions. Moreover, trends vary widely across countries. In 2017, sixteen OECD economies recorded
negative intracompany debt flows, which were almost fully offset by positive movements in the other
economies. The United States recorded negative intracompany debt inflows for the first time since
2005 (at USD -7 billion), mostly due to resident affiliates extending loans to their foreign parents.
Figure 3: OECD FDI flows by instruments, 2005-2017
FDI inflows, as a share of GDP FDI outflows, as a share of GDP
The 3% increase in FDI inflows to non-OECD G20 countries was partly due to large increases in
Indonesia where FDI inflows increased five-fold to USD 23 billion, their highest level since 2005.
There were also increases in Argentina (from USD 3 billion to USD 12 billion) and Brazil (from USD
58 billion to USD 63 billion). In contrast, FDI flows decreased by 1% in China (to USD 168 billion), by
10% in India (to USD 40 billion), by 32% in Russia (to USD 25 billion), and by 41% in South Africa (to
USD 1.3 billion). FDI flows in Saudi Arabia were USD 4.6 billion in the first three quarters of 2017,
15% below their level of a year earlier.
Outflows
FDI outflows from the OECD area declined by 4% in 2017 (to USD 1 073 billion) due to decreases
in outflows from the Netherlands, which were partly offset by increases from the United Kingdom and
the United States. OECD FDI outflows accounted for 77% of global FDI outflows (Figure 2).
-0.2% 0.8% 1.8% 2.8% 3.8%
2005
2006
2007
2008
2009
2010
2011
2012
2013
2014
2015
2016
2017p
-0.2%0.8%1.8%2.8%3.8%4.8%
2005
2006
2007
2008
2009
2010
2011
2012
2013
2014
2015
2016
2017p
Notes: p: preliminary estimates. OECD FDI equity, reinvestment of earnings and debt flows are estimated using FDI
instruments reported by OECD countries, on directional basis or asset/liability basis in accordance to total FDI flows series
included in Table 1 on page 10. For countries who did not report FDI aggregates by instrument on directional basis, they were
estimated using equity and reinvestment of earnings reported on asset/liability. For countries who did not report FDI
instruments to the OECD, instruments were estimated using data on instruments available from the IMF BOP database; or by
using instrument shares observed in non-revised data for historical years. Missing instruments for 2017 were collected from
national sources websites directly when available, or were estimated by distributing total FDI equally among instruments.
Source: OECD International Direct Investment statistics database

EU outflows decreased by 9% (from USD 465 billion to USD 425 billion) and accounted for 30% of
global FDI outflows. In contrast, FDI outflows from the G20 increased by 15%, from USD 909 billion to
USD 1 050 billion. However, the situation varies widely within the G20 sub-groups: FDI outflows
increased by 33% from G20 OECD economies while they decreased by 33% from non-OECD G20
economies, largely driven by decreases from China.
The United States remained by far the largest source of FDI worldwide, followed by Japan, China, the
United Kingdom, Germany and Canada.3 While China was a net outward direct investor for the first
time in 2016, it was a net inward investor in 2017.
The 4% decrease in outflows from OECD countries was driven by decreases from the Netherlands
(from USD 172 billion to USD 23 billion) and to a lesser extent from Switzerland (from USD 73 billion
to USD -15 billion), Finland (from USD 26 billion to USD 1.5 billion) and Spain (from USD 50 billion to
USD 27 billion). These decreases were partly offset by increases in outflows from the United Kingdom
which reached USD 100 billion after three consecutive years of negative outflows. Large increases
were also recorded in the United States (from USD 300 billion to USD 363 billion) and Germany (from
USD 47 billion to USD 77 billion). In other countries, outflows increased by more than USD 10 billion
in Austria (from USD -3 billion to USD 11 billion, excluding from resident SPEs); in Japan (from USD
145 billion to USD 160 billion) and in Sweden (from USD 6 billion to USD 24 billion).
Equity investment flows from OECD countries decreased by 38% in 2017.4
Outward equity
capital flows represented 0.8% of OECD GDP in 2017, compared to 1.3% in 2016 and 1.5% in 2015.
However, they remain higher than levels recorded in 2013 and 2014 at 0.7% and 0.5% of OECD
GDP. In 2017, equity capital outflows represented 37% of total OECD FDI outflows. The drop in 2017
was largely driven by net disinvestments compared to high levels of equity which were recorded in
2016 from selected countries: in the Netherlands, equity outflows dropped from USD 132 billion in
2016 to USD -5 billion in 2017; in Ireland they dropped from USD 49 billion to USD -2 billion; and in
Switzerland they dropped from USD 14 billion to USD -33 billion. In other countries, equity outflows
decreased by more than USD 10 billion in Belgium, Finland, Germany and Luxembourg (excluding
resident SPEs). Partly offsetting were increases in equity outflows from the United Kingdom.
Earnings reinvested by OECD area parents in their foreign affiliates abroad increased by 24%
in 2017.4 Reinvested earnings represented 1.3% of OECD area GDP, the highest level since 2007.
Reinvestment of earnings represented 60% of total OECD area outflows compared to 46% in 2016,
38% in 2015 and 66% in 2014. Earnings reinvested by US parents in their foreign affiliates abroad
increased by 15%, reaching the highest level since 2005 (at USD 345 billion). They accounted for
54% of the total earnings reinvested by OECD area parents in their foreign affiliates and were likely
boosted by the US tax reform. Reinvestment of earnings by parents in Japan, Canada, the United
Kingdom and Germany accounted for an additional 20% of the total. In other countries, parents in
Belgium, France, Ireland and Sweden reinvested more than USD 10 billion of earnings in their foreign
affiliates.
Intracompany debt outflows recovered from negative levels recorded in 2016.4 Outward
intracompany debt flows represented 0.1% of GDP in 2017, a level comparable to 2009 and 2014. As
indicated for inflows, this component is highly volatile, varies widely across countries and can be
subject to significant revisions. The development in 2017 was partly due to shifts from large negative
intracompany debt outflows recorded in 2016: in Belgium from USD -13 billion to USD 3 billion; in
Germany from USD -31 billion to USD -3 billion; in Ireland from USD -33 billion to USD 1 billion; in
Luxembourg from USD -18 billion to USD 3 billion; and in the United States from USD -29 billion to
USD -12 billion. Intracompany debt outflows remained negative in Germany and the United States,
largely due to foreign affiliates extending loans to their German and US parents.
In non-OECD G20 economies, FDI outflows decreased by 33% while they increased by 33% in the
OECD G20 economies. This was largely driven by FDI outflows from China, which declined for the

first time since 2005, falling by more than half to USD 102 billion. Equity outflows combined with
earnings reinvested by Chinese parents abroad dropped from USD 147 billion to USD 100 billion,
while intracompany debt outflows dropped from USD 69 billion to USD 2 billion. In the other non-
OECD G20 economies, FDI outflows increased: by 75% from South Africa (to USD 7.8 billion), by
34% from Russia (to USD 36 billion), they more than doubled from India (to USD 11 billion), and by
32% from Argentina (to USD 1.2 billion). They shifted from negative levels in Indonesia (to USD 3
billion), and they increased but remained negative from Brazil (at USD -1.4 billion), largely due to
Brazilian affiliates continuing to extend loans to their foreign parents. FDI outflows from Saudi Arabia
were USD 3.9 billion in the first three quarters of 2017, 50% below their level of a year earlier.
FDI in resident special purpose entities
SPEs are entities with little or no physical presence or employment in the host country but that provide
important services to the MNE in the form of financing or of holding assets and liabilities. MNEs often
channel investments through SPEs in one country before they reach their final destination in another
country. By excluding investment into resident SPEs, countries have a better measure of FDI into their
country that is likely to have a real impact on their economy.6
FDI flows in and from SPEs are volatile due to the role SPEs play in the internal financing of MNEs
and can be particularly affected by individual large deals. Moreover, it is very difficult for national
compilers to collect information related to SPEs. Therefore, FDI flows in and from resident SPEs can
be subject to substantial revisions. Figure 4 shows annual trends of FDI inflows and outflows to and
from SPEs of the 17 OECD countries that reported the information.
FDI flows in and from SPEs in 2017 were very limited. The very low levels observed in 2017 are due
to widely diverging trends between the two major hosts of OECD area SPEs: very large negative
flows in and from Luxembourg SPEs (USD -295 billion and USD -263 billion respectively) were almost
fully offset by very large flows in and from Dutch SPEs (USD 269 billion and USD 254 billion
respectively). In addition, the largest SPEs in Iceland were liquidated. As a result, the share of SPEs
in Iceland's total inward position fell from 25% at the end of 2016 to only 4% at the end of 2017.
Figure 4: FDI inflows and outflows to and from OECD area SPEs, 2005-2017
Spotlight on inward FDI by ultimate investor
Traditionally FDI statistics are presented according to the immediate investing country, but this can
obscure the ultimate source of the FDI in a country due to the complicated ownership structures of
some MNEs. Presenting the statistics by ultimate investing country (UIC) identifies the countries of
investors that ultimately control the investments in a country and, thus, bear the risks and reap the
6 For more details, see the OECD note on how MNEs channel investments through multiple countries.
-2000
200400600800
1 000
Outflows from SPEs Inflows in SPEsUSD billion
2
3
Notes: Includes data for Austria, Belgium, Chile, Denmark, Estonia, Hungary, Iceland, Korea, Luxembourg, the Netherlands, Norway, Poland, Portugal, Spain, Sweden, Switzerland and the United Kingdom. FDI flows in and from SPEs are not available for selected countries and years but it was assumed that it would not have a major impact on the overall totals given that data for Luxembourg and the Netherlands, the major SPE hosts, are available for the full period 2005-2017. Source: OECD International Direct Investment statistics database
p
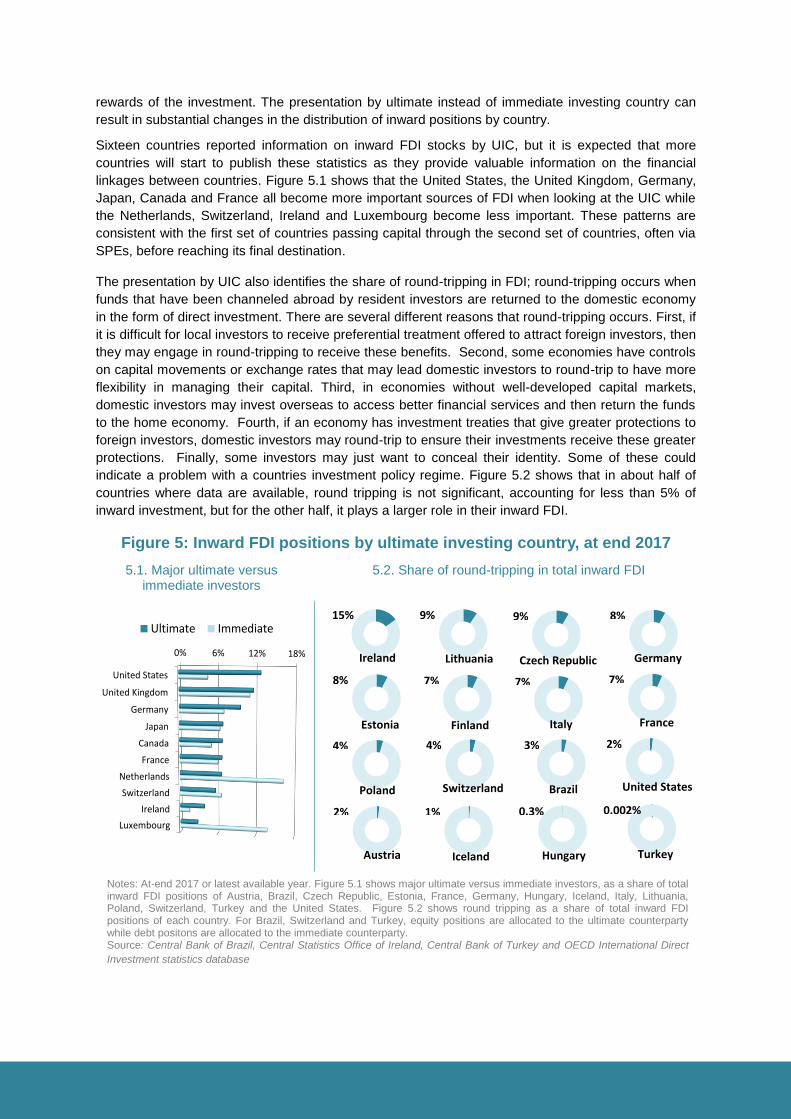
rewards of the investment. The presentation by ultimate instead of immediate investing country can
result in substantial changes in the distribution of inward positions by country.
Sixteen countries reported information on inward FDI stocks by UIC, but it is expected that more
countries will start to publish these statistics as they provide valuable information on the financial
linkages between countries. Figure 5.1 shows that the United States, the United Kingdom, Germany,
Japan, Canada and France all become more important sources of FDI when looking at the UIC while
the Netherlands, Switzerland, Ireland and Luxembourg become less important. These patterns are
consistent with the first set of countries passing capital through the second set of countries, often via
SPEs, before reaching its final destination.
The presentation by UIC also identifies the share of round-tripping in FDI; round-tripping occurs when
funds that have been channeled abroad by resident investors are returned to the domestic economy
in the form of direct investment. There are several different reasons that round-tripping occurs. First, if
it is difficult for local investors to receive preferential treatment offered to attract foreign investors, then
they may engage in round-tripping to receive these benefits. Second, some economies have controls
on capital movements or exchange rates that may lead domestic investors to round-trip to have more
flexibility in managing their capital. Third, in economies without well-developed capital markets,
domestic investors may invest overseas to access better financial services and then return the funds
to the home economy. Fourth, if an economy has investment treaties that give greater protections to
foreign investors, domestic investors may round-trip to ensure their investments receive these greater
protections. Finally, some investors may just want to conceal their identity. Some of these could
indicate a problem with a countries investment policy regime. Figure 5.2 shows that in about half of
countries where data are available, round tripping is not significant, accounting for less than 5% of
inward investment, but for the other half, it plays a larger role in their inward FDI.
Figure 5: Inward FDI positions by ultimate investing country, at end 2017
5.1. Major ultimate versus immediate investors
5.2. Share of round-tripping in total inward FDI
0% 6% 12% 18%
United States
United Kingdom
Germany
Japan
Canada
France
Netherlands
Switzerland
Ireland
Luxembourg
Ultimate Immediate15% 9%
Lithuania
9%
Czech Republic
8%
Germany
8%
Estonia
7%
Finland
7%
Italy
7%
France
4%
Poland
33%
Brazil
2%
United States
2%
Austria
1%
Iceland
0.3%
Hungary
0.002%
Turkey
Ireland
4%
Switzerland
Notes: At-end 2017 or latest available year. Figure 5.1 shows major ultimate versus immediate investors, as a share of total inward FDI positions of Austria, Brazil, Czech Republic, Estonia, France, Germany, Hungary, Iceland, Italy, Lithuania, Poland, Switzerland, Turkey and the United States. Figure 5.2 shows round tripping as a share of total inward FDI positions of each country. For Brazil, Switzerland and Turkey, equity positions are allocated to the ultimate counterparty while debt positons are allocated to the immediate counterparty. Source: Central Bank of Brazil, Central Statistics Office of Ireland, Central Bank of Turkey and OECD International Direct
Investment statistics database

Spotlight on FDI in OECD and G20 countries since the financial crisis
At-end 2017, stocks of OECD area outward and inward FDI were estimated at USD 22.9 trillion and
USD 20.1 trillion, representing respectively 46% and 40% of OECD area GDP, as compared to
respectively 37% and 30% in 2007. At-end 2017, OECD area outward and inward positions
represented respectively 79% and 65% of global FDI positions, while OECD area GDP represented
44% of global GDP compared to 52% in 2007.7 The present section will focus on the inward and
outward FDI and GDP of OECD and G20 economies in the 10 years since the global financial crisis
started in 2007.
Figure 6 shows inward and outward FDI positions of OECD and G20 countries as a share of global
inward and outward FDI respectively. Figure 7 shows OECD and G20 countries GDP as a share of
global GDP.
Most OECD countries accounted for a smaller share of global GDP in 2017 than they had in 2007 at
the start of the financial crisis, with the exceptions of Turkey, Ireland, Poland and Israel. The largest
decreases (relative to their share of GDP in 2007) were in Greece, Spain, Italy, Norway, Portugal,
Japan and Finland. In contrast, some of the non-OECD members of the G20 accounted for a larger
share as they grew more quickly than the OECD countries; China had the largest increase, followed
by India, Indonesia, and Saudi Arabia.
Given the diverging rates of growth between OECD countries and these large, emerging economies,
it is not surprising that these countries saw an increase in their share of global inward FDI positions
while most OECD countries’ share of global inward FDI stocks decreased between 2007 and 2017.
Within the OECD area, Chile, Ireland, Switzerland and the United States were exceptions, but, for
these latter three, some of the increase was due to financial and corporate restructuring within MNEs.
Some of the non-OECD G20 countries have also become more important outward investors,
particularly China which increased its share of global outward FDI from less than 1% to 5%. India,
Indonesia, Saudi Arabia and South Africa also increased their share of global outward FDI. In
contrast, most OECD countries’ share of global outward FDI decreased except for Chile, the Czech
Republic, Ireland, Japan, Korea, Luxembourg, Mexico, the Netherlands, Poland, Switzerland and
Turkey.
Despite these changes, several OECD countries continue to account for larger shares of inward and
outward FDI than of GDP, indicating that they remain among the more financially integrated
economies in the world. For inward, these countries include Australia, Austria, Belgium, Canada,
Chile, the Czech Republic, Denmark, Estonia, Finland, France, Hungary, Iceland, Ireland, Israel,
Latvia, Luxembourg, the Netherlands, New Zealand, Norway, Portugal, Spain, Sweden, Switzerland,
the United Kingdom and the United States. For outward, these countries include Australia, Austria,
Belgium, Canada, Chile, Denmark, Finland, France, Germany, Iceland, Ireland, Israel, Japan,
Luxembourg, the Netherlands, Norway, Spain, Sweden, Switzerland, the United Kingdom and the
United States. In contrast, all non OECD G20 economies account for smaller shares of inward and
outward FDI than of GDP.
7 Source : Author calculations using GDP at current prices and current purchasing power parities from the OECD Annual
National Accounts database and the IMF World Economic Outlook database
4
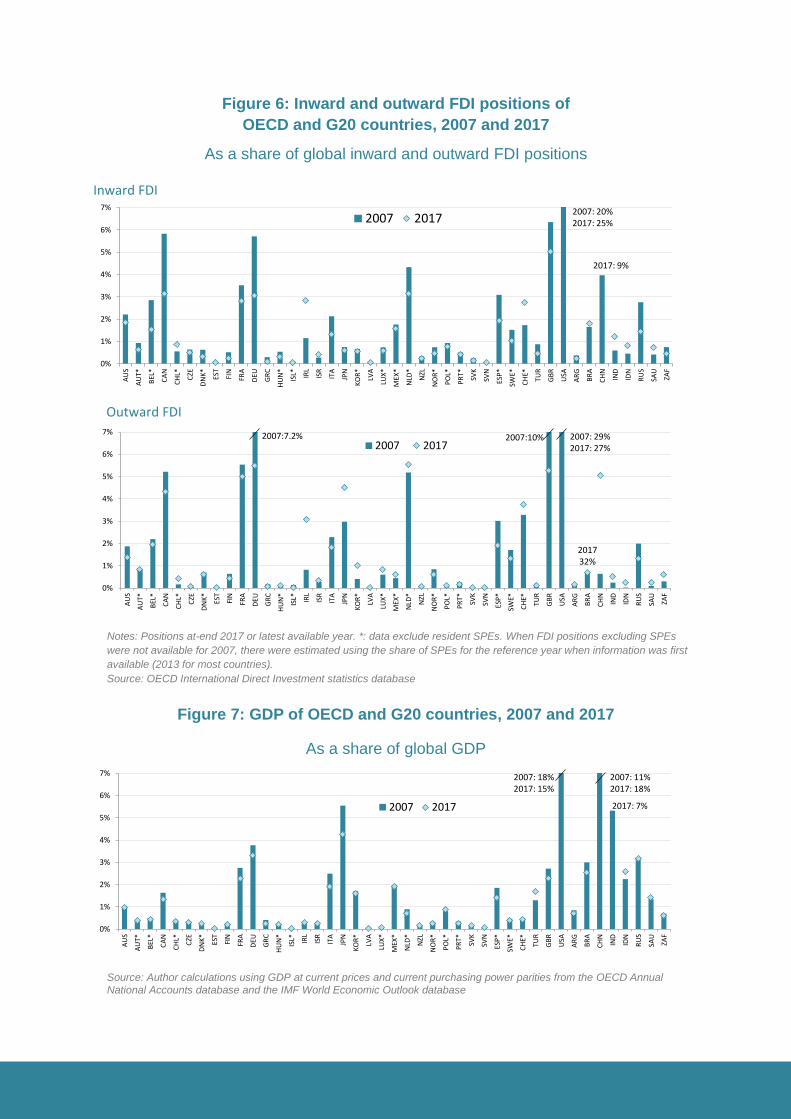
Figure 6: Inward and outward FDI positions of
OECD and G20 countries, 2007 and 2017
As a share of global inward and outward FDI positions
Figure 7: GDP of OECD and G20 countries, 2007 and 2017
As a share of global GDP
0%
1%
2%
3%
4%
5%
6%
7%
AU
S
AU
T*
BEL
*
CA
N
CH
L*
CZE
DN
K*
EST
FIN
FRA
DEU
GR
C
HU
N*
ISL* IR
L
ISR
ITA
JPN
KO
R*
LVA
LUX
*
MEX
*
NLD
*
NZL
NO
R*
PO
L*
PR
T*
SVK
SVN
ESP
*
SWE*
CH
E*
TUR
GB
R
USA
AR
G
BR
A
CH
N
IND
IDN
RU
S
SAU
ZAF
2007 20172007: 20%2017: 25%
2017: 9%
0%
1%
2%
3%
4%
5%
6%
7%
AU
S
AU
T*
BEL
*
CA
N
CH
L*
CZE
DN
K*
EST
FIN
FRA
DEU
GR
C
HU
N*
ISL* IR
L
ISR
ITA
JPN
KO
R*
LVA
LUX
*
MEX
*
NLD
*
NZL
NO
R*
PO
L*
PR
T*
SVK
SVN
ESP
*
SWE*
CH
E*
TUR
GB
R
USA
AR
G
BR
A
CH
N
IND
IDN
RU
S
SAU
ZAF
2007 20172007: 29%2017: 27%
201732%
2007:10%2007:7.2%
0%
1%
2%
3%
4%
5%
6%
7%
AU
S
AU
T*
BEL
*
CA
N
CH
L*
CZE
DN
K*
EST
FIN
FRA
DEU
GR
C
HU
N*
ISL* IR
L
ISR
ITA
JPN
KO
R*
LVA
LUX
*
MEX
*
NLD
*
NZL
NO
R*
PO
L*
PR
T*
SVK
SVN
ESP
*
SWE*
CH
E*
TUR
GB
R
USA
AR
G
BR
A
CH
N
IND
IDN
RU
S
SAU
ZAF
2007 2017
2007: 18%2017: 15%
2017: 7%
2007: 11%2017: 18%
Source: Author calculations using GDP at current prices and current purchasing power parities from the OECD Annual
National Accounts database and the IMF World Economic Outlook database
Notes: Positions at-end 2017 or latest available year. *: data exclude resident SPEs. When FDI positions excluding SPEs
were not available for 2007, there were estimated using the share of SPEs for the reference year when information was first
available (2013 for most countries).
Source: OECD International Direct Investment statistics database
Inward FDI
Outward FDI
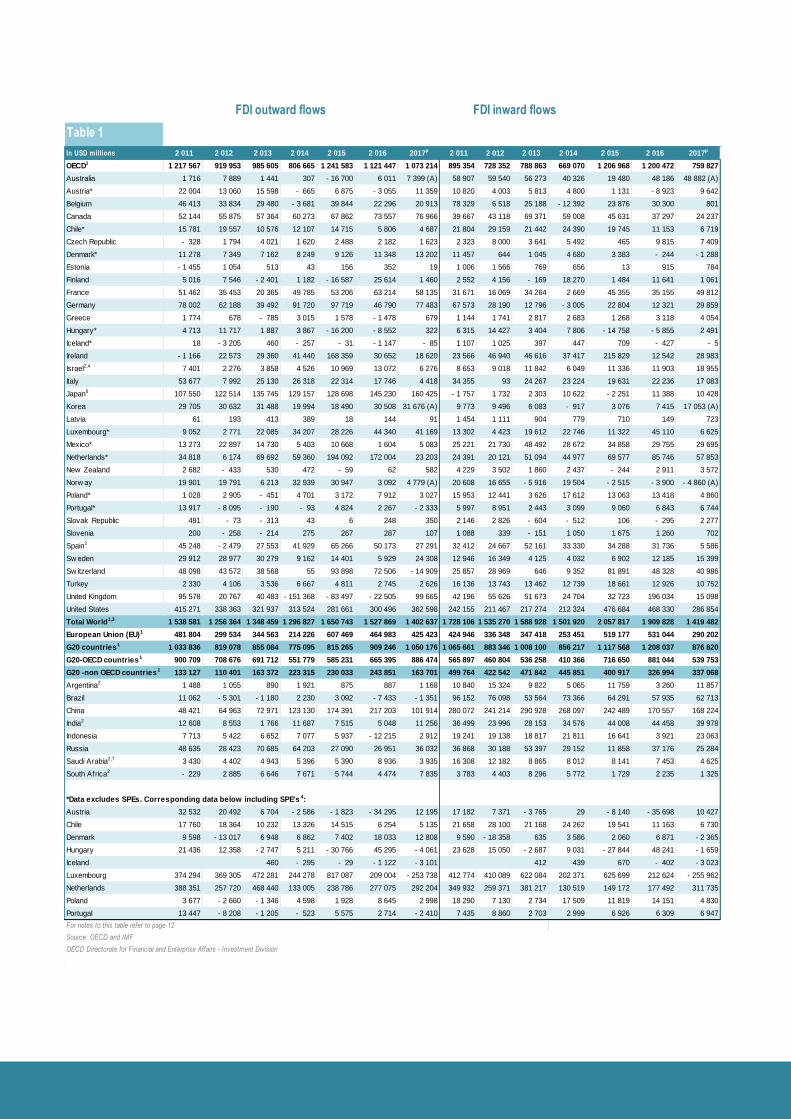
Table 1
In USD millions 2 011 2 012 2 013 2 014 2 015 2 016 2017p 2 011 2 012 2 013 2 014 2 015 2 016 2017p
OECD1 1 217 567 919 953 985 605 806 665 1 241 583 1 121 447 1 073 214 895 354 728 352 788 863 669 070 1 206 968 1 200 472 759 827
Australia 1 716 7 889 1 441 307 - 16 700 6 011 7 399 (A) 58 907 59 540 56 273 40 326 19 480 48 186 48 882 (A)
Austria* 22 004 13 060 15 598 - 665 6 875 - 3 055 11 359 10 820 4 003 5 813 4 800 1 131 - 8 923 9 642
Belgium 46 413 33 834 29 480 - 3 681 39 844 22 296 20 913 78 329 6 518 25 188 - 12 392 23 876 30 300 801
Canada 52 144 55 875 57 364 60 273 67 862 73 557 76 966 39 667 43 118 69 371 59 008 45 631 37 297 24 237
Chile* 15 781 19 557 10 576 12 107 14 715 5 806 4 687 21 804 29 159 21 442 24 390 19 745 11 153 6 719
Czech Republic - 328 1 794 4 021 1 620 2 488 2 182 1 623 2 323 8 000 3 641 5 492 465 9 815 7 409
Denmark* 11 278 7 349 7 162 8 249 9 126 11 348 13 202 11 457 644 1 045 4 680 3 383 - 244 - 1 288
Estonia - 1 455 1 054 513 43 156 352 19 1 006 1 566 769 656 13 915 784
Finland 5 016 7 546 - 2 401 1 182 - 16 587 25 614 1 460 2 552 4 156 - 169 18 270 1 484 11 641 1 061
France 51 462 35 453 20 365 49 785 53 206 63 214 58 135 31 671 16 069 34 264 2 669 45 355 35 155 49 812
Germany 78 002 62 188 39 492 91 720 97 719 46 790 77 483 67 573 28 190 12 796 - 3 005 22 804 12 321 29 859
Greece 1 774 678 - 785 3 015 1 578 - 1 478 679 1 144 1 741 2 817 2 683 1 268 3 118 4 054
Hungary* 4 713 11 717 1 887 3 867 - 16 200 - 8 552 322 6 315 14 427 3 404 7 806 - 14 758 - 5 855 2 491
Iceland* 18 - 3 205 460 - 257 - 31 - 1 147 - 85 1 107 1 025 397 447 709 - 427 - 5
Ireland - 1 166 22 573 29 360 41 440 168 359 30 652 18 620 23 566 46 940 46 616 37 417 215 829 12 542 28 983
Israel2,4 7 401 2 276 3 858 4 526 10 969 13 072 6 276 8 653 9 018 11 842 6 049 11 336 11 903 18 955
Italy 53 677 7 992 25 130 26 318 22 314 17 746 4 418 34 355 93 24 267 23 224 19 631 22 236 17 083
Japan6 107 550 122 514 135 745 129 157 128 698 145 230 160 425 - 1 757 1 732 2 303 10 622 - 2 251 11 388 10 428
Korea 29 705 30 632 31 488 19 994 18 490 30 508 31 676 (A) 9 773 9 496 6 083 - 917 3 076 7 415 17 053 (A)
Latvia 61 193 413 389 18 144 91 1 454 1 111 904 779 710 149 723
Luxembourg* 9 052 2 771 22 085 34 207 28 226 44 340 41 169 13 302 4 423 19 612 22 746 11 322 45 110 6 625
Mexico* 13 273 22 897 14 730 5 403 10 668 1 604 5 083 25 221 21 730 48 492 28 672 34 858 29 755 29 695
Netherlands* 34 818 6 174 69 692 59 360 194 092 172 004 23 203 24 391 20 121 51 094 44 977 69 577 85 746 57 853
New Zealand 2 682 - 433 530 472 - 59 62 582 4 229 3 502 1 860 2 437 - 244 2 911 3 572
Norw ay 19 901 19 791 6 213 32 939 30 947 3 092 4 779 (A) 20 608 16 655 - 5 916 19 504 - 2 515 - 3 900 - 4 860 (A)
Poland* 1 028 2 905 - 451 4 701 3 172 7 912 3 027 15 953 12 441 3 626 17 612 13 063 13 418 4 860
Portugal* 13 917 - 8 095 - 190 - 93 4 824 2 267 - 2 333 5 997 8 951 2 443 3 099 9 060 6 843 6 744
Slovak Republic 491 - 73 - 313 43 6 248 350 2 146 2 826 - 604 - 512 106 - 295 2 277
Slovenia 200 - 258 - 214 275 267 287 107 1 088 339 - 151 1 050 1 675 1 260 702
Spain2 45 248 - 2 479 27 553 41 929 65 266 50 173 27 291 32 412 24 667 52 161 33 330 34 288 31 736 5 586
Sw eden 29 912 28 977 30 279 9 162 14 401 5 929 24 308 12 946 16 349 4 125 4 032 6 902 12 185 15 399
Sw itzerland 48 098 43 572 38 568 55 93 898 72 506 - 14 909 25 857 28 969 646 9 352 81 891 48 328 40 986
Turkey 2 330 4 106 3 536 6 667 4 811 2 745 2 626 16 136 13 743 13 462 12 739 18 661 12 926 10 752
United Kingdom 95 578 20 767 40 483 - 151 368 - 83 497 - 22 505 99 665 42 196 55 626 51 673 24 704 32 723 196 034 15 098
United States 415 271 338 363 321 937 313 524 281 661 300 496 362 598 242 155 211 467 217 274 212 324 476 684 468 330 286 854
Total World1,3 1 538 581 1 256 364 1 348 459 1 296 827 1 650 743 1 527 869 1 402 637 1 728 106 1 535 270 1 588 928 1 501 920 2 057 817 1 909 828 1 419 482
European Union (EU)1 481 804 299 534 344 563 214 226 607 469 464 983 425 423 424 946 336 348 347 418 253 451 519 177 531 044 290 202
G20 countries1 1 033 836 819 078 855 084 775 095 815 265 909 246 1 050 176 1 065 661 883 346 1 008 100 856 217 1 117 568 1 208 037 876 820
G20-OECD countries1 900 709 708 676 691 712 551 779 585 231 665 395 886 474 565 897 460 804 536 258 410 366 716 650 881 044 539 753
G20 -non OECD countries 1 133 127 110 401 163 372 223 315 230 033 243 851 163 701 499 764 422 542 471 842 445 851 400 917 326 994 337 068
Argentina2 1 488 1 055 890 1 921 875 887 1 168 10 840 15 324 9 822 5 065 11 759 3 260 11 857
Brazil 11 062 - 5 301 - 1 180 2 230 3 092 - 7 433 - 1 351 96 152 76 098 53 564 73 366 64 291 57 935 62 713
China 48 421 64 963 72 971 123 130 174 391 217 203 101 914 280 072 241 214 290 928 268 097 242 489 170 557 168 224
India2 12 608 8 553 1 766 11 687 7 515 5 048 11 256 36 499 23 996 28 153 34 576 44 008 44 458 39 978
Indonesia 7 713 5 422 6 652 7 077 5 937 - 12 215 2 912 19 241 19 138 18 817 21 811 16 641 3 921 23 063
Russia 48 635 28 423 70 685 64 203 27 090 26 951 36 032 36 868 30 188 53 397 29 152 11 858 37 176 25 284
Saudi Arabia2,7 3 430 4 402 4 943 5 396 5 390 8 936 3 935 16 308 12 182 8 865 8 012 8 141 7 453 4 625
South Africa2 - 229 2 885 6 646 7 671 5 744 4 474 7 835 3 783 4 403 8 296 5 772 1 729 2 235 1 325
*Data excludes SPEs. Corresponding data below including SPE's 4:
Austria 32 532 20 492 6 704 - 2 586 - 1 823 - 34 295 12 195 17 182 7 371 - 3 765 29 - 8 140 - 35 698 10 427
Chile 17 760 18 364 10 232 13 326 14 515 6 254 5 135 21 658 28 100 21 168 24 262 19 541 11 163 6 730
Denmark 9 598 - 13 017 6 948 6 862 7 402 18 033 12 808 9 590 - 18 358 635 3 586 2 060 6 871 - 2 365
Hungary 21 436 12 358 - 2 747 5 211 - 30 766 45 295 - 4 061 23 628 15 050 - 2 687 9 031 - 27 844 48 241 - 1 659
Iceland 460 - 295 - 29 - 1 122 - 3 101 412 439 670 - 402 - 3 023
Luxembourg 374 294 369 305 472 281 244 278 817 087 209 004 - 253 738 412 774 410 089 622 084 202 371 625 699 212 624 - 255 962
Netherlands 388 351 257 720 468 440 133 005 238 786 277 075 292 204 349 932 259 371 381 217 130 519 149 172 177 492 311 735
Poland 3 677 - 2 660 - 1 346 4 598 1 928 8 645 2 998 18 290 7 130 2 734 17 509 11 819 14 151 4 830
Portugal 13 447 - 8 208 - 1 205 - 523 5 575 2 714 - 2 410 7 435 8 860 2 703 2 999 6 926 6 309 6 947
For notes to this table refer to page 12
Source: OECD and IMF
OECD Directorate for Financial and Enterprise Affairs - Investment Division
FDI outward flows FDI inward flows

Table 2
2 015 2 016 2017p 2 015 2 016 2017p 2 015 2 016 2017p 2 015 2 016 2017p
OECD1 19 629 050 20 443 178 22 891 266 42.1 42.9 46.2 16 698 559 17 950 856 20 182 380 35.8 37.6 40.7
Australia 390 278 401 501 31.3 30.8 535 933 576 029 43.0 44.2
Austria* 210 530 206 186 248 272 55.1 52.8 59.7 164 897 154 199 192 802 43.2 39.5 46.3
Belgium* 590 438 568 673 129.7 121.5 524 095 475 046 115.1 101.5
Canada 1 097 053 1 251 958 70.3 81.5 796 651 974 227 51.1 63.4
Chile* 105 135 114 313 119 467 43.4 46.3 45.4 229 650 247 129 272 375 94.7 100.0 103.5
Czech Republic 18 591 19 426 23 908 10.0 9.9 11.1 116 628 121 855 155 111 62.4 62.4 71.9
Denmark* 168 880 176 000 56.1 57.3 91 482 97 116 30.4 31.6
Estonia 6 218 6 576 7 700 27.6 28.2 29.7 18 862 19 369 23 151 83.6 83.0 89.3
Finland 94 545 111 107 129 622 40.7 46.6 51.5 81 627 80 733 79 208 35.1 33.8 31.5
France 1 268 228 1 279 632 1 451 697 52.1 51.9 56.3 687 394 704 872 874 542 28.2 28.6 33.9
Germany 1 336 566 1 346 911 1 593 975 39.6 38.7 43.3 786 242 790 337 948 582 23.3 22.7 25.8
Greece 27 288 22 432 14.0 11.6 26 951 28 383 13.8 14.7
Hungary* 35 322 24 419 28 611 28.7 19.4 20.6 84 822 80 550 93 332 69.0 64.0 67.1
Iceland* 7 637 6 058 5 519 45.1 29.9 22.2 7 851 9 841 10 092 46.4 48.6 40.6
Ireland 909 668 841 981 899 500 313.0 276.2 276.2 888 221 842 910 880 178 305.6 276.5 270.3
Israel2,4 84 696 98 112 103 769 28.3 30.9 29.8 99 313 107 295 128 819 33.2 33.8 37.0
Italy 468 366 473 221 532 922 25.6 25.5 27.6 340 515 347 482 413 256 18.6 18.7 21.4
Japan 1 228 767 1 315 146 28.0 26.6 174 146 190 544 4.0 3.8
Korea* 276 100 296 641 20.0 21.0 168 923 174 979 12.2 12.4
Latvia 1 424 1 524 1 793 5.3 5.5 5.9 14 743 14 184 17 233 54.7 51.4 57.0
Luxembourg* 199 988 226 605 241 427 346.1 386.5 380.1 211 475 208 674 178 052 366.0 355.9 280.3
Mexico* 146 824 149 178 12.6 13.9 501 999 473 512 42.9 44.0
Netherlands* 1 229 815 1 397 758 1 604 921 162.2 179.8 194.8 739 274 832 632 974 730 97.5 107.1 118.3
New Zealand 17 026 16 740 18 044 9.7 9.1 9.0 66 605 70 403 76 412 37.9 38.1 38.0
Norw ay* 172 432 178 314 44.6 48.1 147 487 147 359 38.1 39.7
Poland* 22 281 27 076 29 433 4.7 5.7 5.6 183 869 185 042 237 129 38.5 39.3 45.2
Portugal* 48 041 47 384 51 541 24.1 23.1 23.7 104 783 104 976 130 314 52.5 51.2 59.9
Slovak Republic 2 462 2 651 2.8 3.0 46 016 43 740 52.6 48.7
Slovenia 5 997 6 023 6 913 13.9 13.5 14.2 12 642 13 650 16 033 29.4 30.5 32.9
Spain* 466 260 492 051 38.9 39.8 516 344 519 870 596 944 43.1 42.0 45.5
Sw eden* 352 517 357 421 384 818 70.8 69.5 71.5 290 001 283 149 316 991 58.2 55.0 58.9
Sw itzerland* 1 038 853 1 088 413 152.9 162.8 763 551 856 902 112.4 128.1
Turkey 35 602 38 356 4.1 4.4 157 899 142 719 18.4 16.5
United Kingdom 1 557 448 1 491 974 1 531 704 54.0 56.3 58.4 1 408 010 1 475 525 1 563 889 48.8 55.7 59.6
United States 6 007 773 6 361 419 7 799 045 33.2 34.2 40.3 5 709 658 6 555 622 7 807 032 31.5 35.2 40.3
Total World1,3 24 844 653 26 383 380 29 055 342 33.4 35.0 36.9 26 385 733 28 515 392 31 118 568 35.5 37.8 39.5
European Union (EU)1 9 320 688 9 425 234 10 431 608 56.8 57.2 60.4 7 881 478 7 977 584 8 984 812 48.0 48.4 52.0
G20 countries1 15 800 510 16 791 932 18 960 585 27.2 28.3 30.5 15 591 911 17 125 608 19 131 519 26.9 28.9 30.7
G20-OECD countries1 13 813 006 14 405 936 16 393 002 35.2 35.8 39.4 11 267 371 12 405 848 14 154 928 28.7 30.8 34.0
G20 -non OECD countries 1 1 987 505 2 385 995 2 567 582 10.6 12.5 12.4 4 324 540 4 719 760 4 976 591 23.0 24.8 24.1
Argentina2 37 843 39 735 6.0 7.3 79 773 72 110 12.6 13.2
Brazil 184 909 201 767 10.3 11.2 429 842 563 291 23.8 31.4
China 1 095 909 1 357 390 1 472 982 10.0 12.1 12.3 2 696 344 2 755 147 2 901 446 24.5 24.5 24.3
India2 139 038 144 086 155 341 6.7 6.4 6.4 282 617 318 487 377 683 13.5 14.1 15.5
Indonesia 29 351 59 134 65 871 3.4 6.3 6.5 222 410 249 859 248 510 25.8 26.8 24.5
Russia 282 651 334 275 382 278 20.7 26.1 26.0 262 748 393 910 446 595 19.2 30.7 30.4
Saudi Arabia2 63 121 73 973 9.6 11.4 224 050 231 502 34.2 35.8
South Africa2 154 683 175 635 48.7 59.4 126 755 135 453 39.9 45.8
*Data excludes SPEs. Corresponding data below including SPE's 4:
Austria 291 068 254 943 299 825 76.2 65.2 72.1 243 403 204 946 251 197 63.7 52.4 60.4
Belgium 610 211 590 557 690 836 134.1 126.2 139.8 551 774 500 240 566 926 121.2 106.9 114.7
Chile 109 809 119 053 124 281 45.3 48.2 47.2 232 225 249 715 275 291 95.8 101.1 104.6
Denmark 189 334 202 578 62.8 66.0 112 894 124 266 37.5 40.5
Hungary 146 444 192 555 192 509 119.2 153.0 138.4 197 304 239 123 246 777 160.6 190.1 177.4
Iceland 11 079 9 519 5 914 65.5 47.0 23.8 11 293 13 302 10 485 66.7 65.6 42.2
Korea 276 153 296 690 20.0 21.0 169 659 175 350 12.3 12.4
Luxembourg 4 413 713 4 431 738 4 487 442 7 638.2 7 558.7 7 064.9 3 699 718 3 725 064 3 731 752 6 402.6 6 353.4 5 875.2
Netherlands 4 936 957 5 125 821 6 151 723 651.3 659.5 746.5 4 020 797 4 133 237 5 071 815 530.4 531.8 615.4
Norw ay 174 388 181 044 45.1 48.8 149 473 149 467 38.7 40.3
Poland 23 589 29 195 31 661 4.9 6.2 6.0 185 177 187 161 239 357 38.8 39.7 45.6
Portugal 57 085 55 976 60 980 28.6 27.3 28.0 118 078 116 615 143 640 59.2 56.8 66.0
Spain 492 514 527 272 597 264 41.1 42.6 45.5 543 899 552 472 644 430 45.4 44.7 49.1
Sw eden 369 409 372 917 402 195 74.2 72.5 74.7 311 934 300 747 335 962 62.6 58.5 62.4
Sw itzerland 1 136 649 1 196 781 1 272 414 167.3 179.0 186.9 886 726 985 724 1 060 321 130.5 147.4 155.8
For notes to this table refer to page 12
Source: OECD and IMF
OECD Directorate for Financial and Enterprise Affairs - Investment Division
FDI outward positions FDI inward positions
In USD million As a share of GDP (%) In USD million As a share of GDP (%)
12
Notes for tables 1 to 2
Data are updated as of 10 April 2018. p: preliminary data |: break in series
(A): asset/liability figure used for 2017 only
Tables 1 and 2 show FDI statistics at the aggregate level on a directional basis except for selected countries for which the asset/liability series is used (see note 2). Data for 2017 in Table 1 for Australia, Korea and Norway correspond to asset/liability figures, while data for earlier years correspond to directional figures. For more information on the two presentations for FDI, see Asset/liability versus directional presentation. FDI terms are defined in the FDI Glossary.
Financial flows consist of three components: equity capital, reinvestment of earnings, and intracompany debt. Equity capital is often associated with new investments, such as greenfield or M&As, even though it can also reflect extensions of capital or financial restructuring. Nevertheless, equity capital flows are often taken as a sign of the amount of new investments related to FDI. Reinvestment of earnings is the portion of earnings that the parent decides to reinvest in the affiliate rather than receive as a dividend and can be an important source of financing for affiliates. This component of financial flows tends to be the least volatile. Changes in the reinvestment of earnings reflect both changes in the earnings of affiliates and in the amount of earnings that parents choose to distribute. The reinvestment ratio is the share of earnings that the parent reinvests. It can be an indication of the parent’s perception of investment opportunities available to the affiliate: if the parent sees the opportunity to make profitable investments in its affiliates, the parent might choose to reinvest more money in them. However, many other factors can influence the share of earnings reinvested. For example, if the parent is in need of cash, they might pay higher dividends. The third component of financial flows—intracompany debt–is the most volatile component of financial flows and is often driven by the short term financing needs within a company rather than larger overall macroeconomic phenomena. As such, intracompany debt is often the most difficult aspect of financial flows to explain.
Breaks in series were introduced in Table 1 to provide users with more complete historical series on FDI financial flows. These breaks in series correspond for most countries to the implementation of OECD Benchmark Edition 4th Edition (BMD4) except for Germany, for which the whole data series is according to BMD4, and the breaks in series correspond to a different recording of transactions between fellow enterprises. Data used before the breaks in series correspond to unrevised BMD3 FDI aggregates.
For data going back to 2005 in tables 1 and 2,(in Excel format), see www.oecd.org/investment/statistics.htm.
1. OECD, European Union (EU28), World, G20 aggregates:
FDI outward and inward flows (Table 1) were compiled using directional figures when available. Missing quarterly directional figures were approximated using the ratio between annual asset liability and directional figures; or by distributing annual directional figures equally among the four quarters; or using unrevised historical data. When directional figures were not available and could not be approximated, asset liability figures were used.
FDI outward and inward stocks (Table 2) were compiled using directional figures when available. Missing directional figures were approximated using unrevised historical data. When directional figures were not available and could not be approximated, asset liability figures were used. Data for 2017 include positions at end-2017 or at-end 2016 when 2017 data are not available.
Resident SPEs from Austria, Belgium (FDI positions only), Chile, Denmark, Hungary, Iceland, Korea (FDI positions only), Luxembourg, Mexico, the Netherlands, Norway (FDI positions only), Poland, Portugal, Spain (FDI positions only), Sweden (FDI positions only) and Switzerland (FDI positions only) are excluded.
The European Union aggregate corresponds to member country composition of the reporting period: EU15 for data up to and including 2003, EU25 for data between 2004 and 2006, EU27 for data between 2007 and 2012 and EU28 starting from 2013.
2. Data series on asset/liability basis: The data series is on an asset/liability basis as opposed to directional basis for Israel and Spain (Table 1 only) and for the following non-OECD countries: Argentina, India, Saudi Arabia and South Africa.
3. World aggregate: is based on available data at the time of update as reported to the OECD and IMF. Missing data for countries for Q3 and Q4 2017 were estimated using the overall growth rate observed between, respectively, Q2 2017 and Q3 2017 and Q3 2017 and Q4 2017. Growth rates were calculated from data for OECD countries, for non-OECD G20 countries, and for 50 non-OECD and non-G20 countries in Q3 and 15 non-OECD and non-G20 countries in Q4. World totals for FDI positions are based on available FDI data at the time of update as reported to OECD and IMF for the year ended or the latest available year. By definition, inward and outward FDI worldwide should be equal. However, in practice, there are statistical discrepancies between inward and outward FDI. Unless otherwise specified, references to “global FDI flows” refer to the average of these two figures.
4. Special purpose entities (SPEs): Information on resident SPEs for Estonia and Sweden (FDI flows only) is confidential. This information is not yet available separately for Canada, Ireland and Mexico. The information is available separately for Austria, Chile, Denmark, Hungary, Iceland, Korea, Luxembourg, the Netherlands, Norway, Poland, Portugal, Spain, Sweden, Switzerland and the United Kingdom. However, the information is not displayed in the tables for all countries, due to limited availability of historical data or to differences in data vintages. Resident SPEs are not present or not significant in Australia, the Czech Republic, Finland, France, Germany, Greece, Israel, Italy, Japan, New Zealand, the Slovak Republic, Slovenia, Turkey, and the United States.
5. The statistical data for Israel are supplied by and under the responsibility of the relevant Israeli authorities. The use of such data by the OECD is without prejudice to the status of the Golan Heights, East Jerusalem and Israeli settlements in the West Bank under the terms of international law.
6. Directional flows for Japan: only annual data reflect annual revisions, so the sum of quarters may not add up to the annual data.
7. Data for 2017 Saudi Arabia corresponds to the first three quarters of the year.
FDI in Figures is published twice yearly. For queries, please contact [email protected]. Find data and more detailed
FDI statistics at www.oecd.org/investment/statistics.htm.
To receive news and e-alerts about OECD work on international investment, follow the subscription procedure at
www.oecd.org/investment/investmentnews.htm.
© OECD 2018
This work is published on the responsibility of the Secretary-General of the OECD. The opinions expressed and arguments employed herein do not necessarily reflect the official views of OECD member countries. This document and any map included herein are without prejudice to the status of or sovereignty over any territory, to the delimitation of international frontiers and boundaries and to the name of any territory, city or area.