
Odessa: Enabling Interactive Perception Applications on...
14
Odessa: Enabling Interactive Perception Applications on Mobile Devices * Moo-Ryong Ra * , Anmol Sheth † , Lily Mummert † , Padmanabhan Pillai † , David Wetherall †‡ and Ramesh Govindan * University of Southern California * Intel Labs † University of Washington ‡ ABSTRACT Resource constrained mobile devices need to leverage computa- tion on nearby servers to run responsive applications that recog- nize objects, people, or gestures from real-time video. The two key questions that impact performance are what computation to of- fload, and how to structure the parallelism across the mobile device and server. To answer these questions, we develop and evaluate three interactive perceptual applications. We find that offloading and parallelism choices should be dynamic, even for a given appli- cation, as performance depends on scene complexity as well as en- vironmental factors such as the network and device capabilities. To this end we develop Odessa, a novel, lightweight, runtime that au- tomatically and adaptively makes offloading and parallelism deci- sions for mobile interactive perception applications. Our evaluation shows that the incremental greedy strategy of Odessa converges to an operating point that is close to an ideal offline partitioning. It provides more than a 3x improvement in application performance over partitioning suggested by domain experts. Odessa works well across a variety of execution environments, and is agile to changes in the network, device and application inputs. Categories and Subject Descriptors D.4.7 [Software]: Operating System—Organization and Design: Interactive Systems General Terms Design, Experiment, Measurement, Performance * This research was sponsored by the USC/CSULB METRANS Trans- portation Center and by the Army Research Laboratory under Cooperative Agreement Number W911NF-09-2-0053. The views and conclusions con- tained in this document are those of the authors and should not be inter- preted as representing the official policies, either expressed or implied, of the METRANS center, the Army Research Laboratory or the U.S. Gov- ernment. The U.S. Government is authorized to reproduce and distribute reprints for Government purposes notwithstanding any copyright notation hereon. In addition, the first author, Moo-Ryong Ra, was supported by An- nenberg Graduate Fellowship. Permission to make digital or hard copies of all or part of this work for personal or classroom use is granted without fee provided that copies are not made or distributed for profit or commercial advantage and that copies bear this notice and the full citation on the first page. To copy otherwise, to republish, to post on servers or to redistribute to lists, requires prior specific permission and/or a fee. MobiSys’11, June 28–July 1, 2011, Bethesda, Maryland, USA. Copyright 2011 ACM 978-1-4503-0643-0/11/06 ...$10.00. Keywords Offloading, Parallel Processing, Mobile Perception Application, Video Processing, Incremental Partitioning 1. INTRODUCTION As the processing, communication and sensing capabilities of mobile devices increase, a new class of mobile interactive per- ception applications is emerging. These applications use cameras and other high-data rate sensors to perform perception tasks, like face or object recognition, and enable natural human-machine in- terfaces and interactive augmented-reality experiences on mobile devices [16, 21]. For example, face recognition could be used by a social networking application that recognizes people as the user sweeps the camera across a crowded room; a gesture recognition based natural user interface could be used to control a media appli- cation running on the mobile device; and object and pose recogni- tion can be used by an augmented reality shopping application that overlays information about an object in the user’s hand. Interactive perception applications have a unique set of require- ments that stress the capabilities of mobile devices. First, inter- active applications require crisp response. For example, to feel responsive, an augmented reality application would need to dis- play results well under a second. Second, these applications require continuous processing of high data rate sensors such as cameras to maintain accuracy. For example, a low frame rate may miss inter- mediate object poses or human gestures. Third, the computer vision and machine learning algorithms used to process this data are com- pute intensive. For example, in one of the applications we study, extracting features from an image can take 7 seconds on a netbook. Finally, the performance of these algorithms is highly variable and depends on the content of the data, which can vary greatly. These requirements cannot be satisfied on today’s mobile devices alone. Even though the computing and communication capabilities of these platforms are improving, interactive perception applica- tions will continue to push platform limits as new, more accurate but more compute-intensive algorithms are developed. However, two techniques can help make mobile interactive perception a re- ality: offloading one or more of the compute-intensive application components to an Internet-connected server, and using parallelism on multi-core systems to improve responsiveness and accuracy of the applications. Fortunately, interactive perception applications can be structured for offloading, and provide considerable oppor- tunities to exploit parallel processing. In this paper, we describe 1 Author contact: [email protected], [email protected], [email protected], [email protected], [email protected], [email protected]
Transcript of Odessa: Enabling Interactive Perception Applications on...
Odessa: Enabling Interactive Perception Applicationson Mobile Devices ∗
Moo-Ryong Ra∗, Anmol Sheth†, Lily Mummert†, Padmanabhan Pillai†,David Wetherall†‡ and Ramesh Govindan∗
University of Southern California∗ Intel Labs† University of Washington‡
ABSTRACTResource constrained mobile devices need to leverage computa-tion on nearby servers to run responsive applications that recog-nize objects, people, or gestures from real-time video. The twokey questions that impact performance are what computation to of-fload, and how to structure the parallelism across the mobile deviceand server. To answer these questions, we develop and evaluatethree interactive perceptual applications. We find that offloadingand parallelism choices should be dynamic, even for a given appli-cation, as performance depends on scene complexity as well as en-vironmental factors such as the network and device capabilities. Tothis end we develop Odessa, a novel, lightweight, runtime that au-tomatically and adaptively makes offloading and parallelism deci-sions for mobile interactive perception applications. Our evaluationshows that the incremental greedy strategy of Odessa converges toan operating point that is close to an ideal offline partitioning. Itprovides more than a 3x improvement in application performanceover partitioning suggested by domain experts. Odessa works wellacross a variety of execution environments, and is agile to changesin the network, device and application inputs.
Categories and Subject DescriptorsD.4.7 [Software]: Operating System—Organization and Design:Interactive Systems
General TermsDesign, Experiment, Measurement, Performance
∗This research was sponsored by the USC/CSULB METRANS Trans-portation Center and by the Army Research Laboratory under CooperativeAgreement Number W911NF-09-2-0053. The views and conclusions con-tained in this document are those of the authors and should not be inter-preted as representing the official policies, either expressed or implied, ofthe METRANS center, the Army Research Laboratory or the U.S. Gov-ernment. The U.S. Government is authorized to reproduce and distributereprints for Government purposes notwithstanding any copyright notationhereon. In addition, the first author, Moo-Ryong Ra, was supported by An-nenberg Graduate Fellowship.
Permission to make digital or hard copies of all or part of this work forpersonal or classroom use is granted without fee provided that copies arenot made or distributed for profit or commercial advantage and that copiesbear this notice and the full citation on the first page. To copy otherwise, torepublish, to post on servers or to redistribute to lists, requires prior specificpermission and/or a fee.MobiSys’11, June 28–July 1, 2011, Bethesda, Maryland, USA.Copyright 2011 ACM 978-1-4503-0643-0/11/06 ...$10.00.
KeywordsOffloading, Parallel Processing, Mobile Perception Application, VideoProcessing, Incremental Partitioning
1. INTRODUCTIONAs the processing, communication and sensing capabilities of
mobile devices increase, a new class of mobile interactive per-ception applications is emerging. These applications use camerasand other high-data rate sensors to perform perception tasks, likeface or object recognition, and enable natural human-machine in-terfaces and interactive augmented-reality experiences on mobiledevices [16, 21]. For example, face recognition could be used bya social networking application that recognizes people as the usersweeps the camera across a crowded room; a gesture recognitionbased natural user interface could be used to control a media appli-cation running on the mobile device; and object and pose recogni-tion can be used by an augmented reality shopping application thatoverlays information about an object in the user’s hand.
Interactive perception applications have a unique set of require-ments that stress the capabilities of mobile devices. First, inter-active applications require crisp response. For example, to feelresponsive, an augmented reality application would need to dis-play results well under a second. Second, these applications requirecontinuous processing of high data rate sensors such as cameras tomaintain accuracy. For example, a low frame rate may miss inter-mediate object poses or human gestures. Third, the computer visionand machine learning algorithms used to process this data are com-pute intensive. For example, in one of the applications we study,extracting features from an image can take 7 seconds on a netbook.Finally, the performance of these algorithms is highly variable anddepends on the content of the data, which can vary greatly.
These requirements cannot be satisfied on today’s mobile devicesalone. Even though the computing and communication capabilitiesof these platforms are improving, interactive perception applica-tions will continue to push platform limits as new, more accuratebut more compute-intensive algorithms are developed. However,two techniques can help make mobile interactive perception a re-ality: offloading one or more of the compute-intensive applicationcomponents to an Internet-connected server, and using parallelismon multi-core systems to improve responsiveness and accuracy ofthe applications. Fortunately, interactive perception applicationscan be structured for offloading, and provide considerable oppor-tunities to exploit parallel processing. In this paper, we describe
1Author contact: [email protected], [email protected],[email protected], [email protected],[email protected], [email protected]
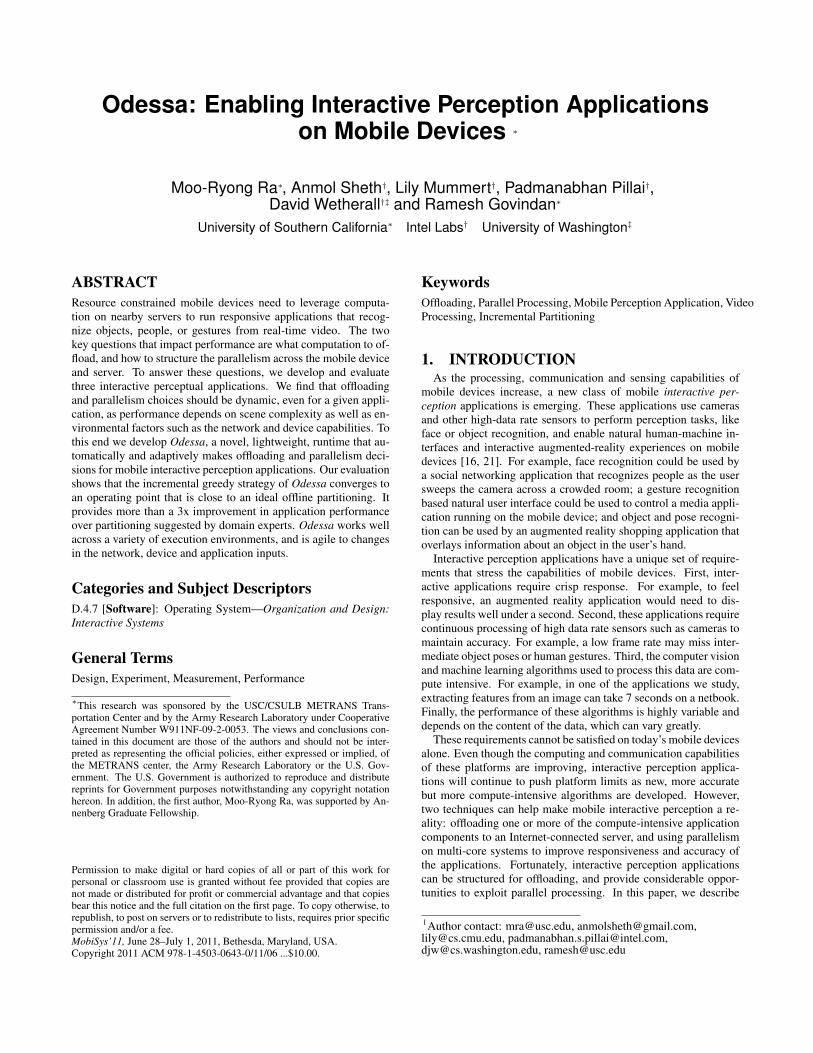
Sprout Mobile Device
Stages of Interactive Perception Application
Sprout Multi-Core Server
Input Video Stream
Network
Odessa
Stages of Interactive Perception Application
Figure 1: Overview of the Odessa runtime system.
a runtime called Odessa that automatically and adaptively deter-mines how best to use these techniques.
This paper makes three contributions. First, it provides an under-standing of the factors which contribute to the offloading and par-allelism decisions. We show through extensive experiments (Sec-tion 3) on three interactive perception applications that neither of-floading decisions nor the level of data or pipeline parallelism canbe determined statically and must be adapted at runtime. This is be-cause both responsiveness and accuracy change dramatically withinput variability, network bandwidth, and device characteristics atruntime. Our second contribution is the design of Odessa (Fig-ure 1, Section 4), a lightweight, adaptive runtime for mobile inter-active perception applications. To our knowledge, Odessa is thefirst work to explore the simultaneous adaptation of offloading andlevel of parallelism with the goal of jointly improving responsive-ness and accuracy. The key insight of our work is that the dynamicsand parallelism requirements of interactive perception applicationspreclude prior approaches that use offline profiling and optimiza-tion based partitioning [8, 9]; instead, a simpler greedy and incre-mental approach delivers good performance. Finally, we provideexperimental results (Section 5) on an implementation of Odessathat show more than 3x improvement in performance compared toa configuration by a domain expert, and comparable performance toan idealized offline configuration computation that assumes infiniteserver resources and complete offline performance profiling. Ourresults also show that Odessa works well across a variety of exe-cution environments, and is agile to changes in the network, deviceand application inputs.
Odessa is qualitatively different from prior work that uses net-worked computing infrastructure to enhance the capabilities of mo-bile devices. It is complementary to work on using offloading forconserving energy on the mobile device (e.g., MAUI [9]). More-over, it does not require prior information on application perfor-mance [9, 23] or a set of feasible candidate partitions [3, 8] to makeoffloading decisions.
2. BACKGROUNDIn this section, we describe the metrics and methods related to
adaptive offloading and parallelism, we describe the set of inter-
Application # of Stages Avg. Makespan& Frame Rate
Face Recognition 9 2.09 s, 2.50 fpsObject and Pose Recognition 15 15.8 s, 0.09 fpsGesture Recognition 17 2.54 s, 0.42 fps
Table 1: Table summarizes the data flow graph of the threecomputer vision applications along with average makespan andframe rate measured when the application is running locally onnetbook platform.
active perception applications studied, and then discuss Sprout, adistributed programming framework on which our system is based.
2.1 Metrics and Methods for AdaptationTwo measures of goodness characterize the responsiveness and
accuracy requirements of interactive perception applications.Makespan is the time taken to execute all stages of a data flow
graph for a single frame. The makespan is a measure of the re-sponsiveness of the application: a low makespan ensures fast com-pletion of a recognition task and thereby improves user satisfac-tion. Throughput is the rate at which frames are processed andis a measure of the accuracy of the application. A low frame ratemay miss intermediate object poses or human gestures. Any run-time system for interactive perception must simultaneously striveto minimize makespan and maximize throughput. In general, thelower the makespan and the higher the throughput the better, butthe applications can become unusable at makespans over a second,or throughput under 5 fps.
In adapting interactive perception applications on mobile, threetechniques can help improve makespan and throughput. Offloadingmoves the most computationally-intensive stages onto the server inorder to reduce makespan. Pipelining allows different stages of theapplication (whether running on the mobile device or the server) toprocess different frames in parallel, thereby increasing throughput.Increasing data-parallelism, in which frames are split into multiplesub-frames that are then processed in parallel (either on a multi-core mobile device or a server or cluster), can reduce the makespanby reducing the computation time of a stage. Data and pipelineparallelism provide great flexibility in the degree to which they areused. These techniques are not mutually exclusive: pipelining ispossible even when some stages are offloaded, and data-parallelexecution is possible on offloaded stages, etc.
The goal of Odessa is to decide when and to what degree to applythese techniques to improve both the makespan and throughput ofinteractive perception applications.
2.2 Interactive Perception ApplicationsWe use three qualitatively different interactive perception appli-
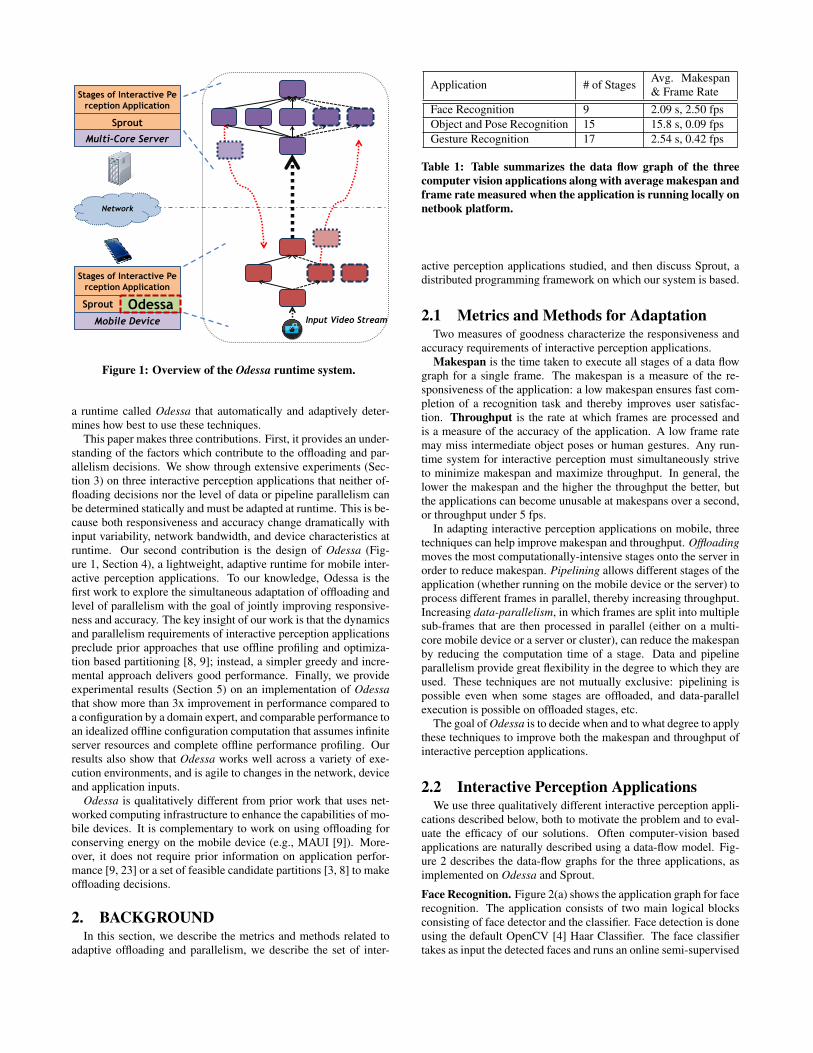
cations described below, both to motivate the problem and to eval-uate the efficacy of our solutions. Often computer-vision basedapplications are naturally described using a data-flow model. Fig-ure 2 describes the data-flow graphs for the three applications, asimplemented on Odessa and Sprout.
Face Recognition. Figure 2(a) shows the application graph for facerecognition. The application consists of two main logical blocksconsisting of face detector and the classifier. Face detection is doneusing the default OpenCV [4] Haar Classifier. The face classifiertakes as input the detected faces and runs an online semi-supervised
Source
Display
Copy
Tiler
Feature merger
Graph Spli7er
Reco. Merge
SIFT SIFT Detect
matcher Classify
(a) Face Recognition
Source
Display
Copy
Scaler
Tiler
Feature merger
Descaler
Feature spli5er
Match joiner
Cluster spli5er
Cluster joiner
RANSAC
SIFT SIFT
SIFT SIFT
SIFT
Model matcher Model matcher
Model matcher
Clustering Clustering
(b) Object and Pose Recog-nition
Source
Display
Copy
Scaler
Tiler
Feature merger
Descaler
Copy
Classify
Pair generator
SIFT SIFT
SIFT SIFT mo9onSIFT
Scaler
Tiler
Face merger
Descaler
SIFT SIFT
SIFT Face detect
Copy
(c) Gesture Recognition
Figure 2: Data flow graph for the three computer vision applications.
learning algorithm [17] to recognize the faces from a data set of 10people.
Object and Pose Recognition Figure 2(b) shows the data-flowgraph for the object instance and pose recognition application [26].The application consists of four main logical blocks. As shownin the figure, each image first passes through a proportional down-scaler. SIFT features [20] are then extracted from the image, andmatched against a set of previously constructed 3D models for theobjects of interest. The features for each object are then clusteredby position to separate distinct instances. A random sample con-sensus (RANSAC) algorithm with a non-linear optimization is usedto recognize each instance and estimate its 6D pose.
Gesture Recognition. Figure 2(c) shows the application graph fora gesture recognition application. Each video frame is sent to twoseparate tasks, face detection and motion extraction. The latter ac-cumulates frame pairs, and then extracts SIFT-like features that en-code optical flow in addition to appearance [6]. These features,filtered by the positions of detected faces, are aggregated over awindow of frames using a previously-generated codebook to createa histogram of occurrence frequencies. The histogram is treated asan input vector to a set of support vector machines trained for thecontrol gestures.
2.3 Sprout: A Parallel Processing FrameworkOdessa is built on Sprout [25], a distributed stream processing
system designed to make developing and executing parallel ap-plications as easy as possible by harnessing the compute powerof commodity multi-core machines. Unlike programming frame-works for parallelizing offline analysis of large data sets (MapRe-duce [10] and Dryad [15]), Sprout is designed to support contin-uous, online processing of high rate streaming data. Sprout’s ab-
stractions and runtime mechanisms, described below, are well-suitedto support the Odessa runtime system.
Programming Model. Applications in the Sprout framework arestructured as a data flow graphs; the data flow model is particularlywell suited for media processing applications that perform a seriesof operations to an input video or audio stream. The vertices ofthe graph are processing steps called stages and the edges are con-nectors which represent the data dependencies between the stages.Stages within an application employ a shared-nothing model: theyshare no state, and interact only through connectors. This restric-tion keeps the programming complexity of individual stages com-parable to that of sequential programming, and allows concurrencyto be managed by the Sprout runtime. This programming modelallows programmers to express coarse-grained application paral-lelism while hiding much of the complexity of parallel and dis-tributed programming from the application developer.
Automated data transfer. Sprout connectors define data depen-dencies and perform data transfer between processing stages. Theunderlying implementation of a connector depends on the loca-tion of the stage endpoints. If the connected stages are running inthe same process, the connector is implemented as an in-memoryqueue. Otherwise, a TCP connection is used. The Sprout runtimedetermines the connector type, and handles serialization and datatransport through connectors transparently. This allows a process-ing stage to be written in a way that is agnostic to whether it orrelated processing steps have been off-loaded.
Parallelism Support. The Sprout runtime supports coarse-graineddata parallelism and pipeline parallelism. Data parallelism is sup-ported by having multiple instances of a stage execute in parallel onseparate processor cores. Pipeline parallelism is supported by hav-
ing multiple frames be processed simultaneously by the differentprocessing stages of the application.
The relationship between Sprout and Odessa. Sprout providesprogrammers with mechanisms to dynamically adjust running ap-plications, change the degree of parallelism, and migrate process-ing stages between machines. In Odessa, we develop adaptive tech-niques for determining when and which stages to offload, and de-ciding how much pipelining and data-parallelism is necessary inorder to achieve low makespan and high throughput, and then lever-age the Sprout mechanisms to effect the changes.
3. FACTORS AFFECTING APPLICATIONPERFORMANCE
In this section we present experimental results that highlight howthe performance of interactive perception applications is impactedby multiple factors. We find that:
• Input variability, network bandwidth, and device characteristicscan impact offloading decisions significantly, so such decisionsmust be made adaptively and cannot be statically determined atcompile time.
• Once some stages have been offloaded, different choices for data-parallelism can lead to significantly different application perfor-mance, and the data-parallelism levels cannot be determined apriori.
• Finally, even with adaptive offloading and data-parallelism, astatic choice of pipeline-parallelism can lead to suboptimal makespanor leave the pipeline underutilized.
3.1 Experimental SetupHardware. Our experimental setup consists of two different mo-bile devices and a server. The two mobile devices are a netbookwith a single-core Atom processor (Intel N270 processor) runningat 1.4 GHz with hyper-threading turned off and 0.5 MB of cache,and a dual-core laptop with each core running at 1.8 GHz (IntelT5500 processor) that does not support hyper-threading and 2 MBof cache. The netbook is a surrogate for a future-generation smart-phone platform. To compare the two devices, we use the ratio ofthe sum of frequencies of all available CPU cores, which we callthe relative frequency ratio. The relative frequency ratio betweenthe two devices is 2.3x. The server is an eight core Intel Xeon pro-cessor with each core running at 2.13 GHz with 4 MB of cache.The relative frequency ratio between the server and the two mobiledevices is 12.2x and 4.7x for the netbook and laptop respectively.
Input data set. To ensure repeatability across different experi-mental runs, the input data for each of the three applications is asequence of frames captured offline in typical indoor lighting con-ditions at 30 fps at a resolution of 640x480 pixels per frame. Thedata set used for face recognition consists of 3000 frames in which10 people each walk up to the camera and make different facialexpressions. The input data set for pose detection consists of 500frames in which the user is holding a book in one hand and ma-nipulating the pose of the book while holding the camera pointedat the book with the other hand. The data for gesture-recognitionconsists of roughly 500 frames of a person sitting in front of thecamera performing the different gestures.
Network configurations. We emulate different network conditionsbetween the mobile device and networked server by varying the
Network ConfigurationLAN 100 MbpsWAN 20 ms 30 Mbps, 20 ms RTT, Loss rate 0%WAN 40 ms 30 Mbps, 40 ms RTT, Loss rate 0%LAN 802.11g 25 Mbps, Loss rate 0%, 1%, 2%LAN 802.11b 5.5 Mbps, Loss rate 0%, 1%, 2%3G 0.5 Mbps, 500 ms RTT, Loss rate 0%
Table 2: The ten different network conditions emulated byDummynet. The WAN bandwidths are symmetric and the RTTfor the LAN configurations were under a millisecond.
delay and bandwidth of the link using Dummynet [5]. The tendifferent emulated network conditions are summarized in Table 2.
Application profiler. A lightweight runtime profiler maintains thefollowing application execution metrics: execution time of eachstage, the amount of data that flows on the connector links and thenetwork delay time. The profiler also keeps track of the latency (ormakespan) and the frame rate of the application. We describe moredetails about the application profiler in Section 4.1.
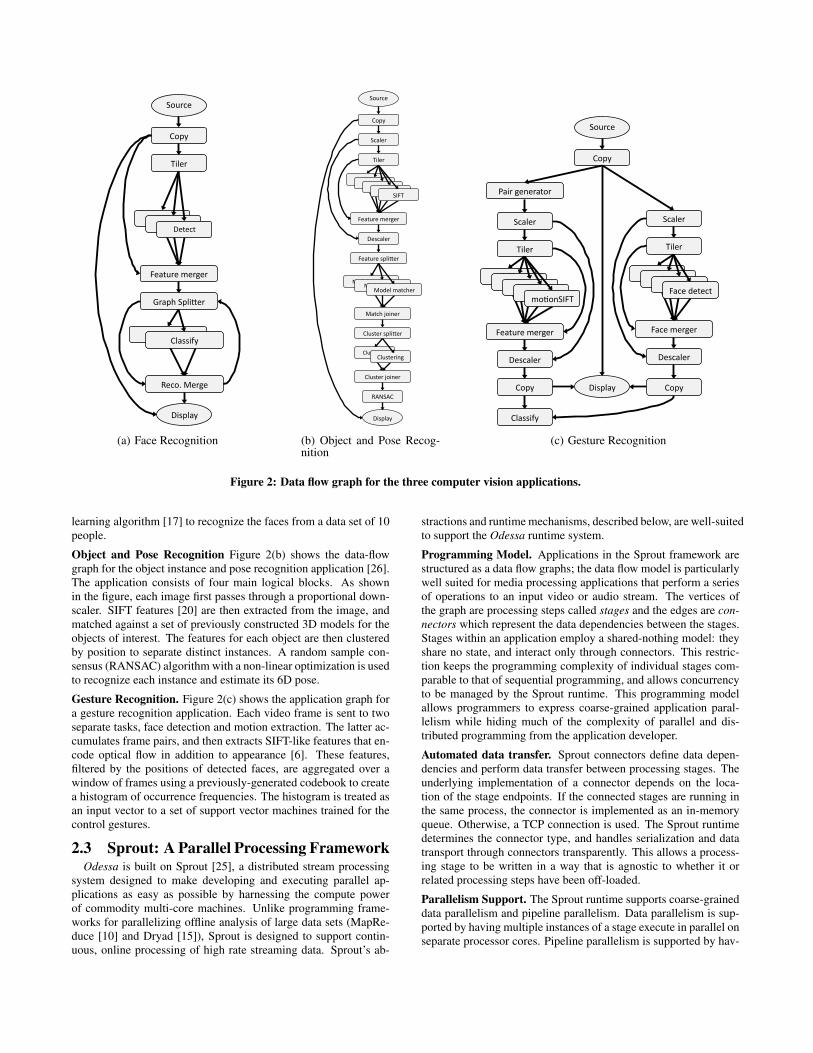
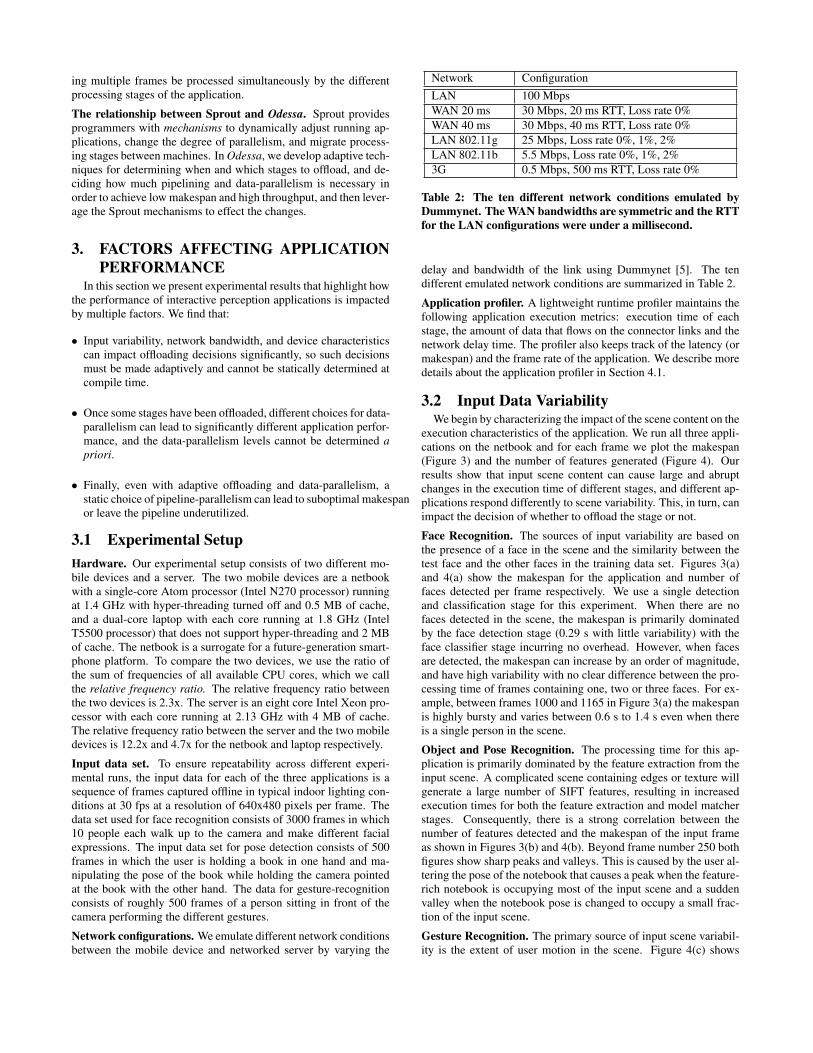
3.2 Input Data VariabilityWe begin by characterizing the impact of the scene content on the
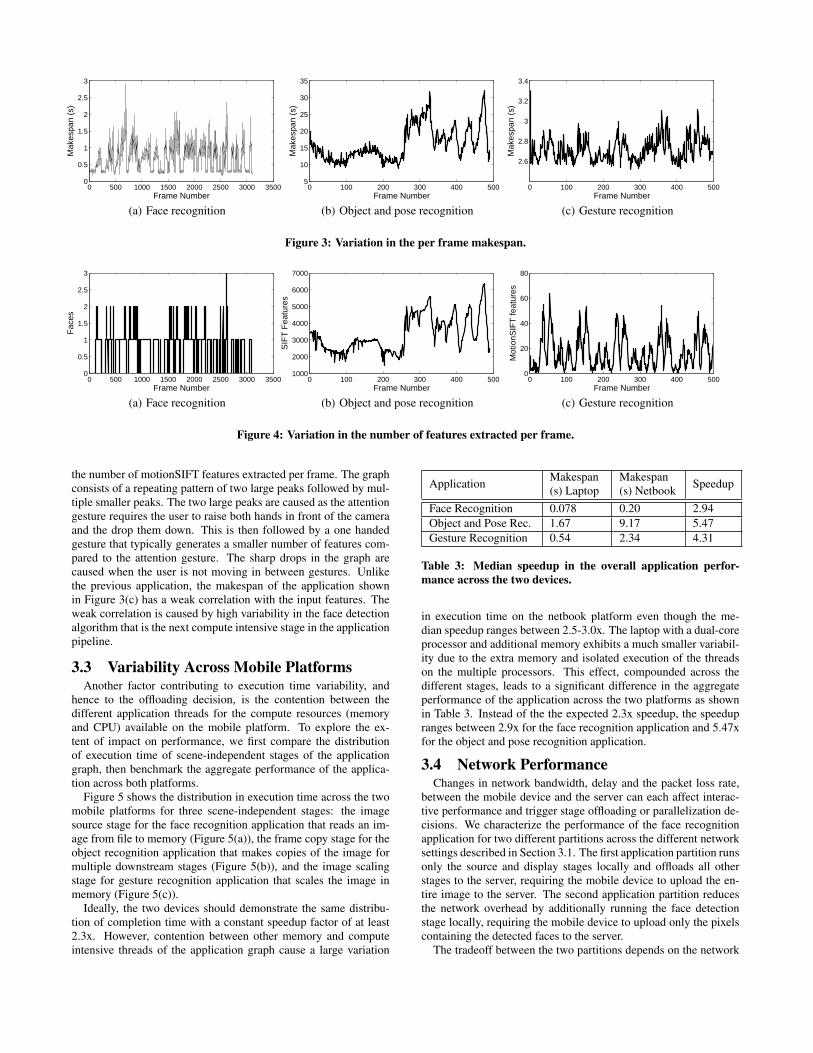
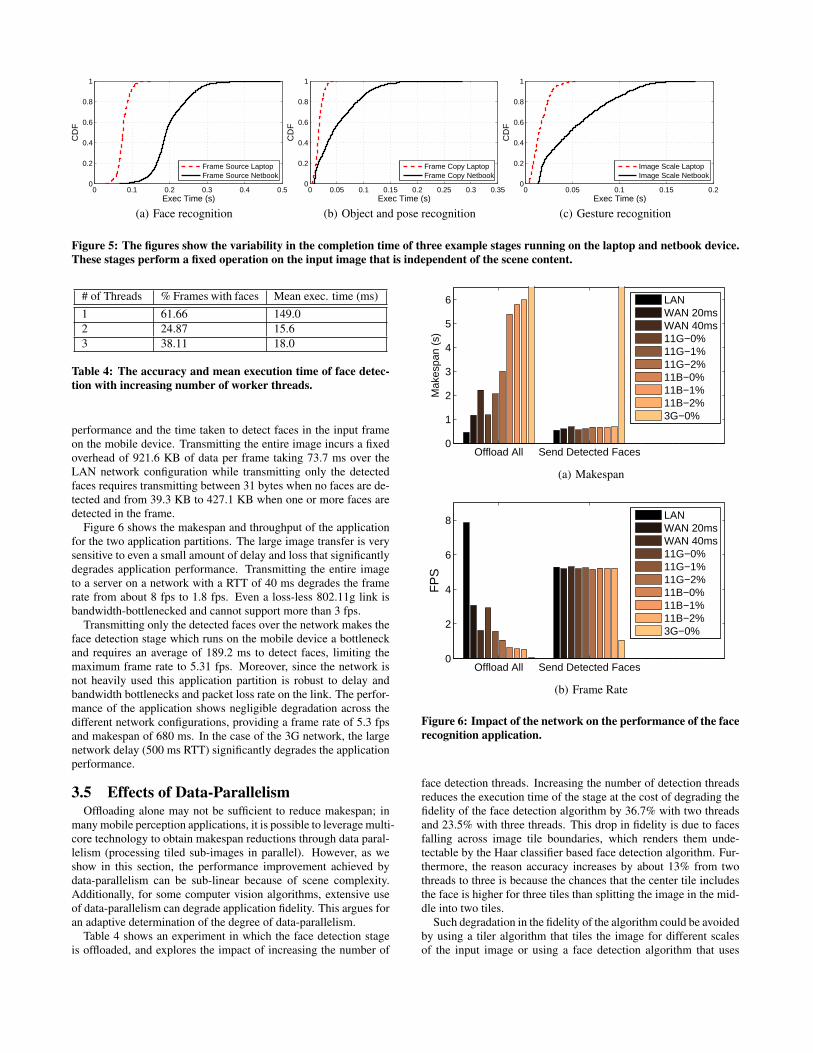
execution characteristics of the application. We run all three appli-cations on the netbook and for each frame we plot the makespan(Figure 3) and the number of features generated (Figure 4). Ourresults show that input scene content can cause large and abruptchanges in the execution time of different stages, and different ap-plications respond differently to scene variability. This, in turn, canimpact the decision of whether to offload the stage or not.
Face Recognition. The sources of input variability are based onthe presence of a face in the scene and the similarity between thetest face and the other faces in the training data set. Figures 3(a)and 4(a) show the makespan for the application and number offaces detected per frame respectively. We use a single detectionand classification stage for this experiment. When there are nofaces detected in the scene, the makespan is primarily dominatedby the face detection stage (0.29 s with little variability) with theface classifier stage incurring no overhead. However, when facesare detected, the makespan can increase by an order of magnitude,and have high variability with no clear difference between the pro-cessing time of frames containing one, two or three faces. For ex-ample, between frames 1000 and 1165 in Figure 3(a) the makespanis highly bursty and varies between 0.6 s to 1.4 s even when thereis a single person in the scene.
Object and Pose Recognition. The processing time for this ap-plication is primarily dominated by the feature extraction from theinput scene. A complicated scene containing edges or texture willgenerate a large number of SIFT features, resulting in increasedexecution times for both the feature extraction and model matcherstages. Consequently, there is a strong correlation between thenumber of features detected and the makespan of the input frameas shown in Figures 3(b) and 4(b). Beyond frame number 250 bothfigures show sharp peaks and valleys. This is caused by the user al-tering the pose of the notebook that causes a peak when the feature-rich notebook is occupying most of the input scene and a suddenvalley when the notebook pose is changed to occupy a small frac-tion of the input scene.
Gesture Recognition. The primary source of input scene variabil-ity is the extent of user motion in the scene. Figure 4(c) shows
0 500 1000 1500 2000 2500 3000 35000
0.5
1
1.5
2
2.5
3
Frame Number
Mak
espa
n (s
)
(a) Face recognition
0 100 200 300 400 5005
10
15
20
25
30
35
Frame Number
Mak
espa
n (s
)
(b) Object and pose recognition
0 100 200 300 400 500
2.6
2.8
3
3.2
3.4
Frame Number
Mak
espa
n (s
)
(c) Gesture recognition
Figure 3: Variation in the per frame makespan.
0 500 1000 1500 2000 2500 3000 35000
0.5
1
1.5
2
2.5
3
Frame Number
Fac
es
(a) Face recognition
0 100 200 300 400 5001000
2000
3000
4000
5000
6000
7000
Frame Number
SIF
T F
eatu
res
(b) Object and pose recognition
0 100 200 300 400 5000
20
40
60
80
Frame Number
Mot
ionS
IFT
feat
ures
(c) Gesture recognition
Figure 4: Variation in the number of features extracted per frame.
the number of motionSIFT features extracted per frame. The graphconsists of a repeating pattern of two large peaks followed by mul-tiple smaller peaks. The two large peaks are caused as the attentiongesture requires the user to raise both hands in front of the cameraand the drop them down. This is then followed by a one handedgesture that typically generates a smaller number of features com-pared to the attention gesture. The sharp drops in the graph arecaused when the user is not moving in between gestures. Unlikethe previous application, the makespan of the application shownin Figure 3(c) has a weak correlation with the input features. Theweak correlation is caused by high variability in the face detectionalgorithm that is the next compute intensive stage in the applicationpipeline.
3.3 Variability Across Mobile PlatformsAnother factor contributing to execution time variability, and
hence to the offloading decision, is the contention between thedifferent application threads for the compute resources (memoryand CPU) available on the mobile platform. To explore the ex-tent of impact on performance, we first compare the distributionof execution time of scene-independent stages of the applicationgraph, then benchmark the aggregate performance of the applica-tion across both platforms.
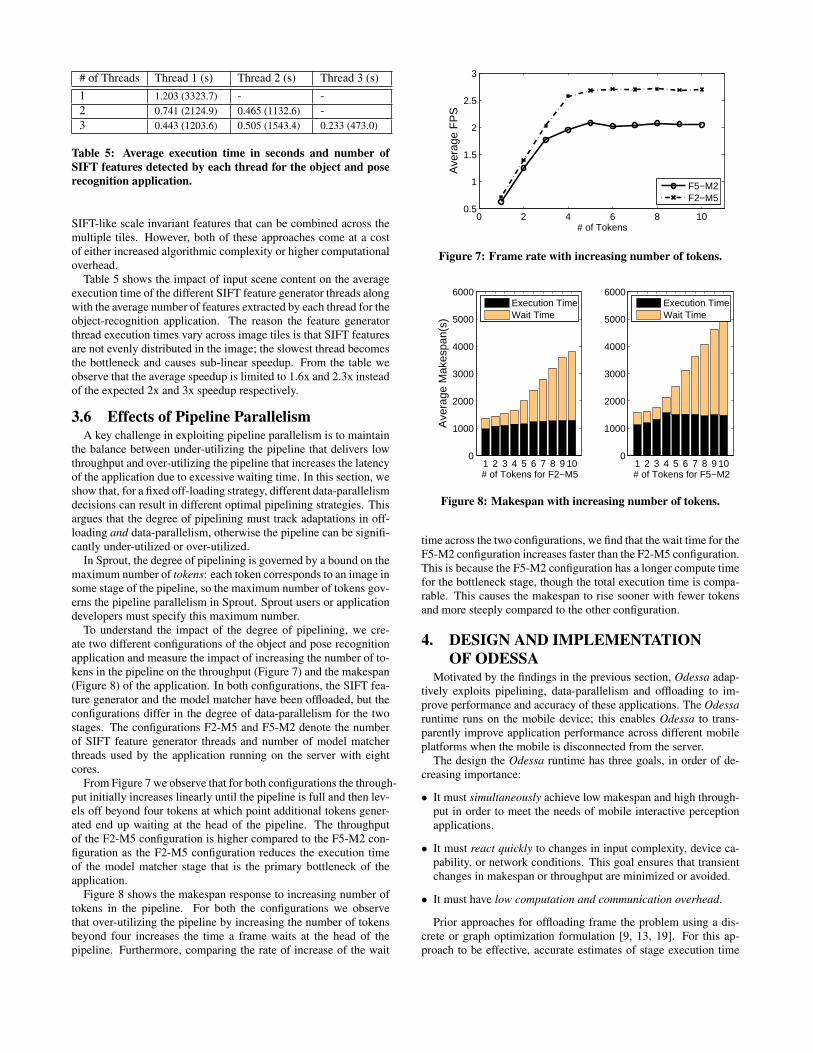
Figure 5 shows the distribution in execution time across the twomobile platforms for three scene-independent stages: the imagesource stage for the face recognition application that reads an im-age from file to memory (Figure 5(a)), the frame copy stage for theobject recognition application that makes copies of the image formultiple downstream stages (Figure 5(b)), and the image scalingstage for gesture recognition application that scales the image inmemory (Figure 5(c)).
Ideally, the two devices should demonstrate the same distribu-tion of completion time with a constant speedup factor of at least2.3x. However, contention between other memory and computeintensive threads of the application graph cause a large variation
Application Makespan(s) Laptop
Makespan(s) Netbook Speedup
Face Recognition 0.078 0.20 2.94Object and Pose Rec. 1.67 9.17 5.47Gesture Recognition 0.54 2.34 4.31
Table 3: Median speedup in the overall application perfor-mance across the two devices.
in execution time on the netbook platform even though the me-dian speedup ranges between 2.5-3.0x. The laptop with a dual-coreprocessor and additional memory exhibits a much smaller variabil-ity due to the extra memory and isolated execution of the threadson the multiple processors. This effect, compounded across thedifferent stages, leads to a significant difference in the aggregateperformance of the application across the two platforms as shownin Table 3. Instead of the the expected 2.3x speedup, the speedupranges between 2.9x for the face recognition application and 5.47xfor the object and pose recognition application.
3.4 Network PerformanceChanges in network bandwidth, delay and the packet loss rate,
between the mobile device and the server can each affect interac-tive performance and trigger stage offloading or parallelization de-cisions. We characterize the performance of the face recognitionapplication for two different partitions across the different networksettings described in Section 3.1. The first application partition runsonly the source and display stages locally and offloads all otherstages to the server, requiring the mobile device to upload the en-tire image to the server. The second application partition reducesthe network overhead by additionally running the face detectionstage locally, requiring the mobile device to upload only the pixelscontaining the detected faces to the server.
The tradeoff between the two partitions depends on the network
0 0.1 0.2 0.3 0.4 0.50
0.2
0.4
0.6
0.8
1
Exec Time (s)
CD
F
Frame Source LaptopFrame Source Netbook
(a) Face recognition
0 0.05 0.1 0.15 0.2 0.25 0.3 0.350
0.2
0.4
0.6
0.8
1
Exec Time (s)
CD
F
Frame Copy LaptopFrame Copy Netbook
(b) Object and pose recognition
0 0.05 0.1 0.15 0.20
0.2
0.4
0.6
0.8
1
Exec Time (s)
CD
F
Image Scale LaptopImage Scale Netbook
(c) Gesture recognition
Figure 5: The figures show the variability in the completion time of three example stages running on the laptop and netbook device.These stages perform a fixed operation on the input image that is independent of the scene content.
# of Threads % Frames with faces Mean exec. time (ms)1 61.66 149.02 24.87 15.63 38.11 18.0
Table 4: The accuracy and mean execution time of face detec-tion with increasing number of worker threads.
performance and the time taken to detect faces in the input frameon the mobile device. Transmitting the entire image incurs a fixedoverhead of 921.6 KB of data per frame taking 73.7 ms over theLAN network configuration while transmitting only the detectedfaces requires transmitting between 31 bytes when no faces are de-tected and from 39.3 KB to 427.1 KB when one or more faces aredetected in the frame.
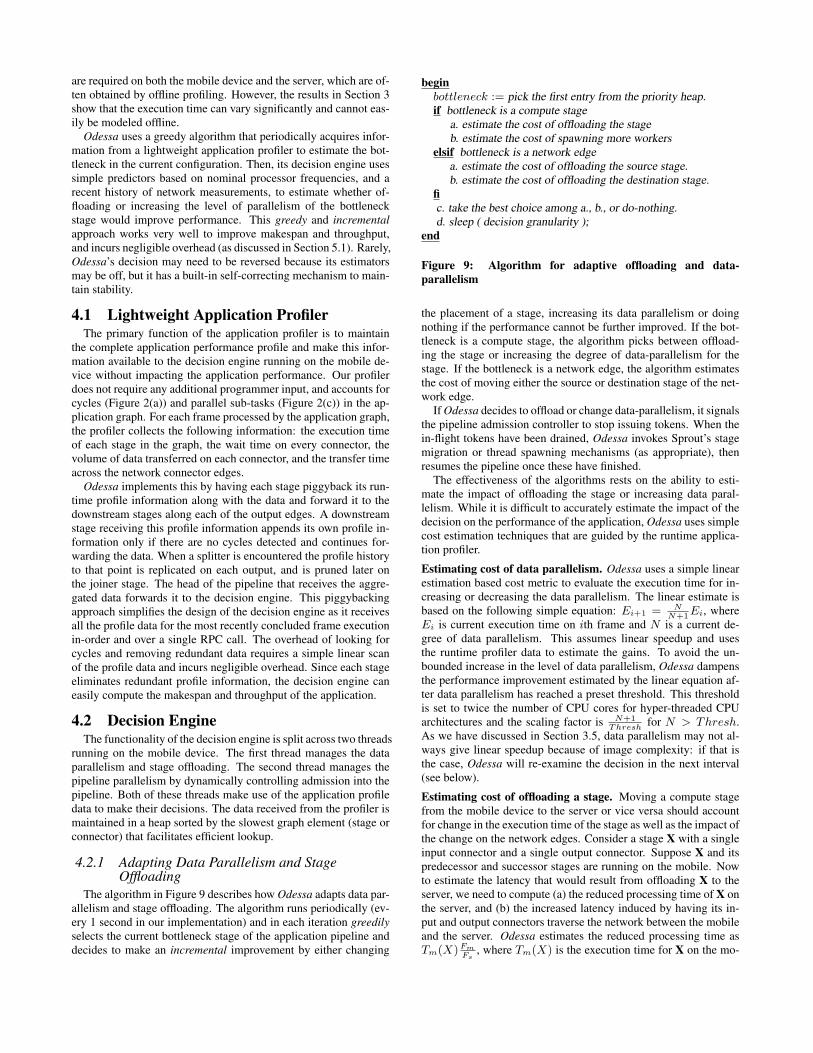
Figure 6 shows the makespan and throughput of the applicationfor the two application partitions. The large image transfer is verysensitive to even a small amount of delay and loss that significantlydegrades application performance. Transmitting the entire imageto a server on a network with a RTT of 40 ms degrades the framerate from about 8 fps to 1.8 fps. Even a loss-less 802.11g link isbandwidth-bottlenecked and cannot support more than 3 fps.
Transmitting only the detected faces over the network makes theface detection stage which runs on the mobile device a bottleneckand requires an average of 189.2 ms to detect faces, limiting themaximum frame rate to 5.31 fps. Moreover, since the network isnot heavily used this application partition is robust to delay andbandwidth bottlenecks and packet loss rate on the link. The perfor-mance of the application shows negligible degradation across thedifferent network configurations, providing a frame rate of 5.3 fpsand makespan of 680 ms. In the case of the 3G network, the largenetwork delay (500 ms RTT) significantly degrades the applicationperformance.
3.5 Effects of Data-ParallelismOffloading alone may not be sufficient to reduce makespan; in
many mobile perception applications, it is possible to leverage multi-core technology to obtain makespan reductions through data paral-lelism (processing tiled sub-images in parallel). However, as weshow in this section, the performance improvement achieved bydata-parallelism can be sub-linear because of scene complexity.Additionally, for some computer vision algorithms, extensive useof data-parallelism can degrade application fidelity. This argues foran adaptive determination of the degree of data-parallelism.
Table 4 shows an experiment in which the face detection stageis offloaded, and explores the impact of increasing the number of
Offload All Send Detected Faces0
1
2
3
4
5
6
Mak
espa
n (s
)
LANWAN 20msWAN 40ms11G−0%11G−1%11G−2%11B−0%11B−1%11B−2%3G−0%
(a) Makespan
Offload All Send Detected Faces0
2
4
6
8
FP
S
LANWAN 20msWAN 40ms11G−0%11G−1%11G−2%11B−0%11B−1%11B−2%3G−0%
(b) Frame Rate
Figure 6: Impact of the network on the performance of the facerecognition application.
face detection threads. Increasing the number of detection threadsreduces the execution time of the stage at the cost of degrading thefidelity of the face detection algorithm by 36.7% with two threadsand 23.5% with three threads. This drop in fidelity is due to facesfalling across image tile boundaries, which renders them unde-tectable by the Haar classifier based face detection algorithm. Fur-thermore, the reason accuracy increases by about 13% from twothreads to three is because the chances that the center tile includesthe face is higher for three tiles than splitting the image in the mid-dle into two tiles.
Such degradation in the fidelity of the algorithm could be avoidedby using a tiler algorithm that tiles the image for different scalesof the input image or using a face detection algorithm that uses
# of Threads Thread 1 (s) Thread 2 (s) Thread 3 (s)1 1.203 (3323.7) - -2 0.741 (2124.9) 0.465 (1132.6) -3 0.443 (1203.6) 0.505 (1543.4) 0.233 (473.0)
Table 5: Average execution time in seconds and number ofSIFT features detected by each thread for the object and poserecognition application.
SIFT-like scale invariant features that can be combined across themultiple tiles. However, both of these approaches come at a costof either increased algorithmic complexity or higher computationaloverhead.
Table 5 shows the impact of input scene content on the averageexecution time of the different SIFT feature generator threads alongwith the average number of features extracted by each thread for theobject-recognition application. The reason the feature generatorthread execution times vary across image tiles is that SIFT featuresare not evenly distributed in the image; the slowest thread becomesthe bottleneck and causes sub-linear speedup. From the table weobserve that the average speedup is limited to 1.6x and 2.3x insteadof the expected 2x and 3x speedup respectively.
3.6 Effects of Pipeline ParallelismA key challenge in exploiting pipeline parallelism is to maintain
the balance between under-utilizing the pipeline that delivers lowthroughput and over-utilizing the pipeline that increases the latencyof the application due to excessive waiting time. In this section, weshow that, for a fixed off-loading strategy, different data-parallelismdecisions can result in different optimal pipelining strategies. Thisargues that the degree of pipelining must track adaptations in off-loading and data-parallelism, otherwise the pipeline can be signifi-cantly under-utilized or over-utilized.
In Sprout, the degree of pipelining is governed by a bound on themaximum number of tokens: each token corresponds to an image insome stage of the pipeline, so the maximum number of tokens gov-erns the pipeline parallelism in Sprout. Sprout users or applicationdevelopers must specify this maximum number.
To understand the impact of the degree of pipelining, we cre-ate two different configurations of the object and pose recognitionapplication and measure the impact of increasing the number of to-kens in the pipeline on the throughput (Figure 7) and the makespan(Figure 8) of the application. In both configurations, the SIFT fea-ture generator and the model matcher have been offloaded, but theconfigurations differ in the degree of data-parallelism for the twostages. The configurations F2-M5 and F5-M2 denote the numberof SIFT feature generator threads and number of model matcherthreads used by the application running on the server with eightcores.
From Figure 7 we observe that for both configurations the through-put initially increases linearly until the pipeline is full and then lev-els off beyond four tokens at which point additional tokens gener-ated end up waiting at the head of the pipeline. The throughputof the F2-M5 configuration is higher compared to the F5-M2 con-figuration as the F2-M5 configuration reduces the execution timeof the model matcher stage that is the primary bottleneck of theapplication.
Figure 8 shows the makespan response to increasing number oftokens in the pipeline. For both the configurations we observethat over-utilizing the pipeline by increasing the number of tokensbeyond four increases the time a frame waits at the head of thepipeline. Furthermore, comparing the rate of increase of the wait
0 2 4 6 8 100.5
1
1.5
2
2.5
3
Ave
rage
FP
S
# of Tokens
F5−M2F2−M5
Figure 7: Frame rate with increasing number of tokens.
1 2 3 4 5 6 7 8 9 100
1000
2000
3000
4000
5000
6000
# of Tokens for F2−M5
Ave
rage
Mak
espa
n(s)
Execution TimeWait Time
1 2 3 4 5 6 7 8 9 100
1000
2000
3000
4000
5000
6000
# of Tokens for F5−M2
Execution TimeWait Time
Figure 8: Makespan with increasing number of tokens.
time across the two configurations, we find that the wait time for theF5-M2 configuration increases faster than the F2-M5 configuration.This is because the F5-M2 configuration has a longer compute timefor the bottleneck stage, though the total execution time is compa-rable. This causes the makespan to rise sooner with fewer tokensand more steeply compared to the other configuration.
4. DESIGN AND IMPLEMENTATIONOF ODESSA
Motivated by the findings in the previous section, Odessa adap-tively exploits pipelining, data-parallelism and offloading to im-prove performance and accuracy of these applications. The Odessaruntime runs on the mobile device; this enables Odessa to trans-parently improve application performance across different mobileplatforms when the mobile is disconnected from the server.
The design the Odessa runtime has three goals, in order of de-creasing importance:
• It must simultaneously achieve low makespan and high through-put in order to meet the needs of mobile interactive perceptionapplications.
• It must react quickly to changes in input complexity, device ca-pability, or network conditions. This goal ensures that transientchanges in makespan or throughput are minimized or avoided.
• It must have low computation and communication overhead.
Prior approaches for offloading frame the problem using a dis-crete or graph optimization formulation [9, 13, 19]. For this ap-proach to be effective, accurate estimates of stage execution time
are required on both the mobile device and the server, which are of-ten obtained by offline profiling. However, the results in Section 3show that the execution time can vary significantly and cannot eas-ily be modeled offline.
Odessa uses a greedy algorithm that periodically acquires infor-mation from a lightweight application profiler to estimate the bot-tleneck in the current configuration. Then, its decision engine usessimple predictors based on nominal processor frequencies, and arecent history of network measurements, to estimate whether of-floading or increasing the level of parallelism of the bottleneckstage would improve performance. This greedy and incrementalapproach works very well to improve makespan and throughput,and incurs negligible overhead (as discussed in Section 5.1). Rarely,Odessa’s decision may need to be reversed because its estimatorsmay be off, but it has a built-in self-correcting mechanism to main-tain stability.
4.1 Lightweight Application ProfilerThe primary function of the application profiler is to maintain
the complete application performance profile and make this infor-mation available to the decision engine running on the mobile de-vice without impacting the application performance. Our profilerdoes not require any additional programmer input, and accounts forcycles (Figure 2(a)) and parallel sub-tasks (Figure 2(c)) in the ap-plication graph. For each frame processed by the application graph,the profiler collects the following information: the execution timeof each stage in the graph, the wait time on every connector, thevolume of data transferred on each connector, and the transfer timeacross the network connector edges.
Odessa implements this by having each stage piggyback its run-time profile information along with the data and forward it to thedownstream stages along each of the output edges. A downstreamstage receiving this profile information appends its own profile in-formation only if there are no cycles detected and continues for-warding the data. When a splitter is encountered the profile historyto that point is replicated on each output, and is pruned later onthe joiner stage. The head of the pipeline that receives the aggre-gated data forwards it to the decision engine. This piggybackingapproach simplifies the design of the decision engine as it receivesall the profile data for the most recently concluded frame executionin-order and over a single RPC call. The overhead of looking forcycles and removing redundant data requires a simple linear scanof the profile data and incurs negligible overhead. Since each stageeliminates redundant profile information, the decision engine caneasily compute the makespan and throughput of the application.
4.2 Decision EngineThe functionality of the decision engine is split across two threads
running on the mobile device. The first thread manages the dataparallelism and stage offloading. The second thread manages thepipeline parallelism by dynamically controlling admission into thepipeline. Both of these threads make use of the application profiledata to make their decisions. The data received from the profiler ismaintained in a heap sorted by the slowest graph element (stage orconnector) that facilitates efficient lookup.
4.2.1 Adapting Data Parallelism and StageOffloading
The algorithm in Figure 9 describes how Odessa adapts data par-allelism and stage offloading. The algorithm runs periodically (ev-ery 1 second in our implementation) and in each iteration greedilyselects the current bottleneck stage of the application pipeline anddecides to make an incremental improvement by either changing
beginbottleneck := pick the first entry from the priority heap.if bottleneck is a compute stage
a. estimate the cost of offloading the stageb. estimate the cost of spawning more workers
elsif bottleneck is a network edgea. estimate the cost of offloading the source stage.b. estimate the cost of offloading the destination stage.
fic. take the best choice among a., b., or do-nothing.d. sleep ( decision granularity );
end
Figure 9: Algorithm for adaptive offloading and data-parallelism
the placement of a stage, increasing its data parallelism or doingnothing if the performance cannot be further improved. If the bot-tleneck is a compute stage, the algorithm picks between offload-ing the stage or increasing the degree of data-parallelism for thestage. If the bottleneck is a network edge, the algorithm estimatesthe cost of moving either the source or destination stage of the net-work edge.
If Odessa decides to offload or change data-parallelism, it signalsthe pipeline admission controller to stop issuing tokens. When thein-flight tokens have been drained, Odessa invokes Sprout’s stagemigration or thread spawning mechanisms (as appropriate), thenresumes the pipeline once these have finished.
The effectiveness of the algorithms rests on the ability to esti-mate the impact of offloading the stage or increasing data paral-lelism. While it is difficult to accurately estimate the impact of thedecision on the performance of the application, Odessa uses simplecost estimation techniques that are guided by the runtime applica-tion profiler.
Estimating cost of data parallelism. Odessa uses a simple linearestimation based cost metric to evaluate the execution time for in-creasing or decreasing the data parallelism. The linear estimate isbased on the following simple equation: Ei+1 = N
N+1Ei, where
Ei is current execution time on ith frame and N is a current de-gree of data parallelism. This assumes linear speedup and usesthe runtime profiler data to estimate the gains. To avoid the un-bounded increase in the level of data parallelism, Odessa dampensthe performance improvement estimated by the linear equation af-ter data parallelism has reached a preset threshold. This thresholdis set to twice the number of CPU cores for hyper-threaded CPUarchitectures and the scaling factor is N+1
Threshfor N > Thresh.
As we have discussed in Section 3.5, data parallelism may not al-ways give linear speedup because of image complexity: if that isthe case, Odessa will re-examine the decision in the next interval(see below).
Estimating cost of offloading a stage. Moving a compute stagefrom the mobile device to the server or vice versa should accountfor change in the execution time of the stage as well as the impact ofthe change on the network edges. Consider a stage X with a singleinput connector and a single output connector. Suppose X and itspredecessor and successor stages are running on the mobile. Nowto estimate the latency that would result from offloading X to theserver, we need to compute (a) the reduced processing time of X onthe server, and (b) the increased latency induced by having its in-put and output connectors traverse the network between the mobileand the server. Odessa estimates the reduced processing time asTm(X)Fm
Fs, where Tm(X) is the execution time for X on the mo-
bile, obtained from the application profiler (averaged over the last10 frames), and Fm and Fs are, respectively, the nominal proces-sor frequencies on the mobile device and the server, respectively.Since Odessa also keeps track of the amount of data transmitted onevery connector and has an online estimate of the current networkbandwidth, it can estimate the increased latency of data transfer onthe new network connectors. Combining all of this information,Odessa can estimate the effective throughput and makespan thatwould result from the offloading.
Our current implementation only acts when the resulting esti-mate would improve both makespan and throughput. We are con-servative in this regard; a more aggressive choice where an action istaken if either metric is improved may be more susceptible to errorsin the estimates. That said, because Odessa relies on estimates, anoffloading or data-parallelism decision may need to be reversed atthe next decision point and can result in a stage bouncing betweenthe mobile and the server. If this occurs (and it has occurred onlyonce in all our experiments), Odessa temporarily pins the stage inquestion until its compute time increases by a significant fraction(10%, in our implementation).
4.2.2 Adapting Pipeline ParallelismA pipeline admission controller dynamically maintains the opti-
mal number of frames in the pipeline to increase frame rate whileadapting to the variability in the application performance. The ad-mission controller is implemented as a simple token generator thatissues tokens to the frame source stage; upon receiving a token, theframe source stage reads an input image. When an image is com-pletely processed, its token is returned to the admission controller.The admission controller ensures that no more than T tokens areoutstanding at any given instant, and T is determined by the fol-lowing simple equation T = d(M
B)e where M is the makespan and
B is the execution time of the slowest stage, both averaged overthe 10 most recent frames. Note that the token generator tradesoff higher throughput for a slightly higher makespan by using theceiling function that may lead to one extra token in the pipeline.
5. EVALUATIONIn this section we present an experimental evaluation of Odessa.
Our evaluation methodology uses the setup and data described inSection 3.1 and addresses the following questions.
• How does Odessa perform on our data sets, and what is the over-head of the runtime profiler and the decision engine?
• How does Odessa compare with against other candidate strate-gies that either use domain knowledge for static stage placementand parallelism, or that use global profiling for optimal place-ment?
• How does Odessa adapt to changes in network bandwidth avail-ability or the availability of computing resources?
5.1 Odessa’s Performance and OverheadWe begin by examining the performance of Odessa’s decisions
for our applications, when run both on the netbook and the lap-top. In these experiments (and those described in the next sub-section), we used a 100 Mbps network between the mobile deviceand the server; in a subsequent subsection, we evaluate the impactof constraining the network. For the face recognition application,all stages except the classifier stage begin executing on the mobile(this stage has a large database for matching); for the other appli-cations, all stages begin executing on the mobile device. Figure 10shows the timeline of the different decisions made by Odessa on
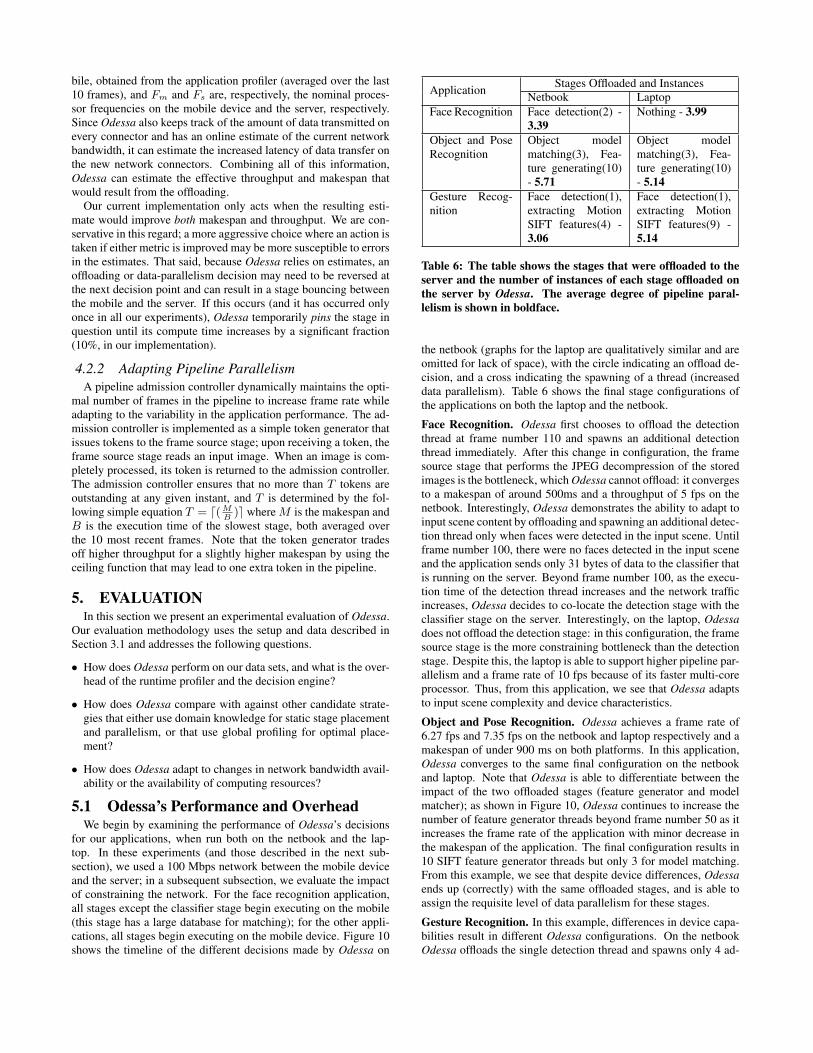
Application Stages Offloaded and InstancesNetbook Laptop
Face Recognition Face detection(2) -3.39
Nothing - 3.99
Object and PoseRecognition
Object modelmatching(3), Fea-ture generating(10)- 5.71
Object modelmatching(3), Fea-ture generating(10)- 5.14
Gesture Recog-nition
Face detection(1),extracting MotionSIFT features(4) -3.06
Face detection(1),extracting MotionSIFT features(9) -5.14
Table 6: The table shows the stages that were offloaded to theserver and the number of instances of each stage offloaded onthe server by Odessa. The average degree of pipeline paral-lelism is shown in boldface.
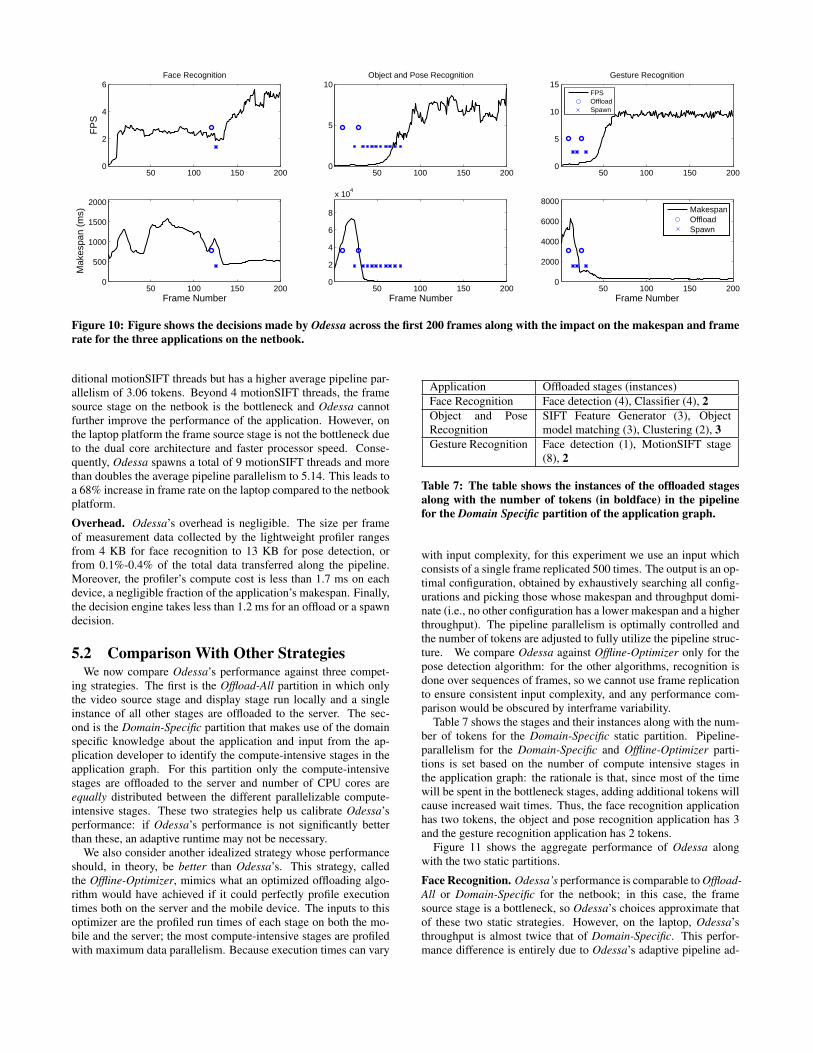
the netbook (graphs for the laptop are qualitatively similar and areomitted for lack of space), with the circle indicating an offload de-cision, and a cross indicating the spawning of a thread (increaseddata parallelism). Table 6 shows the final stage configurations ofthe applications on both the laptop and the netbook.
Face Recognition. Odessa first chooses to offload the detectionthread at frame number 110 and spawns an additional detectionthread immediately. After this change in configuration, the framesource stage that performs the JPEG decompression of the storedimages is the bottleneck, which Odessa cannot offload: it convergesto a makespan of around 500ms and a throughput of 5 fps on thenetbook. Interestingly, Odessa demonstrates the ability to adapt toinput scene content by offloading and spawning an additional detec-tion thread only when faces were detected in the input scene. Untilframe number 100, there were no faces detected in the input sceneand the application sends only 31 bytes of data to the classifier thatis running on the server. Beyond frame number 100, as the execu-tion time of the detection thread increases and the network trafficincreases, Odessa decides to co-locate the detection stage with theclassifier stage on the server. Interestingly, on the laptop, Odessadoes not offload the detection stage: in this configuration, the framesource stage is the more constraining bottleneck than the detectionstage. Despite this, the laptop is able to support higher pipeline par-allelism and a frame rate of 10 fps because of its faster multi-coreprocessor. Thus, from this application, we see that Odessa adaptsto input scene complexity and device characteristics.
Object and Pose Recognition. Odessa achieves a frame rate of6.27 fps and 7.35 fps on the netbook and laptop respectively and amakespan of under 900 ms on both platforms. In this application,Odessa converges to the same final configuration on the netbookand laptop. Note that Odessa is able to differentiate between theimpact of the two offloaded stages (feature generator and modelmatcher); as shown in Figure 10, Odessa continues to increase thenumber of feature generator threads beyond frame number 50 as itincreases the frame rate of the application with minor decrease inthe makespan of the application. The final configuration results in10 SIFT feature generator threads but only 3 for model matching.From this example, we see that despite device differences, Odessaends up (correctly) with the same offloaded stages, and is able toassign the requisite level of data parallelism for these stages.
Gesture Recognition. In this example, differences in device capa-bilities result in different Odessa configurations. On the netbookOdessa offloads the single detection thread and spawns only 4 ad-
50 100 150 2000
2
4
6Face Recognition
FP
S
50 100 150 2000
500
1000
1500
2000
Frame Number
Mak
espa
n (m
s)
50 100 150 2000
5
10Object and Pose Recognition
50 100 150 2000
2
4
6
8
x 104
Frame Number
50 100 150 2000
5
10
15Gesture Recognition
FPSOffloadSpawn
50 100 150 2000
2000
4000
6000
8000
Frame Number
MakespanOffloadSpawn
Figure 10: Figure shows the decisions made by Odessa across the first 200 frames along with the impact on the makespan and framerate for the three applications on the netbook.
ditional motionSIFT threads but has a higher average pipeline par-allelism of 3.06 tokens. Beyond 4 motionSIFT threads, the framesource stage on the netbook is the bottleneck and Odessa cannotfurther improve the performance of the application. However, onthe laptop platform the frame source stage is not the bottleneck dueto the dual core architecture and faster processor speed. Conse-quently, Odessa spawns a total of 9 motionSIFT threads and morethan doubles the average pipeline parallelism to 5.14. This leads toa 68% increase in frame rate on the laptop compared to the netbookplatform.
Overhead. Odessa’s overhead is negligible. The size per frameof measurement data collected by the lightweight profiler rangesfrom 4 KB for face recognition to 13 KB for pose detection, orfrom 0.1%-0.4% of the total data transferred along the pipeline.Moreover, the profiler’s compute cost is less than 1.7 ms on eachdevice, a negligible fraction of the application’s makespan. Finally,the decision engine takes less than 1.2 ms for an offload or a spawndecision.
5.2 Comparison With Other StrategiesWe now compare Odessa’s performance against three compet-
ing strategies. The first is the Offload-All partition in which onlythe video source stage and display stage run locally and a singleinstance of all other stages are offloaded to the server. The sec-ond is the Domain-Specific partition that makes use of the domainspecific knowledge about the application and input from the ap-plication developer to identify the compute-intensive stages in theapplication graph. For this partition only the compute-intensivestages are offloaded to the server and number of CPU cores areequally distributed between the different parallelizable compute-intensive stages. These two strategies help us calibrate Odessa’sperformance: if Odessa’s performance is not significantly betterthan these, an adaptive runtime may not be necessary.
We also consider another idealized strategy whose performanceshould, in theory, be better than Odessa’s. This strategy, calledthe Offline-Optimizer, mimics what an optimized offloading algo-rithm would have achieved if it could perfectly profile executiontimes both on the server and the mobile device. The inputs to thisoptimizer are the profiled run times of each stage on both the mo-bile and the server; the most compute-intensive stages are profiledwith maximum data parallelism. Because execution times can vary
Application Offloaded stages (instances)Face Recognition Face detection (4), Classifier (4), 2Object and PoseRecognition
SIFT Feature Generator (3), Objectmodel matching (3), Clustering (2), 3
Gesture Recognition Face detection (1), MotionSIFT stage(8), 2
Table 7: The table shows the instances of the offloaded stagesalong with the number of tokens (in boldface) in the pipelinefor the Domain Specific partition of the application graph.
with input complexity, for this experiment we use an input whichconsists of a single frame replicated 500 times. The output is an op-timal configuration, obtained by exhaustively searching all config-urations and picking those whose makespan and throughput domi-nate (i.e., no other configuration has a lower makespan and a higherthroughput). The pipeline parallelism is optimally controlled andthe number of tokens are adjusted to fully utilize the pipeline struc-ture. We compare Odessa against Offline-Optimizer only for thepose detection algorithm: for the other algorithms, recognition isdone over sequences of frames, so we cannot use frame replicationto ensure consistent input complexity, and any performance com-parison would be obscured by interframe variability.
Table 7 shows the stages and their instances along with the num-ber of tokens for the Domain-Specific static partition. Pipeline-parallelism for the Domain-Specific and Offline-Optimizer parti-tions is set based on the number of compute intensive stages inthe application graph: the rationale is that, since most of the timewill be spent in the bottleneck stages, adding additional tokens willcause increased wait times. Thus, the face recognition applicationhas two tokens, the object and pose recognition application has 3and the gesture recognition application has 2 tokens.
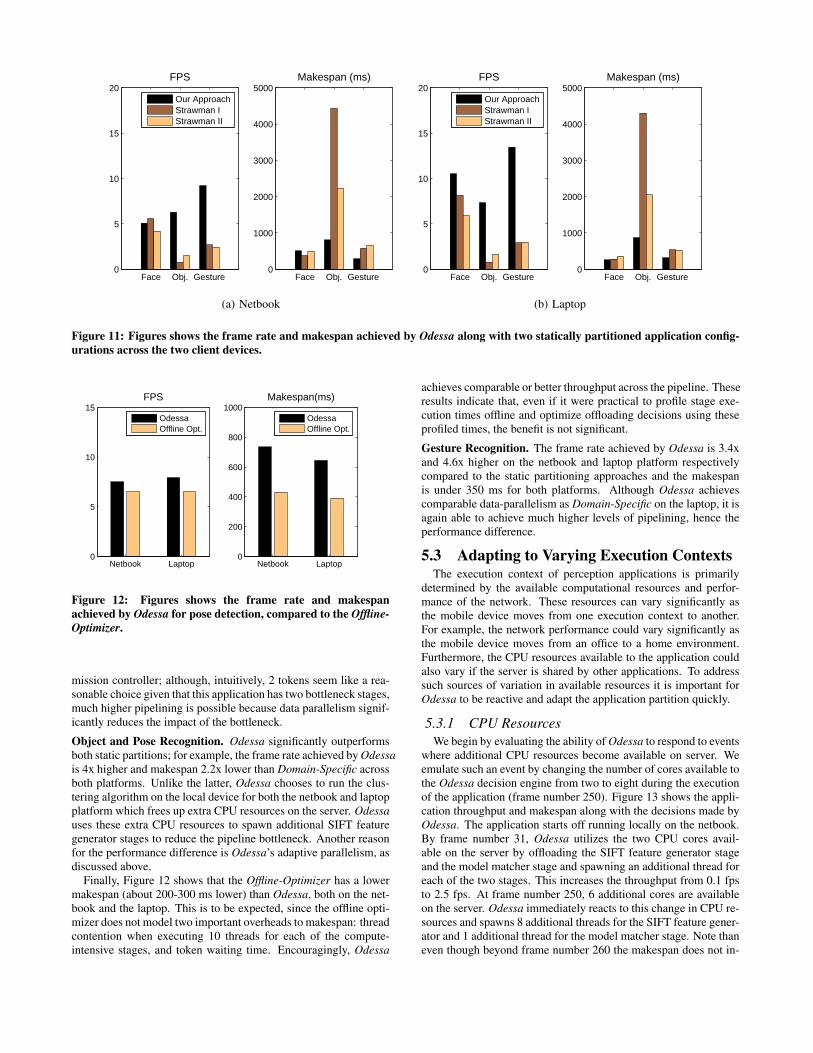
Figure 11 shows the aggregate performance of Odessa alongwith the two static partitions.
Face Recognition. Odessa’s performance is comparable to Offload-All or Domain-Specific for the netbook; in this case, the framesource stage is a bottleneck, so Odessa’s choices approximate thatof these two static strategies. However, on the laptop, Odessa’sthroughput is almost twice that of Domain-Specific. This perfor-mance difference is entirely due to Odessa’s adaptive pipeline ad-
Face Obj. Gesture0
5
10
15
20FPS
Our ApproachStrawman IStrawman II
Face Obj. Gesture0
1000
2000
3000
4000
5000Makespan (ms)
(a) Netbook
Face Obj. Gesture0
5
10
15
20FPS
Our ApproachStrawman IStrawman II
Face Obj. Gesture0
1000
2000
3000
4000
5000Makespan (ms)
(b) Laptop
Figure 11: Figures shows the frame rate and makespan achieved by Odessa along with two statically partitioned application config-urations across the two client devices.
Netbook Laptop0
5
10
15FPS
OdessaOffline Opt.
Netbook Laptop0
200
400
600
800
1000Makespan(ms)
OdessaOffline Opt.
Figure 12: Figures shows the frame rate and makespanachieved by Odessa for pose detection, compared to the Offline-Optimizer.
mission controller; although, intuitively, 2 tokens seem like a rea-sonable choice given that this application has two bottleneck stages,much higher pipelining is possible because data parallelism signif-icantly reduces the impact of the bottleneck.
Object and Pose Recognition. Odessa significantly outperformsboth static partitions; for example, the frame rate achieved by Odessais 4x higher and makespan 2.2x lower than Domain-Specific acrossboth platforms. Unlike the latter, Odessa chooses to run the clus-tering algorithm on the local device for both the netbook and laptopplatform which frees up extra CPU resources on the server. Odessauses these extra CPU resources to spawn additional SIFT featuregenerator stages to reduce the pipeline bottleneck. Another reasonfor the performance difference is Odessa’s adaptive parallelism, asdiscussed above.
Finally, Figure 12 shows that the Offline-Optimizer has a lowermakespan (about 200-300 ms lower) than Odessa, both on the net-book and the laptop. This is to be expected, since the offline opti-mizer does not model two important overheads to makespan: threadcontention when executing 10 threads for each of the compute-intensive stages, and token waiting time. Encouragingly, Odessa
achieves comparable or better throughput across the pipeline. Theseresults indicate that, even if it were practical to profile stage exe-cution times offline and optimize offloading decisions using theseprofiled times, the benefit is not significant.
Gesture Recognition. The frame rate achieved by Odessa is 3.4xand 4.6x higher on the netbook and laptop platform respectivelycompared to the static partitioning approaches and the makespanis under 350 ms for both platforms. Although Odessa achievescomparable data-parallelism as Domain-Specific on the laptop, it isagain able to achieve much higher levels of pipelining, hence theperformance difference.
5.3 Adapting to Varying Execution ContextsThe execution context of perception applications is primarily
determined by the available computational resources and perfor-mance of the network. These resources can vary significantly asthe mobile device moves from one execution context to another.For example, the network performance could vary significantly asthe mobile device moves from an office to a home environment.Furthermore, the CPU resources available to the application couldalso vary if the server is shared by other applications. To addresssuch sources of variation in available resources it is important forOdessa to be reactive and adapt the application partition quickly.
5.3.1 CPU ResourcesWe begin by evaluating the ability of Odessa to respond to events
where additional CPU resources become available on server. Weemulate such an event by changing the number of cores available tothe Odessa decision engine from two to eight during the executionof the application (frame number 250). Figure 13 shows the appli-cation throughput and makespan along with the decisions made byOdessa. The application starts off running locally on the netbook.By frame number 31, Odessa utilizes the two CPU cores avail-able on the server by offloading the SIFT feature generator stageand the model matcher stage and spawning an additional thread foreach of the two stages. This increases the throughput from 0.1 fpsto 2.5 fps. At frame number 250, 6 additional cores are availableon the server. Odessa immediately reacts to this change in CPU re-sources and spawns 8 additional threads for the SIFT feature gener-ator and 1 additional thread for the model matcher stage. Note thaneven though beyond frame number 260 the makespan does not in-
100 200 300 400 5000
5
10
15
FP
S
FPSOffloadSpawn
100 200 300 400 5000
2000
4000
6000
Frame Number
Mak
espa
n (m
s)
MakespanOffloadSpawn
Figure 13: The ability of Odessa to adapt to abrupt changesin the number of CPU cores available to the application. Thenumber of cores are increased from 2 to 8 at frame number250.
crease, Odessa continues to spawn additional stages to further im-prove the throughput. Odessa completes adapting the applicationpartition by frame number 305 after which the average throughputis 8.4 fps and the makespan is reduced to 490 ms.
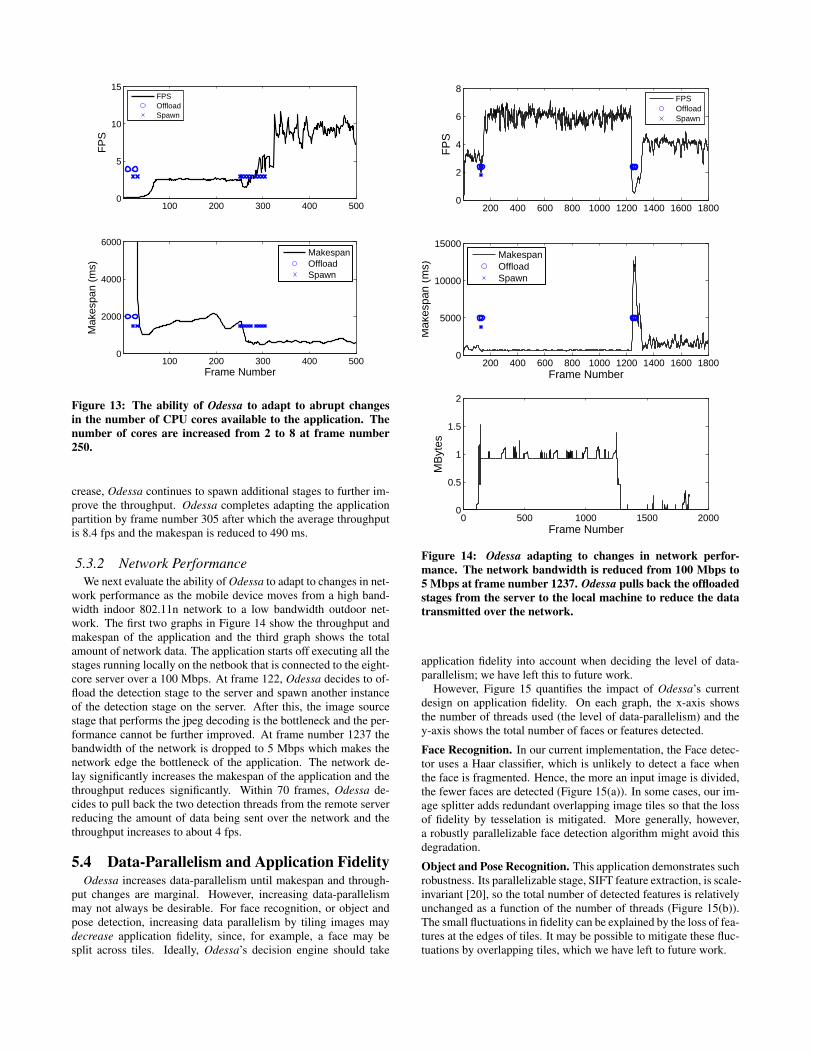
5.3.2 Network PerformanceWe next evaluate the ability of Odessa to adapt to changes in net-
work performance as the mobile device moves from a high band-width indoor 802.11n network to a low bandwidth outdoor net-work. The first two graphs in Figure 14 show the throughput andmakespan of the application and the third graph shows the totalamount of network data. The application starts off executing all thestages running locally on the netbook that is connected to the eight-core server over a 100 Mbps. At frame 122, Odessa decides to of-fload the detection stage to the server and spawn another instanceof the detection stage on the server. After this, the image sourcestage that performs the jpeg decoding is the bottleneck and the per-formance cannot be further improved. At frame number 1237 thebandwidth of the network is dropped to 5 Mbps which makes thenetwork edge the bottleneck of the application. The network de-lay significantly increases the makespan of the application and thethroughput reduces significantly. Within 70 frames, Odessa de-cides to pull back the two detection threads from the remote serverreducing the amount of data being sent over the network and thethroughput increases to about 4 fps.
5.4 Data-Parallelism and Application FidelityOdessa increases data-parallelism until makespan and through-
put changes are marginal. However, increasing data-parallelismmay not always be desirable. For face recognition, or object andpose detection, increasing data parallelism by tiling images maydecrease application fidelity, since, for example, a face may besplit across tiles. Ideally, Odessa’s decision engine should take
200 400 600 800 1000 1200 1400 1600 18000
2
4
6
8
FP
S
FPSOffloadSpawn
200 400 600 800 1000 1200 1400 1600 18000
5000
10000
15000
Frame Number
Mak
espa
n (m
s)
MakespanOffloadSpawn
0 500 1000 1500 20000
0.5
1
1.5
2
MB
ytes
Frame Number
Figure 14: Odessa adapting to changes in network perfor-mance. The network bandwidth is reduced from 100 Mbps to5 Mbps at frame number 1237. Odessa pulls back the offloadedstages from the server to the local machine to reduce the datatransmitted over the network.
application fidelity into account when deciding the level of data-parallelism; we have left this to future work.
However, Figure 15 quantifies the impact of Odessa’s currentdesign on application fidelity. On each graph, the x-axis showsthe number of threads used (the level of data-parallelism) and they-axis shows the total number of faces or features detected.
Face Recognition. In our current implementation, the Face detec-tor uses a Haar classifier, which is unlikely to detect a face whenthe face is fragmented. Hence, the more an input image is divided,the fewer faces are detected (Figure 15(a)). In some cases, our im-age splitter adds redundant overlapping image tiles so that the lossof fidelity by tesselation is mitigated. More generally, however,a robustly parallelizable face detection algorithm might avoid thisdegradation.
Object and Pose Recognition. This application demonstrates suchrobustness. Its parallelizable stage, SIFT feature extraction, is scale-invariant [20], so the total number of detected features is relativelyunchanged as a function of the number of threads (Figure 15(b)).The small fluctuations in fidelity can be explained by the loss of fea-tures at the edges of tiles. It may be possible to mitigate these fluc-tuations by overlapping tiles, which we have left to future work.
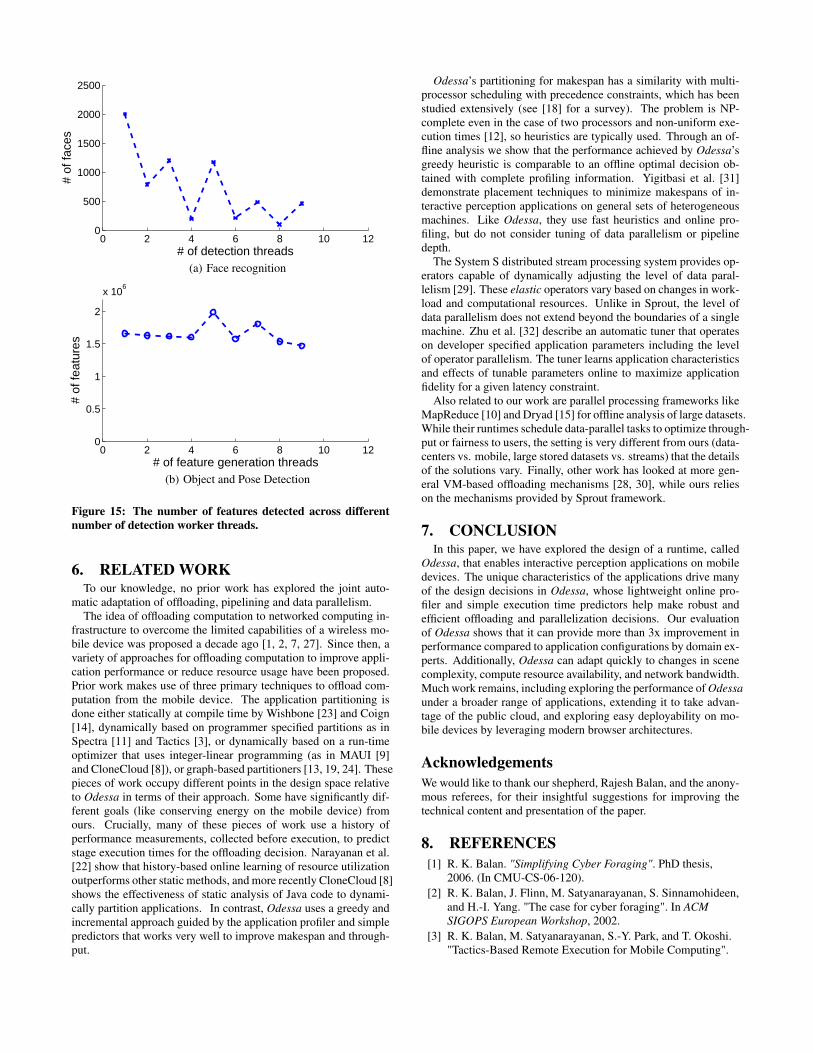
0 2 4 6 8 10 120
500
1000
1500
2000
2500
# of detection threads
# of
face
s
(a) Face recognition
0 2 4 6 8 10 120
0.5
1
1.5
2
x 106
# of feature generation threads
# of
feat
ures
(b) Object and Pose Detection
Figure 15: The number of features detected across differentnumber of detection worker threads.
6. RELATED WORKTo our knowledge, no prior work has explored the joint auto-
matic adaptation of offloading, pipelining and data parallelism.The idea of offloading computation to networked computing in-
frastructure to overcome the limited capabilities of a wireless mo-bile device was proposed a decade ago [1, 2, 7, 27]. Since then, avariety of approaches for offloading computation to improve appli-cation performance or reduce resource usage have been proposed.Prior work makes use of three primary techniques to offload com-putation from the mobile device. The application partitioning isdone either statically at compile time by Wishbone [23] and Coign[14], dynamically based on programmer specified partitions as inSpectra [11] and Tactics [3], or dynamically based on a run-timeoptimizer that uses integer-linear programming (as in MAUI [9]and CloneCloud [8]), or graph-based partitioners [13, 19, 24]. Thesepieces of work occupy different points in the design space relativeto Odessa in terms of their approach. Some have significantly dif-ferent goals (like conserving energy on the mobile device) fromours. Crucially, many of these pieces of work use a history ofperformance measurements, collected before execution, to predictstage execution times for the offloading decision. Narayanan et al.[22] show that history-based online learning of resource utilizationoutperforms other static methods, and more recently CloneCloud [8]shows the effectiveness of static analysis of Java code to dynami-cally partition applications. In contrast, Odessa uses a greedy andincremental approach guided by the application profiler and simplepredictors that works very well to improve makespan and through-put.
Odessa’s partitioning for makespan has a similarity with multi-processor scheduling with precedence constraints, which has beenstudied extensively (see [18] for a survey). The problem is NP-complete even in the case of two processors and non-uniform exe-cution times [12], so heuristics are typically used. Through an of-fline analysis we show that the performance achieved by Odessa’sgreedy heuristic is comparable to an offline optimal decision ob-tained with complete profiling information. Yigitbasi et al. [31]demonstrate placement techniques to minimize makespans of in-teractive perception applications on general sets of heterogeneousmachines. Like Odessa, they use fast heuristics and online pro-filing, but do not consider tuning of data parallelism or pipelinedepth.
The System S distributed stream processing system provides op-erators capable of dynamically adjusting the level of data paral-lelism [29]. These elastic operators vary based on changes in work-load and computational resources. Unlike in Sprout, the level ofdata parallelism does not extend beyond the boundaries of a singlemachine. Zhu et al. [32] describe an automatic tuner that operateson developer specified application parameters including the levelof operator parallelism. The tuner learns application characteristicsand effects of tunable parameters online to maximize applicationfidelity for a given latency constraint.
Also related to our work are parallel processing frameworks likeMapReduce [10] and Dryad [15] for offline analysis of large datasets.While their runtimes schedule data-parallel tasks to optimize through-put or fairness to users, the setting is very different from ours (data-centers vs. mobile, large stored datasets vs. streams) that the detailsof the solutions vary. Finally, other work has looked at more gen-eral VM-based offloading mechanisms [28, 30], while ours relieson the mechanisms provided by Sprout framework.
7. CONCLUSIONIn this paper, we have explored the design of a runtime, called
Odessa, that enables interactive perception applications on mobiledevices. The unique characteristics of the applications drive manyof the design decisions in Odessa, whose lightweight online pro-filer and simple execution time predictors help make robust andefficient offloading and parallelization decisions. Our evaluationof Odessa shows that it can provide more than 3x improvement inperformance compared to application configurations by domain ex-perts. Additionally, Odessa can adapt quickly to changes in scenecomplexity, compute resource availability, and network bandwidth.Much work remains, including exploring the performance of Odessaunder a broader range of applications, extending it to take advan-tage of the public cloud, and exploring easy deployability on mo-bile devices by leveraging modern browser architectures.
AcknowledgementsWe would like to thank our shepherd, Rajesh Balan, and the anony-mous referees, for their insightful suggestions for improving thetechnical content and presentation of the paper.
8. REFERENCES[1] R. K. Balan. "Simplifying Cyber Foraging". PhD thesis,
2006. (In CMU-CS-06-120).[2] R. K. Balan, J. Flinn, M. Satyanarayanan, S. Sinnamohideen,
and H.-I. Yang. "The case for cyber foraging". In ACMSIGOPS European Workshop, 2002.
[3] R. K. Balan, M. Satyanarayanan, S.-Y. Park, and T. Okoshi."Tactics-Based Remote Execution for Mobile Computing".
In International Conference on Mobile Systems,Applications, and Services (MobiSys), 2003.
[4] G. Bradski and A. Kaehler. "Learning OpenCV: ComputerVision with the OpenCV Library". O’Reilly Media, 2008.
[5] M. Carbone and L. Rizzo. "Dummynet revisited".SIGCOMM Computer Communincation Review,40(2):12–20, 2010.
[6] M. Chen and A. Hauptmann. "MoSIFT: Recognizing HumanActions in Surveillance Videos". In CMU-CS-09-161,Carnegie Mellon University, 2009.
[7] J. Cheng, R. K. Balan, and M. Satyanarayanan. "ExploitingRich Mobile Environment". Technical ReportCMU-CS-05-199, Carnegie Mellon University, 2005.
[8] B.-G. Chun and P. Maniatis. "CloneCloud: Elastic Executionbetween Mobile Device and Cloud". In Proceedings of the6th European Conference on Computer Systems (EuroSys),2011.
[9] E. Cuervo, A. Balasubramanian, D.-k. Cho, A. Wolman,S. Saroiu, R. Chandra, and P. Bahl. "MAUI: MakingSmartphones Last Longer with Code Offload". InInternational Conference on Mobile Systems, Applications,and Services (MobiSys), 2010.
[10] J. Dean and S. Ghemawat. "MapReduce: simplified dataprocessing on large clusters". Communications of the ACM(CACM), 51(1):107–113, 2008.
[11] J. Flinn, S. Park, and M. Satyanarayanan. "BalancingPerformance, Energy, and Quality in Pervasive Computing".In International Conference on Distributed ComputingSystems (ICDCS), 2002.
[12] M. R. Garey and D. S. Johnson. "Computers andIntractability: A Guide to the Theory of NP-Completeness".W. H. Freeman and Company, New York, 1979.
[13] X. Gu, A. Messer, I. Greenberg, D. Milojicic, andK. Nahrstedt. "Adaptive Offloading for PervasiveComputing". IEEE Pervasive Computing, 3(3):66 – 73, 2004.
[14] G. C. Hunt and M. L. Scott. "The Coign automaticdistributed partitioning system". In Symposium on OperatingSystems Design and Implementation (OSDI), 1999.
[15] M. Isard, M. Budiu, Y. Yu, A. Birrell, and D. Fetterly."Dryad: distributed data-parallel programs from sequentialbuilding blocks". In European Conference on ComputerSystems, 2007.
[16] M. Kolsch. "Vision based hand gesture interfaces forwearable computing and virtual environments". PhD thesis,2004. (In 0-496-01704-7).
[17] B. Kveton, M. Valko, M. Philipose, and L. Huang. "OnlineSemi-Supervised Perception: Real-Time Learning withoutExplicit Feedback". In IEEE Online Learning for ComputerVision Workshop, 2010.
[18] Y.-K. Kwok and I. Ahmad. "Static Scheduling Algorithmsfor Allocating Directed Task Graphs to Multiprocessors".ACM Computing Surveys, 31(4):406–471, 1999.
[19] Z. Li, C. Wang, and R. Xu. "Task Allocation for DistributedMultimedia Processing on Wirelessly Networked HandheldDevices". In IEEE International Parallel and DistributedProcessing Symposium (IPDPS), 2002.
[20] D. Lowe. "Distinctive Image Features from Scale-InvariantKeypoints". International Journal on Computer Vision(IJCV), 60(2):91–110, 2004.
[21] E. Miluzzo, T. Wang, and A. T. Campbell. "EyePhone:Activating Mobile Phones With Your Eyes". In Workshop on
Networking, Systems, Applications on Mobile Handhelds(MobiHeld). ACM, 2010.
[22] D. Narayanan and M. Satyanarayanan. "Predictive ResourceManagement for Wearable Computing". In InternationalConference on Mobile Systems, Applications, and Services(MobiSys), 2003.
[23] R. Newton, S. Toledo, L. Girod, H. Balakrishnan, andS. Madden. "Wishbone: Profile-based Partitioning forSensornet Applications". In Symposium on NetworkedSystems Design and Implementation (NSDI), 2009.
[24] S. Ou, K. Yang, and J. Zhang. "An effective offloadingmiddleware for pervasive services on mobile devices".Pervasive and Mobile Computing, 3(4):362–385, 2007.
[25] P. S. Pillai, L. B. Mummert, S. W. Schlosser, R. Sukthankar,and C. J. Helfrich. "SLIPstream: Scalable Low-latencyInteractive Perception on Streaming Data". In ACMInternational Workshop on Network and Operating SystemSupport for Digital Audio and Video, 2009.
[26] A. C. Romea, D. Berenson, S. Srinivasa, and D. Ferguson."Object Recognition and Full Pose Registration from aSingle Image for Robotic Manipulation". In IEEEInternational Conference on Robotics and Automation, 2009.
[27] M. Satyanarayanan. "Pervasive Computing: Vision andChallenges". IEEE Personal Communications, 8(4):10–17,2001.
[28] M. Satyanarayanan, P. Bahl, R. Caceres, and N. Davies. "TheCase for VM-Based Cloudlets in Mobile Computing". IEEEPervasive Computing, 8(4):14–23, 2009.
[29] S. Schneider, H. Andrade, B. Gedik, A. Biem, and K.-L. Wu."Elastic Scaling of Data Parallel Operators in StreamProcessing". In IEEE International Parallel and DistributedProcessing Symposium, 2009.
[30] Y.-Y. Su and J. Flinn. "Slingshot: Deploying StatefulServices in Wireless Hotspots". In International Conferenceon Mobile Systems, Applications, and Services (MobiSys),2005.
[31] N. Yigitbasi, L. Mummert, P. Pillai, and D. Epema."Incremental Placement of Interactive PerceptionApplications". In ACM Symposium on High PerformanceParallel and Distributed Computing (HPDC), 2011.
[32] Q. Zhu, B. Kveton, L. Mummert, and P. Pillai. "AutomaticTuning of Interactive Perception Applications". InConference on Uncertainty in Artificial Intelligence (UAI),2010.


![Odessa Spaindor[Catálogo]](https://static.fdocuments.net/doc/165x107/568c38261a28ab02359df892/odessa-spaindorcatalogo.jpg)