ODBC Connection for Excel 2016 Linking nulook Tables
12
Institutional Effectiveness and Analytics UNIVERSITY OF NEBRASKA-LINCOLN APRIL 2016 ODBC Connection for Excel 2016 Linking nulook Tables
Transcript of ODBC Connection for Excel 2016 Linking nulook Tables

Institutional Effectiveness and Analytics UNIVERSITY OF NEBRASKA-LINCOLN
APRIL 2016
ODBC Connection for Excel 2016
Linking nulook Tables
ODBC Connection for Excel 2016, Linking nulook Tables April 2016 Institutional Effectiveness and Analytics Page 1 of 11
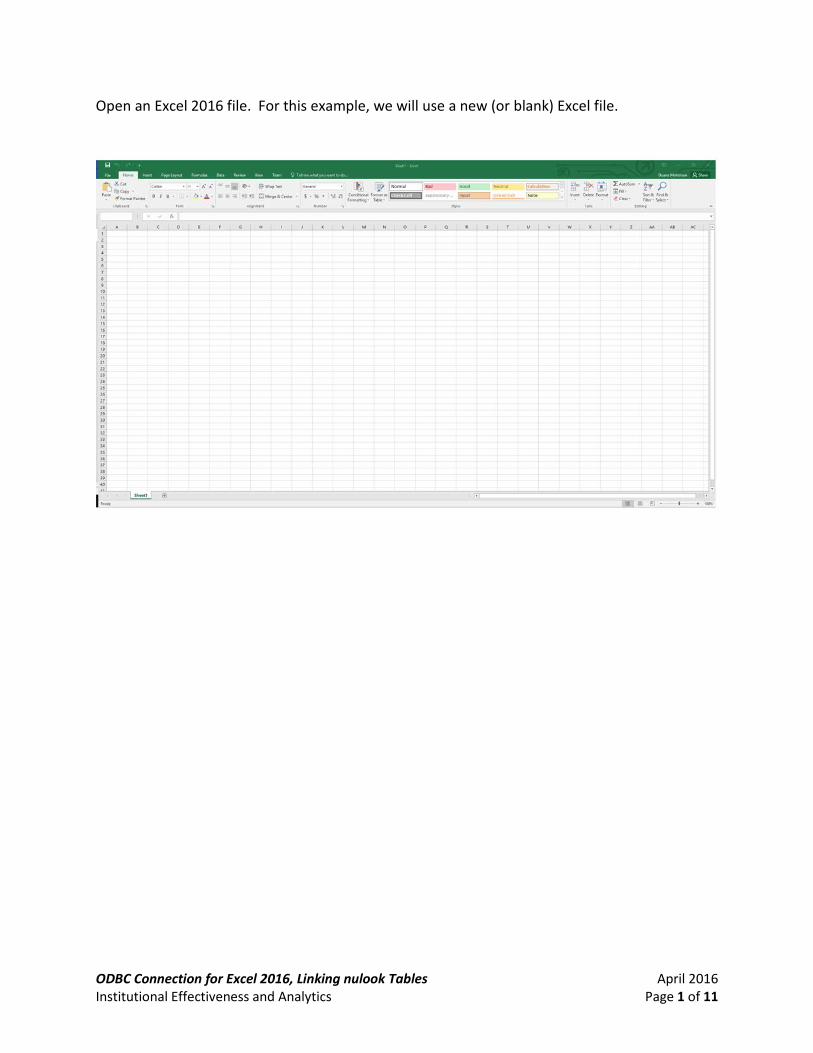
Open an Excel 2016 file. For this example, we will use a new (or blank) Excel file.

ODBC Connection for Excel 2016, Linking nulook Tables April 2016 Institutional Effectiveness and Analytics Page 2 of 11
Click on “Data” tab
Click the small down arrow on “From Other Sources” and select “From Microsoft Query”

ODBC Connection for Excel 2016, Linking nulook Tables April 2016 Institutional Effectiveness and Analytics Page 3 of 11
The “Choose Data Source” window will open. Click on “nulook*” and click “OK”
The “SQL Server Login” window will open.
Enter your TrueYou credentials. Note that your “Login ID” will probably be displayed; thus, only your “Password” will be needed, and click “OK”.

ODBC Connection for Excel 2016, Linking nulook Tables April 2016 Institutional Effectiveness and Analytics Page 4 of 11
The “Query Wizard – Choose Columns” window will open. Scroll to the table you wish to use.
You now have a choice of importing the entire table, or selected fields.
If you want the entire table, simply highlight the table and click the right-facing arrow. Then click “Next” through the remaining prompts. The entire table will load into your Excel file.
Or, choose selected fields…
Click on the “plus sign” to select individual fields (see Example of Selecting Individual Fields and Filtering).
For either option, the remaining prompts provide an opportunity to filter your import (e.g. by selected terms, and/or for a specific college, etc.).

ODBC Connection for Excel 2016, Linking nulook Tables April 2016 Institutional Effectiveness and Analytics Page 5 of 11
Example of Selecting Individual Fields and Filtering
For this example, we wil use table “amis_base_degrees”.
Scroll down to table “amis_base_degrees”, and click on the “plus sign”.
ODBC Connection for Excel 2016, Linking nulook Tables April 2016 Institutional Effectiveness and Analytics Page 6 of 11
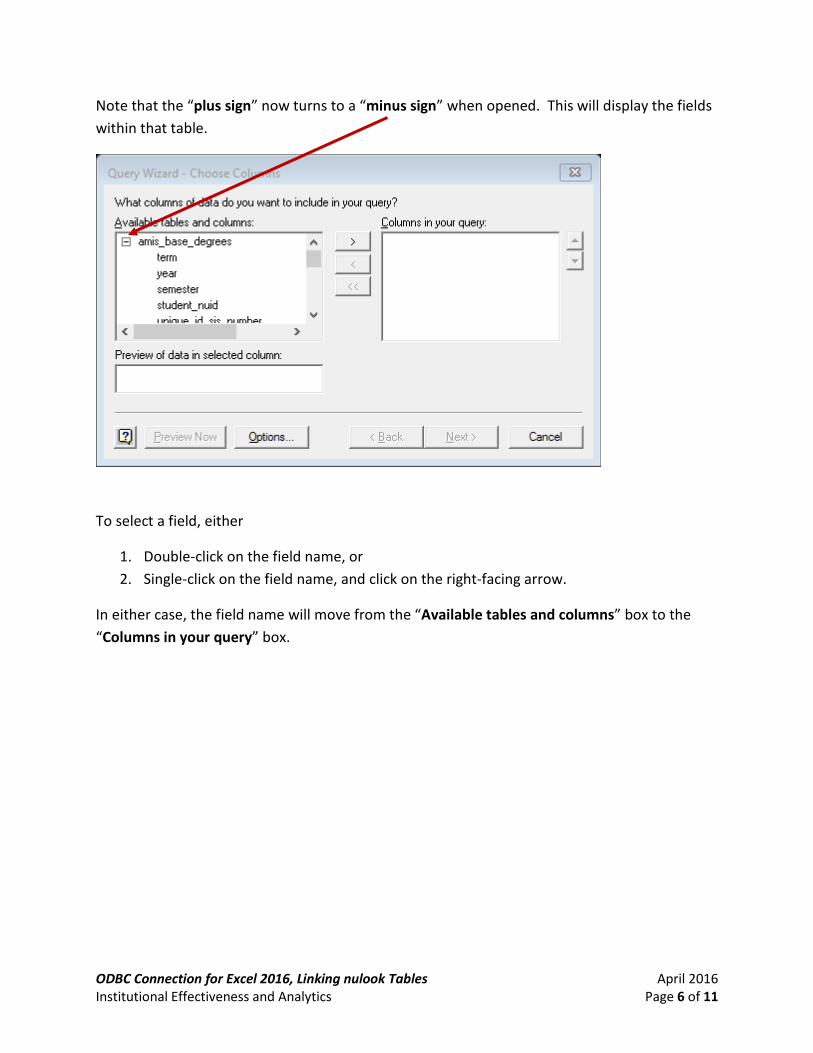
Note that the “plus sign” now turns to a “minus sign” when opened. This will display the fields within that table.
To select a field, either
1. Double-click on the field name, or 2. Single-click on the field name, and click on the right-facing arrow.
In either case, the field name will move from the “Available tables and columns” box to the “Columns in your query” box.

ODBC Connection for Excel 2016, Linking nulook Tables April 2016 Institutional Effectiveness and Analytics Page 7 of 11
In this example, we would like a list of Fall 2015, undergraduate degrees and majors, in the Hixon-Lied College of Fine and Performing Arts. Therefore, select the following five fields, and click “Next”.

ODBC Connection for Excel 2016, Linking nulook Tables April 2016 Institutional Effectiveness and Analytics Page 8 of 11
The “Query Wizard – Filter Data” window will open.
Single-click on “term” Select “equals” from the drop-down menu Type in “20161” (i.e. Fall 2015), or select it from the now-populated drop-down menu
Single-click on “admin_campus” Select “equals” from the drop-down menu Type in “UNL” or select it from the now-populated drop-down menu.
Single-click on “coll” Select “equals” from the drop-down menu Type in “FPA”, or select it from the now-populated drop-down menu
Note that the three fields that have selection critieria are now in bold.
Click on “Next”

ODBC Connection for Excel 2016, Linking nulook Tables April 2016 Institutional Effectiveness and Analytics Page 9 of 11
The “Query Wizard – Sort Order” window will open.
If needed, we can select a field to sort by. In this example, let’s sort by “degree_id”
Click on the “Sort by” drop-down menu Select “degree_id” Note that an “Ascending/Descending” option is available. Take the default of “Ascending”.
Click “Next”.
Note that the three fields that have selection critieria are now in bold.
Click on “Next”.

ODBC Connection for Excel 2016, Linking nulook Tables April 2016 Institutional Effectiveness and Analytics Page 10 of 11
The “Query Wizard – Finish” window will open. Take the default “Return Data Microsoft Excel”, and click “Finish”.
The “Import Data” window will open.
To import your data, take the default option of “Table” and click “OK”.

ODBC Connection for Excel 2016, Linking nulook Tables April 2016 Institutional Effectiveness and Analytics Page 11 of 11
Note: Depending upon the size of the data import, you may see a brief message, in Cell A1, that says “Query from NUlook…)” that the data is importing.
Your Excel spreadsheet populates with the requested fields, including applied filters, and sorted by degree_id.
Remember to save your new file to your local PC and/or network drive.