Ocular Surface Biomarkers and Inflammation€¦ · Ocular Surface Biomarkers and Inflammation A. J....
44
Ocular Surface Biomarkers and Inflammation A. J. Bron Nuffield Laboratory of Ophthalmology Oxford EMA 27/28 th October Image -freedoncurrent.com
Transcript of Ocular Surface Biomarkers and Inflammation€¦ · Ocular Surface Biomarkers and Inflammation A. J....
Ocular Surface Biomarkers and
Inflammation
A. J. Bron
Nuffield Laboratory of
Ophthalmology
Oxford
EMA 27/28th OctoberImage -freedoncurrent.com
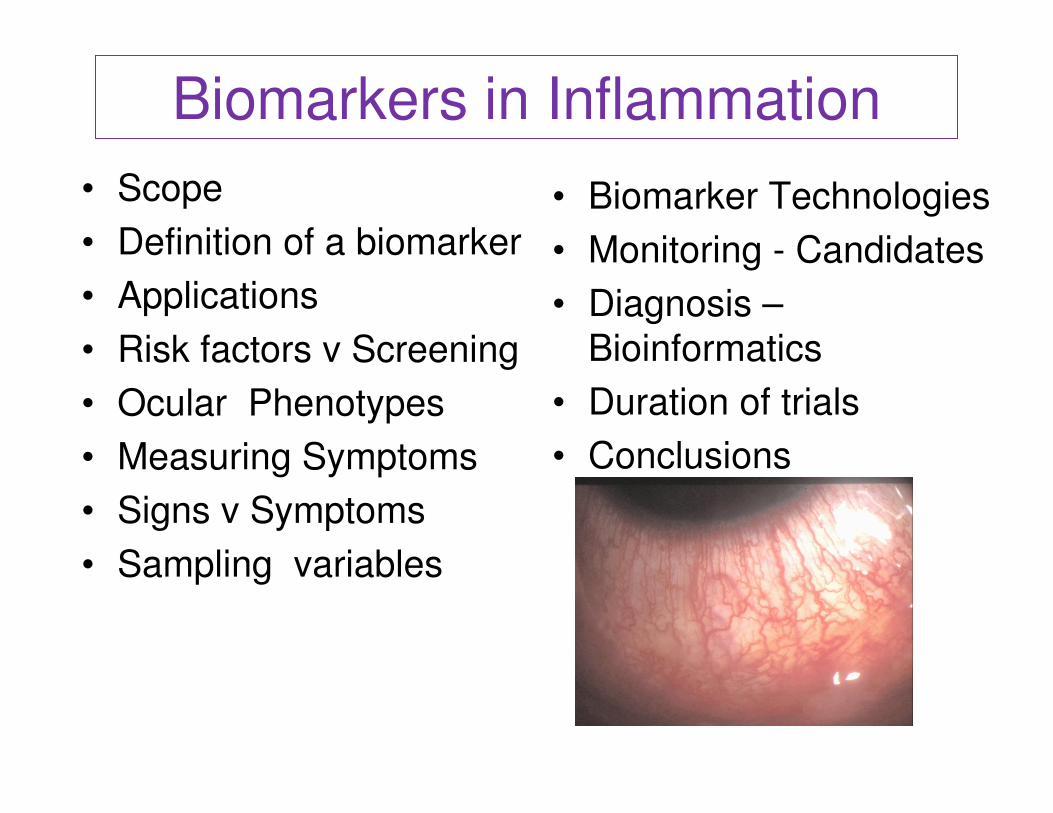
Biomarkers in Inflammation
• Scope
• Definition of a biomarker
• Applications
• Risk factors v Screening
• Ocular Phenotypes
• Measuring Symptoms
• Signs v Symptoms
• Sampling variables
• Biomarker Technologies
• Monitoring - Candidates
• Diagnosis –
Bioinformatics
• Duration of trials
• Conclusions
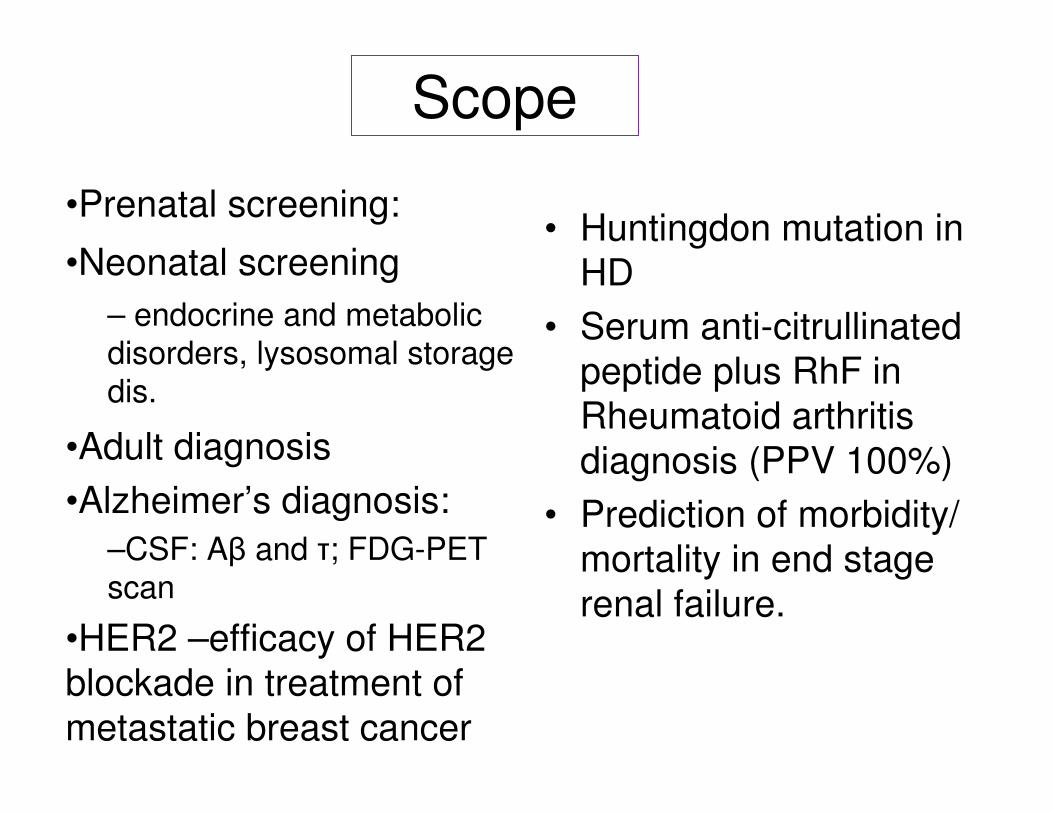
Scope
•Prenatal screening:
•Neonatal screening
– endocrine and metabolic
disorders, lysosomal storage
dis.
•Adult diagnosis
•Alzheimer’s diagnosis:
–CSF: Aβ and τ; FDG-PET
scan
•HER2 –efficacy of HER2
blockade in treatment of
metastatic breast cancer
• Huntingdon mutation in
HD
• Serum anti-citrullinated
peptide plus RhF in
Rheumatoid arthritis
diagnosis (PPV 100%)
• Prediction of morbidity/
mortality in end stage
renal failure.
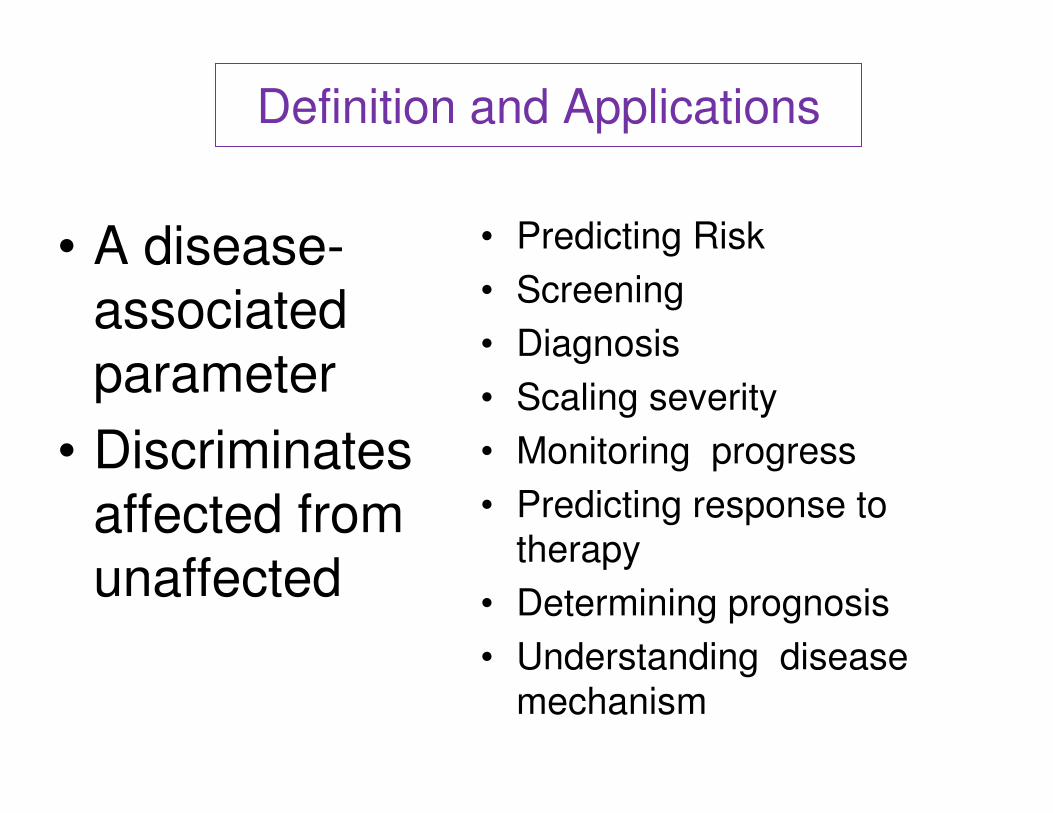
Definition and Applications
• A disease-
associated
parameter
• Discriminates
affected from
unaffected
• Predicting Risk
• Screening
• Diagnosis
• Scaling severity
• Monitoring progress
• Predicting response to
therapy
• Determining prognosis
• Understanding disease
mechanism
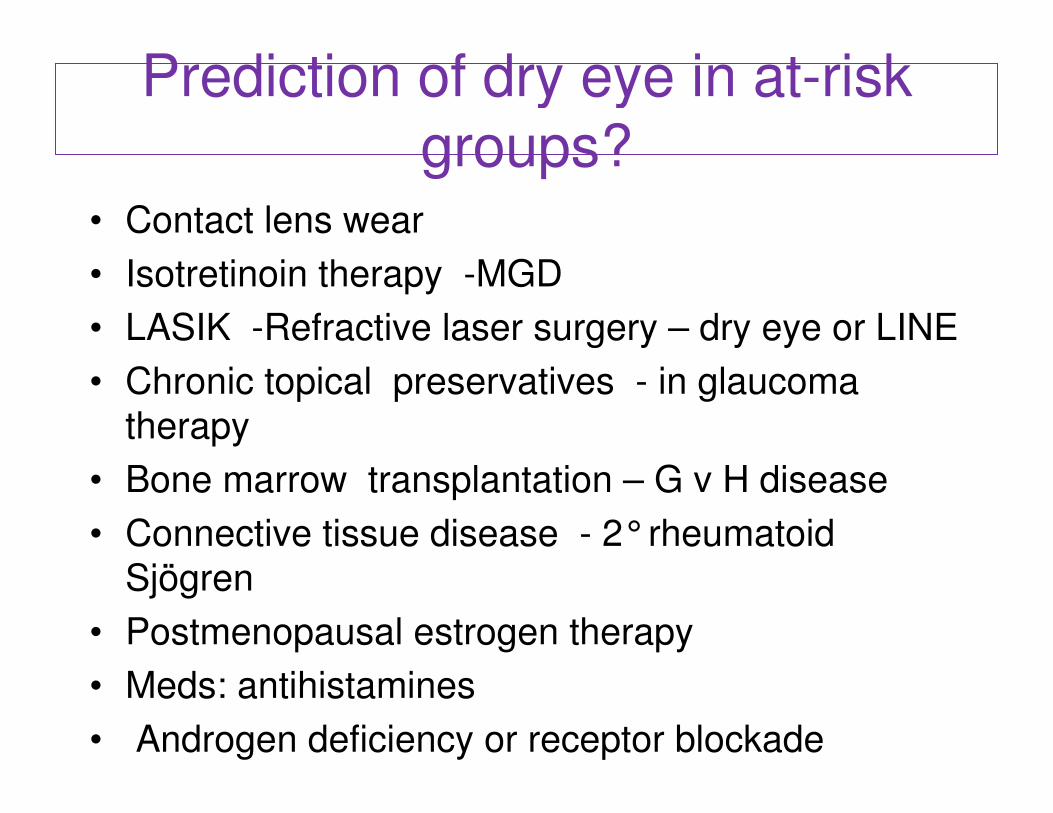
Prediction of dry eye in at-risk
groups?• Contact lens wear
• Isotretinoin therapy -MGD
• LASIK -Refractive laser surgery – dry eye or LINE
• Chronic topical preservatives - in glaucoma
therapy
• Bone marrow transplantation – G v H disease
• Connective tissue disease - 2°rheumatoid
Sjögren
• Postmenopausal estrogen therapy
• Meds: antihistamines
• Androgen deficiency or receptor blockade

• This gives a DR5 ≅15% which is poor for
a screening test
Wald et al. BMJ 1999; 319
Is a strong risk factor of use in
screening:?
• The relative odds for
the association of
cholesterol (RO1-5)
with Ischaemic Heart
Disease ≅ 2.7
DR5 = Detection Rate at a False Positive rate of 5%
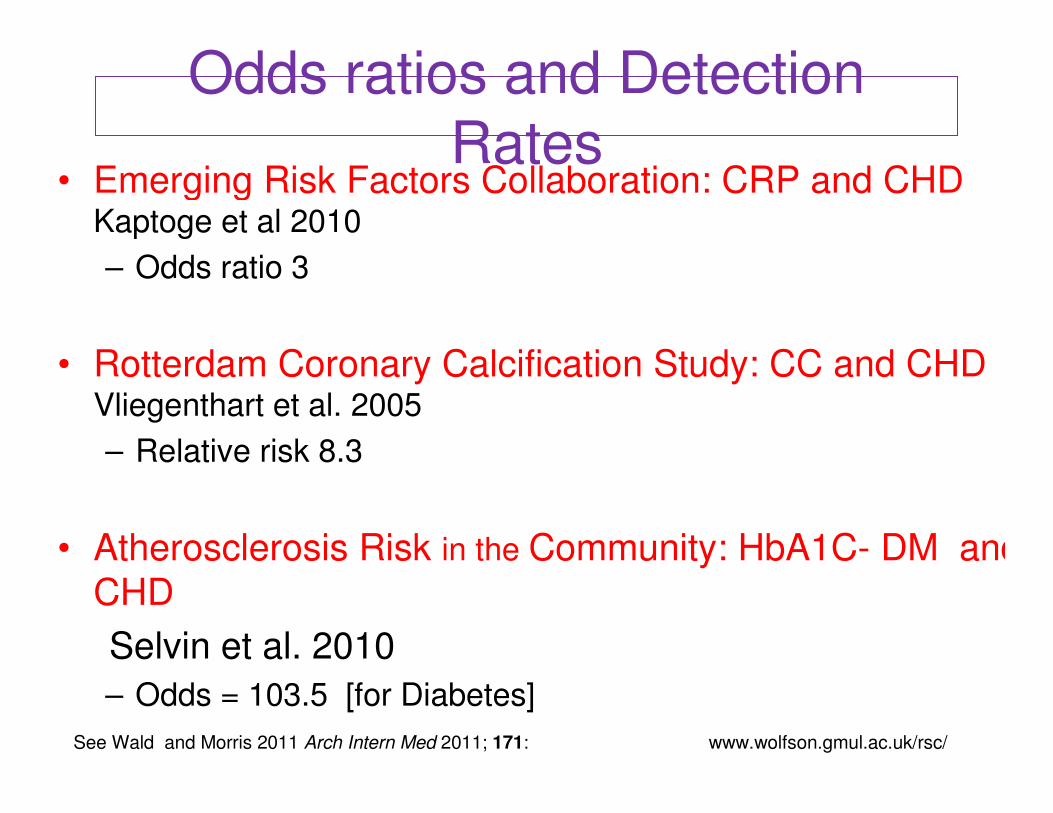
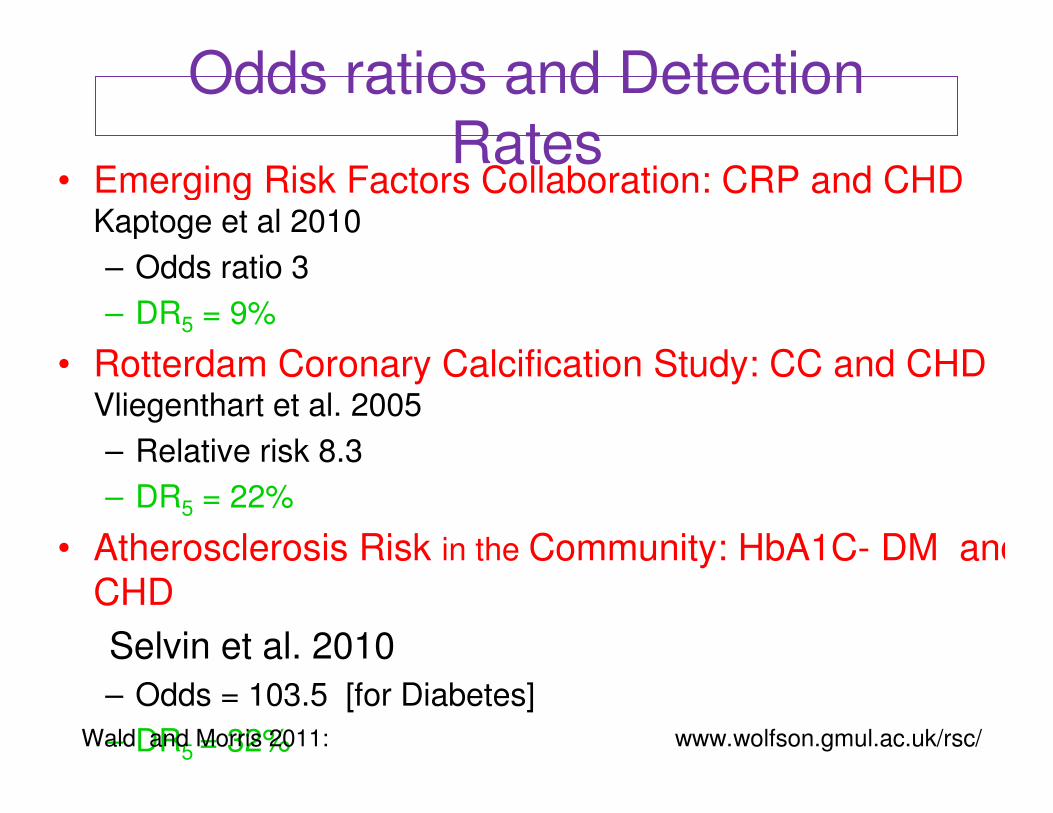
Odds ratios and Detection Rates
• Emerging Risk Factors Collaboration: CRP and CHD Kaptoge et al 2010
– Odds ratio 3
• Rotterdam Coronary Calcification Study: CC and CHD Vliegenthart et al. 2005
– Relative risk 8.3
• Atherosclerosis Risk in the Community: HbA1C- DM and
CHD
Selvin et al. 2010
– Odds = 103.5 [for Diabetes]
See Wald and Morris 2011 Arch Intern Med 2011; 171: www.wolfson.gmul.ac.uk/rsc/
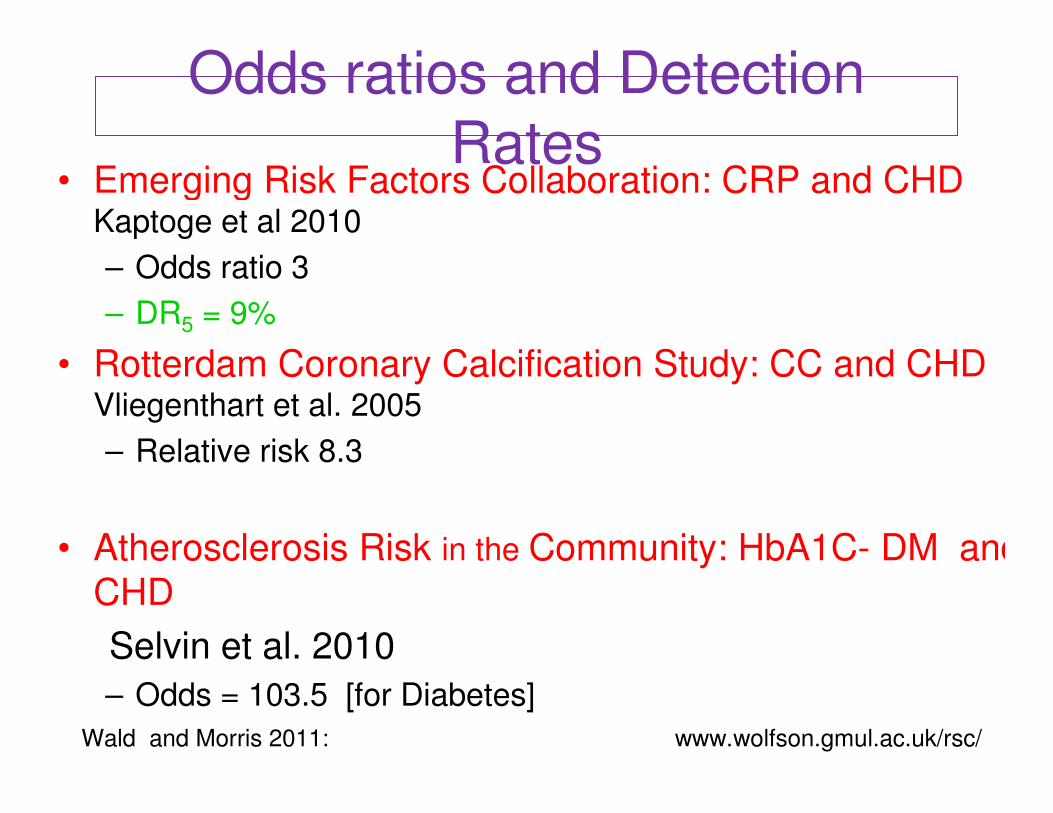
Odds ratios and Detection Rates
• Emerging Risk Factors Collaboration: CRP and CHD Kaptoge et al 2010
– Odds ratio 3
– DR5 = 9%
• Rotterdam Coronary Calcification Study: CC and CHD Vliegenthart et al. 2005
– Relative risk 8.3
• Atherosclerosis Risk in the Community: HbA1C- DM and
CHD
Selvin et al. 2010
– Odds = 103.5 [for Diabetes]
Wald and Morris 2011: www.wolfson.gmul.ac.uk/rsc/
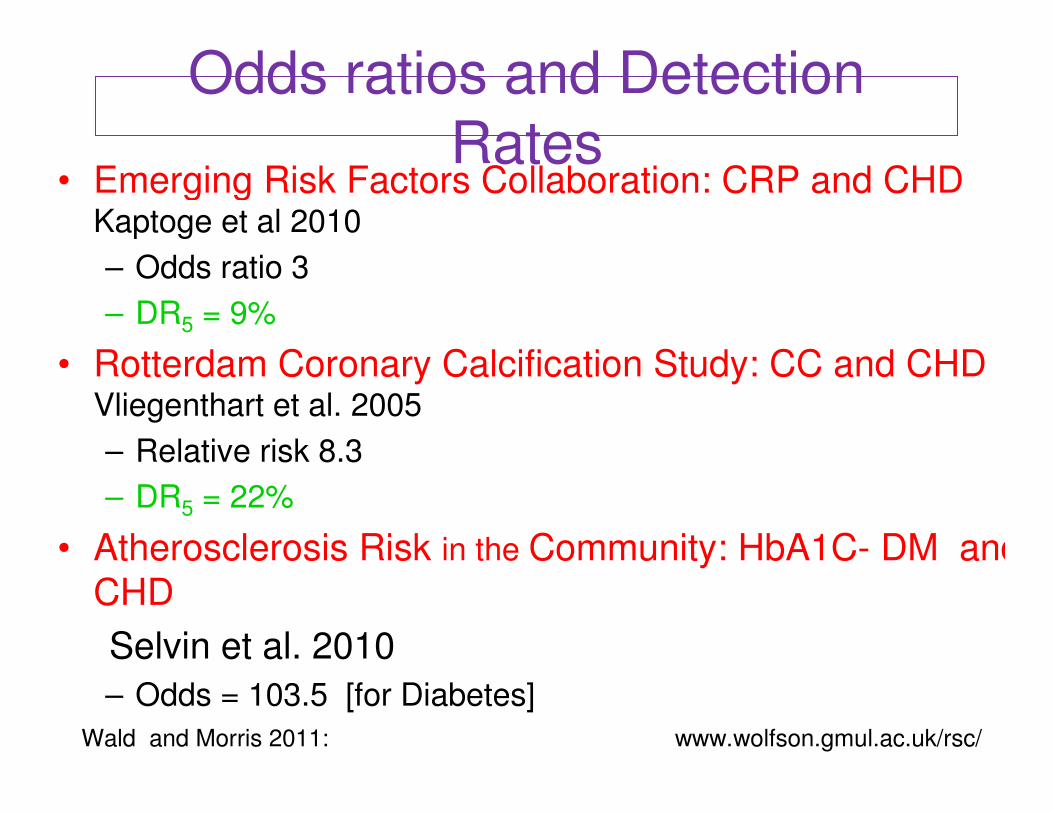
Odds ratios and Detection Rates
• Emerging Risk Factors Collaboration: CRP and CHD Kaptoge et al 2010
– Odds ratio 3
– DR5 = 9%
• Rotterdam Coronary Calcification Study: CC and CHD Vliegenthart et al. 2005
– Relative risk 8.3
– DR5 = 22%
• Atherosclerosis Risk in the Community: HbA1C- DM and
CHD
Selvin et al. 2010
– Odds = 103.5 [for Diabetes]
Wald and Morris 2011: www.wolfson.gmul.ac.uk/rsc/
Odds ratios and Detection Rates
• Emerging Risk Factors Collaboration: CRP and CHD Kaptoge et al 2010
– Odds ratio 3
– DR5 = 9%
• Rotterdam Coronary Calcification Study: CC and CHD Vliegenthart et al. 2005
– Relative risk 8.3
– DR5 = 22%
• Atherosclerosis Risk in the Community: HbA1C- DM and
CHD
Selvin et al. 2010
– Odds = 103.5 [for Diabetes]
– DR5 = 32%Wald and Morris 2011: www.wolfson.gmul.ac.uk/rsc/

Screening for Downs and Neural Tube
Defect• 2-step integrated test
for Downs
• 1st Trimester –nuchal
translucency and
serum pregnancy-
associated plasma
protein A
• 2nd Trimester - AFP,
hCG, unconjugated
estriol, and Inhibin-A
• Risk result in 2nd tr.
• DR2 = 90%
US - Nuchal translucency in Downs
Serum AFP raised in NTD Nearly all NTD pregnancies can
be identified by AFP screening.
DR5 = 91% spina bifida
Wald 2010Valuable diagnostic tests may take time to
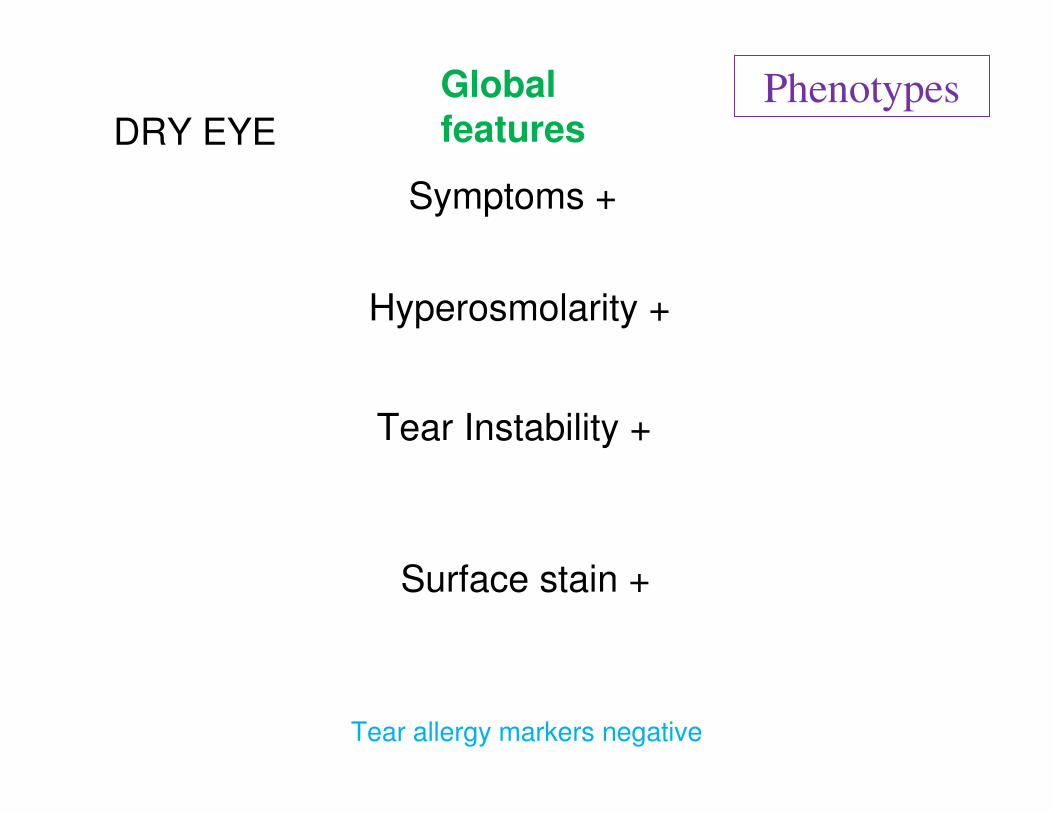
Symptoms +
Hyperosmolarity +
Tear Instability +
Surface stain +
Global
featuresDRY EYE
Tear allergy markers negative
Phenotypes
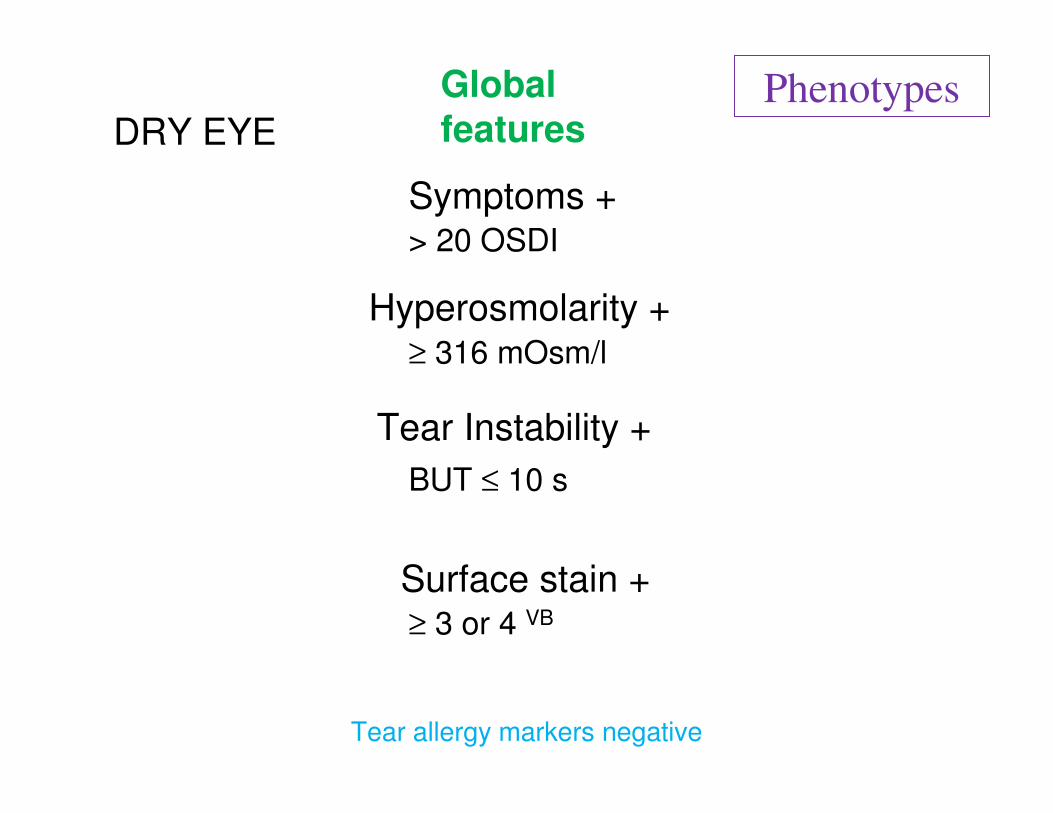
Symptoms +
Hyperosmolarity +
Tear Instability +
Surface stain +
≥ 316 mOsm/l
BUT ≤ 10 s
≥ 3 or 4 VB
> 20 OSDI
DRY EYE
Global
features
Tear allergy markers negative
Phenotypes
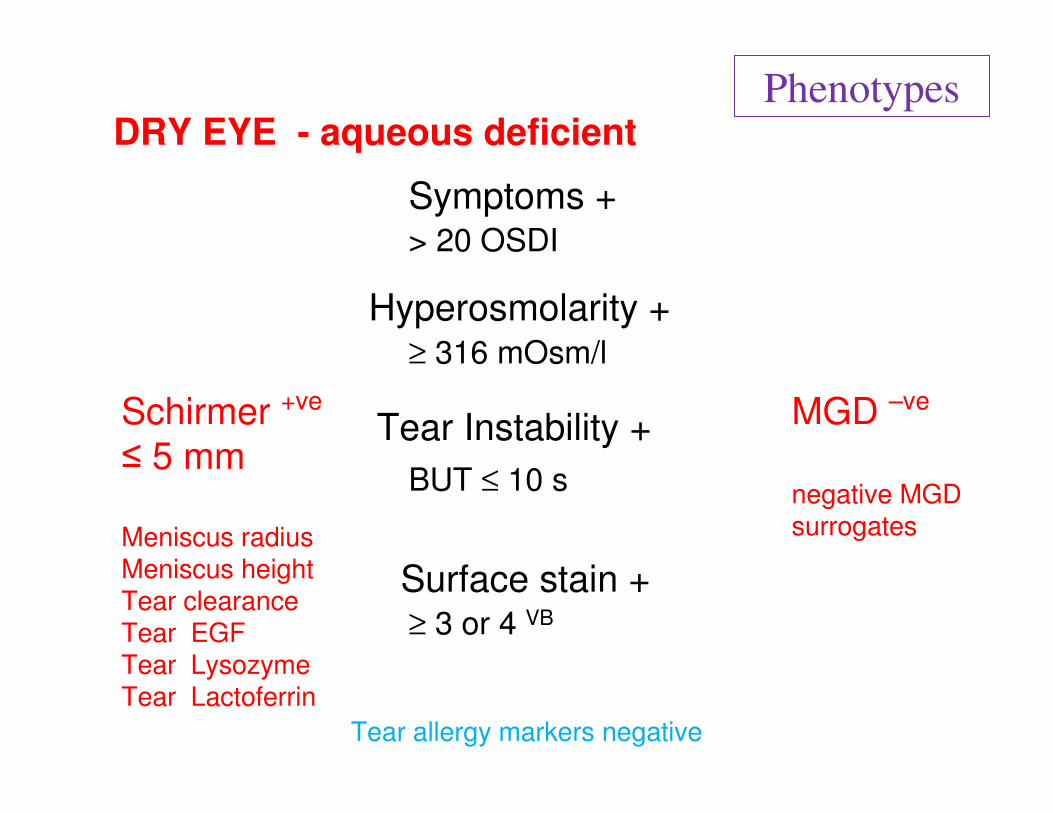
Symptoms +
Hyperosmolarity +
Tear Instability +
Surface stain +
≥ 316 mOsm/l
BUT ≤ 10 s
≥ 3 or 4 VB
> 20 OSDI
MGD –ve
negative MGD surrogates
Schirmer +ve
≤ 5 mm
DRY EYE - aqueous deficient
Meniscus radiusMeniscus heightTear clearanceTear EGFTear LysozymeTear Lactoferrin
Tear allergy markers negative
Phenotypes

Symptoms +
Hyperosmolarity +
Tear Instability +
Surface stain +
MGD –ve
negative MGD surrogates
≥ 316 mOsm/l
BUT ≤ 10 s
≥ 3 or 4 VB
> 20 OSDI
Schirmer +ve
≤ 5 mm
DRY EYE - aqueous deficient
Meniscus radiusMeniscus heightTear clearanceTear EGFTear LysozymeTear Lactoferrin
Tear allergy markers negative
Phenotypes
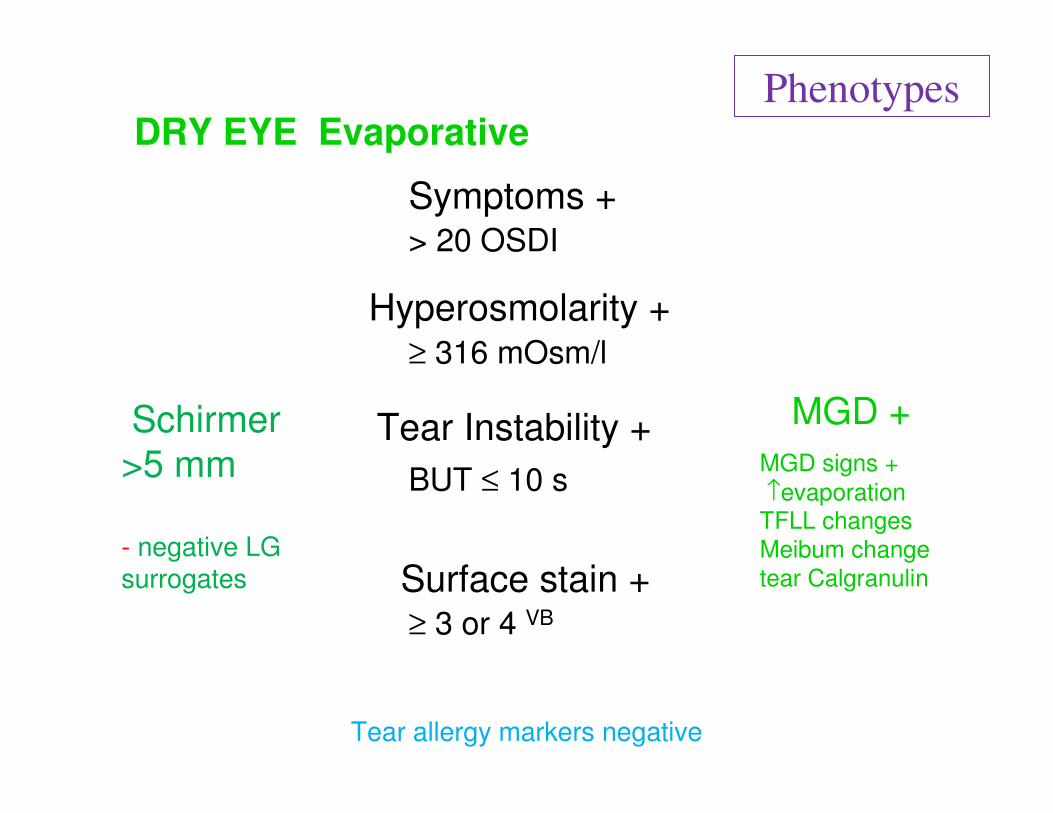
Symptoms +
Tear Instability +
BUT ≤ 10 s
Hyperosmolarity +≥ 316 mOsm/l
Surface stain +≥ 3 or 4 VB
> 20 OSDI
MGD signs +
↑evaporationTFLL changes
Meibum change
tear Calgranulin
MGD +
DRY EYE Evaporative
Schirmer
>5 mm
- negative LG surrogates
Tear allergy markers negative
Phenotypes
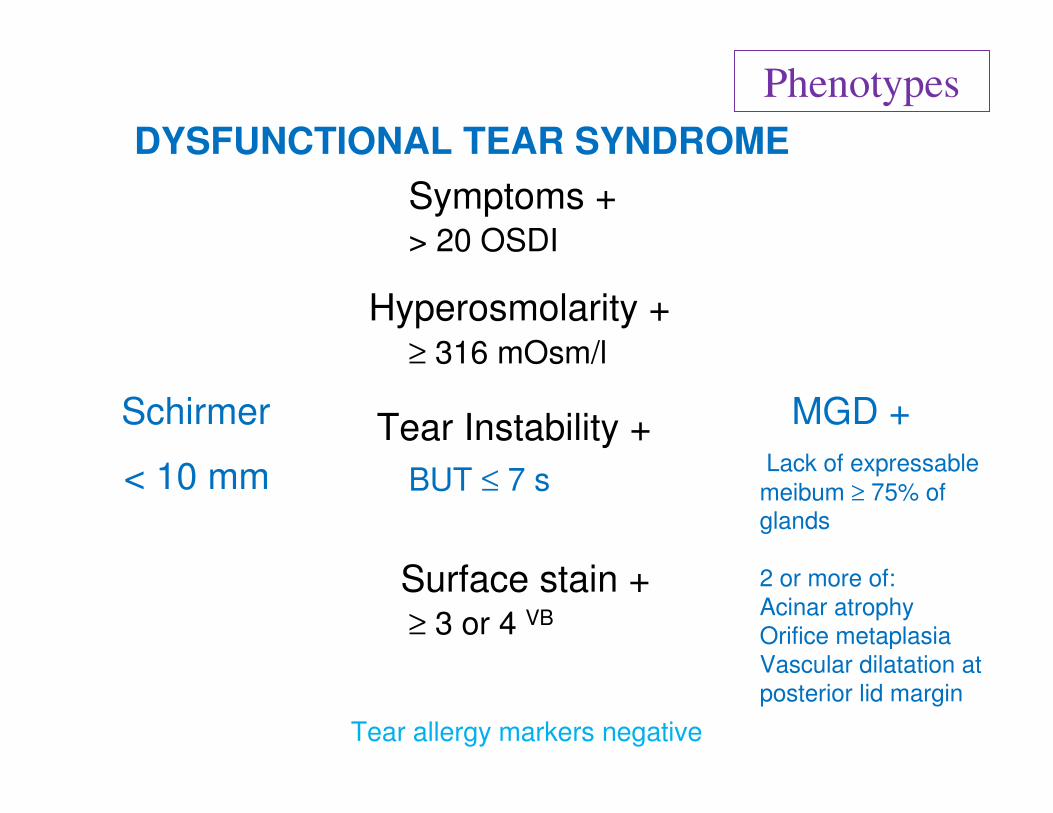
Symptoms +
Tear Instability +
Surface stain +
Hyperosmolarity +≥ 316 mOsm/l
≥ 3 or 4 VB
> 20 OSDI
Lack of expressable
meibum ≥ 75% of glands
2 or more of:
Acinar atrophy
Orifice metaplasia
Vascular dilatation at
posterior lid margin
BUT ≤ 7 s
MGD +Schirmer
DYSFUNCTIONAL TEAR SYNDROME
< 10 mm
Tear allergy markers negative
Phenotypes
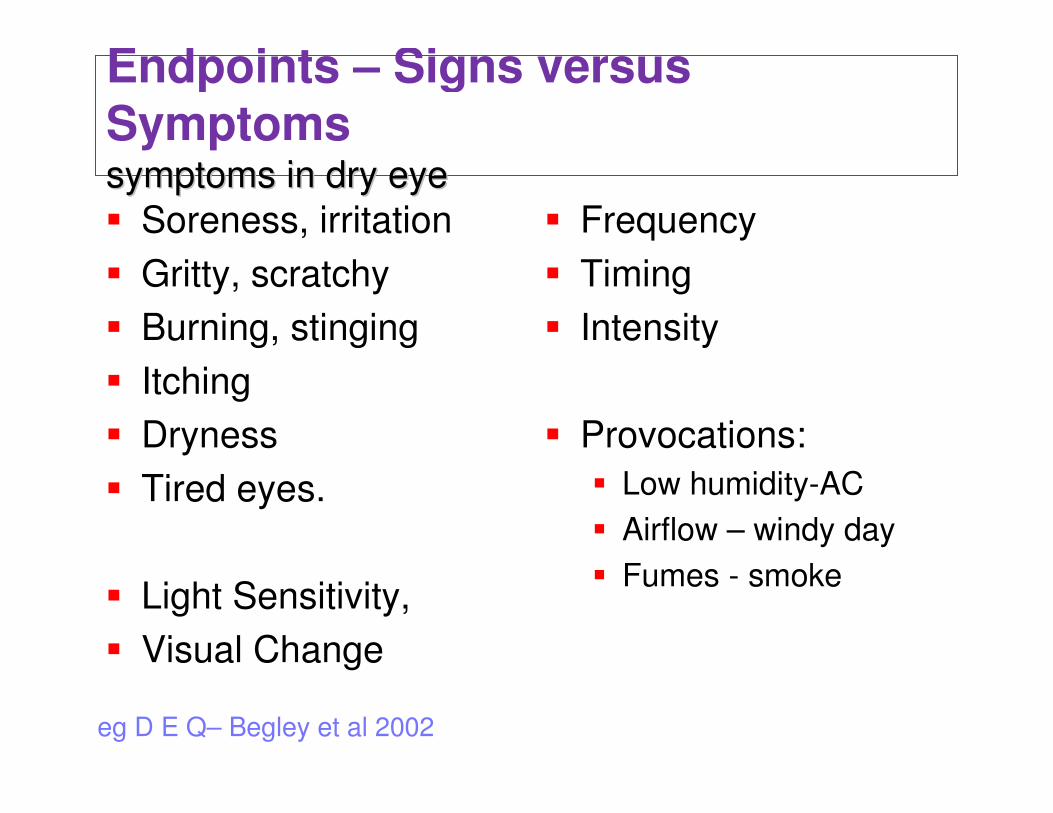
� Soreness, irritation
� Gritty, scratchy
� Burning, stinging
� Itching
� Dryness
� Tired eyes.
� Light Sensitivity,
� Visual Change
� Frequency
� Timing
� Intensity
� Provocations:
� Low humidity-AC
� Airflow – windy day
� Fumes - smoke
eg D E Q– Begley et al 2002
Endpoints – Signs versus
Symptoms symptoms in dry eyesymptoms in dry eye

Symptom
Measurement• In dry eye, whose major
feature is symptoms,
there is no surrogate for
symptom measurement
• Validated
Questionnaires are
available
• Biomarkers whose
levels correlate with
symptom severity are of
interest because they
may be closer to
symptom mechanisms
Name # of
questions
Author
Womens Health
3 Schaumberg et al.
2003
Sjögren Consensus
3 Vitali et al. 2002
Schein 6 Schein et al. 1997
McMonnies 12 McMonnies and Ho
1986
OSDI 12 Schiffman et al. 2000
SPEED 12 Korb et al. 2005
CANDEES 13 Doughty et al. 1997
DEQ 21 Begley et al. 2002
NEI-VFQ 25
OCULAR COMFORT INDEX
31 Johnson Murphy
2007
IDEEL 57 Rajagopalan et al.
2005
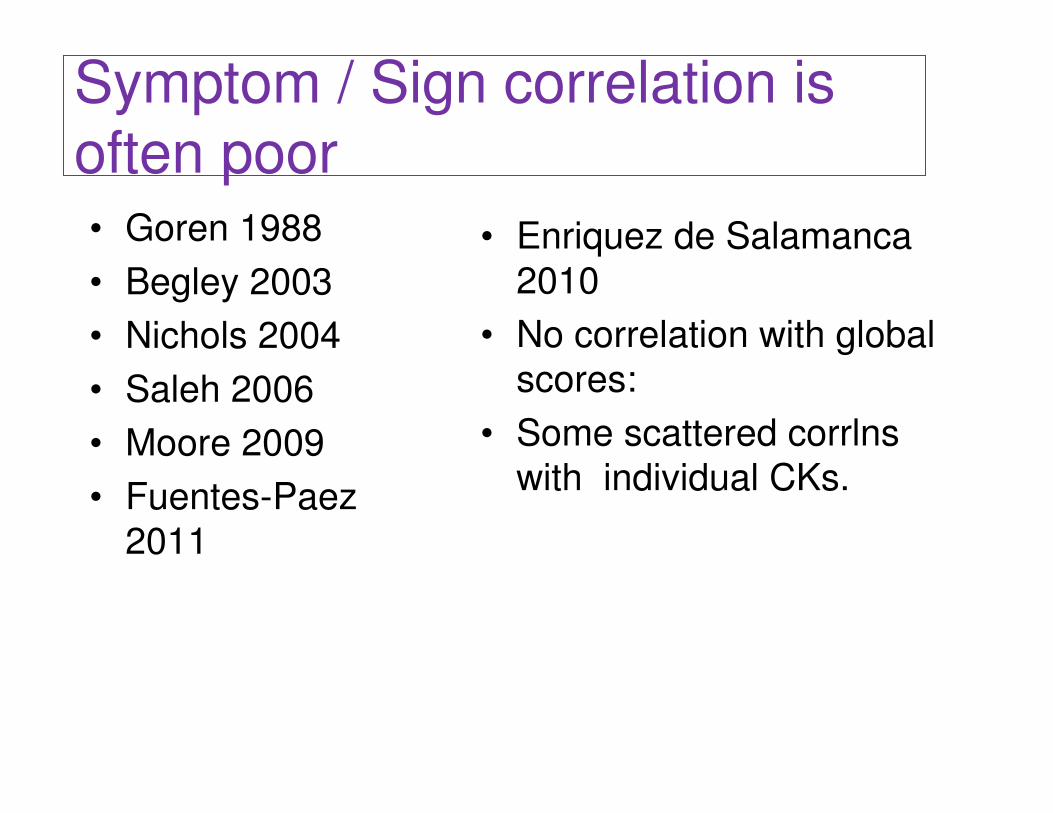
• Goren 1988
• Begley 2003
• Nichols 2004
• Saleh 2006
• Moore 2009
• Fuentes-Paez
2011
• Enriquez de Salamanca
2010
• No correlation with global
scores:
• Some scattered corrlns
with individual CKs.
Symptom / Sign correlation is
often poor
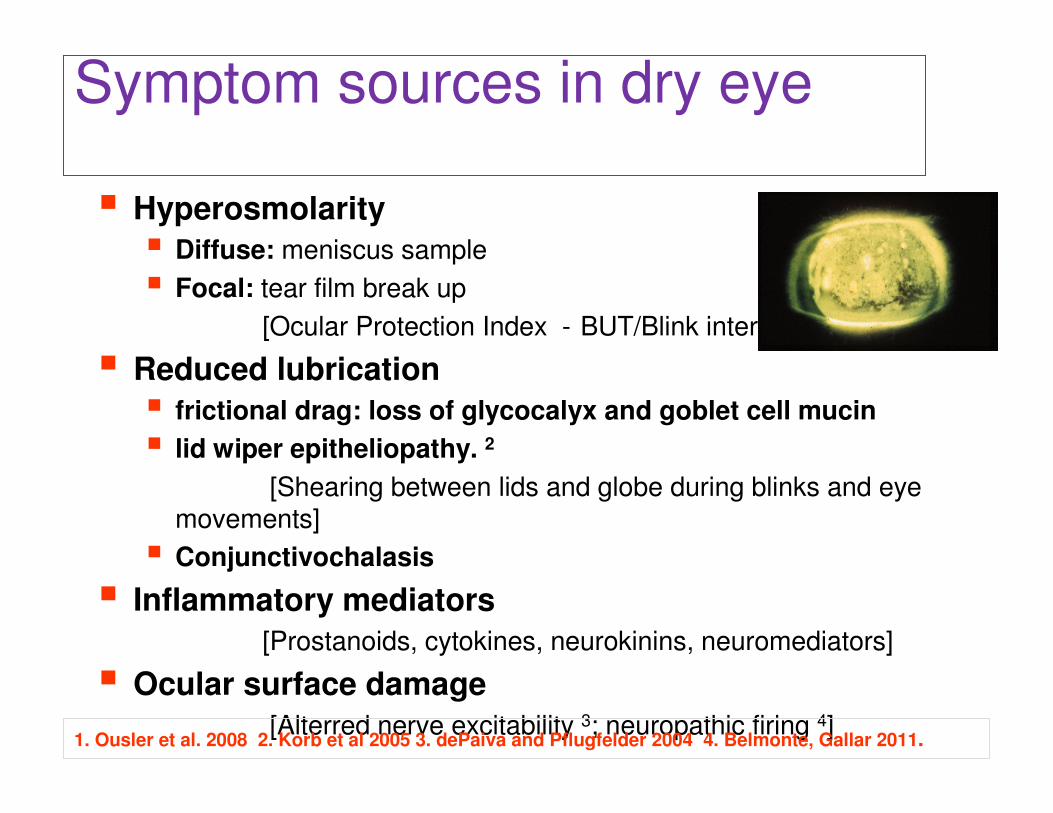
� Hyperosmolarity
� Diffuse: meniscus sample
� Focal: tear film break up
[Ocular Protection Index - BUT/Blink interval].1
� Reduced lubrication
� frictional drag: loss of glycocalyx and goblet cell mucin
� lid wiper epitheliopathy. 2
[Shearing between lids and globe during blinks and eye movements]
� Conjunctivochalasis
� Inflammatory mediators
[Prostanoids, cytokines, neurokinins, neuromediators]
� Ocular surface damage
[Alterred nerve excitability 3; neuropathic firing 4]1. Ousler et al. 2008 2. Korb et al 2005 3. dePaiva and Pflugfelder 2004 4. Belmonte, Gallar 2011.
Symptom sources in dry eye
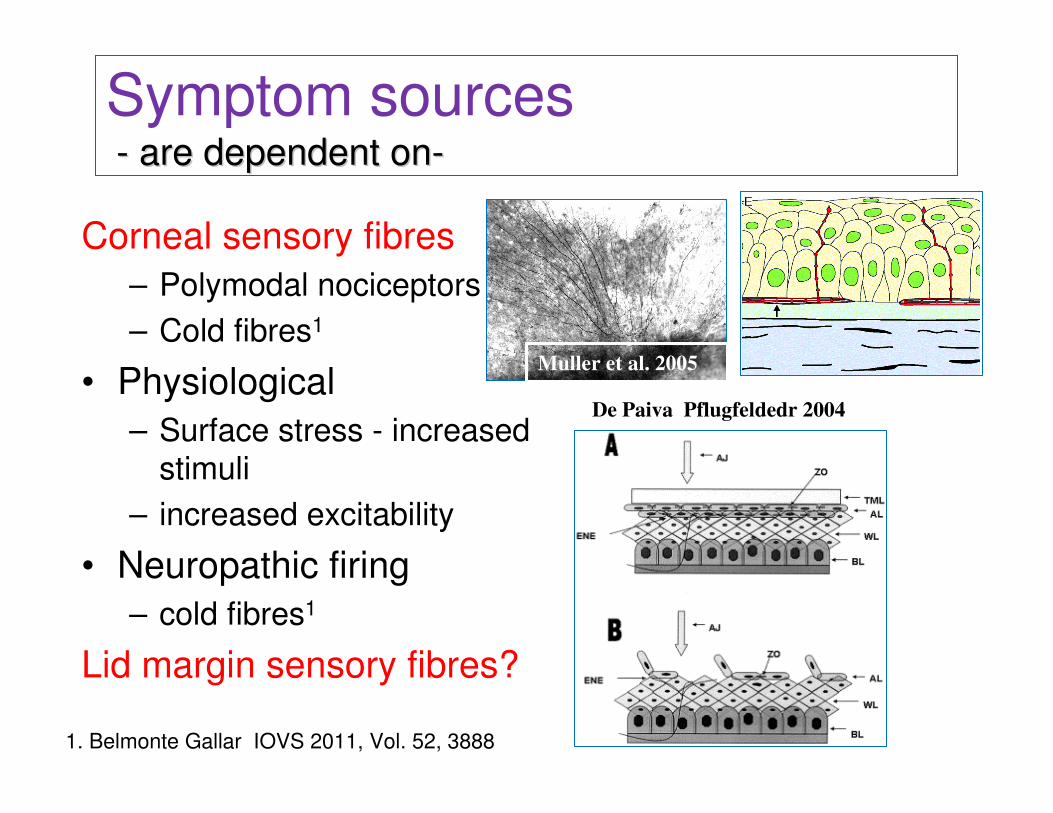
Corneal sensory fibres
– Polymodal nociceptors
– Cold fibres1
• Physiological
– Surface stress - increased
stimuli
– increased excitability
• Neuropathic firing
– cold fibres1
Lid margin sensory fibres?
Muller et al. 2005
De Paiva Pflugfeldedr 2004
1. Belmonte Gallar IOVS 2011, Vol. 52, 3888
Symptom sources-- are dependent onare dependent on--
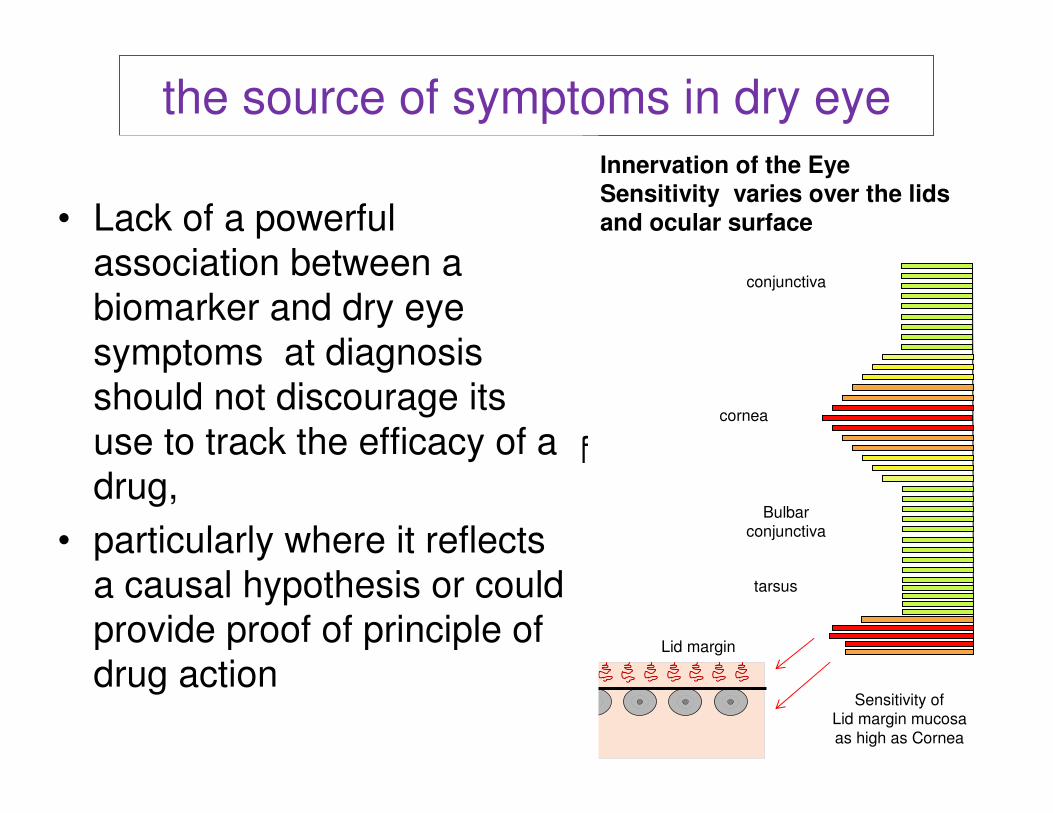
the source of symptoms in dry eye
6.064%
Innervation of the EyeSensitivity varies over the lids
and ocular surface
conjunctiva
cornea
Lid margin
Bulbarconjunctiva
tarsus
Lid margin mucosa
Lid margin skin Lawrenson and Ruskell 1993;
McGowan et al 1994
• Many sources of symptoms
whose relative contribution
may change with stage of
disease.
• Current symptoms may
reflect the cumulative effect of
several causes.
• Studies needed to identify
lid/MGD specific symptoms
• Lack of a powerful
association between a
biomarker and dry eye
symptoms at diagnosis
should not discourage its
use to track the efficacy of a
drug,
• particularly where it reflects
a causal hypothesis or could
provide proof of principle of
drug actionSensitivity of
Lid margin mucosa
as high as Cornea
Tissue sampling - variables affecting measurement
Tear samples
• Capillaries v absorbent materials; eye wash
• Available volume
– ADDE low; EDE normal?
• Reflex tearing and sample dilution.
– ADDE – falls with severity; EDE rises?
• Value of tiny, nL samples - repeatability
– Instant analysis (osmolarity); or multistep
• Ocular surface permeability-molecular size of
biomarker
– conjunctiva / cornea; vascular/epithelial.
• Biomarker ratios in single samples
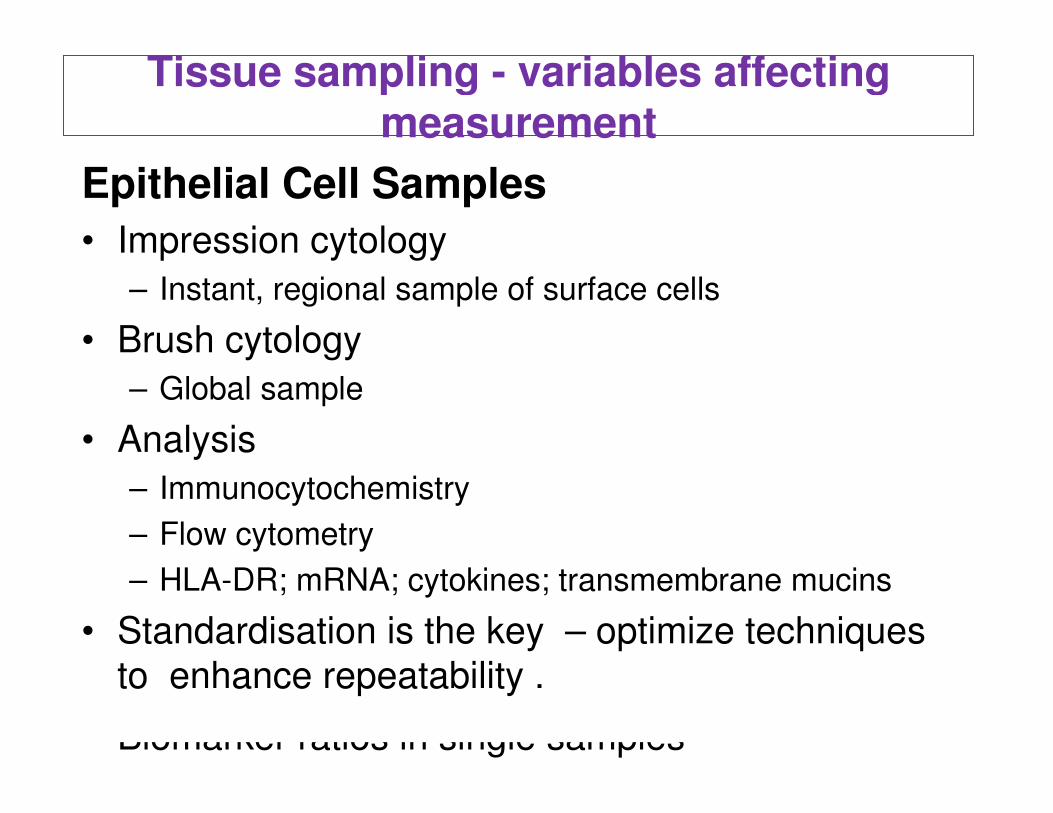
Epithelial Cell Samples
• Impression cytology
– Instant, regional sample of surface cells
• Brush cytology
– Global sample
• Analysis
– Immunocytochemistry
– Flow cytometry
– HLA-DR; mRNA; cytokines; transmembrane mucins
• Standardisation is the key – optimize techniques
to enhance repeatability .

Molecular Biomarker Technologies
• Electrophoresis: 1D; 2D
gels
• ELISA sandwich
• Protein arrays (beads,
blots)
• Western blot
• LC-MS
• SELDI/TOF
• MALDI/TOF
• LC MALDI
• LC-MS/MS
• iTRAQ proteomics
• Bioinformatics –
protein networks.
Waters
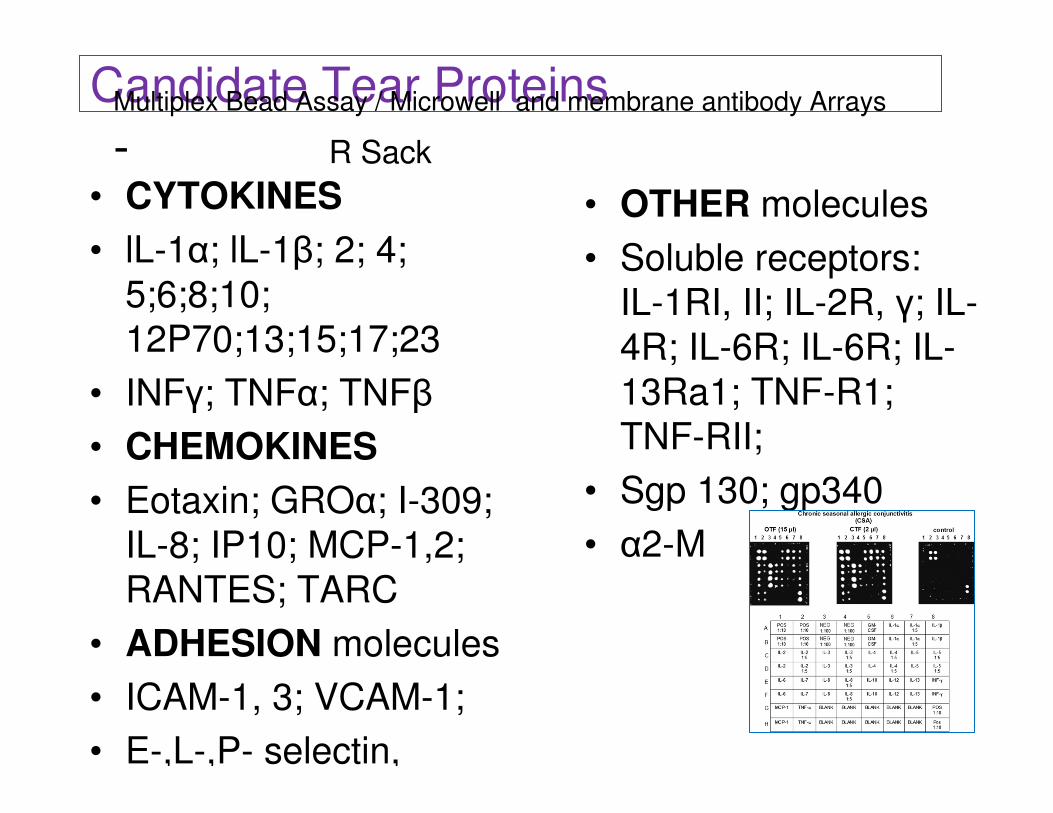
Candidate Tear Proteins
• CYTOKINES
• lL-1α; lL-1β; 2; 4;
5;6;8;10;
12P70;13;15;17;23
• INFγ; TNFα; TNFβ
• CHEMOKINES
• Eotaxin; GROα; I-309;
IL-8; IP10; MCP-1,2;
RANTES; TARC
• ADHESION molecules
• ICAM-1, 3; VCAM-1;
• E-,L-,P- selectin,
• OTHER molecules
• Soluble receptors:
IL-1RI, II; IL-2R, γ; IL-
4R; IL-6R; IL-6R; IL-
13Ra1; TNF-R1;
TNF-RII;
• Sgp 130; gp340
• α2-M
Multiplex Bead Assay / Microwell and membrane antibody Arrays
- R Sack
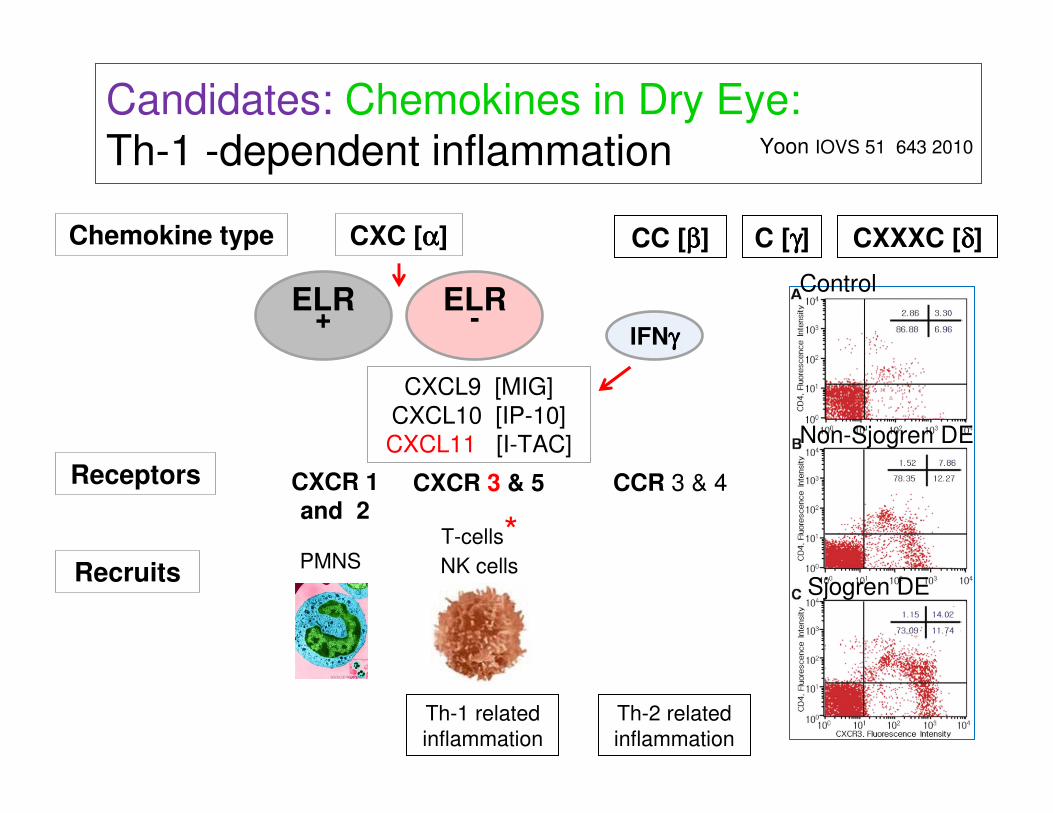
Candidates: Chemokines in Dry Eye: Th-1 -dependent inflammation
ELR +
CXC [αααα] CC [ββββ] C [γγγγ] CXXXC [δδδδ]
ELR -
CXCR 1
and 2CXCR 3 & 5
CXCL9 [MIG]
CXCL10 [IP-10]
CXCL11 [I-TAC]
CCR 3 & 4
Yoon IOVS 51 643 2010
Chemokine type
Receptors
RecruitsPMNS
T-cells*NK cells
IFNγγγγ
Th-1 related
inflammation
Th-2 related
inflammation
Control
Sjogren DE
Non-Sjogren DE
• Capillary tears: ELISA;
CIC flow cytometry.
• Increase in:
– IFNγ -inducible
ELR- CXC
chemokines in DE
tears. CXCL 9, 10
esp 11, and
– CXCR3+ Th 1 type
cells in conj.
epithelium.
• CXCR3+ CD4+ conj. cells –
main effectors of lac. and
conj. epithelial damage?
• CXCL 11 levels correlated
with
– low basal Schirmer,
– low tear clearance,
– kerato-epitheliopathy,
– reduced goblet cell
density.
Candidates: Chemokines in Dry Eye Th-1 -dependent inflammation Yoon IOVS 51 643 2010
• IL-1α,β, IL-6, 8 (CXCL8) IL-10,
12(p70), 13
• IFNα;TNFα
• Macrophage inflam
protein (MIP-1α) CCL3
• RANTES CCL5
• EGF
• These cytokines &
MIP-1α correlated with DEWS severity
grade:
• IL-6 correlated with
severity of symptoms
and signs
• EGF levels correlated
with the Schirmer
value and inversely
with corneal staining.
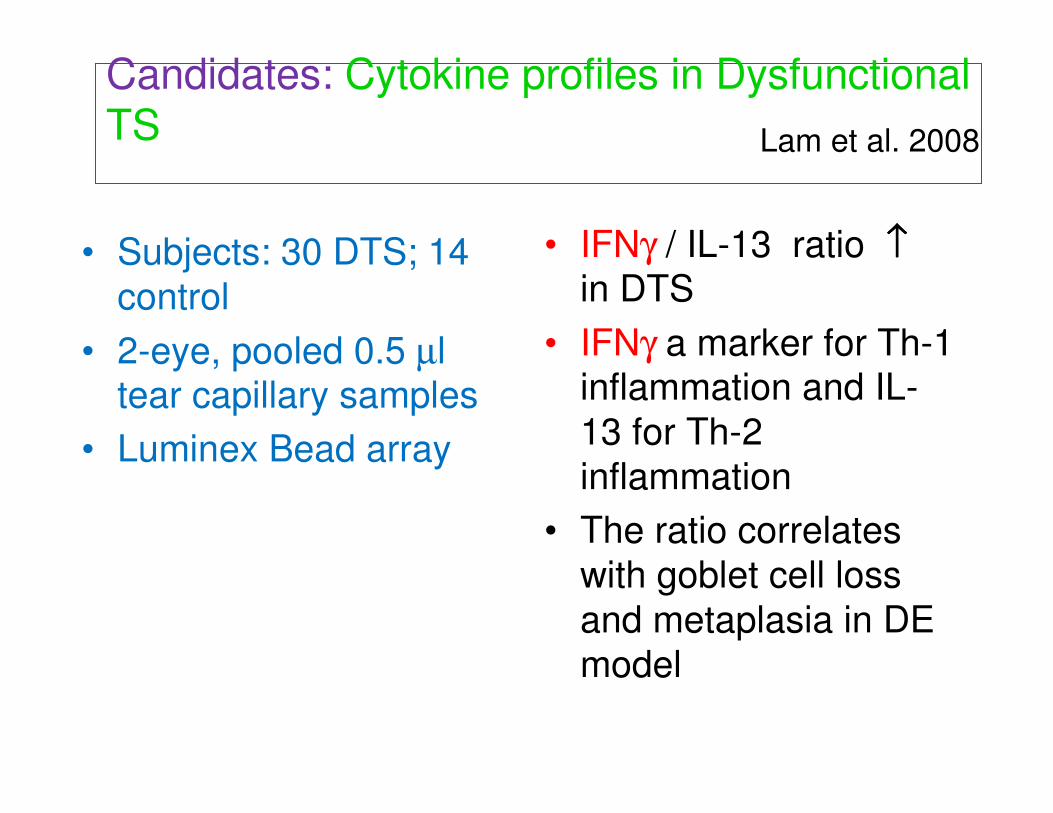
• Subjects: 30 DTS; 14
control
• 2-eye, pooled 0.5 µl tear capillary samples
• Luminex Bead array
Candidates: Cytokine profiles in Dysfunctional TS Lam et al. 2008
• Subjects: 30 DTS; 14
control
• 2-eye, pooled 0.5 µl tear capillary samples
• Luminex Bead array
Candidates: Cytokine profiles in Dysfunctional TS Lam et al. 2008
• IFNγ / IL-13 ratio ↑↑↑↑in DTS
• IFNγ a marker for Th-1 inflammation and IL-
13 for Th-2
inflammation
• The ratio correlates
with goblet cell loss
and metaplasia in DE
model

• Subjects: 19 DTS;
16 control (+subset)
• 2-eye, pooled 0.5 µl tear capillary
samples
• Tear immunoassay,
CIC RNA real-time
PCR
Candidates: MMP9 in Dysfunctional TSChotikavanich et al. 2009
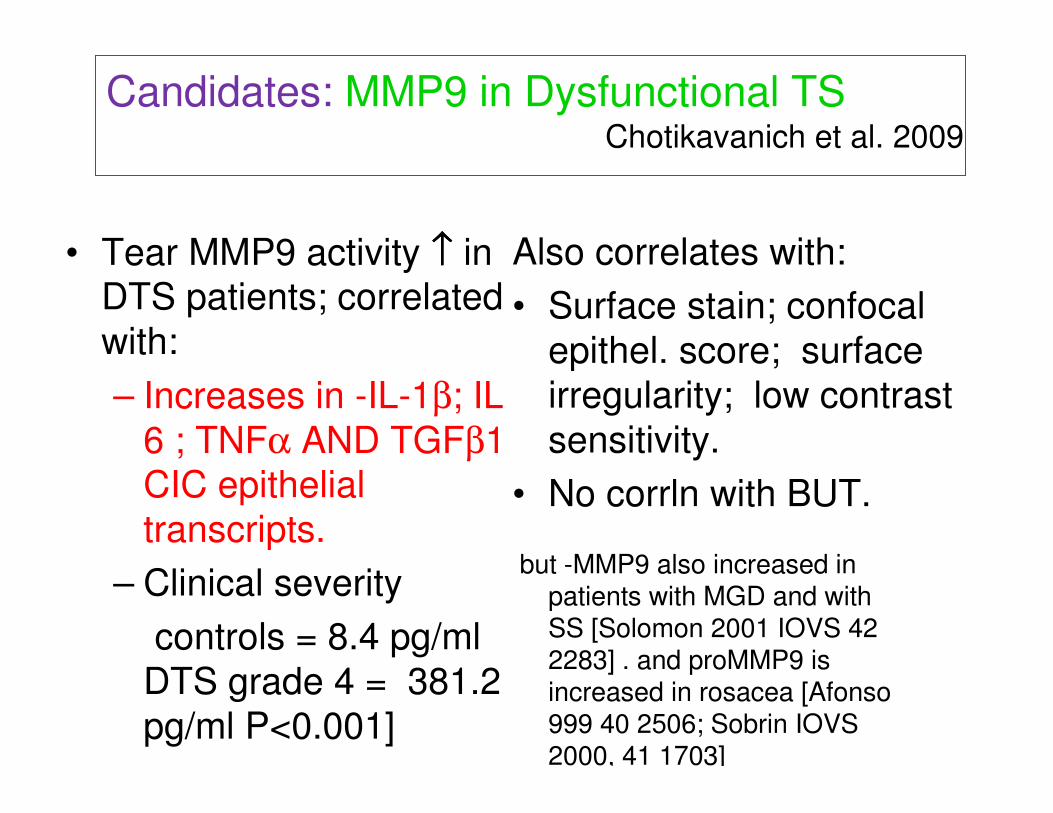
• Tear MMP9 activity ↑↑↑↑ in DTS patients; correlated
with:
– Increases in -IL-1β; IL-
6 ; TNFα AND TGFβ1 CIC epithelial
transcripts.
– Clinical severity
controls = 8.4 pg/ml
DTS grade 4 = 381.2
pg/ml P<0.001]
Candidates: MMP9 in Dysfunctional TS
Increased RNA epithelial transcripts in DTSAlso correlates with:
• Surface stain; confocal
epithel. score; surface
irregularity; low contrast
sensitivity.
• No corrln with BUT.
Chotikavanich et al. 2009
but -MMP9 also increased in patients with MGD and with SS [Solomon 2001 IOVS 42 2283] . and proMMP9 is increased in rosacea [Afonso 999 40 2506; Sobrin IOVS 2000, 41 1703]

Candidates: tear and membrane bound MUC1 Caffery
2010
• The trans membrane
mucin MUC 1 is a key
component of the ocular
surface glycocalyx.
• Cleavage of the
exodomain releases
soluble MUC1 into the
tears.
Goblet cell
Ocular surface
mucins are:
MUC1, MUC2,
MUC4, MUC5AC,
MUC7, MUC13,
MUC15, MUC16,
and MUC17.
MUC 1
Argueso Gipson 2001
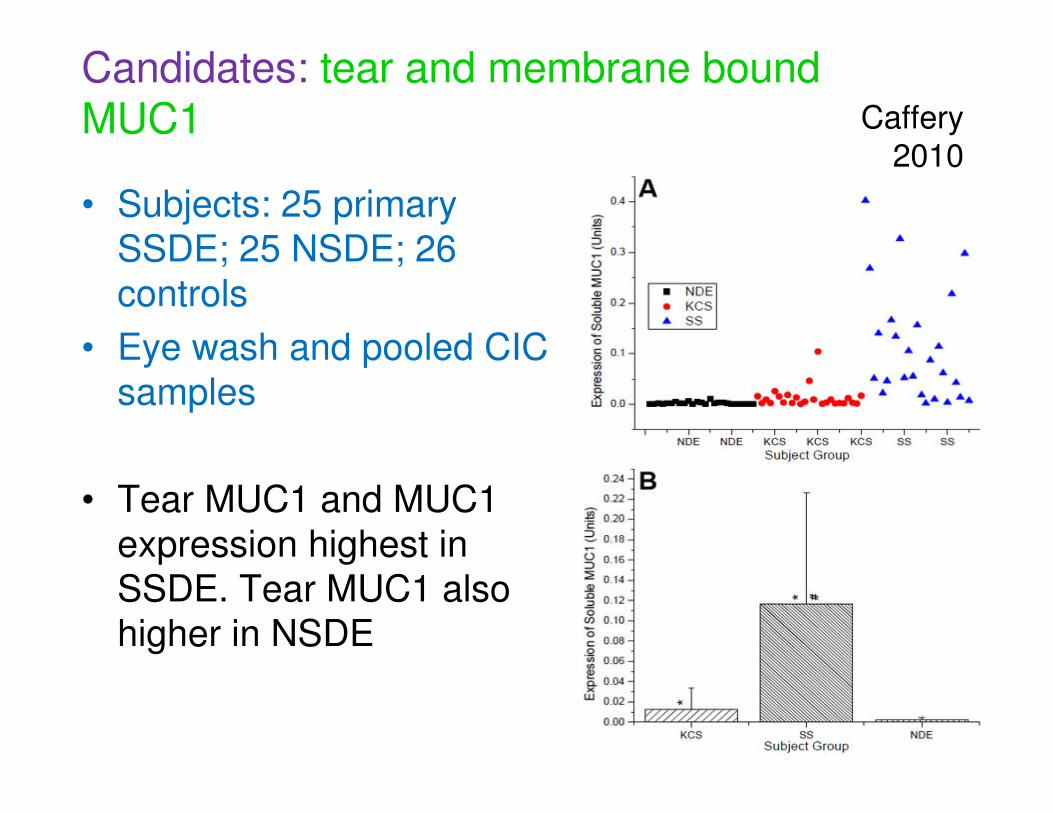
• Subjects: 25 primary
SSDE; 25 NSDE; 26
controls
• Eye wash and pooled CIC
samples
• Tear MUC1 and MUC1
expression highest in
SSDE. Tear MUC1 also
higher in NSDE
Candidates: tear and membrane bound MUC1 Caffery
2010
• Subjects: 38
NSDE; 43
controls.
• Individual CIC
samples
Candidates: tear and membrane bound MUC1 Corrales 2011
• Expression of MUC 1, 2,
4 and 5AC lower in
NSDE
• Using MUC1 expression
in dry eye diagnosis:
DR12.5 = 83.3 %
• Validated in additional
control and DE groups.
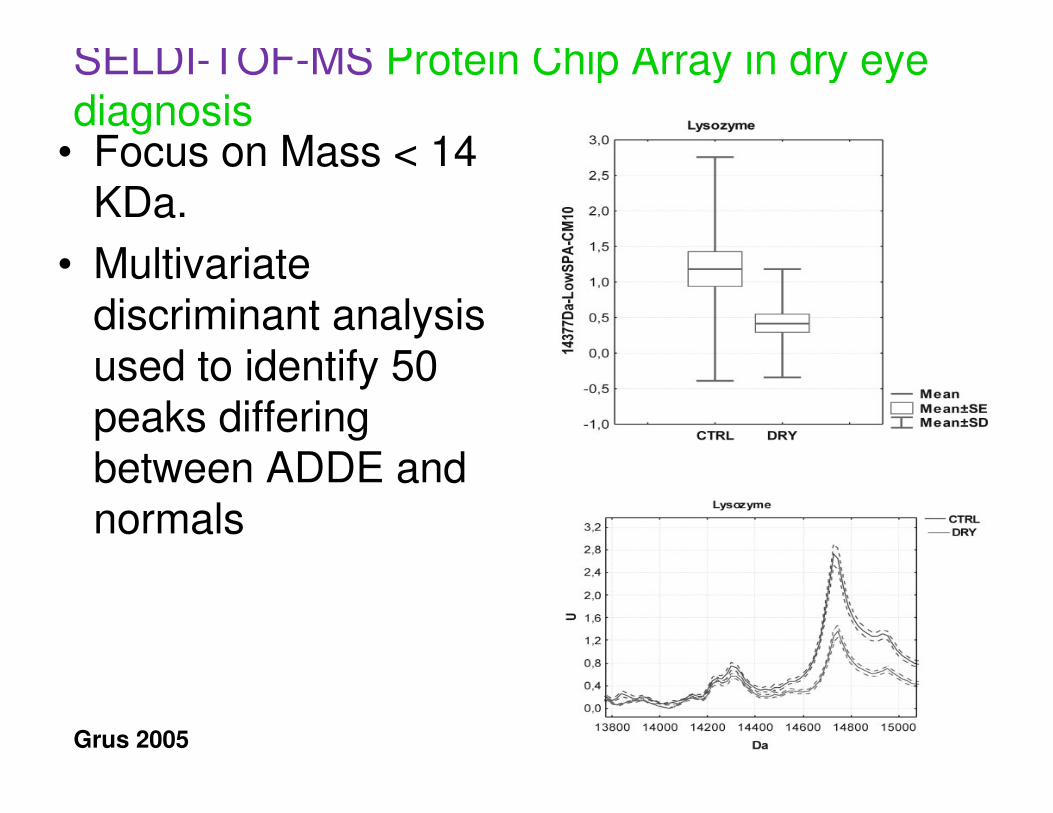
SELDI-TOF-MS Protein Chip Array in dry eye diagnosis
• Focus on Mass < 14 KDa.
• Multivariate discriminant analysis used to identify 50 peaks differing between ADDE and normals
Grus 2005
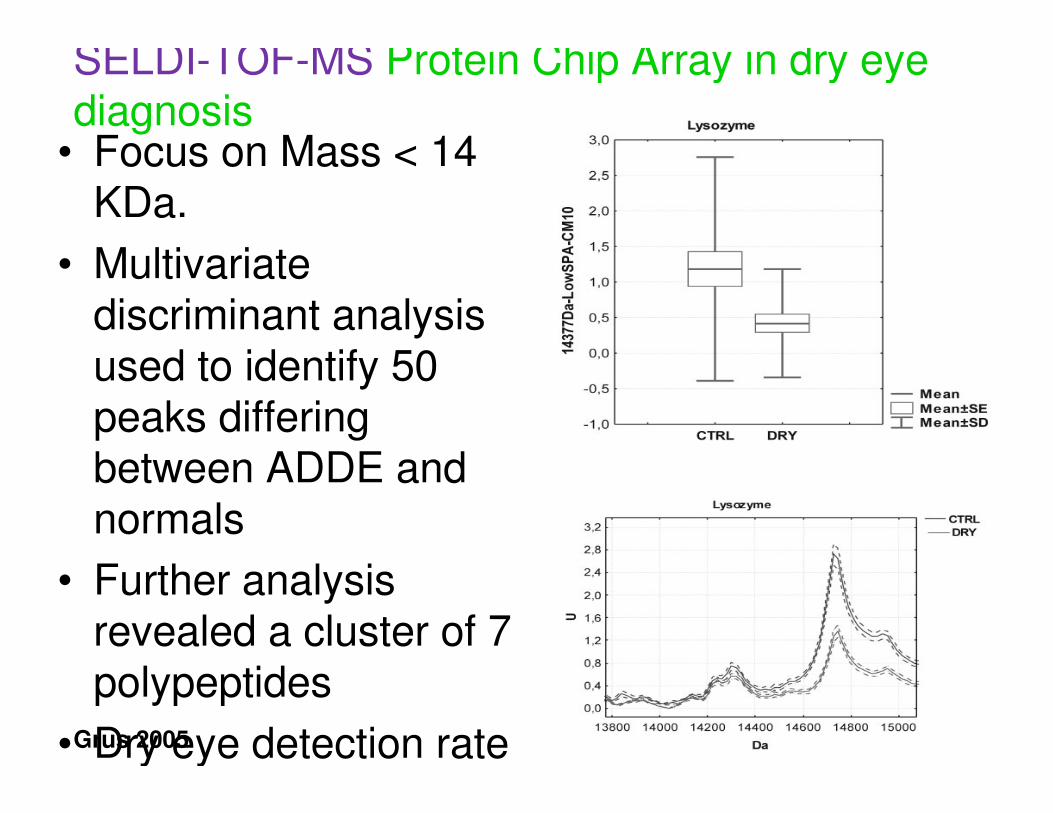
SELDI-TOF-MS Protein Chip Array in dry eye diagnosis
• Focus on Mass < 14 KDa.
• Multivariate discriminant analysis used to identify 50 peaks differing between ADDE and normals
• Further analysis revealed a cluster of 7 polypeptides
• Dry eye detection rate Grus 2005
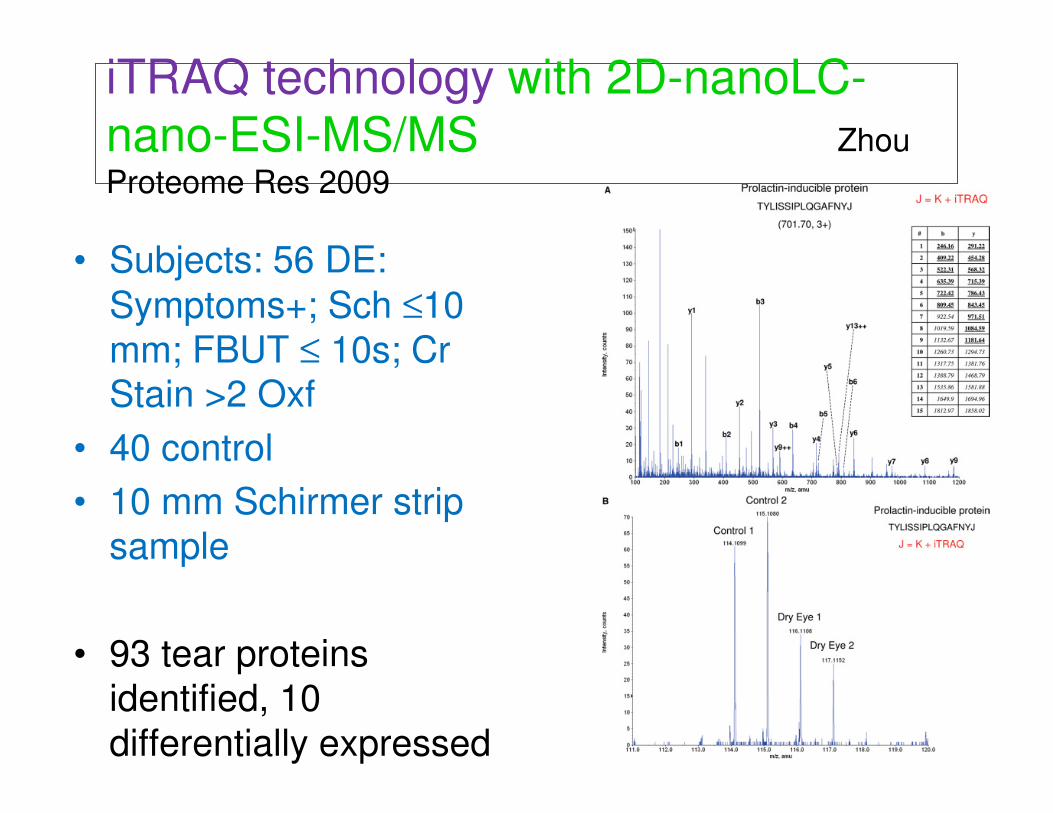
iTRAQ technology with 2D-nanoLC-
nano-ESI-MS/MS Zhou
Proteome Res 2009
• Subjects: 56 DE:
Symptoms+; Sch ≤10
mm; FBUT ≤ 10s; Cr Stain >2 Oxf
• 40 control
• 10 mm Schirmer strip
sample
• 93 tear proteins
identified, 10
differentially expressed
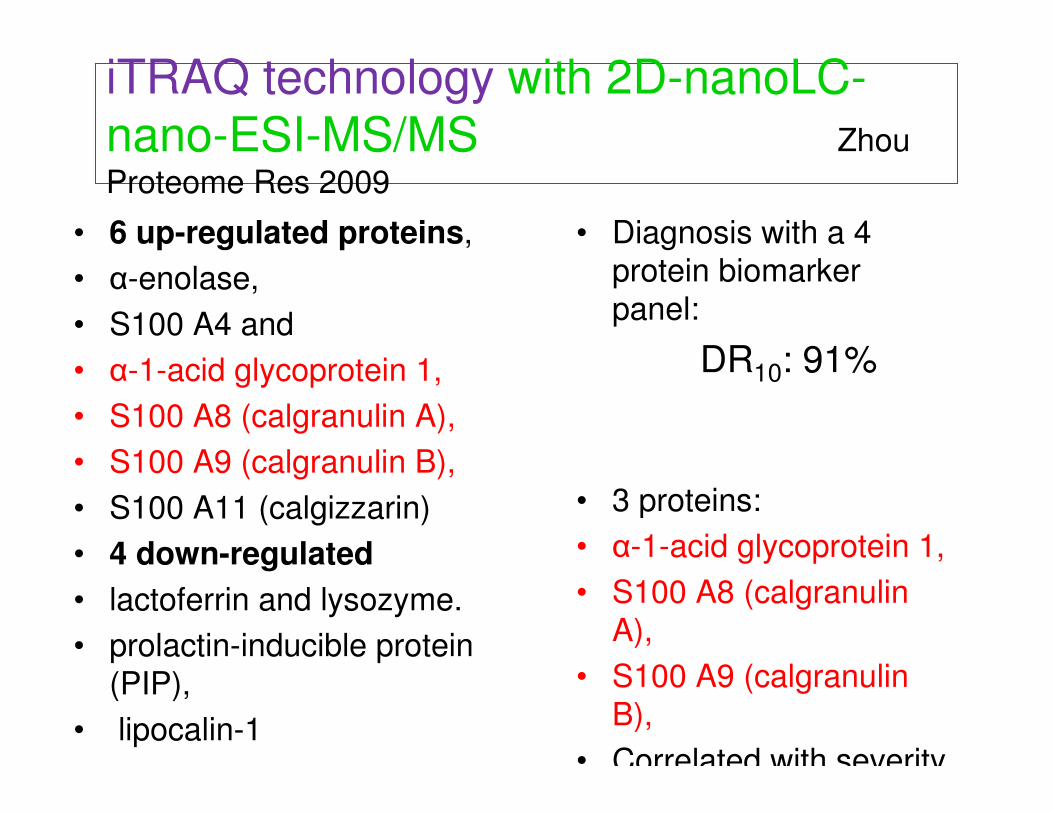
• 6 up-regulated proteins,
• α-enolase,
• S100 A4 and
• α-1-acid glycoprotein 1,
• S100 A8 (calgranulin A),
• S100 A9 (calgranulin B),
• S100 A11 (calgizzarin)
• 4 down-regulated
• lactoferrin and lysozyme.
• prolactin-inducible protein
(PIP),
• lipocalin-1
• Diagnosis with a 4 protein biomarker
panel:
DR10: 91%
• 3 proteins:
• α-1-acid glycoprotein 1,
• S100 A8 (calgranulin
A),
• S100 A9 (calgranulin
B),
• Correlated with severity
iTRAQ technology with 2D-nanoLC-
nano-ESI-MS/MS Zhou
Proteome Res 2009
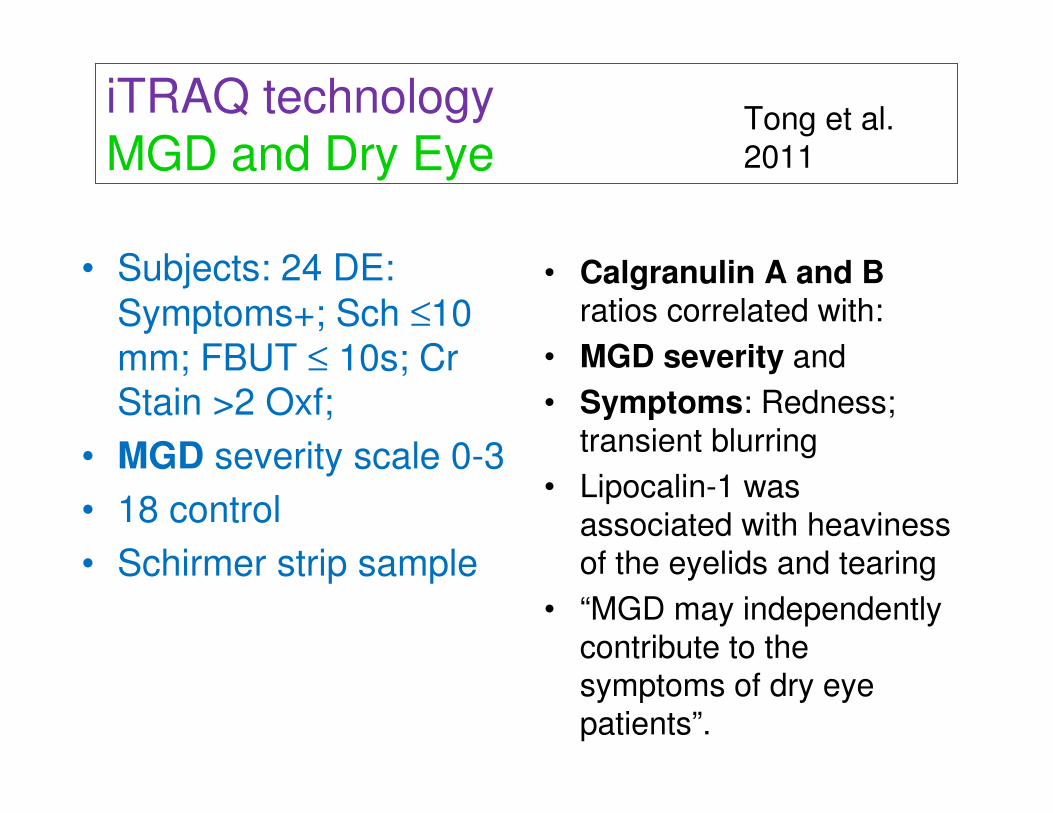
Tong et al.
2011
• Calgranulin A and B ratios correlated with:
• MGD severity and
• Symptoms: Redness;
transient blurring
• Lipocalin-1 was
associated with heaviness
of the eyelids and tearing
• “MGD may independently
contribute to the symptoms of dry eye
patients”.
• Subjects: 24 DE:
Symptoms+; Sch ≤10
mm; FBUT ≤ 10s; Cr Stain >2 Oxf;
• MGD severity scale 0-3
• 18 control
• Schirmer strip sample
iTRAQ technology
MGD and Dry Eye
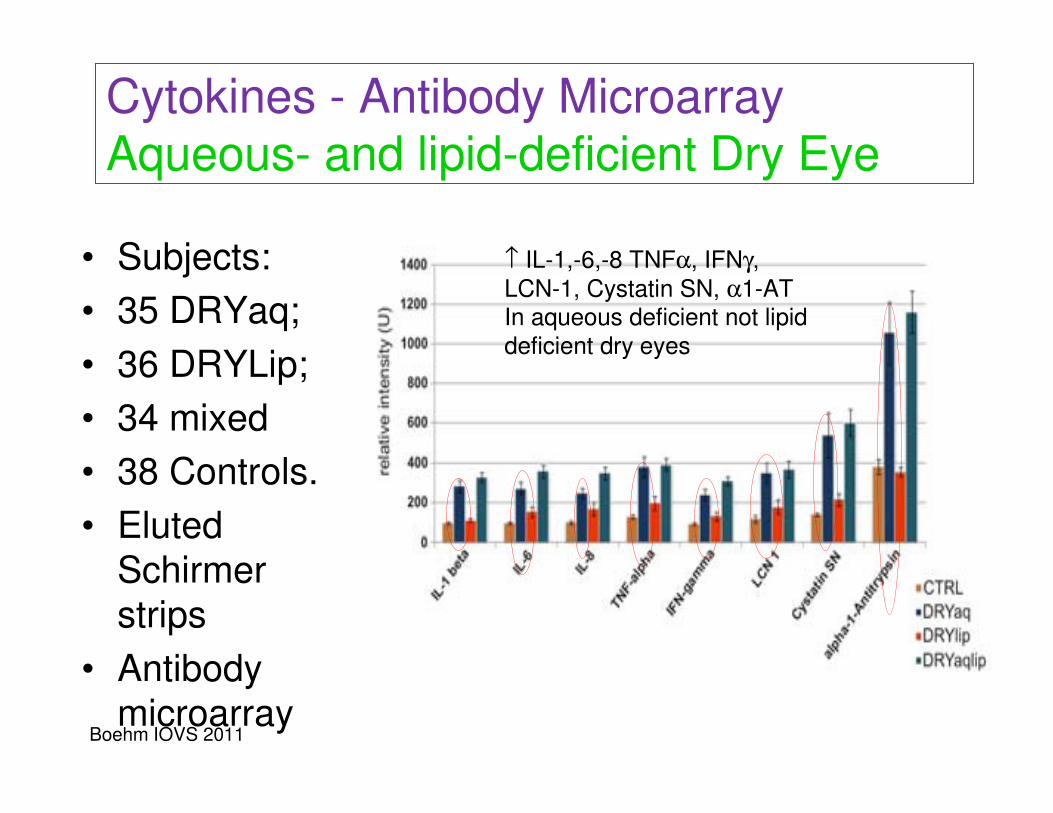
• Subjects:
• 35 DRYaq;
• 36 DRYLip;
• 34 mixed
• 38 Controls.
• Eluted
Schirmer
strips
• Antibody
microarray
Cytokines - Antibody Microarray
Aqueous- and lipid-deficient Dry Eye
↑ IL-1,-6,-8 TNFα, IFNγ,
LCN-1, Cystatin SN, α1-ATIn aqueous deficient not lipid
deficient dry eyes
Boehm IOVS 2011
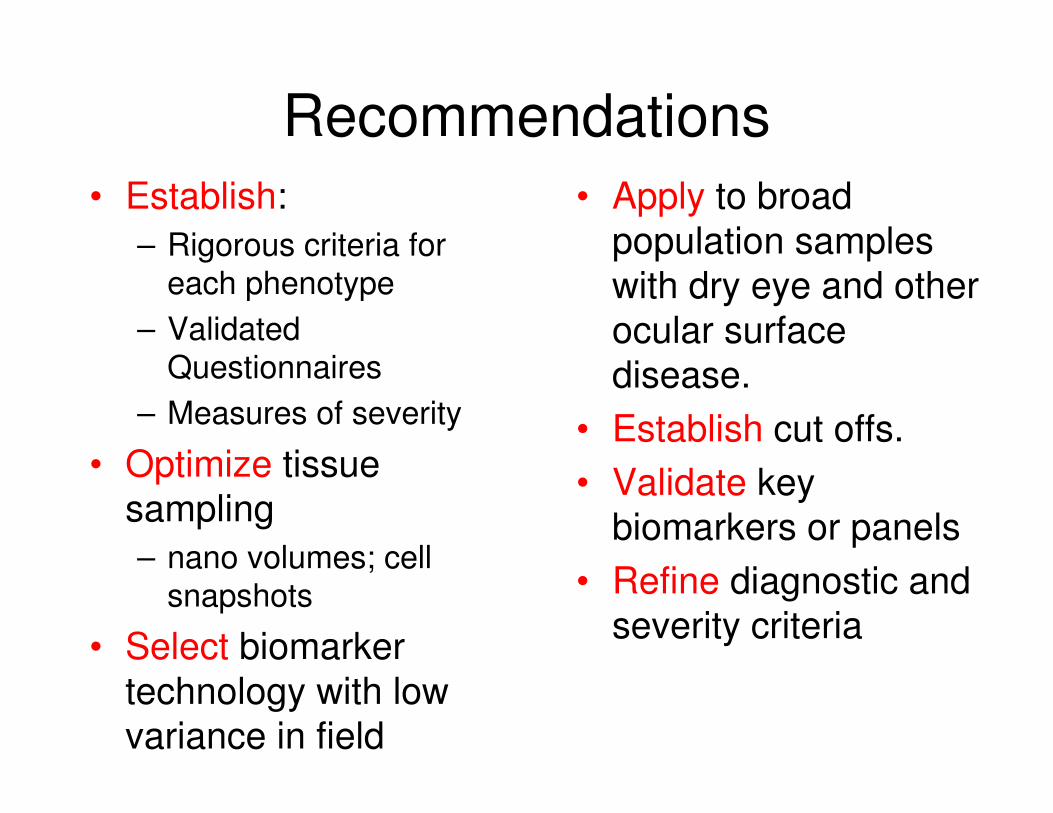
Recommendations
• Establish:
– Rigorous criteria for
each phenotype
– Validated
Questionnaires
– Measures of severity
• Optimize tissue
sampling
– nano volumes; cell
snapshots
• Select biomarker
technology with low
variance in field
conditions.
• Apply to broad
population samples
with dry eye and other
ocular surface
disease.
• Establish cut offs.
• Validate key
biomarkers or panels
• Refine diagnostic and
severity criteria

Thank You
for your
Attention