October 31, 2005 Dr. Michael Berndt Division of Lands...
24
October 31, 2005 Dr. Michael Berndt Senior Project Consultant Minnesota Department of Natural Resources Division of Lands and Minerals 500 Lafayette Road St. Paul, MN 55155-4045 Dear Dr. Berndt: Subject: Final Report for Mercury Vaporization Characteristics of Taconite Pellets UND Fund 9089 Enclosed is the final report for the subject project. If you have any questions or comments, I can be reached by phone at (701) 777-5127, by fax at (701) 777-5181, or by e-mail at [email protected]. Sincerely, Kevin C. Galbreath Research Manager KCG/nfp Enclosure
Transcript of October 31, 2005 Dr. Michael Berndt Division of Lands...
October 31, 2005 Dr. Michael Berndt Senior Project Consultant Minnesota Department of Natural Resources Division of Lands and Minerals 500 Lafayette Road St. Paul, MN 55155-4045 Dear Dr. Berndt: Subject: Final Report for Mercury Vaporization Characteristics of Taconite Pellets
UND Fund 9089 Enclosed is the final report for the subject project. If you have any questions or comments, I can be reached by phone at (701) 777-5127, by fax at (701) 777-5181, or by e-mail at [email protected]. Sincerely, Kevin C. Galbreath Research Manager KCG/nfp Enclosure

MERCURY VAPORIZATION CHARACTERISTICS OF TACONITE PELLETS Final Report (For the period of April 25–September 30, 2005) Prepared for: Dr. Michael Berndt Senior Project Consultant Minnesota Department of Natural Resources Division of Lands and Minerals 500 Lafayette Road St. Paul, MN 55155-4045
Prepared by:
Kevin C. Galbreath
Energy & Environmental Research Center University of North Dakota
PO Box 9018 Grand Forks, ND 58202-9018
2005-EERC-10-04 October 2005

EERC DISCLAIMER
LEGAL NOTICE This research report was prepared by the Energy & Environmental
Research Center (EERC), an agency of the University of North Dakota, as an account of work sponsored by Minnesota Department of Natural Resources. Because of the research nature of the work performed, neither the EERC nor any of its employees makes any warranty, express or implied, or assumes any legal liability or responsibility for the accuracy, completeness, or usefulness of any information, apparatus, product, or process disclosed, or represents that its use would not infringe privately owned rights. Reference herein to any specific commercial product, process, or service by trade name, trademark, manufacturer, or otherwise does not necessarily constitute or imply its endorsement or recommendation by the EERC.

MERCURY VAPORIZATION CHARACTERISTICS OF TACONITE PELLETS
ABSTRACT The Hg and other volatile components (e.g., H2O, CO2, HCl) of Hibtac and Minntac green ball samples were thermally released in air (± HCl addition) and 100% N2 in a stainless steel chamber by heating (~20°C/min) from about 25° to 1000°C. Total Hg and Hg0 concentrations in the heated gas stream were measured simultaneously every 10 s using dual individual-channel atomic absorption spectroscopy. The Hg release profiles from Hibtac and Minntac green balls in air were characterized by the rapid release of Hg0 at 200°–250°C followed by periodic releases of total Hg that exceeded Hg0 concentrations, suggesting that Hg2+ was liberated from 235° to 545°C. Hg0 and total Hg release concentrations peaked relatively rapidly with increasing temperature and then declined asymmetrically to baseline concentrations by about 600°C. Primarily Hg0 was released from the Hibtac and Minntac green balls in the 100% N2 atmosphere from about 200° to 650°C. The Hg0 release profiles were asymmetrical. The complexity of the Hg release profiles, as defined by the number and intensity of total Hg release peaks, was much less during analyses performed in 100% N2 relative to those performed in air. The reducing atmosphere inhibited magnetite oxidation and apparently the release of Hg2+. The addition of 50 ppmv HCl to air during the heating of Hibtac green balls simplified the total Hg release profile from 3 or 4 peaks to a single total Hg release peak centered at about 285°C. The difference between total Hg and Hg0 release concentrations suggested that, at most, about 40% of the total Hg was being released as Hg2+ at any given time and temperature. The addition of 100 ppmv HCl to air during the heating of Minntac green balls promoted the thermal release of total Hg, possibly as HgCl2, at the expense of Hg0.

i
TABLE OF CONTENTS LIST OF FIGURES ........................................................................................................................ ii LIST OF TABLES.......................................................................................................................... ii INTRODUCTION .......................................................................................................................... 1 BACKGROUND ............................................................................................................................ 1 EXPERIMENTAL.......................................................................................................................... 2 RESULTS AND DISCUSSION..................................................................................................... 5 Green Ball Hg Contents ................................................................................................ 5
Evaluation of the Bench-Scale Thermal Release Analyzer .......................................... 6 Thermal Release Analyses of Green Ball Samples....................................................... 6
Thermal Release Analysis of Hg from Green Balls in Air (30% O2–70% N2). ........... 7 Thermal Release Analysis of Hg from Green Balls in 100% N2. ............................... 10 Thermal Release Analysis of Hg from Green Balls in Air Containing HCl............... 12
SUMMARY AND CONCLUSIONS ........................................................................................... 14 REFERENCES ............................................................................................................................. 14 PRELIMINARY Hg RELEASE PROFILES FOR Hibtac GREEN BALL ..................Appendix A

ii
LIST OF FIGURES 1 Schematic of the bench-scale thermal desorption apparatus and CMM system..................... 4 2 Photograph of the sample chamber in an oven ....................................................................... 4 3 Photograph of the stainless steel heating coil and sample chamber in an oven...................... 5 4 Heating profiles for Hibtac green ball in air ........................................................................... 8 5 Total Hg and Hg0 release profiles for Hibtac green ball in air ............................................... 9 6 Heating and total Hg and Hg0 release profiles for Minntac green ball in
a 30% O2–70% N2 mixture ..................................................................................................... 9 7 Heating profiles for Hibtac green ball in 100% N2............................................................... 11 8 Total Hg and Hg0 release profiles for Hibtac green ball in 100% N2 ................................... 11 9 Heating and total Hg and Hg0 release profiles for Minntac green ball in 100% N2 ............. 12 10 Heating and total Hg and Hg0 release profiles for Hibtac green ball in
30% O2–70% N2–5% H2O containing 50 ppm HCl ............................................................. 13 11 Heating and total Hg and Hg0 release profiles for Minntac green ball in
30% O2–70% N2–5% H2O containing 100 ppm HCl ........................................................... 13
LIST OF TABLES
1 Physical Properties of Fe2O3 Polymorphs .............................................................................. 2 2 Replicate Hg Analysis Results, reported on a dry basis ......................................................... 5 3 Green Ball Analysis Matrix .................................................................................................... 6 4 Mercury Mass Balance Results............................................................................................... 8

1
MERCURY VAPORIZATION CHARACTERISTICS OF TACONITE PELLETS INTRODUCTION The processing of taconite (iron oxide pellets) in northern Minnesota released about 800 lb of mercury to the environment in 2000, accounting for almost 20% of the state’s mercury emission inventory (1–3). Most of the atmospheric mercury emissions resulting from taconite processing occur during the heating of wet “green balls,” consisting predominantly of magnetite (Fe3O4) and other components (limestone flux, organic or bentonite binder, and mineral contaminants), and the subsequent oxidation of Fe3O4 in induration furnaces (4). Stack mercury speciation measurements by Jiang et al. (5) indicated that, on average, 93.3% of the total mercury emitted was gaseous elemental mercury (Hg0), and most of the remainder was gaseous inorganic mercuric compounds (Hg2+). The Minnesota Department of Natural Resources (DNR) has been researching wet scrubbers and process lines at taconite-processing facilities to evaluate potential mercury control options for stack emissions. Wet scrubbers are effective in removing Hg2+ but not Hg0. According to the DNR, scrubber Hg removal efficiency may be affected by the heating rate of taconite in induration furnaces. The identification of a heating rate that would promote the evolution of Hg2+ rather than Hg0 from taconite would be beneficial for capturing Hg2+ using a wet scrubber. In addition, Berndt et al. (6) determined that wet scrubbers more effectively capture the Hg released during acid pellet processing relative to fluxed pellet processing. Calcite (CaCO3) and lime (CaO) are added as a flux during fluxed pellet processing. CaO, the thermal decomposition product of CaCO3, may have reacted with acid and halogen-bearing gases liberated during heating, thus inhibiting the Hg0 oxidation reactions that occur with such gases. The inhibition of Hg0 oxidation in the fluxed-pellet induration flue gas may explain the lack of wet scrubber Hg removal. The Energy & Environmental Research Center (EERC) worked interactively with the DNR to characterize Hg vaporization during the heating and oxidation of green ball in air, nitrogen, and HCl using a thermal release apparatus and continuous mercury monitoring (CMM) system. The EERC has investigated the thermal stability of Hg in, and its release from, coal fly ashes, scrubber sludges, activated carbon sorbents, and amalgams but not green balls (7, 8). The volatilization of Hg0 and Hg2+ as functions of temperature (<1000°C), time, and gas composition were determined on two green ball samples supplied by Hibbing Taconite (Hibtac) and US Steel-Minntac (Minntac). BACKGROUND The primary oxidation product of Fe3O4 produced during induration is hematite (α-Fe2O3). Maghemite (γ-Fe2O3), an intermediate oxidation product of Fe3O4 and a polymorph of α-Fe2O3, may also form, especially in the presence of water vapor (9–11). The oxidation of Fe3O4, an inverse spinel structure mineral, to γ-Fe2O3 involves the

2
addition of free oxygen at the surface of the crystal and the diffusion of Fe3+ through an oxygen framework to the crystal surface, thus creating cation vacancies in the spinel structure (9). Physical properties of the Fe2O3 polymorphs are compared in Table 1. Bench-scale investigations using heated (370°C) simulated flue gases demonstrated that specific metal oxides, including α-Fe2O3, promote the formation of Hg2+ in the presence of gaseous hydrogen chloride (HCl) and/or nitrogen oxides (NOx), possibly via surface redox reactions (12–15). Bench-scale experiments by Miller et al. (16) and Hitchcock (17) indicated that γ-Fe2O3 does not catalyze Hg2+ formation, but rather it readily reacts with Hg0 at 155°C, resulting in Hg0 removal from a simulated coal combustion flue gas. In contrast, pilot-scale coal combustion testing by Galbreath et al. (18) indicated that α-Fe2O3 does not affect Hg0 oxidation, whereas γ-Fe2O3 promoted the conversion of Hg0 to Hg2+ and particle-associated Hg. EXPERIMENTAL Green ball samples were analyzed using ASTM International Method D6414-01: Standard Test Method for Total Mercury in Coal and Coal Combustion Residues by Acid Extraction or Wet Oxidation/Cold Vapor Atomic Absorption. This method covers the determination of total Hg in coal, coke, combustion residues, and geologic materials. A nominal 1-gram portion of each sample was mixed with nitric and hydrochloric acids and heated in a hot-water bath at 80°C for 2 hours. Each taconite sample was digested at least three times. The digested samples were then cooled to room temperature, diluted with deionized water to a known volume of 50 mL, filtered, and analyzed by cold-vapor atomic absorption spectroscopy (CVAAS). The instrument used was a CETAC Model M6000A Hg analyzer that was calibrated at 0, 10, 50, and 100 ng/L. Hg concentrations were reported on a µg/g dry basis. The reporting limit for the method is 0.0005 µg/g (ppm). For quality control purposes, a Hg standard from taconite was analyzed. The Hg standard, a final concentrate sampled from Keewatin Taconite Minnesota Ore Operations, contains an average Hg content of 14 ppb, with confidence limits (±95%) of 1.2 ppb based on analyses from five laboratories (19). Table 1. Physical Properties of Fe2O3 Polymorphs
Parameter Hematite (α-Fe2O3) Maghemite (γ-Fe2O3) Crystal System Hexagonal–rhombohedral Cubic Crystal Structure Corundum (α-Al2O3) structure;
isostructural with eskolaite (Cr2O3) and karelianite (V2O3)
Cation-deficient ferric spinel with ideal formula
[Fe] (Fe1.67 �0.33) O4 where � represents a vacancy
Density, g/cm3 5.27 4.88 Magnetization Antiferromagnetic (no net magnetization) Ferrimagnetic

3
The bench-scale apparatus and CMM system used to analyze the thermal release of Hg from green ball samples are shown schematically in Figure 1. The sample chamber consists of a ¾-in. (1.90-cm)-diameter, 10-in. (25.4-cm)-long stainless steel (Type 316) pipe. Stainless steel was used to construct the thermal release apparatus because, based on EERC experience with bench- and pilot-scale combustion testing equipment, it is chemically inert with respect to Hg. The chamber resides in a 6-ft. (1.8-m)-long tube furnace, as shown in Figure 2, that is temperature-controlled to heat at a nominal rate of 20°C/minute (68°F/min.). The furnace temperature and the gas temperature in the sample chamber were measured using thermocouples. Mass flow controllers were used to meter in various gases including N2, O2, H2O, and HCl. The gases flowed through ¼-in. (0.64-cm) stainless steel tubing into a heating coil within the oven, as shown in Figure 3, before entering the sample chamber. Green ball samples were placed at the bottom of the chamber, and the heated gases flowed over the top. After exiting the sample chamber, the gases were cooled using coiled stainless steel tubing to 300°F (149°C). The gases then passed from the cooling coil, via a heated (300°F, 149°C) Teflon tube, into a PS Analytical (PSA) S235C400 flue gas-conditioning and Hg conversion unit. The S235C400 uses two separate liquid flow paths, one to continuously reduce Hg2+ to Hg0, resulting in a total gaseous Hg sample, and the other to continuously absorb Hg2+, resulting in an Hg0 sample. The S235C400 also employs a Peltier thermoelectric module to cool and dry the sample gases prior to analysis. During the initial thermal release analyses (Analyses 1–3), a Tekran Model 2537A atomic fluorescence-based Hg vapor analyzer was used to measure Hg0 and total Hg concentrations online. The Tekran instrument trapped the Hg vapor from the conditioned sample onto an ultra-pure gold sorbent. The amalgamated Hg was then thermally desorbed and detected using atomic fluorescence spectrometry. A dual-cartridge design enabled alternate sampling and desorption cycles, resulting in a nearly continuous measurement of the sample stream. The Tekran instrument was used to measure either total Hg or Hg0 approximately every 2.5 minutes. In order to improve the temporal resolution of the Hg release profiles obtained on the green ball samples, a Nippon Instruments Corporation (NIC) DM-6A was used during subsequent experiments (Analyses 4–17). The DM-6A uses dual individual channel atomic absorption spectroscopy to measure Hg0 and total Hg concurrently every 10 seconds, and Hg2+ was estimated by difference (i.e., total Hg – Hg0 = Hg2+). An Hg0 permeation source was used to calibrate both instruments daily. Sample preparation consisted of sampling a known amount of green ball, generally ~25 g, in a plastic bag and then crushing by hand. The green balls were then flattened into a thin layer, 3 to 6 mm thick. The resulting green ball cake was then divided using a spatula into small sections (~1-mm squares). The sectioned sample was then placed into the bottom of the sample chamber for testing.

4
Figure 1. Schematic of the bench-scale thermal desorption apparatus and CMM system.
Figure 2. Photograph of the sample chamber in an oven.

5
Figure 3. Photograph of the stainless steel heating coil and sample chamber in an oven.
RESULTS AND DISCUSSION Green Ball Hg Contents Hg analysis results are presented in Table 2 for the concentrate standard and green ball samples collected from Minntac and Hibtac. The measured Hg content for the concentrate standard is within 9% of the average value of 14 ±1.2 ng/g (ppb) reported by five laboratories (19). The Hg content of the Hibtac green ball sample is similar to the concentrate standard, whereas the Minntac green ball sample contains significantly lower Hg. Table 2. Replicate Hg Analysis Results, reported on a dry basis Sample Concentrate Standard Minntac Green Ball Hibtac Green Ball Number of measurements
5 3 4
Average Hg, ng/g 15.2 6.23 16.1 ±95% confidence limits, ng/g
1.2 0.06 1.1

6
Evaluation of the Bench-Scale Thermal Release Analyzer Initially, the bench-scale thermal release apparatus (Figure 1) was tested with no sample inside to assess Hg contamination. Total Hg and Hg0 concentrations during the blank (background) tests were very low at ≤0.2 µg/m3. A Hg0 permeation source was used to send 20 µg/m3 of Hg0 through the system to evaluate Hg recovery. Essentially 100% of the Hg0 was recovered, and when the Hg0 source was turned off, the Hg0 concentration decreased to <0.1 µg/m3 within about 1–2 s. Thermal Release Analyses of Green Ball Samples The green ball analysis matrix is described in Table 3. Analyses were conducted in air (30 vol% O2–70 vol% N2) and a reducing atmosphere of 100 vol% N2. Several HCl addition tests to air were also performed to evaluate whether the added chlorine would promote the thermal release of Hg2+. Initial tests (1–3) were performed at a flow rate of 0.25 L/min, whereas subsequent tests (4–17) were performed at 0.5 L/min. As soon as a green ball sample was exposed to the flowing gas, described in Table 3, the furnace was turned on to heat the sample at about 20°C/min. (68°F/min). During heating to about 300°C, the gas temperature fluctuated and was lower relative to the furnace temperature because of cooling associated with moisture evaporation from the green ball samples. The concentrations of total Hg and Hg0 released from the green ball samples were plotted as functions of the furnace temperature rather than gas temperature because of the sample-cooling effect. When the furnace peaked at 990° to 1000°C, it was turned off and allowed to cool to <300°C. The sample was then removed from the chamber and placed in a sealed glass vial for analysis. Table 3. Green Ball Analysis Matrix Analysis No.
Green Ball Source
Sample Weight, g
O2, vol%
N2, vol%
H2O, vol%
HCl, ppm
1 Hibtac 73.00 30 70 NA1 NA 2 Hibtac 15.00 30 70 NA NA 3 Hibtac 15.00 30 70 NA NA 4 Hibtac 24.71 30 70 NA NA 5 Minntac 24.97 30 70 NA NA 6 Hibtac 24.94 30 70 NA NA 7 Minntac 25.10 30 70 NA NA 8 Hibtac 25.40 30 70 NA NA 9 Minntac 25.09 NA 100 NA NA 10 Hibtac 24.70 NA 100 NA NA 11 Minntac 24.71 NA 100 NA NA 12 Hibtac 25.10 NA 100 NA NA 13 Hibtac 25.14 NA 100 NA NA 14 Concentrate 24.77 NA 100 NA NA 15 Minntac 25.00 30 65 5 100 16 Hibtac 25.10 30 65 5 100 17 Hibtac 25.30 30 65 5 50 1 Not applicable.

7
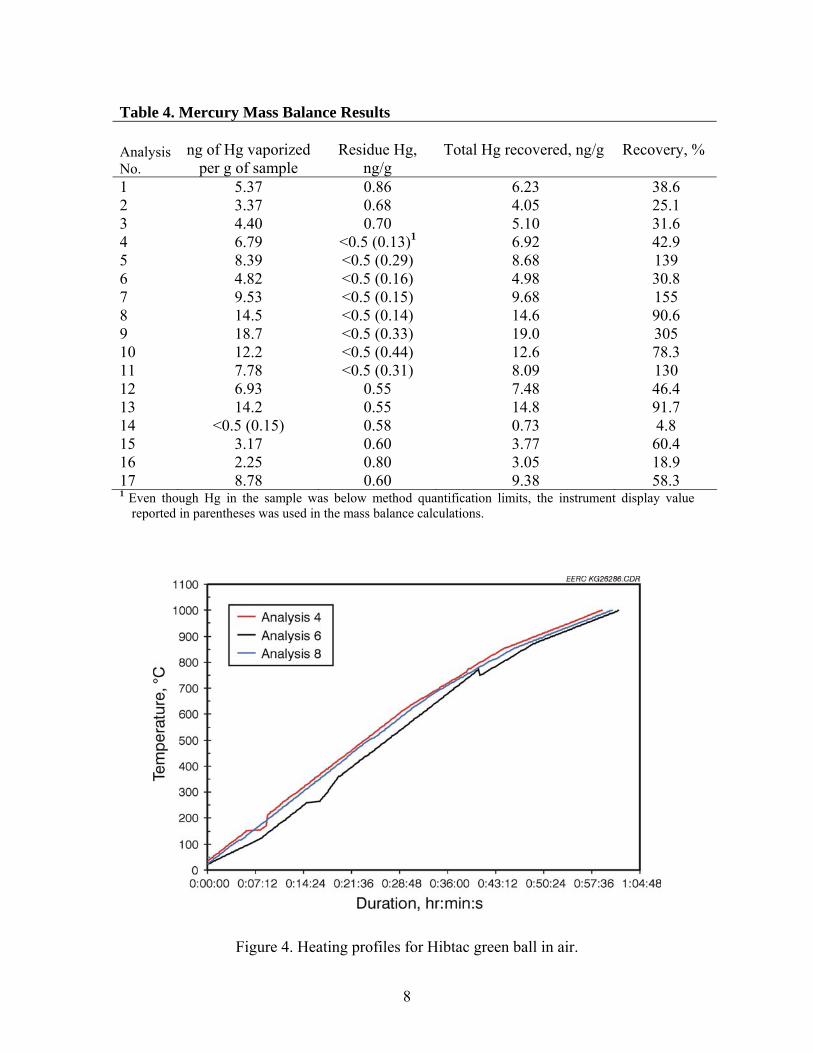
After each analysis, the amount of Hg vaporized from the sample was calculated from the thermal release profile. A portion of the green ball residue was also analyzed for Hg. The vaporized and residue Hg concentrations for each analysis are presented in Table 4. Hg mass balances were calculated from the vaporized, residue, and green ball Hg concentrations. As indicated in Table 4, Hg mass balance recoveries range widely from 5% to 305%. Total Hg and Hg0 thermal release profiles for Analyses 9, 14, and 16 are not presented because of very poor Hg mass balance recoveries. The release profiles from Analyses 1–3 are presented in Appendix A for information purposes only because they were obtained using the Tekran CMM, which lacked temporal resolution and could not be used to measure total Hg and Hg0 simultaneously. The Tekran results, however, were useful for determining how much green ball sample was appropriate for providing measurable concentrations of total Hg and Hg0 during subsequent thermal release analyses. Thermal Release Analysis of Hg from Green Balls in Air (30% O2–70% N2) Presented in Figures 4 and 5 are three heating profiles and associated total Hg and Hg0 release profiles, respectively, for the Hibtac green ball sample in air, Analyses 4, 6, and 8 described in Table 3. Heating rates during Analyses 4 and 8 were similar, whereas the heating rate during Analysis 6 was slightly lower. The heating rate gradually slowed with time, and thus increasing temperature, especially after about 40 min. into the test. The three Hg release profiles in Figure 5 indicate that significant concentrations of Hg were initially liberated at 200°C as Hg0. Based on the mass balance closure results in Table 4, Analysis 8 results are probably the most reliable. Analysis 8 results show four distinct peaks associated with the release of total Hg at 235°, 260°, 300°, and 360°C. Total Hg concentrations exceed those of Hg0 at these temperatures, suggesting that Hg2+ compounds were being released. The liberation of Hg0 peaked at 235° and 320°C. In general, Hg0 concentrations were greater than total Hg concentrations at ≥320°C, indicating that only Hg0 was being liberated from about 320° to 700°C. Analysis 6 results are similar to those for Analysis 8 in that at about 220°C the total Hg concentration exceeded Hg0, suggesting that Hg2+ was also being liberated. In addition, three of the four total Hg release peaks are discernable, although not as well resolved, and each occuring at about 10°C higher. Analysis 4 results indicate a total Hg release peak at 350°C that compares favorably with a similar peak at 360°C in the Analysis 8 Hg release profile. The total Hg and Hg0 release profiles in Figure 5 are generally asymmetric in that Hg0 and total Hg are initially released more rapidly at low temperatures, <300°C, relative to higher temperatures. Presented in Figure 6 are two heating profiles and associated total Hg and Hg0 release profiles for the Minntac green ball sample in air, Analyses 5 and 7 described in Table 3. According to Table 4, the Hg releases during Analyses 5 and 7 were overbalanced by about 40% and 55%, respectively, suggesting that Hg may have
8
Table 4. Mercury Mass Balance Results
Analysis No.
ng of Hg vaporized per g of sample
Residue Hg,
ng/g
Total Hg recovered, ng/g
Recovery, %
1 5.37 0.86 6.23 38.6 2 3.37 0.68 4.05 25.1 3 4.40 0.70 5.10 31.6 4 6.79 <0.5 (0.13)1 6.92 42.9 5 8.39 <0.5 (0.29) 8.68 139 6 4.82 <0.5 (0.16) 4.98 30.8 7 9.53 <0.5 (0.15) 9.68 155 8 14.5 <0.5 (0.14) 14.6 90.6 9 18.7 <0.5 (0.33) 19.0 305 10 12.2 <0.5 (0.44) 12.6 78.3 11 7.78 <0.5 (0.31) 8.09 130 12 6.93 0.55 7.48 46.4 13 14.2 0.55 14.8 91.7 14 <0.5 (0.15) 0.58 0.73 4.8 15 3.17 0.60 3.77 60.4 16 2.25 0.80 3.05 18.9 17 8.78 0.60 9.38 58.3 1 Even though Hg in the sample was below method quantification limits, the instrument display value reported in parentheses was used in the mass balance calculations.
Figure 4. Heating profiles for Hibtac green ball in air.

9
Figure 5. Total Hg and Hg0 release profiles for Hibtac green ball in air.
Figure 6. Heating and total Hg and Hg0 release profiles for Minntac green ball in a 30%
O2–70% N2 mixture.
10
remained in the system as a contaminant from previous analyses. The heating profiles indicate that Analysis 5 was performed too soon after the previous analysis, before the sample chamber was cooled to room temperature. Analysis 5 began at about 125°C compared to 25°C for Analysis 7. Even though Analysis 7 began at a lower temperature relative to Analysis 5, Hg0 was initially released at a lower temperature of 195°C compared to 250°C during Analysis 5. Hg0 release during Analysis 5 occurred relatively abruptly over a temperature range of 250° to 425°C and peaked at 290°C. In contrast, Hg0 release during Analysis 7 occurred over a relatively broad temperature range of 195° to 550°C. Similar to the Hg release profile from the Hibtac green ball sample in Figure 5, the total Hg liberated from the Minntac green ball exceeded Hg0, indicating that Hg2+ was also probably released from the Minntac green ball sample. Analysis 5 indicated the presence of six prominent total Hg release peaks at about 295°, 310°, 335°, 370°, 480°, and 545°C, whereas Analysis 7 indicated four prominent total Hg release peaks at 250°, 270°, 290°, and 385°C. During both analyses, the Hg0 and total Hg release profiles for the Minntac green ball were asymmetric. Thermal Release Analysis of Hg from Green Balls in 100% N2
Presented in Figures 7 and 8 are three heating profiles and associated total Hg and Hg0 release profiles, respectively, for the Hibtac green ball sample in a 100% N2 atmosphere, Analyses 10, 12, and 13 described in Table 3. The heating profiles for Analyses 12 and 13 are similar, whereas the heating rate during Analysis 10 was initially greater. Analysis 13 results are probably the most reliable based on the Hg mass balance closures presented in Table 4. In contrast to the analysis results in an oxidizing atmosphere, Figure 5, the relatively small differences in total Hg and Hg0 concentrations in Figure 8 suggest that Hg2+ liberation from the Hibtac green ball was insignificant in the N2 atmosphere. The small differences between total Hg and Hg0 concentrations are generally within the analytical uncertainties of the flue gas conditioning and Hg conversion unit and CMM. In comparing the most reliable results based on mass balance closures, Analyses 8 and 13 in Figures 5 and 8, respectively, the overall temperature range (~200° to 600°C) and asymmetry of the Hg0 releases are similar, but the Hg release profile for Hibtac in air (Figure 5) is much more complex relative to its profile in 100% N2 (Figure 8). The heating profile and associated total Hg and Hg0 release profiles for the Minntac green ball sample in 100% N2, Analysis 11 described in Table 3, are presented in Figure 9. As indicated in Table 4, the Hg mass balance for Analysis 11 was 130%. Hg0 was initially released from the Minntac green ball at about 210°C. The release of Hg0 peaked to ~40 µg/m3 at 295°C and then decreased asymmetrically to baseline concentrations at 645°C. Analysis 11 results show two distinct peaks associated with the release of total Hg at about 300°C and 380°C. Total Hg concentrations significantly exceed those of Hg0 at these temperatures, suggesting that Hg2+ compounds were being released. Similar to the Hibtac Hg release results, the Hg release profile for Minntac in 100% N2 (Figure 8) is simpler with fewer Hg0and total Hg peak releases relative to its profile in air (Figure 6).

11
Figure 7. Heating profiles for Hibtac green ball in 100% N2.
Figure 8. Total Hg and Hg0 release profiles for Hibtac green ball in 100% N2.

12
Figure 9. Heating and total Hg and Hg0 release profiles for Minntac green ball in 100% N2.
Thermal Release Analysis of Hg from Green Balls in Air Containing HCl
Compared in Figures 10 and 11 are the heating profiles and total Hg and Hg0 release profiles obtained during the analyses of Hibtac and Minntec green ball samples, Analyses 17 and 15 described in Table 3. The heating rates are similar, however, Analysis 15 of the Minntac sample began at a higher temperature relative to Analysis 17 of the Hibtac sample, thus it required more time during the Hibtac analysis for the furnace to attain ~1000°C. As indicated in Table 4, Hg mass balance closures for both analyses were about 60%. In the presence of 50 ppm HCl, the Hibtac green ball initially released Hg0 from about 220° to 270°C as indicated in Figure 10. Total Hg and Hg0 were released concurrently from about 260° to 315°C. Total Hg and Hg0 release peaked at ~285°C to about 70 and 40 µg/m3, respectively, suggesting that a maximum of about 40% of the total Hg was being liberated as Hg2+. Hg0 continued to be released from >315°C to about 450°C. Hg release subsided until about 885°C when Hg0 release peaked again to about 12 µg/m3. In comparison to the Hibtac Hg release profile in Figure 5, the presence of 50 ppm HCl reduced the complexity of the total Hg release as evidenced by the lack of multiple total Hg release peaks in Figure 10.
During heating of the Minntac green ball in the presence of 100 ppm HCl, low concentrations of Hg0, ≤2.0 µm/m3, were initially liberated at about 220°C. Hg0 release

13
Figure 10. Heating and total Hg and Hg0 release profiles for Hibtac green ball in 30% O2–70% N2–5% H2O containing 50 ppm HCl.
Figure 11. Heating and total Hg and Hg0 release profiles for Minntac green ball in 30% O2–70% N2–5% H2O containing 100 ppm HCl.

14
remained very low and gradually decreased to baseline concentrations at about 450°C. Total Hg, and presumably Hg2+, release peaked at 290°, 330°, 365°, 905°, and 925°C. The peak at 905°C is asymmetric because the CMM performed a blank (i.e., zero background) measurement at about 900°C. The presence of 100 ppm HCl significantly decreased Hg0/total Hg as indicated by a comparison of Figures 6 and 11, thus implying that it enhanced the thermal release of Hg2+. The limestone flux in Minntac green ball did not seem to inhibit Hg0 oxidation as was postulated in the introduction section of this report. SUMMARY AND CONCLUSIONS The Hg and other volatile components (e.g., H2O, CO2, HCl) in Hibtac and Minntac green ball samples were thermally released in air (± HCl addition) and 100% N2 in a stainless steel chamber by heating (~20°C/min) from about 25° to 1000°C. In general, the Hg release profiles from Hibtac and Minntac green balls in air are characterized initially by the rapid release of Hg0 at 200°–250°C followed by periodic releases of total Hg that exceed Hg0 concentrations, suggesting Hg2+ liberation from 235° to 545°C. With increasing temperature, Hg0 and total Hg release concentrations peaked relatively rapidly and then declined asymmetrically to baseline concentrations by about 600°C. Primarily Hg0 was released from the Hibtac and Minntac green balls in the 100% N2 atmosphere from about 200° to 650°C. The Hg0 release profiles were asymmetric. The complexity of the Hg release profiles, as defined by the number and intensity of total Hg release peaks, was much less during analyses performed in 100% N2 relative to those performed in air. The reducing atmosphere inhibited the magnetite in green ball samples from oxidizing during heating. Apparently, Hg0 interactions with magnetite oxidation products, maghemite and hematite, are important for promoting Hg2+ formation. The addition of 50 ppmv HCl to air during the heating of Hibtac green balls simplified the total Hg release profile from 3 or 4 peaks to a single total Hg peak release from about 260° to 315°C. The difference between total Hg and Hg0 release concentrations suggested that a maximum of 40% of the total Hg was released as Hg2+. The addition of 100 ppmv HCl to air during the heating of Minntac green balls promoted the thermal release of total Hg, possibly as HgCl2, at the expense of Hg0. REFERENCES 1. Minnesota Pollution Control Agency. Mercury Reduction Program, Progress Report
to the Minnesota Legislature, January 2002. Available at: http://www.pca.state. mn.us/hot/legislature/reports/2002/mercury-02.pdf.
2. Jackson, A.M.; Swain, E.B.; Andrews, C.A.; Rae, D. Minnesota’s Mercury
Contamination Reduction Initiative. Fuel Process. Technol. 2000, 65–66, 79–99.

15
3. Murray, M.; Holmes, S.A. Assessment of Mercury Emissions Inventories for the Great Lakes States. Environ. Res. 2004, 95 (3), 282–297.
4. Berndt, M.E. Mercury and Mining in Minnesota; Minnesota Department of Natural
Resources, Division of Lands and Minerals, Minerals Coordinating Committee Final Report, October 15, 2003, 66 p.
5. Jiang, H.; Arkly, S.; Wickman, T. Mercury Emissions from Taconite Concentrate
Pellets – Stack Testing Results from Facilities in Minnesota. Presented at U.S. Environmental Protection Agency Conference Assessing and Managing Mercury from Historic and Current Mining Activities, San Francisco, CA, November 28–30, 2001, 18 p.
6. Berndt, M.E.; Engesser, J.; Johnson, A. On the Distribution of Mercury in Taconite
Plant Scrubber Systems; Minnesota Department of Natural Resources Report for the Minnesota Pollution Control Agency, 2003, 30 p.
7. Sondreal, E.A.; Benson, S.A.; Pavlish, J.H.; Galbreath, K.C.; Zygarlicke, C.J.;
Thompson, J.S.; McCollor, D.P.; Crocker, C.R.; Lillemoen, C.M.; Mann, M.D.; Jensen, R.R.; Weber, G.F. Center for Air Toxic Metals Final Technical Report Volume III, October 1, 1996–September 30, 2000; prepared for U.S. Environmental Protection Agency Assistance Agreement R 824854; September 2000.
8. Pavlish, J.P. Mercury Stability in the Environment; Final Report Prepared for the
Federal Energy Technology Center, U.S. Department of Energy, Pittsburgh, PA, July 1999; Energy & Environmental Research Center Report 99-EERC-09-03, 21 p.
9. D.H. Lindsley, In Oxide Minerals, MSA Reviews in Mineralogy Vol. 3, Chap. 1;
Rumble III, D., Ed.; Mineralogical Society of America, Washington, DC, 1976; pp. 1–60.
10. Colombo, U.; Fagherazzi, G.; Gazzarrini, F.; Lanzavecchia, G.; and Sironi, G.
Mechanisms in the First Stage of Oxidation of Magnetites. Nature 1964, 202, 175–176.
11. Colombo, U.; Gazzarrini, F.; Lanzavecchia, G.; and Sironi, G. Magnetite Oxidation:
A Proposed Mechanism. Science 1965, 147, 1033.
12. Ghorish, S.B.; Lee, C.W.; Kilgroe, J.D. Mercury Speciation in Combustion Systems: Studies with Simulated Flue Gases and Model Fly Ashes. Presented at the Air & Waste Management Association’s 92th Annual Meeting & Exhibition, St. Louis, MO, June 20–24, 1999; Paper 99-651.

16
13. Carey, T.R.; Skarupa, R.C.; Hargrove Jr., O.W. Enhanced Control of Mercury and Other HAPs by Innovative Modifications to Wet FGD Processes; Phase I Report for the U.S. Department of Energy, Contract DE-AC22-95PC95260, Aug 28, 1998.
14. Lee, C.W.; Kilgroe, J.D.; Ghorishi, S.B. Speciation of Mercury in the Presence of
Coal and Waste Combustion Fly Ashes. Presented at the, 93rd Annual Meeting of the Air & Waste Management Association, Salt Lake City, UT, June 18–22, 2000, Paper 151.
15. Zhuang, Y.; Biswas, P.; Quintan, M.E.; Lee, T.G.; Arar, E. Kinetic Study of
Adsorption and Transformation of Mercury on Fly Ash Particles in an Entrained Flow Reactor. Presented at the, 93rd Annual Meeting of the Air & Waste Management Association, Salt Lake City, UT, June 18–22, 2000, Paper 331.
16. Miller, S.J.; Olson, E.S.; Dunham, G.E.; Sharma, R.K. Preparation Methods and
Test Protocol for Mercury Sorbents. Presented at the Air & Waste Management Association’s 91st Annual Meeting & Exhibition, San Diego, CA, June 14–18, 1998; Paper 98-RA79B.07.
17. Hitchcock, H.L. Mercury Sorption on Metal Oxides. Master of Science Thesis,
University of North Dakota, Dec 1996; 83 p.
18. Galbreath, K.C.; Zygarlicke, C.J.; Tibbetts, J.E.; Schulz, R.L.; Dunham, G.E. Effects of NOx, α-Fe2O3, γ-Fe2O3, and HCl on Mercury Transformations in a 7-kW Coal Combustion System. Fuel Process. Technol. 2005, 86 (4), 429–448.
19. Benner, B.R. Preparation of Mercury Standards from Taconite; Coleraine Minerals
Research Laboratory, Report TR-01-16, 2001, 10 p.
APPENDIX A
PRELIMINARY Hg RELEASE PROFILES FOR Hibtac GREEN BALL

A-1
Figure A-1. Total Hg release profile for Hibtac green ball in air.
Figure A-2. Total Hg and Hg0 release profiles for Hibtac green ball in air.