October 3-4 2017 Tasiastanalyst & investor tour: Developing a … · 2017-10-03 · 1 1 KINROSS...
45
KINROSS GOLD CORPORATION Tasiast analyst & investor tour: Developing a world-class mine October 3-4 2017
Transcript of October 3-4 2017 Tasiastanalyst & investor tour: Developing a … · 2017-10-03 · 1 1 KINROSS...
1www.kinross.com
1
KINROSS GOLD CORPORATIONTasiast analyst & investor tour: Developing a world-class mine
October 3-4
2017
2www.kinross.com
2
CAUTIONARY STATEMENT ON FORWARD-LOOKING INFORMATION
All statements, other than statements of historical fact, contained or incorporated by reference in or made in giving this presentation and responses toquestions, including but not limited to any information as to the future performance of Kinross, constitute “forward looking statements” within the meaning ofapplicable securities laws, including the provisions of the Securities Act (Ontario) and the provisions for “safe harbor” under the United States PrivateSecurities Litigation Reform Act of 1995 and are based on expectations, estimates and projections as of the date of this presentation. Forward-lookingstatements contained in this presentation include those statements on slides with, and statements made under, the headings “Tasiast Mill Expansion”,“Developing a World-Class Mine”, and include, without limitation, statements with respect to mine life extensions, costs and timing of development activities,future production, production costs of sales, all-in sustaining cost and capital expenditures, continuous improvement and other cost savings opportunities, aswell as references to other possible events including, without limitation, possible events; opportunities; statements with respect to possible events oropportunities; estimates (including, without limitation, gold / mineral resources, gold / mineral reserves and mine life) and the realization of such estimates;future development, mining activities, production and growth, including but not limited to cost and timing; success of exploration or development ofoperations; the results of any studies including, without limitation, feasibility studies; the future price of gold and silver; currency fluctuations; expected capitalrequirements; government regulation; and environmental risks. The words “assumption”, “budget”, “encouraging”, “enhancing”, “estimate”, “expect”,“feasibility”, “focus”, “forward”, “future”, “goal”, “indicate”, “on track”, “opportunity”, “phased”, “plan”, “positive”, “potential”, “prospective”, “progressing”,“project”, “risk”, or “study”, or variations of or similar such words and phrases or statements that certain actions, events or results may, can, could, would,should, might, indicates, or will be taken, and similar expressions identify forward looking statements. Forward-looking statements are necessarily basedupon a number of estimates and assumptions that, while considered reasonable by Kinross as of the date of such statements, are inherently subject tosignificant business, economic and competitive uncertainties and contingencies. Many of these uncertainties and contingencies can affect, and could cause,Kinross’ actual results to differ materially from those expressed or implied in any forward looking statements made by, or on behalf of, Kinross. Statementsrepresenting management’s financial and other outlook have been prepared solely for purposes of expressing their current views regarding the Company’sfinancial and other outlook and may not be appropriate for any other purpose. There can be no assurance that forward looking statements will prove to beaccurate, as actual results and future events could differ materially from those anticipated in such statements. All of the forward looking statements made inthis presentation are qualified by these cautionary statements, and those made in our filings with the securities regulators of Canada and the U.S., includingbut not limited to those cautionary statements made in the “Risk Factors” section of our most recently filed Annual Information Form, the “Risk Analysis”section of our FYE 2016 and Q2 2017 Management’s Discussion and Analysis, and the “Cautionary Statement on Forward-Looking Information” in our newsrelease dated September 18, 2017, to which readers are referred and which are incorporated by reference in this presentation, all of which qualify any and allforward‐looking statements made in this presentation. These factors are not intended to represent a complete list of the factors that could affect Kinross.Kinross disclaims any intention or obligation to update or revise any forward‐looking statements or to explain any material difference between subsequentactual events and such forward‐looking statements, except to the extent required by applicable law.
Other information
Where we say "we", "us", "our", the "Company", or "Kinross" in this presentation, we mean Kinross Gold Corporation and/or one or more or all of itssubsidiaries, as may be applicable.
The technical information about the Company’s mineral properties contained in this presentation has been prepared under the supervision of Mr. John Sims,an officer of the Company who is a “qualified person” within the meaning of National Instrument 43-101.

3www.kinross.com
3WELCOME TO THE TASIAST MINE TOURTom Elliott – Senior Vice-President, Investor Relations & Corporate Development 3

4www.kinross.com
4
Presenters and Q&A Panel
Mike Sylvestre Regional Vice-President, Africa
Guy Bourassa Vice-President and Project Director, Tasiast Project
Paul Tomory Chief Technical Officer
John Sims Vice-President, Resource Geology & Brownfields Exploration (Q.P.)
Tom Elliott Senior Vice-President, Investor Relations & Corporate Development
INTRODUCTIONS & AGENDA4

5www.kinross.com
5
• Highly prospective district with significant exploration potential World-class orebody: 8.0M oz. of proven and
probable reserves, 3.1M oz. of measured & indicated gold resources and 0.4M oz. of inferred resource estimates(i)
Accelerating drill program following encouraging results & initiating Tasiast Sud pre-feasibility study
• Improvements at the existing operation enhancing future value Achieving reductions in mining and processing
costs Expect positive trend to continue
• Expansion projects expected to transform Tasiast into a large, low-cost producer Excellent progress on Phase One Proceeding with Phase Two
DEVELOPING A WORLD-CLASS MINE
TASIAST HIGHLIGHTS
(i) As at December 31, 2016. Please refer to Kinross’ Annual Mineral Reserve and Mineral Resource Statement, available on our website at www.Kinross.com.

6www.kinross.com
6
DEVELOPING A WORLD-CLASS MINE
TASIAST: HISTORICAL CONTEXT
Focus has been to right-size the processing capacity to capture the full value and potential of Tasiast’s large mineral resource estimate
2014 2015 2016 2017 2018 2019 2020
Feasibility Study Results38k t/d scenario
Capex estimate: $1.6B
Initiated studies on two-phased expansion Financially disciplined approach to expansion
using existing infrastructure
Two-phased expansion study results
Phase One approvedCapex estimate: $300MPhase Two proceeds to
feasibility studyCapex estimate: $620M
Phase Two feasibility study results
Phase Two approvedRevised capex estimate: $590M
Phase One expected to reach
commercial production in
Q2 2018
Phase Twoexpected to reach
commercial production in
Q3 2020
* Capital estimates on this slide do not include estimated capitalized stripping

7www.kinross.com
7
map
MAURITANIA: LOCATION7
Mauritania
Canary Islands
Algeria
Mali
Western Sahara
Morocco
Senegal
Tasiast
Nouakchott(capital)

8www.kinross.com
8GEOLOGY & EXPLORATIONJohn Sims - Vice-President, Resource Geology & Brownfields Exploration (Q.P.) 8

9www.kinross.com
9
• Aouéouat greenstone belt hosts all of the known Tasiast deposits and most of current exploration prospects
80 km x 8 km
312 km2 mining lease
3,118 km2 exploration licences
• Aouéouat belt shares similarities with other Late Archaean terranes, such as:
Yilgarn in Australia
Abitibi in Canada
GEOLOGY & EXPLORATION
GEOLOGY OVERVIEW
Tasiast Geology
Tasiast mine
Tasiast Sud
10 km5 km0 km 15 km 20 km

10www.kinross.com
10
GEOLOGY & EXPLORATION
TASIAST CROSS-SECTION
Felsite SedimentsBIF
Lithology
Diorite (GDI)
Dyke
Plan view
A’
Looking North - West Branch AA’ cross-section (12.5m window)
Resource pit outline
Reserve pit outlineSeptember 2017
pit outline
A
A’A

11www.kinross.com
11
GEOLOGY & EXPLORATION
TASIAST SUDEncouraging results from C6.13 and C6.15 in the Tasiast Sud Area
C6.13
C6.15
Tamaya
Sadraya
C6.14
• Tamaya: approximately 335k oz. of measured & indicated gold resources(i) defined in 2015
• Recent drilling in the Tasiast Sud area has focused on the C6.13 and C6.15 deposits in the Tasiast Sudarea
Located ~10 km south of the Tasiast mine and west of the Tamaya deposit
• Completed 13,000 metres of drilling in H1 2017
Majority of material at both targets is within a banded iron formation (similar to Piment)
C6.13 defined over approximately 2 km of strike; open to the north and south
C6.15 defined over 3 km of strike
(i) Please refer to Kinross’ Annual Mineral Reserve and Mineral Resource Statement, available on our website at www.Kinross.com, and associated assumptions.

12www.kinross.com
12
GEOLOGY & EXPLORATION
TASIAST SUD: 2017/2018 DRILL PROGRAM
1km
C6.13
C6.15
Tamaya
Sadraya
C6.14
N
Mafic DykeIron FormationSiltstoneGreywackeMica-SchistFelsiteAmphiboliteDioriteTalc Trem SchistGranodiorite
LEGEND
• Following positive results in H1 2017, accelerated drill program underway in H2 2017
Focus is on definition drilling and resource expansion
Goal of potential mineral resource additions at year-end
• Initiated a pre-feasibility study for a Tasiast Suddump leach operation that combines material from Tamaya, C6.13 and C6.15
High grade CIL material expected to be transported to Tasiast 30,000 t/d mill
LegendExplorationResource definition
AB
C
13www.kinross.com
13
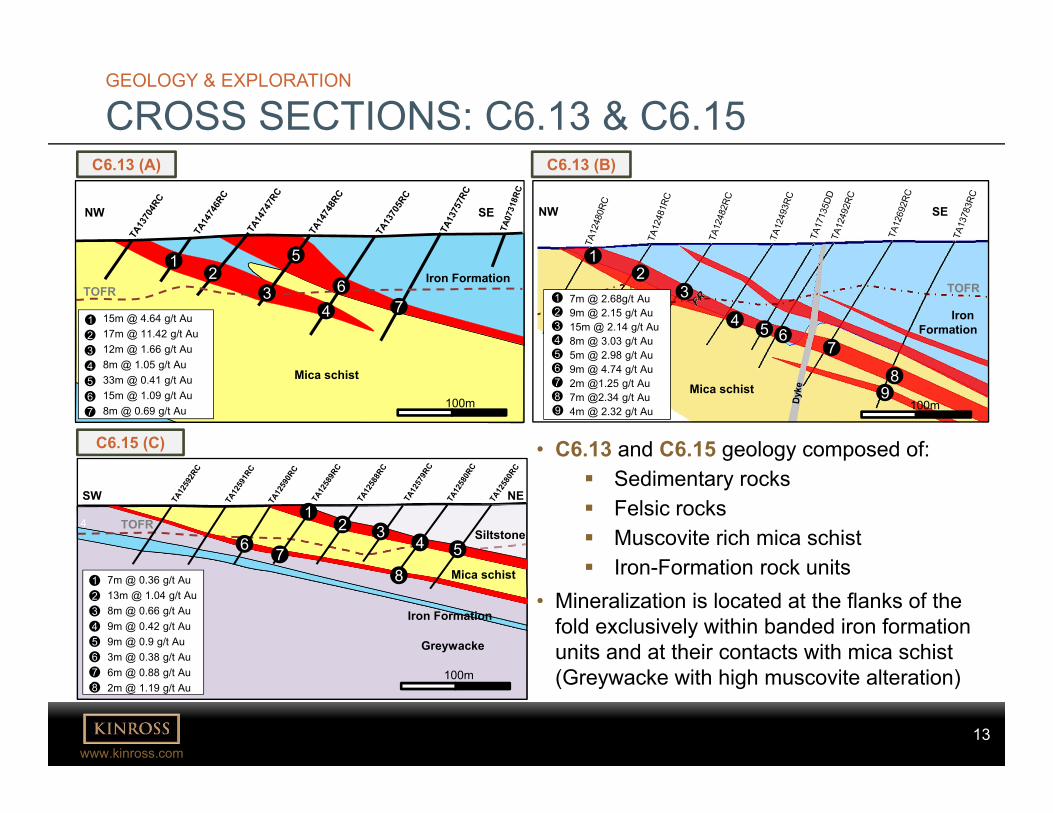
GEOLOGY & EXPLORATION
CROSS SECTIONS: C6.13 & C6.15C6.13 (A)
C6.15 (C) • C6.13 and C6.15 geology composed of: Sedimentary rocks Felsic rocks Muscovite rich mica schist Iron-Formation rock units
• Mineralization is located at the flanks of the fold exclusively within banded iron formation units and at their contacts with mica schist (Greywacke with high muscovite alteration)
C6.13 (B)
TOFR
100m
Mica schist
12
4
5
71234567
15m @ 4.64 g/t Au17m @ 11.42 g/t Au12m @ 1.66 g/t Au8m @ 1.05 g/t Au33m @ 0.41 g/t Au15m @ 1.09 g/t Au8m @ 0.69 g/t Au
3 6 Iron Formation
NW SE
Greywacke
Mica schist
Iron Formation
1234567
7m @ 0.36 g/t Au13m @ 1.04 g/t Au8m @ 0.66 g/t Au9m @ 0.42 g/t Au9m @ 0.9 g/t Au3m @ 0.38 g/t Au6m @ 0.88 g/t Au2m @ 1.19 g/t Au8
8
TOFRSiltstone
12
4 53
76
SW NE
100m
4
6
7
8
7m @ 2.68g/t Au9m @ 2.15 g/t Au15m @ 2.14 g/t Au8m @ 3.03 g/t Au5m @ 2.98 g/t Au9m @ 4.74 g/t Au2m @1.25 g/t Au7m @2.34 g/t Au4m @ 2.32 g/t Au
123456789
12
3
4 5 67
89
100m
NW SE
Iron Formation
TOFR
Mica schist

14www.kinross.com
14
GEOLOGY & EXPLORATION
DRILLING STATISTICS
2013 2014 2015 2016 H1 2017 Planned for H2 2017
Planned for 2018
C6.13 4,481 3,070 75 2,332 7,947 13,000
C6.14 3,500 3,700
C6.15 5,606 2,423 4,479 15,000 37,800
C6.16 2,109 3,801 75 640 3,600
Sadraya 1,999 2,687 9,400
Tamaya 6,852 7,358 14,147 774
Total 22,548 18,651 14,297 5,659 13,200 28,000 54,500
Tasiast Sud area has been a large focus of exploration and resource definition activities
Tasiast Sud drill hole data by year (metres)

15www.kinross.com
15CURRENT OPERATIONMike Sylvestre – Regional Vice-President, Africa 15

16www.kinross.com
16TASIAST SITE LAYOUT
MINE TOUR AGENDA
Camp
West Branch Pit
Airstrip
Power Plant
Phase One tailings facility
Current tailings facility ADR plant
Dump leach
Piment pits
New crusher
New stockpile
New SAG mill
Phase One and Two expansions
Truck shop
1 2
4
3
5
N
67
8
910

17www.kinross.com
17
CURRENT OPERATION
OVERVIEWMINING
• Conventional open-pit
• Ore currently sourced from two pits:
Piment
West Branch
• Average mining rate: ~200k t/d
CURRENT FLEET
• 7 CAT 6060 shovels
• 42 CAT 793D haul trucks
PROCESSING
• Existing CIL: averaging 8,500 t/d
• Dump leach

18www.kinross.com
18
• Conducted comprehensive reviews of crushing and grinding circuit to identify opportunities for improvement
• Completed upgrades to the crushing circuit to provide smaller product size with higher fine material content
• Increased availability of crushing and conveying circuit through improved maintenance practices
• Increased availability of milling circuit with implementation of a new reline/shutdown strategy and improved maintenance practices Together, these improvements have resulted in increased throughput:
Averaging above 8,500 t/d (20% increase)
Strong mill throughput a result of continuous improvement efforts
CURRENT OPERATION
IMPROVED MILL PERFORMANCE

19www.kinross.com
19
3,000
5,000
7,000
9,000
Aug‐13 Nov‐13 Feb‐14 May‐14 Aug‐14 Nov‐14 Feb‐15 May‐15 Aug‐15 Nov‐15 Feb‐16 May‐16 Aug‐16 Nov‐16 Feb‐17 May‐17 Aug‐17
Mill now averages ~8,500 t/d and can reach as high as 9,000 t/d
Average from August 2013 to October 2015
Average from November 2015 to March 2017
~20% increase
May, June, July and August 2016 throughput impacted by work stoppage – values represent average daily during operating days.
CURRENT OPERATION
SIGNIFICANT OPERATIONAL IMPROVEMENTS
May-August 2016 impacted by work
stoppage

20www.kinross.com
20
CURRENT OPERATION
PRODUCTIVITY IMPROVEMENTS
Focus on productivity has resulted in lower costs
0.61 0.56
0.550.39
0.36
0.31
0.53
0.44
0.13
0.27
$2.18
$1.96
2015 H1 2017
Contractors & Admin• Outsourced some mining services
Labour• Increased labour productivity and reduced headcount
Drill / Blast Consumables• Optimized drill patterns for increased blasting
efficiencies
Other Fleet• Improved mobile maintenance practices resulting in
better equipment performance and lower costs• Improved useful life, leading to decreased maintenance
suppliesFleet Consumables• Increase in useful tire life, and lower fuel costs
Mining Cost ($/t mined)

21www.kinross.com
21
Study estimates(ii)Study estimates(ii)
$25.46
$22.84 $22.24
$15.16 $14.40
2015 2016 H1 2017 PFS FS
$2.18$2.05 $1.96
$2.37$2.25
2015 2016 H1 2017 PFS FS
CURRENT OPERATION
OPERATING EFFICIENCIES ENHANCING PROJECT
Recent operating and processing enhancements have positively benefitted both Phase One and Phase Two expansion projects
• Recent performance outperforming study estimates
• Further reduction in processing costs expected as Phase Two increases throughput to 30,000 t/d
Mining costs($ per tonne mined)
Processing costs($ per tonne milled)(i)
(i) Excludes processing costs associated with the dump leach.(ii) 30k t/d scenario. Estimated average for the period 2020-2030.

22www.kinross.com
22
Government has expressed its support for the expansion project:
"We support the Kinross decision toproceed with the Tasiast Phase Twoexpansion and the additional investmentand long-term benefits the project willbring to the country and our people."
Mohamed Abdel VetahMinister of Petroleum, Energy & Mines
CURRENT OPERATION
MAURITANIA HIGHLIGHTS
• Democratic republic that gained independence in 1960
• Mining-friendly jurisdiction: Well-developed, competitive mining law Mining is a major export industry Companies operating in Mauritania include:
SNIM, First Quantum, Algold
• Major foreign companies include: BP, Total, Kosmos Energy, Tullow Oil, Société
Générale Recent increase in oil and gas investment
• Multilateral agencies such as IMF and World Bank active in the country
• Kinross continues to maintain good relations with the government
Government royalty 3%
Income tax rate 25%
Mining Convention: Royalty & Income Tax
Kinross has successfully operated in Mauritania since 2010

23www.kinross.com
23
CURRENT OPERATION
CORPORATE RESPONSIBILITY AT TASIAST
Engaging with stakeholders
• Established stakeholder engagement programs consistent with Kinross standards and international best practice
• Integration of CR considerations in key operational functions
Competency-based hiring
Contractor Compliance Bureau
Local Business policy in Supply Chain Management
• Integrated good international ESIA practice in design of the expansion project
IFC Performance Standards
Cyanide Code certification

24www.kinross.com
24
• 90% of TMLSA employees are Mauritanians
• Investing in training and development programs. Since 2010, we have invested:
~$10 million to support local capacity building
~$20 million in training for our local employees
• One of the best safety performance records among Kinross sites
Building a workforce of Mauritanian nationals
CURRENT OPERATION
90% OF EMPLOYEES ARE MAURITANIAN
2016 Statistics(i)
90%of workforce composed of Mauritanian nationals
$175M of spending with in-country suppliers
$52M of in-country wages
(i) Source: Kinross 2016 Corporate Responsibility Data Supplement and Communication on Progress

25www.kinross.com
25
Employees
• Signed a new 3-year collective labour agreement with unionized employees in October 2016
• Targeting expats with strong background in developing national personnel
• Emphasizing a culture of safety and environmental compliance
Mauritanization Plan• Reached a mutually-acceptable
Mauritanization Plan to increase the number of local workers at Tasiast
Process is proceeding on schedule and achieving positive outcomes
• Identifying internal strength: implementing accelerated development plans for high potential employees
• Recruiting diaspora talent with strong and relevant professional experience
• Adapting Kinross training program to individual development needs
CURRENT OPERATION
BUILDING POSITIVE EMPLOYEE RELATIONSHIPS

26www.kinross.com
26TASIAST MILL EXPANSION: PHASE ONEGuy Bourassa - Vice-President & Project Director, Tasiast Project 26

27www.kinross.com
27
TASIAST EXPANSION PROJECT
PHASE ONE: EXPANSION TO 12,000 T/D
PHASE ONE FLOW SHEET
• Leverages existing mill infrastructure to increase throughput to 12,000 t/d from 8,000 t/d
• Includes installation of an oversized 40’ SAG mill and gyratory crusher
• Enhances processing of the harder, higher grade West Branch ore
Gyratory crusher
Ore stockpile
Oversized SAG mill
Existing ball mills
Leaching Refining
New Existing

28www.kinross.com
28
TASIAST MILL EXPANSION
PHASE ONE PROGRESSING WELL
• Mechanical installation progressing well: SAG mill shell fully in place Installation of gearless motor drive progressing Apron feeders for crusher & reclaim tunnel now
in place Conveyor installation progressing rapidly Installation of 3 new leach tanks almost complete
• Early commissioning progressing as planned: Oxygen plant fully commissioned and supporting
production New tailings facility expected to be operational
shortly• On schedule and on budget for full commercial
production in Q2 2018
Phase One construction approximately 70% complete
Primary Crusher

29www.kinross.com
29SAG MILL
PHASE ONE PROGRESSING WELL

30www.kinross.com
30CYCLONE TOWERS
PHASE ONE PROGRESSING WELL

31www.kinross.com
31LEACH TANKS
PHASE ONE PROGRESSING WELL

32www.kinross.com
32NEW TAILINGS FACILITY
PHASE ONE PROGRESSING WELL

33www.kinross.com
33TASIAST MILL EXPANSION: PHASE TWOPaul Tomory – Chief Technical Officer 33

34www.kinross.com
34
• Installation of an incremental 18,000 t/d of throughput capacity for a total combined capacity of 30,000 t/d
• Project consists of: • Replacing two 14’ ball mills with a new, larger 27’ ball mill• Expansion of power generation capacity by 35 MW• Adding new leaching, thickening and refining capacity• Additions to mining fleet• Upgrades to water supply infrastructure
TASIAST EXPANSION PROJECT
PHASE TWO: EXPANSION TO 30,000 T/D
PHASE TWO FLOW SHEET
Gyratory crusher
Ore stockpile
SAG mill New, larger ball mill
Additional leaching capacity
Thickening
New Existing
35www.kinross.com
35
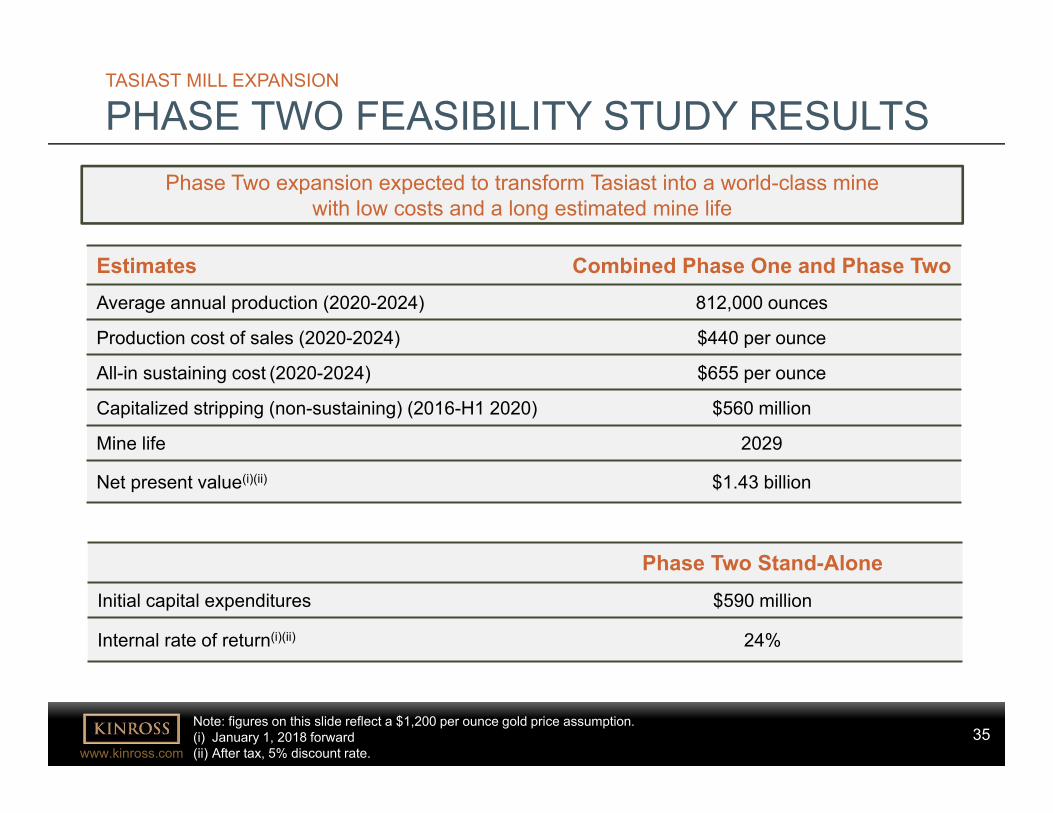
Phase Two expansion expected to transform Tasiast into a world-class mine with low costs and a long estimated mine life
TASIAST MILL EXPANSION
PHASE TWO FEASIBILITY STUDY RESULTS
Estimates Combined Phase One and Phase TwoAverage annual production (2020-2024) 812,000 ounces
Production cost of sales (2020-2024) $440 per ounce
All-in sustaining cost (2020-2024) $655 per ounce
Capitalized stripping (non-sustaining) (2016-H1 2020) $560 million
Mine life 2029
Net present value(i)(ii) $1.43 billion
Phase Two Stand-AloneInitial capital expenditures $590 million
Internal rate of return(i)(ii) 24%
Note: figures on this slide reflect a $1,200 per ounce gold price assumption.(i) January 1, 2018 forward(ii) After tax, 5% discount rate.

36www.kinross.com
36
TASIAST MILL EXPANSION
FEASIBILTY STUDY SHOWS IMPROVED ECONOMICS
Incremental IRR of 24% for the Phase Two stand-alone project
Improved economics are expected as a result of:
Lower estimated initial capital
• Initial capital estimate reduced to $590M
• Down from PFS estimate of $620M
Improved operating cost estimates
• Productivity improvements
• Lower mining and processing costs
• Better input costs
Mine plan optimization
• Higher estimated average annual production in the first 5 years
• Bringing forward production shortens mine life by 1 year Results in G&A and fixed
costs savings

37www.kinross.com
37
TASIAST MILL EXPANSION
WEST BRANCH PLANNED MINING SEQUENCE
2018
2026
2019
2019
2018
20202020
2020
2019
20212021
2022
2023
2024
2024
2027
2025
2023
A’WB3 WB4 WB5
0 – 0.4
0.4 – 1.1
1.1 – 1.5
1.5 – 2
> 2
A’
PLAN VIEW
Au Grade (g/t)
Looking North
N
A
100 m
A

38www.kinross.com
38
TASIAST MILL EXPANSION
ADDITIONAL INFORMATION
‘20 ‘21 ‘22 ‘23 ‘24 ‘25 ‘26 ‘27 ‘28 ‘29
Total mined(Mt) 98 93 82 90 75 56 47 30 7 0
Strip ratio (Waste:Ore) 12.6 15.5 4.5 4.6 3.8 8.8 6.0 2.1 2.7 0.3
Grade processed(g/t) 2.1 1.5 2.9 3.0 3.0 1.4 1.9 2.0 0.9 0.8
Mill feed tonnesfrom stockpiles 4.4 5.3 - - - 5.2 4.4 1.8 9.0 9.9
Annual estimates
Life of mine estimatesLife of Mine Average
Sustaining capital $65/year
G&A $65/year
Recovery 93%

39www.kinross.com
39
TASIAST MILL EXPANSION
ANNUAL PRODUCTION ESTIMATESProduction expected to average 812,000 gold ounces over the first 5 years
(2020-2024)
Estim
ated
Pro
duct
ion
(thou
sand
oun
ces)
0
250
500
750
1,000
2016A 2017E 2018E 2019E 2020E 2021E 2022E 2023E 2024E 2025E 2026E 2027E 2028E 2029E
40www.kinross.com
40
TASIAST MILL EXPANSION
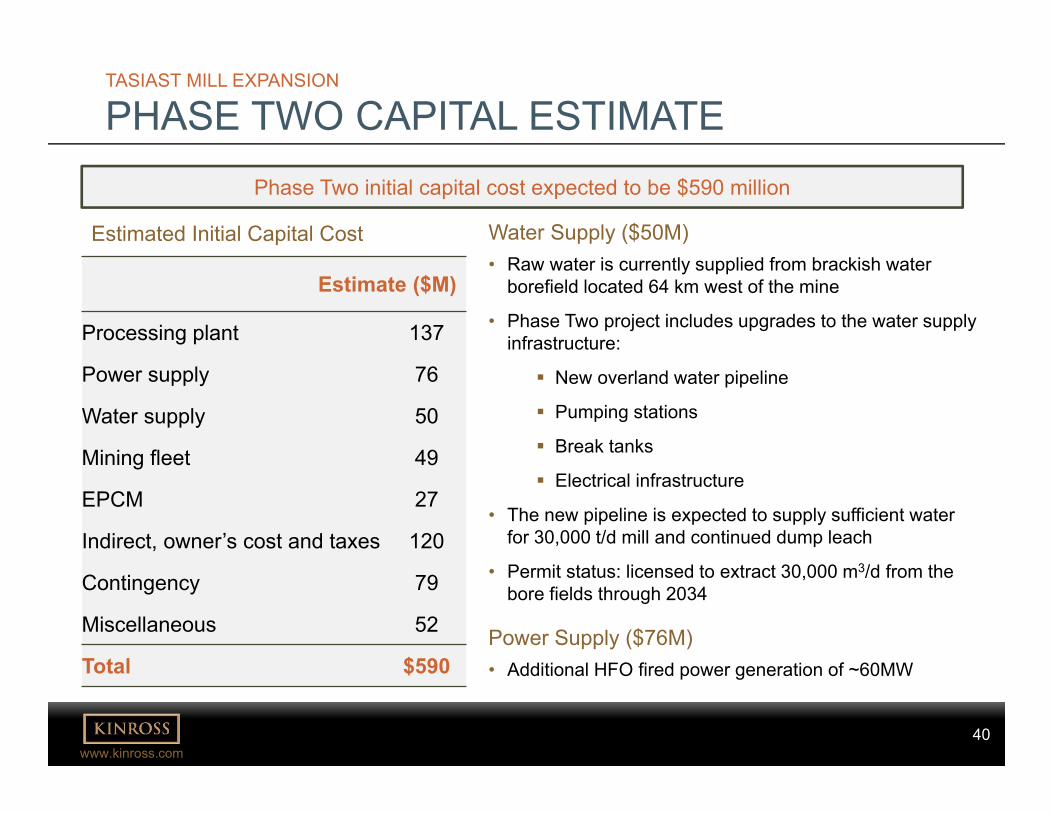
PHASE TWO CAPITAL ESTIMATEPhase Two initial capital cost expected to be $590 million
Estimated Initial Capital Cost
Estimate ($M)
Processing plant 137
Power supply 76
Water supply 50
Mining fleet 49
EPCM 27
Indirect, owner’s cost and taxes 120
Contingency 79
Miscellaneous 52
Total $590
Water Supply ($50M)• Raw water is currently supplied from brackish water
borefield located 64 km west of the mine
• Phase Two project includes upgrades to the water supply infrastructure:
New overland water pipeline
Pumping stations
Break tanks
Electrical infrastructure
• The new pipeline is expected to supply sufficient water for 30,000 t/d mill and continued dump leach
• Permit status: licensed to extract 30,000 m3/d from the bore fields through 2034
Power Supply ($76M)• Additional HFO fired power generation of ~60MW

41www.kinross.com
41
TASIAST MILL EXPANSION
ADVANCING PHASE TWO
• Project owner’s team established
• Finalizing commercial terms for EPCM package
• Currently advancing critical packages
• Initial construction expected to begin early 2018
Construction activities to ramp up following Phase One commissioning
Phase Two expansion expected to reach commercial production in Q3 2020

42www.kinross.com
42APPENDIXTASIAST PHASE TWO FEASIBILITY STUDY RESULTS 42

43www.kinross.com
43
Timeline Operational Metric Estimate
2020-2024(First 5 years of Phase Two
operation)
Total tonnes mined 438 millionStrip ratio 6.4Average CIL grade processed 2.5 grams per tonneAverage annual production 812,000 ouncesAverage mining cost $2.05 per tonneAverage processing cost $14.50 per tonneProduction cost of sales $440 per ounceAll-in sustaining cost $655 per ounce
2025-2029(Remaining life
of mine)
Total tonnes mined 141 million tonnesStrip ratio 4.8Average CIL grade processed 1.5 grams per tonneAverage annual production 457,000 ouncesAverage mining and re-handle cost $2.75 per tonneAverage processing cost $14.30 per tonneProduction cost of sales $680 per ounceAll-in sustaining cost $835 per ounce
2020-2029(Life of project)
Total tonnes mined 579 million tonnesStrip ratio 5.9Average CIL grade processed 2.0 grams per tonneAverage recovery 93%Average annual production 634,000 ouncesAverage mining cost $2.25 per tonneAverage processing cost $14.40 per tonneProduction cost of sales $530 per ounceAll-in sustaining cost $720 per ounce
TASIAST EXPANSION PROJECT
SUMMARY OF FEASIBILITY STUDY RESULTS
Estimated Initial Capital Cost
Operating Estimates (Phase One & Two combined)
Estimate ($ millions)
Processing plant 137
Power supply 76
Water supply 50
Mining fleet 49
EPCM 27
Indirect, owner’s cost and taxes 120
Contingency 79
Miscellaneous 52
Total $590
Standalone Phase Two Estimates
Estimate
Initial capital $590 million
Internal rate of return 24%

44www.kinross.com
44
GOLD PRICE SENSITIVITY ESTIMATES
TASIAST EXPANSION PROJECT
SENSITIVITIES
$1,100 $1,200 $1,300 $1,400IRR (Phase Two Standalone)(calculated January 1, 2018 forward)
19% 24% 28% 31%
NPV (Phase One and Two Combined)(after-tax, 5% discount; calculated January 1, 2018 forward)
$977M $1.43B $1.83B $2.22B
OIL PRICE SENSITIVITY ESTIMATES
$45/bbl $50/bbl $55/bbl $60/bbl $65/bbl
IRR (Phase Two Standalone)(calculated January 1, 2018 forward)
24.9% 24.6% 24.2% 23.9% 23.5%
NPV (Phase One and Two Combined)(after-tax, 5% discount; calculated January 1, 2018 forward)
$1.49B $1.46B $1.43B $1.39B $1.36B

45www.kinross.com
45
KINROSS GOLD CORPORATION 25 York Street, 17th Floor │Toronto, ON │ M5J 2V5www.kinross.com