October 29, 20121 Thomas T.H. Wan, Ph.D., MHS Maysoun Masri Dimachkie, Ph.D., MPH Judith Ortiz,...
16
PERCEIVED BENEFITS & BARRIERS IN ACCOUNTABLE CARE ORGANIZATIONS: A SURVEY OF HEALTHCARE MANAGERS October 29, 2012 1 Thomas T.H. Wan, Ph.D., MHS Maysoun Masri Dimachkie, Ph.D., MPH Judith Ortiz, Ph.D., MBA Blossom Yen Ju Lin, Ph.D. Jeffrey Harrison, Ph.D., MHA
-
Upload
eric-manning -
Category
Documents
-
view
218 -
download
0
Transcript of October 29, 20121 Thomas T.H. Wan, Ph.D., MHS Maysoun Masri Dimachkie, Ph.D., MPH Judith Ortiz,...

October 29, 2012 1
PERCEIVED BENEFITS & BARRIERS IN ACCOUNTABLE
CARE ORGANIZATIONS: A SURVEY OF HEALTHCARE
MANAGERS
Thomas T.H. Wan, Ph.D., MHSMaysoun Masri Dimachkie, Ph.D., MPH
Judith Ortiz, Ph.D., MBABlossom Yen Ju Lin, Ph.D.
Jeffrey Harrison, Ph.D., MHA

October 29, 2012 2
Outlines
Health Care Reform Benefits & Barriers in ACO Participation Research Questions Research Design
Propensity Score Matching & Analysis Measurements Path Analysis
Major Findings Implications and Conclusions

October 29, 2012 3
I. Health Care Reform
Is Health Care Reform Needed?

October 29, 2012 4
Principles of Accountable Health ActMarch 23, 2010
1) Ensure that all Americans have access to quality, affordable health care.
2) Create a new, regulated marketplace where consumers can purchase affordable health care.
3) Extend much needed relief to small business.4) Improve Medicare by helping seniors and people with disabilities afford
their prescription drugs.5) Prohibit denials of coverage based on pre-existing conditions.6) Limit out-of-pocket costs so that Americans have security and peace of
mind.7) Help young adults by requiring insurers to allowable dependents to
remain on their parents’ plan until age 26.8) Expand Medicaid to millions of low-income Americans.9) Provide sliding –scale subsidies to make insurance premiums affordable.10) Hold insurance companies accountable for how our health care dollars
are spent.11) Clamp down on insurance company abuses.12) Invest in preventive care.

October 29, 2012 5
Ineffective Coordination & Fragmented Care
Focus on unit cost
Focus on total cost
Patient Centric Care

October 29, 2012 6
Accountable Care Organization
Establishes partnerships among health care providers to coordinate and deliver efficient care
Assumes joint accountability for improving quality and slowing cost growth
Emphasizes patient-centered care to achieve optimal population health
Adopt innovative delivery systems

October 29, 2012 7
II. Perceived Benefits and Barriers of ACOs: Gaps
Benefits BarriersImprovement in coordinated health care services
Improvement in the patient care outcomes
Reduction in the hospital's total costs.Increase in the hospital's profit margins
Increase physicians and other healthcare providers' participation to improve health
Other benefit
Lack of leadership support or commitment
Inadequate financial incentives Legal and regulatory barriers Fear of losing autonomy Lack of adequate capital for HIT infrastructureInadequate number of PCPs and other specialistsInadequate number of patient population served by the facilityNot having affiliated with any healthcare network

October 29, 2012 8
III. Research Questions
How do we apply propensity score matching and analysis in health care innovation and diffusion research?
Does the benefit-barrier gap influence the plan for developing a strategic initiative in ACOs (Plan_ACOs) and the willingness to participate in ACOs (WP_ACOs)?
What are the personal, organizational and contextual factors influencing the Plan_ACOs and WP_ACOs?
October 29, 2012 9
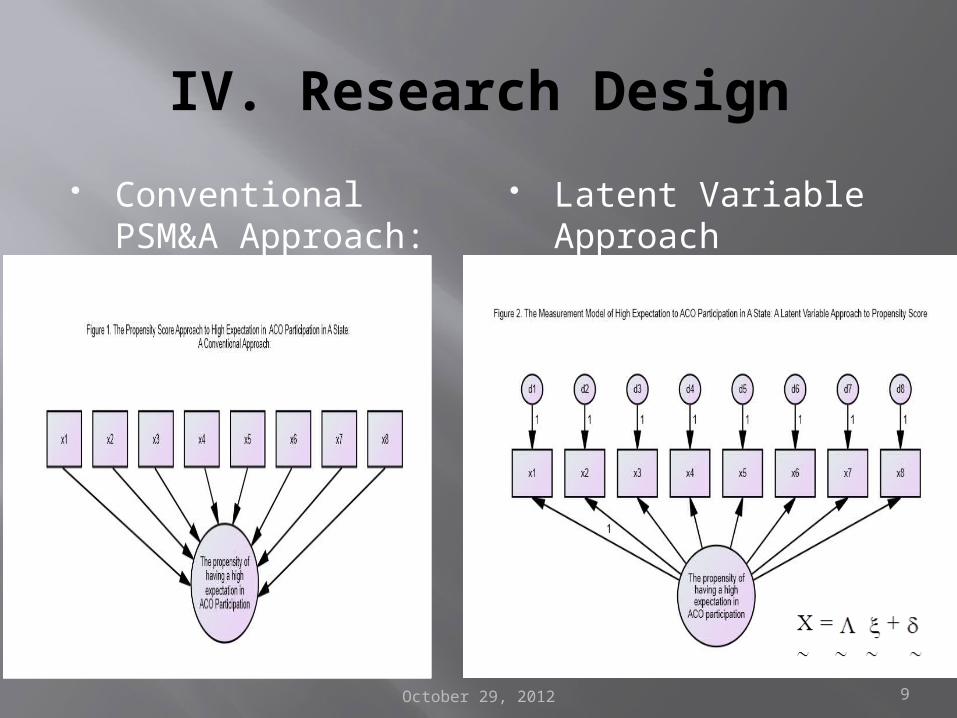
IV. Research Design
Conventional PSM&A Approach:
Latent Variable Approach

October 29, 2012 10
MeasurementsMeasure Items/Scale Mean SD Cronback’s
Alpha Coefficient
Intra-Class Correlation Coefficient (Average)
Organizational Social Capital
6/ Likert scale (0 to 24) 18.440 2.939 0.849 0.839
ElectronicMedical Record Uses
5/ Yes-No (0 to 5) 3.460 1.639 0.785 0.785
Systems Integration
5/ yes-no (0 to 5) 3.441 1.819 0.847 0.847
Perceived Benefits
6/ yes-no (0 to 6) 3.655 1.533 0.611 0.611
PerceivedBarriers
8/ yes-no (0 to 8) 1.738 2.106 0.800 0.800
Benefit-Barrier Gap
Total benefits- total barriers
1.917 2.406
Knowledge About ACOs
1/ Likert scale (1 to 4) 2.631 0.929
Health Networks 8/ yes-no (0 to 8) 2.417 2.169
Plan_ACOs 1/ Likert scale (1 to 4) 2.714 1.013
WP_ACOs 1/ Analog scale (0 to10)
5.048 3.523

October 29, 2012 11
V. Major Findings
Perceived Benefits
Mean WP_ACOs With a Withoutbenefit a benefit
SD WP_ACOs
With a Without benefit a benefit
F-value
Improvement in coordinated health care services
4.904 3.076
5.281 4.199
0.225 (NS)
Improvement in the patient care outcomes
5.010 3.054
5.107 4.833
0.914 (NS)
Reduction in the hospital's total costs.
4.794 3.117
5.810 4.546
0.255 (NS)
Increase in the hospital's profit margins
5.145 3.387
4.773 3.963
0.174 (NS)
Increase physicians and other healthcare providers' participation to improve health
5.032 3.212
5.095 4.436
0.005 (NS)
Other benefit
5.909 4.721
4.918 3.332
0.753 (NS)
Perceived Barriers Mean WP_ACOs With a Withoutbarrier a barrier
SD WP_ACOs
With a Without barrier a barrier
F-value
Lack of leadership support or commitment
2.615 5.493
2.399 3.529
7.930*
Inadequate financial incentives
3.581 5.906
2.953 3.574
9.362*
Legal and regulatory barriers
3.636 5.548
3.215 3.519
5.006*
Fear of losing autonomy
4.000 5.206
3.098 3.578
1.119 (NS)
Lack of adequate capital for HIT infrastructure
4.313 5.221
2.960 3.644
0.858 (NS)
Inadequate number of PCPs and other specialists
5.136 5.016
2.916 3.739
0.019 (NS)
Inadequate patient population
4.474 5.215
3.356 .582
0.648 (NS)
No affiliation with a healthcare network
4.750 5.097
2.896 3.635
0.099 (NS)
ANOVA of Mean WP_ACOs by Specific Benefits or Barriers

October 29, 2012 12
Predictors of Plan_ACOs and WP_ACOs
Predictors Standardized Regression Coefficient
UnstandardizedRegression Coefficient
StandardError
T-value
Plan_ACOs predicted by
EMR uses -0.014 -0.009 0.067 -0.129
Systems integration -0.042 -0.024 0.063 -0.378
Org. social capital -0.053 -0.018 0.034 -0.546
No. of health networks 0 .188 0.088 0.050 1.743
Knowledge about ACOs 0.055 0.060 0.107 0.563
Benefit-barrier gap 0.381 0.161 0.042 3.867*
Rural location -0.198 -0.405 0.211 -1.917
Propensity score -0.159 -0.679 0.418 -1.625
R-square value
0.261

October 29, 2012 13
WP_ACOs predicted by
Standardized regressioncoefficient
Unstandardizedregression coefficient
Standard error
T-vale
Benefit-barrier gap 0.042 0.062 0.165 0.376
Plan_ACOs
0.343 1.192 0.395 3.020*
Knowledge about ACOs
-0.164 -0.622 0.387 -1.608
Propensity score
-0.040 -0.594 1.508 -0.394
R-square value
0.152
.

October 29, 2012 14
Goodness of fit Statistics for the Predictive Model
1) Chi-square= 30.870 with 27 degrees of freedom and P=0.277; 2) GFI = 0.930, AGFI =0. 858, and CFI = 0.951; and 3) RMESEA = 0.042.

October 29, 2012 15
VI. Implications & Conclusions Benefit-barrier gap directly influences Plan_ACOs, but
it indirectly influences WP_ACOs via Plan_ACOs. Three major hurdles for ACOs:
Lack of leadership support or commitment Inadequate financial incentives Legal and regulatory barriers
Personal and organizational factors are more influential than contextual factors in predicting Plan_ACOs and WP_ACOs.
Limitations of the study: Response rate, sampling, and longitudinal study design.
Future research: PSM&A could be useful for evaluating the impact of ACO participation (see next diagram).

October 29, 2012 16
ACO PARTICIPATION:A Latent Variable Approach