October 27 th, 2021 - group.accor.com
27
October 27 th , 2021
Transcript of October 27 th, 2021 - group.accor.com
O c t o b e r 2 7 t h , 2 0 2 1

By reading the following presentation slides, you further agree to be bound by the following limitations and qualifications:
This presentation is for information purposes only and does not constitute an offer or solicitation for the sale or purchase of any securities, any partof the business or assets described herein, or any other interests. It includes only summary information and does not purport to becomprehensive. The information contained in this document has not been independently verified.
This presentation may contain certain statements that are forward-looking with respect to the financial condition, results of operations, business,strategy, prospects, expectations and objectives of Accor S.A.. Such statements are based on management’s current views and assumptionsconsidered reasonable, but which are naturally subject to risks and contingencies generally beyond the control of Accor S.A., and which maychange at any time. These risks and contingencies may lead such statements to ultimately prove inaccurate and the actual results orperformances to materially differ from those expressed or implied therein. The main risk factors are further developed in Accor’s UniversalRegistration Document which is filed with the AMF (Autorité des Marchés Financiers) and is available on the website (www.group.accor.com).Investors are cautioned that although Accor S.A. believes that the information and assumptions reflected in these forward-looking statements arereasonable, it is very difficult to predict the impact of known factors and it is impossible for the Company to anticipate all factors that could affectsuch assumptions.
As a consequence, Accor S.A., its affiliates, directors, advisors, employees and representatives, expressly do not assume any liability whatsoever forsuch forward-looking statements. The information is valid only at the time of writing and Accor S.A. does not undertake to update or revise theforward-looking statements or any other information that may be presented in this document to reflect new information, future events or for anyother reason and any opinion expressed in this presentation is subject to change without notice.
This presentation may include some information on specific transactions that shall be considered as projects only and may remain subject tocertain approvals and other conditions.
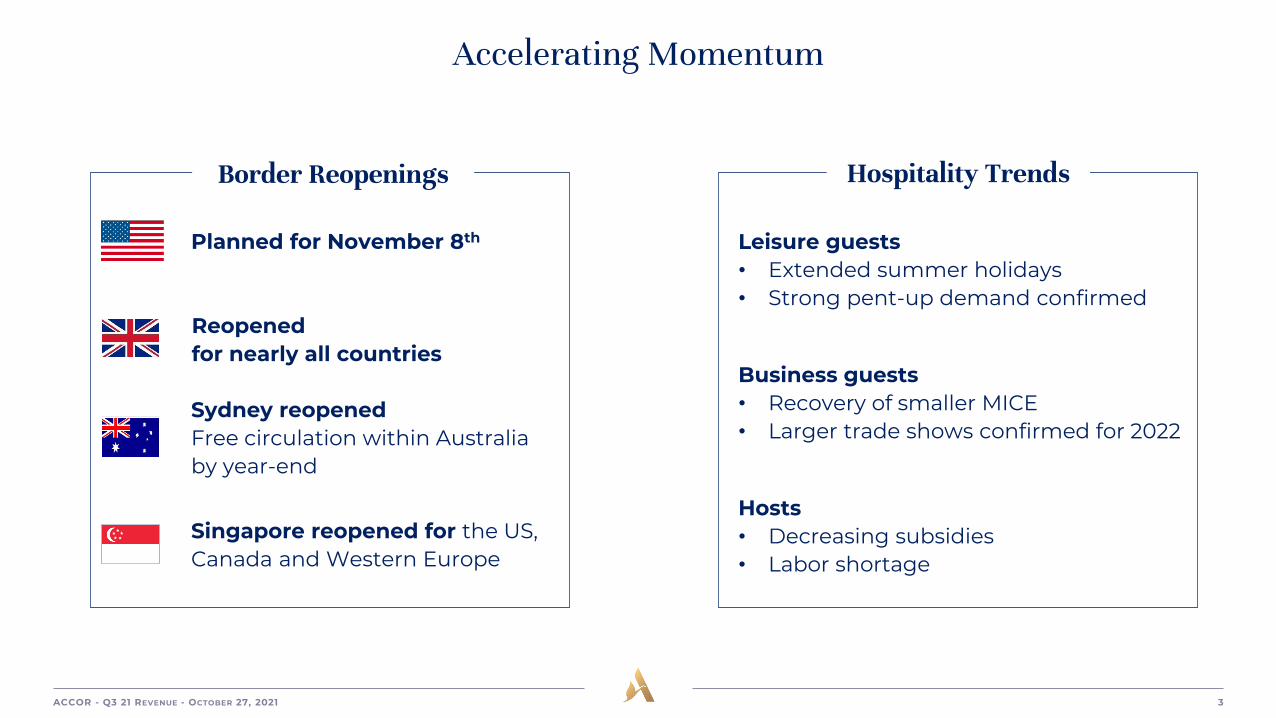
Accelerating Momentum
Border Reopenings Hospitality Trends
Sydney reopenedFree circulation within Australia by year-end
Reopened for nearly all countries
Leisure guests• Extended summer holidays• Strong pent-up demand confirmed
Hosts• Decreasing subsidies• Labor shortage
Planned for November 8th
Singapore reopened for the US, Canada and Western Europe
Business guests• Recovery of smaller MICE• Larger trade shows confirmed for 2022

Q3 2021 Highlights
Significant trading improvement
€589m Revenue(40)% L/L vs. 201979% L/L vs. 2020
3
Systemwide RevPAR(37)% L/L vs. 2019+20% point vs. Q2 21
1
Sustainedoperational discipline
Net Unit Growth+2.5% LTMAround +3% expected for FY21
2
2 RESET cost savings on target€70m+ recurring EBITDA in FY21
1 Upgraded guidance for FY21• EBITDA sensitivity
below €17m per RevPAR point• Average monthly cash burn
below €35m
Fairmont Century Plaza Los Angeles, USA

+2.5% LTM Net System Growth
Hotels 5,252
Rooms 769k
Network
Hotels 1,187
Rooms 211k
Pipeline
161k
237k
91k100k
South Europe North Europe Asia-Pacific IMEAT Americas
180k
In rooms, as of September 2021
16k
37k
95k
48k
15k
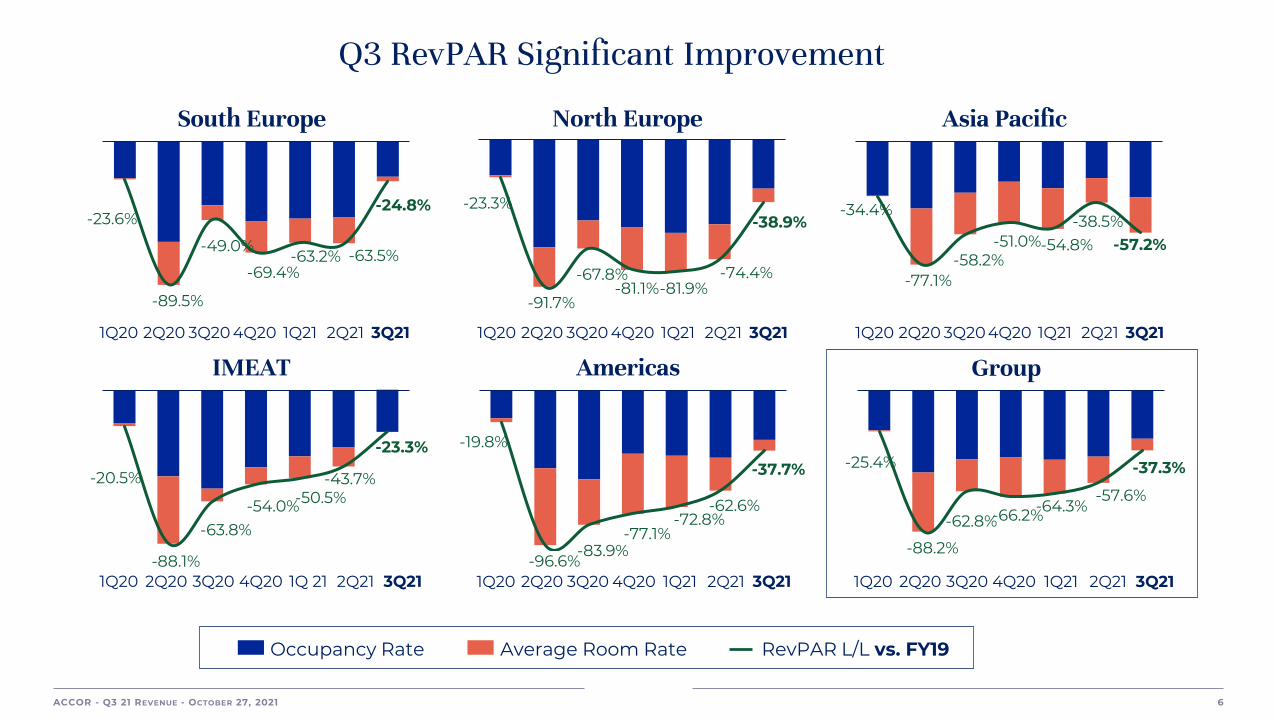
Q3 RevPAR Significant Improvement
Occupancy Rate Average Room Rate RevPAR L/L vs. FY19
North Europe Asia Pacific
-23.3%
-91.7%
-67.8%-81.1%-81.9%
-74.4%
-38.9%
IMEAT
-20.5%
-88.1%
-63.8%-54.0%-50.5%
-43.7%
-23.3%
South Europe
-23.6%
-89.5%
-49.0%
-69.4%-63.2% -63.5%
-24.8% -34.4%
-77.1%-58.2%
-51.0%-54.8%-38.5%
-57.2%
Americas
-19.8%
-96.6%-83.9%
-77.1%-72.8%
-62.6%
-37.7%
Group
-25.4%
-88.2%
-62.8%-66.2%-64.3%-57.6%
-37.3%
2Q20 3Q20 4Q20 1Q21 2Q211Q20
2Q20 3Q20 4Q20 1Q21 2Q211Q20 2Q20 3Q20 4Q20 1Q21 2Q211Q20
2Q20 3Q20 4Q20 1Q 21 2Q211Q20
2Q20 3Q20 4Q20 1Q21 2Q211Q20
2Q20 3Q20 4Q20 1Q21 2Q211Q20
3Q21 3Q21 3Q21
3Q21 3Q21 3Q21
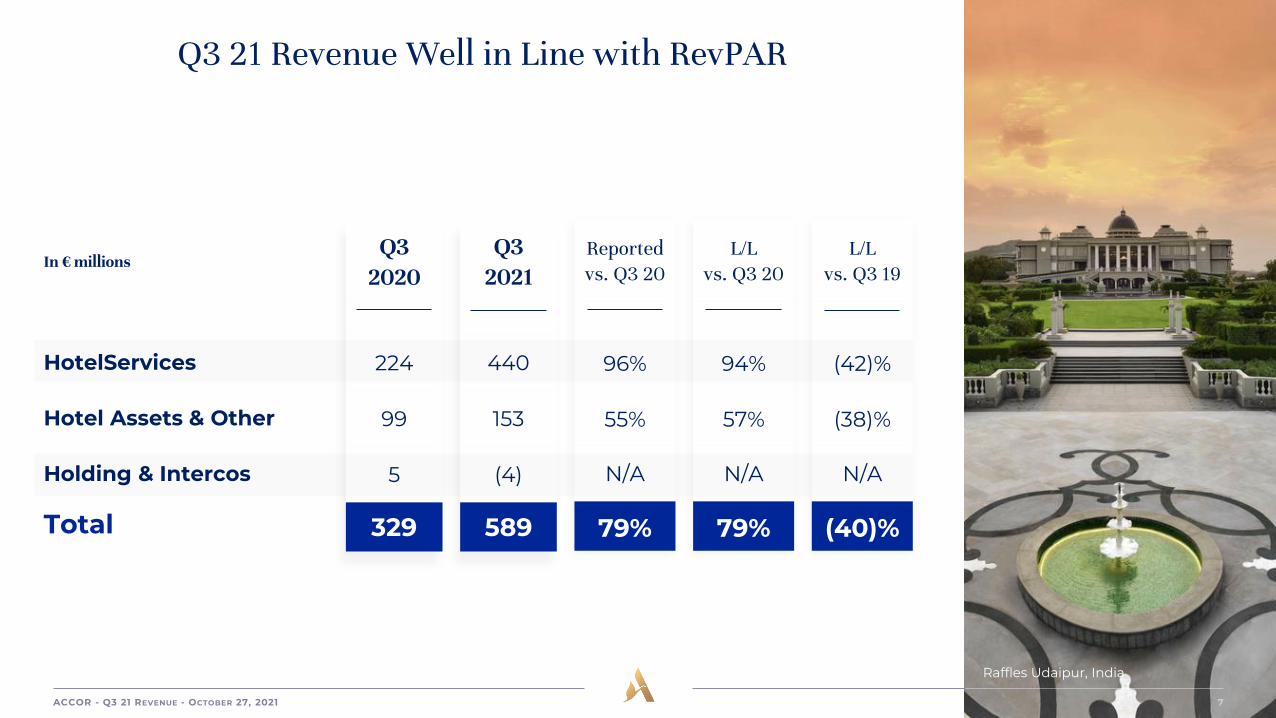
Reportedvs. Q3 20
96%
55%
N/A
79%
L/L vs. Q3 19
(42)%
(38)%
N/A
(40)%
L/L vs. Q3 20
94%
57%
N/A
79%
Q3 21 Revenue Well in Line with RevPAR
Raffles Udaipur, India
In € millions
HotelServices
Hotel Assets & Other
Holding & Intercos
Total
Q3 2021
440
153
(4)
589
Q3 2020
224
99
5
329

L/L vs. Q3 19
(38)%
(44)%
(59)%
(42)%
(43)%
(45)%
In € millions
South Europe
North Europe
ASPAC
IMEAT
Americas
Total
M&F Revenue Reflects RevPAR and Incentive Improvement
L/L vs. Q3 20
68%
159%
38%
197%
213%
107%
Q3 2021
47
39
21
16
28
151
Q3 2020
28
15
15
6
8
72
25Hours Florence, Italy

Our Priorities
1 Confirm recovery over Q4 21 and capture rebound in 2022
2 Pursue RESET cost savings per plan
4 Capitalize on new offers targeting local pent-up demand
3 Continue balance sheet/liquidity optimization
SO/ Sotogrande Hotel, Spain

Appendices
25Hours Florence, Italy
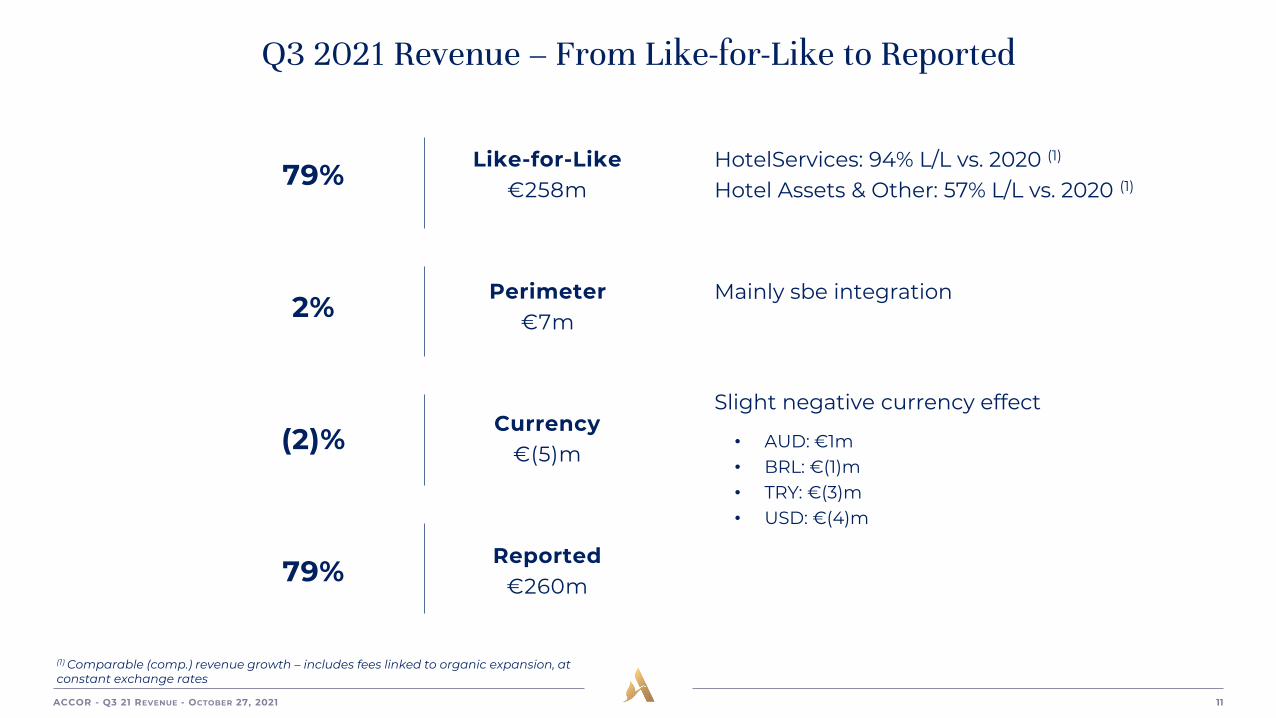
Q3 2021 Revenue – From Like-for-Like to Reported
HotelServices: 94% L/L vs. 2020 (1)
Hotel Assets & Other: 57% L/L vs. 2020 (1)
Mainly sbe integration
Slight negative currency effect
79%Like-for-Like
€258m
Perimeter€7m2%
Currency€(5)m(2)% • AUD: €1m
• BRL: €(1)m• TRY: €(3)m• USD: €(4)m
Reported€260m79%
(1) Comparable (comp.) revenue growth – includes fees linked to organic expansion, at constant exchange rates

Reportedvs. YTD 20
13%
14%
N/A
13%
L/L vs. YTD 19
(53)%
(38)%
N/A
(48)%
L/L vs. YTD 20
13%
21%
N/A
16%
YTD Group Revenue
MGallery Heritage Hotel Fermai, Croatia
In € millions
HotelServices
Hotel Assets & Other
Holding & Intercos
Total
YTD2021
985
434
(7)
1,412
YTD2020
874
382
(11)
1,245
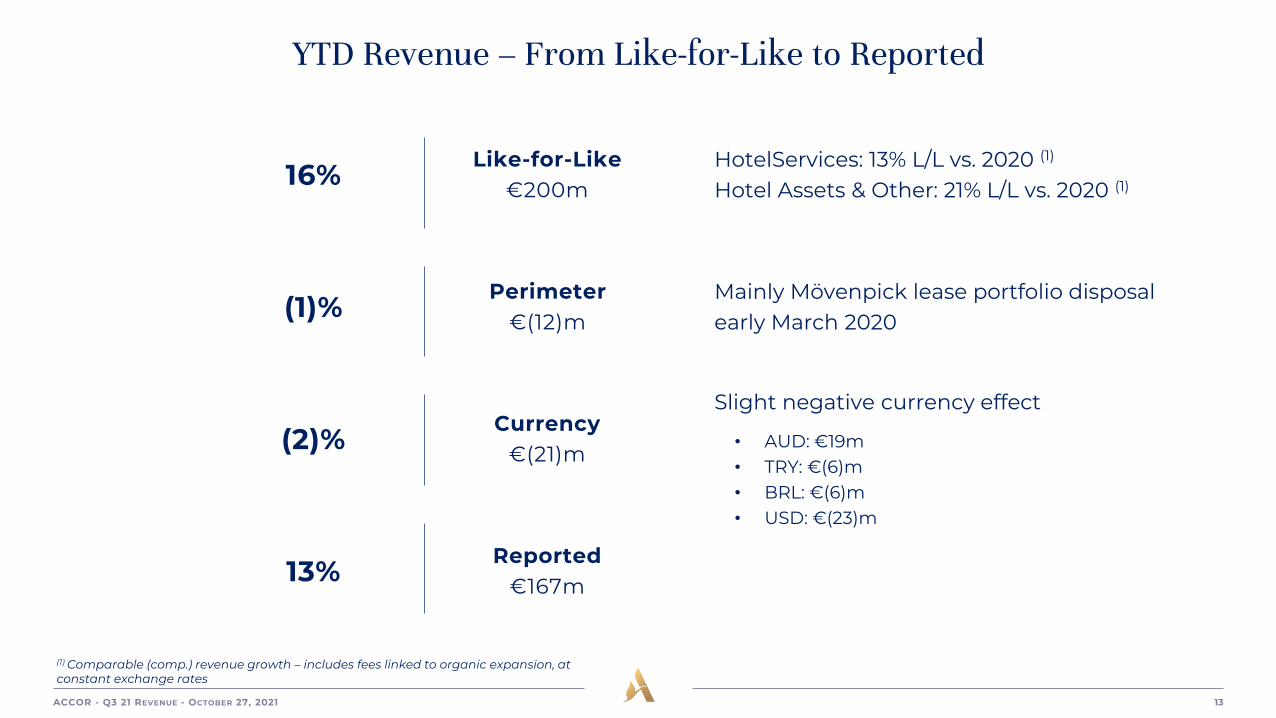
YTD Revenue – From Like-for-Like to Reported
HotelServices: 13% L/L vs. 2020 (1)
Hotel Assets & Other: 21% L/L vs. 2020 (1)
Mainly Mövenpick lease portfolio disposalearly March 2020
Slight negative currency effect
16%Like-for-Like
€200m
Perimeter€(12)m(1)%
Currency€(21)m(2)% • AUD: €19m
• TRY: €(6)m• BRL: €(6)m• USD: €(23)m
Reported€167m13%
(1) Comparable (comp.) revenue growth – includes fees linked to organic expansion, at constant exchange rates

RevPAR
3

RevPAR – Systemwide
YTD 2021 vs. YTD 2019
OR ARR RevPAR
36.5 -30.5 126 -11.1 46 -50.6
39.3 -33.3 72 -14.1 28 -54.1
40.6 -30.9 47 -14.0 19 -51.6
39.1 -31.6 75 -13.1 29 -52.1
Lux. & Upscale
Midscale
Economy
SYSTEMWIDE
Q3 2021 vs. Q3 2019
OR ARR RevPAR
42.4 -27.4 143 -0.3 61 -38.5
50.1 -25.9 77 -7.6 39 -39.1
54.4 -20.5 52 -6.3 28 -31.9
49.8 -24.1 81 -7.3 40 -37.3

RevPAR – Geographical Breakdown (1/2)
Lux. & Upscale
Midscale
Economy
SOUTH EUROPE
Lux. & Upscale
Midscale
Economy
NORTH EUROPE
YTD 2021 vs. YTD 2019
OR ARR RevPAR
31.7 -39.8 217 +3.2 69 -52.8
35.4 -35.4 99 -6.9 35 -53.2
42.6 -28.9 60 -6.7 26 -44.3
39.7 -31.6 78 -8.7 31 -48.9
25.5 -46.5 158 -2.9 40 -63.7
32.4 -41.6 76 -15.1 24 -63.0
31.7 -43.8 58 -15.6 18 -64.8
31.3 -43.0 75 -14.4 24 -63.8
Q3 2021 vs. Q3 2019
OR ARR RevPAR
54.9 -22.9 237 +5.9 130 -24.0
54.6 -22.0 106 -1.4 58 -29.6
61.8 -14.7 64 -2.2 39 -20.9
59.0 -17.5 86 -2.7 51 -24.8
42.1 -36.7 178 +4.4 75 -43.6
53.5 -25.3 82 -8.1 44 -37.4
54.3 -25.9 64 -8.9 34 -38.2
52.6 -26.5 82 -8.5 43 -38.9

RevPAR – Geographical Breakdown (2/2)
Lux. & Upscale
Midscale
Economy
ASPAC
Lux . & Upscale
Midscale
Economy
IMEAT
Lux. & Upscale
Midscale
Economy
AMERICAS
YTD 2021 vs. YTD 2019
OR ARR RevPAR
40.5 -23.9 87 -23.1 35 -50.6
46.4 -28.9 63 -15.3 29 -48.6
51.8 -26.0 32 -23.1 17 -49.9
45.6 -26.5 61 -20.5 28 -50.1
39.1 -27.4 126 +5.2 49 -38.4
50.0 -15.6 50 -16.2 25 -35.443.8 -20.9 34 -21.0 15 -46.842.3 -23.5 87 -4.5 37 -38.7
30.6 -39.5 206 -2.9 63 -56.6
33.5 -29.9 52 -15.4 17 -55.3
33.5 -23.4 28 -10.3 9 -47.1
32.5 -30.7 93 -14.2 30 -55.5
Q3 2021 vs. Q3 2019
OR ARR RevPAR
37.0 -30.4 84 -23.2 31 -56.6
42.6 -37.2 61 -17.0 26 -57.5
50.2 -30.8 32 -23.3 16 -54.1
42.4 -33.2 59 -22.1 25 -57.2
47.5 -20.8 131 +9.5 62 -24.0
61.4 -5.6 52 -8.5 32 -15.852.4 -13.5 34 -10.8 18 -29.151.2 -16.0 91 +0.5 47 -23.3
43.8 -29.0 228 +2.6 100 -37.2
45.1 -19.8 55 -11.4 25 -38.0
42.8 -17.1 28 -7.8 12 -33.8
43.7 -22.1 103 -6.8 45 -37.7

RevPAR – France
YTD 2021 vs. YTD 2019
OR ARR RevPAR
33.5 -38.3 216 +1.7 72 -52.5
36.0 -33.9 102 -7.1 37 -51.9
43.8 -26.7 61 -6.5 27 -41.8
40.9 -29.4 78 -9.1 32 -46.9
Lux. & Upscale
Midscale
Economy
FRANCE
Q3 2021 vs. Q3 2019
OR ARR RevPAR
57.7 -20.8 240 +6.8 138 -21.2
54.9 -21.1 109 -1.2 60 -28.6
62.8 -12.5 64 -1.9 40 -18.1
60.0 -15.5 85 -2.8 51 -22.7

Portfolio
4
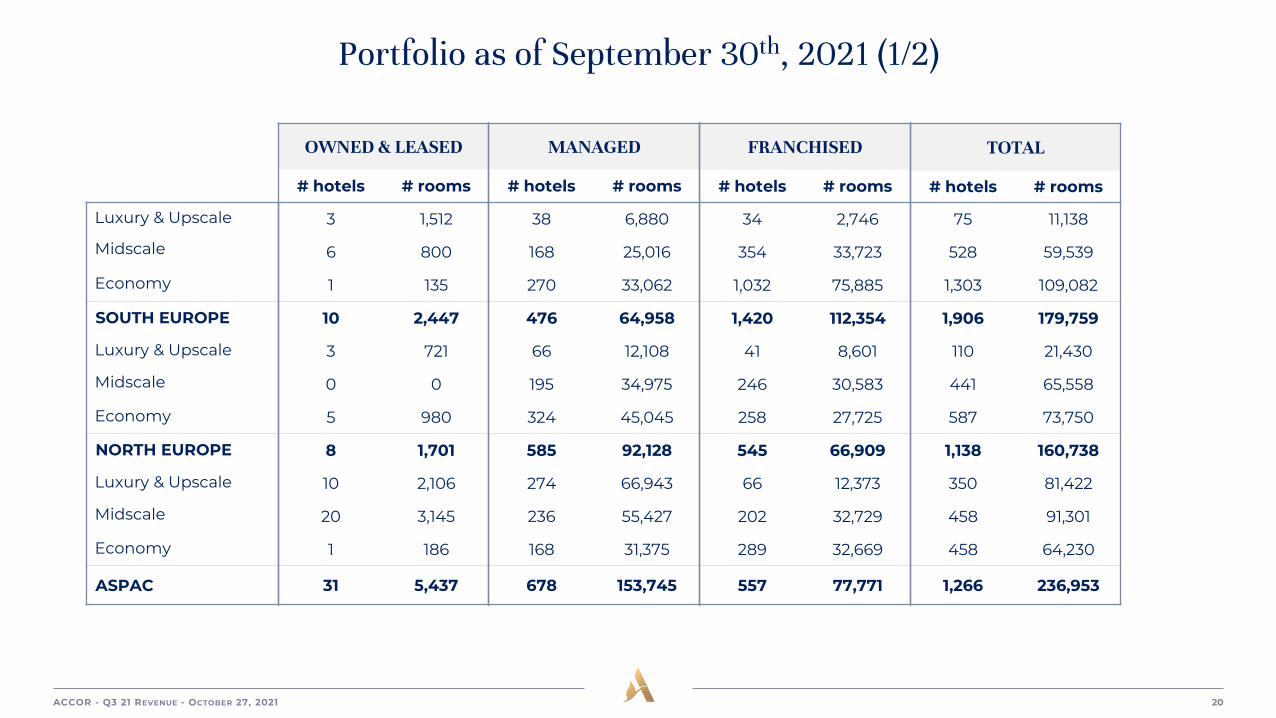
Portfolio as of September 30th, 2021 (1/2)
Luxury & Upscale
Midscale
Economy
SOUTH EUROPE
Luxury & Upscale
Midscale
Economy
NORTH EUROPE
Luxury & Upscale
Midscale
Economy
ASPAC
OWNED & LEASED
# hotels # rooms
3 1,512
6 800
1 135
10 2,447
3 721
0 0
5 980
8 1,701
10 2,106
20 3,145
1 186
31 5,437
MANAGED
# hotels # rooms
38 6,880
168 25,016
270 33,062
476 64,958
66 12,108
195 34,975
324 45,045
585 92,128
274 66,943
236 55,427
168 31,375
678 153,745
FRANCHISED
# hotels # rooms
34 2,746
354 33,723
1,032 75,885
1,420 112,354
41 8,601
246 30,583
258 27,725
545 66,909
66 12,373
202 32,729
289 32,669
557 77,771
TOTAL
# hotels # rooms
75 11,138
528 59,539
1,303 109,082
1,906 179,759
110 21,430
441 65,558
587 73,750
1,138 160,738
350 81,422
458 91,301
458 64,230
1,266 236,953

Portfolio as of September 30th, 2021 (2/2)
Luxury & Upscale
Midscale
Economy
IMEAT
Luxury & Upscale
Midscale
Economy
AMERICAS
OWNED & LEASED
# hotels # rooms
2 525
5 796
10 1,681
17 3,002
2 401
10 1,807
46 9,600
58 11,808
MANAGED
# hotels # rooms
181 45,528
84 15,975
72 13,230
337 74,733
95 30,966
78 13,140
90 14,319
263 58,425
FRANCHISED
# hotels # rooms
26 6,612
22 4,271
15 2,309
63 13,192
20 5,167
32 5,129
152 19,927
204 30,223
TOTAL
# hotels # rooms
209 52,665
111 21,042
97 17,220
417 90,927
117 36,534
120 20,076
288 43,846
525 100,456
Luxury & Upscale
Midscale
Economy
TOTAL
20 5,265
41 6,548
63 12,582
124 24,395
654 162,425
761 144,533
924 137,031
2,339 443,989
187 35,499
856 106,435
1,746 158,515
2,789 300,449
861 203,189
1,658 257,516
2,733 308,128
5,252 768,833

Exchange rates
5

Q3 21 Exchange Rates
Q3 2020Average Rate
1.63
6.26
1.56
18.59
0.90
1.17
Q3 2021vs. Q3 2020
2%
2%
5%
0%
6%
(1)%
Q3 2021Average Rate
1.60
6.14
1.48
18.53
0.86
1.18
1€ = X foreign currency
Australian Dollar (AUD)
Brazilian Real (BRL)
Canadian Dollar (CAD)
Egyptian Pound (EGP)
British Sterling (GBP)
American Dollar (USD)

YTD Exchange Rates
YTD 2020Average Rate
1.66
5.66
1.52
17.82
0.88
1.12
YTD 2021vs. YTD 2020
5%
(11)%
1%
(5)%
2%
(6)%
YTD 2021Average Rate
1.58
6.38
1.50
18.79
0.86
1.20
1€ = X foreign currency
Australian Dollar (AUD)
Brazilian Real (BRL)
Canadian Dollar (CAD)
Egyptian Pound (EGP)
British Sterling (GBP)
American Dollar (USD)

Glossary
6

Glossary
Region organization• South Europe (including France)
• North Europe (including UK and Germany)
• ASPAC: Asia Pacific Region including Greater China & Australia
• IMEAT: India, Middle-East, Africa & Turkey
• Americas: North, Central and South America & Caribbean
Like-for-like (L/L) definition for P&L figures• Foreign exchange changes vs. Euro are cancelled applying the n-1 exchange rate to year n
• Perimeter effects (i.e. acquisitions and disposals) are neutralized:
o Excluding impacts from disposals defined as a change in the consolidation methodology of a given entity
o Excluding impacts from acquisition defined as a change in the consolidation methodology of a given
entity or as the acquisition of an activity or company
o Excluding impact from subsidiaries hotel openings & closings
o Organic system growth and churn are not neutralized on HotelServices revenue