OCTOBER 2014 TREATMENT ACTION GROUP MIKE FRICK. Annual Global Plan Research Funding Targets versus...
18
OCTOBER 2014 TREATMENT ACTION GROUP MIKE FRICK
-
Upload
lucy-perkins -
Category
Documents
-
view
213 -
download
0
Transcript of OCTOBER 2014 TREATMENT ACTION GROUP MIKE FRICK. Annual Global Plan Research Funding Targets versus...

OCTOBER 2014
TREATMENT ACTION GROUP
MIKE FRICK

Annual Global Plan Research Funding Targets versus 2013 Funding
$600,000,000
$800,000,000
$400,000,000
$200,000,000
$0
Basic Science New Diagnostics New Drugs Operational Research
New Vaccines
$80,000,000
$71,754,311$95,172,788
$380,000,000
$255,428,811
$740,000,000
$137,658,205
$420,000,000
Global Plan Annual Targets 2013 Funding
FIGURE 1
$340,000,000
$67,771,567

Total TB R&D Funding, 2005-2013
$525,000,000
$700,000,000
$350,000,000
$175,000,000
$0
2005
$358,476,537
FIGURE 2
2006 2007 2008 2009 2010 2011 2012 2013
$418,928,300
$478,343,421
$494,576,235
$636,979,349$643,360,390
$675,328,887
$638,783,272
$676,656,323
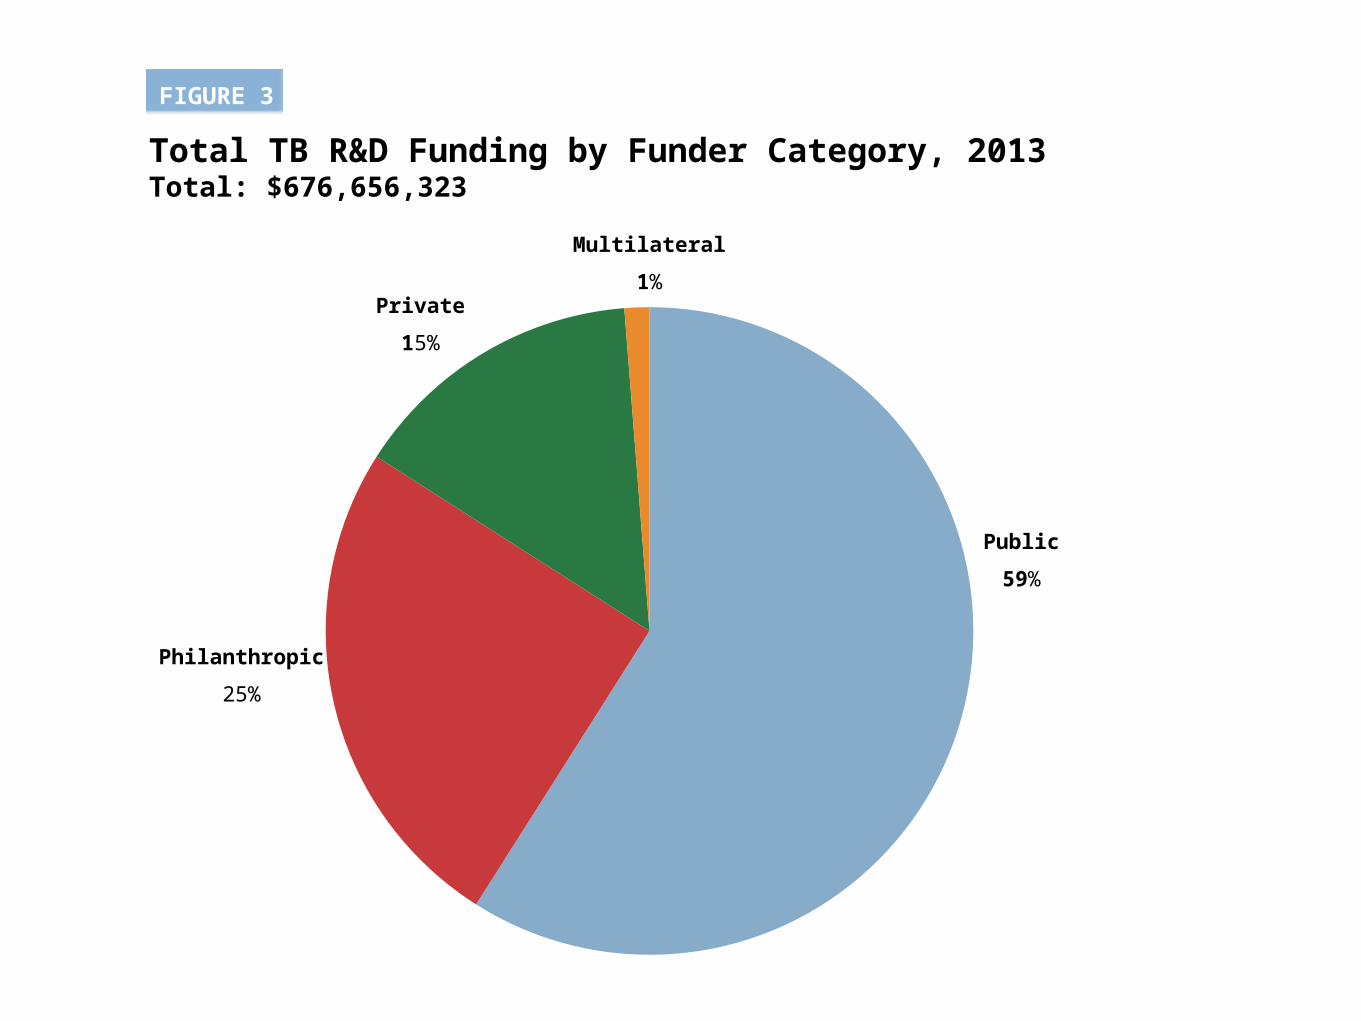
Philanthropic
25%
Private
15%
Multilateral
1%
Public
59%
Total TB R&D Funding by Funder Category, 2013Total: $676,656,323
FIGURE 3

Total TB R&D Funding by Funder Category, 2005-2013 (in USD millions)
FIGURE 4
$375,000,000
$500,000,000
$250,000,000
$125,000,000
$0
2005 2006 2007 2008 2009 2010 2011 2012 2013
Public Philanthropic Private Multilateral
236248
277 268
413389
405390
399
116132
155
124 124
170
43.1 53.169.4
72 99.9
124145
11399.6
1.651.65 1.53 0.53 6.02
8.16 8.39
78
128
123
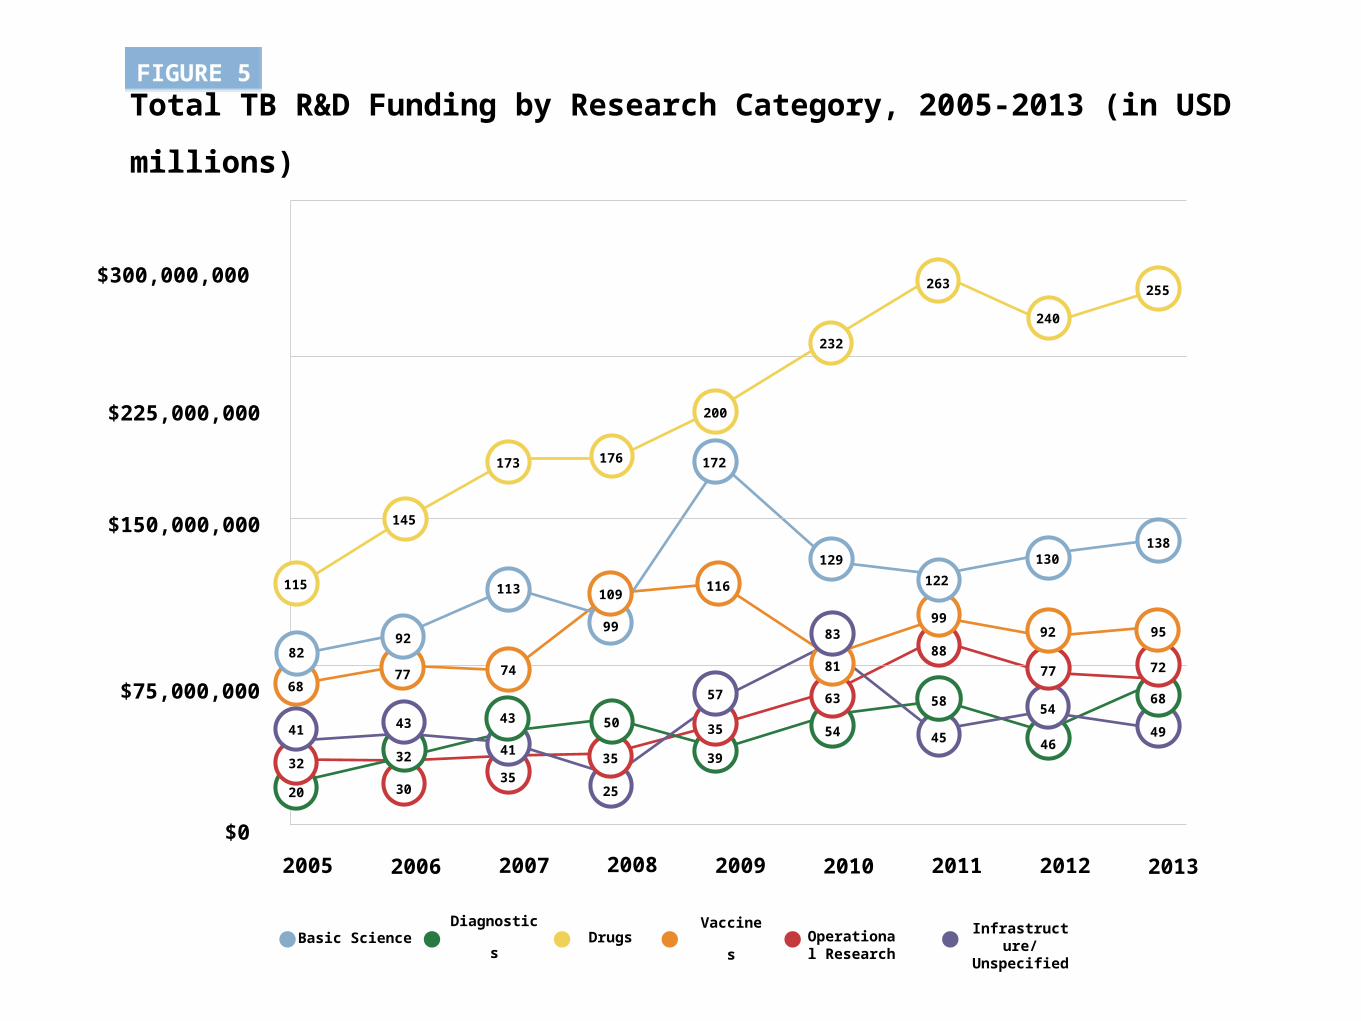
FIGURE 5
Total TB R&D Funding by Research Category, 2005-2013 (in USD millions)
$225,000,000
$300,000,000
$150,000,000
$75,000,000
$0
2005 2006 2007 2008 2009 2010 2011 2012 2013
Basic Science Diagnostics Drugs Vaccines Operational Research
Infrastructure/Unspecified
8292
113
99
172
129 130138
20
39
5446
6877
116109
255
240
263
232
200
176
115
145
173
49
54
45
25
32
3035
35
35
63
88
77
41
74
32
43
41
43 50
57
122
99
58
92
68
7281
83 95

FIGURE 6
Total TB R&D Funding by Research Category, 2013Total: $676,656,323
Vaccines$95,172,788
(14%)
OperationalResearch
$71,754,311(11%)
Infrastructure/Unspecified$48,870,641
(7%)
Basic Science$137,658,205
(20%)
Diagnostics$67,771,567
(10%)
Drugs$255,428,811
(38%)

FIGURE 7
Basic Science: $137,658,205
Funders under 2%$17,647,701
(13%)
BMBF$4,296,966
(3%)
INSERM$5,964,809
(4%)
U.K. MRC$6,559,351
(5%)
EuropeanCommission$6,907,002
(5%)
NIH NHLBI$8,712,423
(6%)
Gates Foundation$13,255,042
(10%) NIH Other ICs$13,957,509
(10%)
NIH NIAID$60,357,403
(44%)
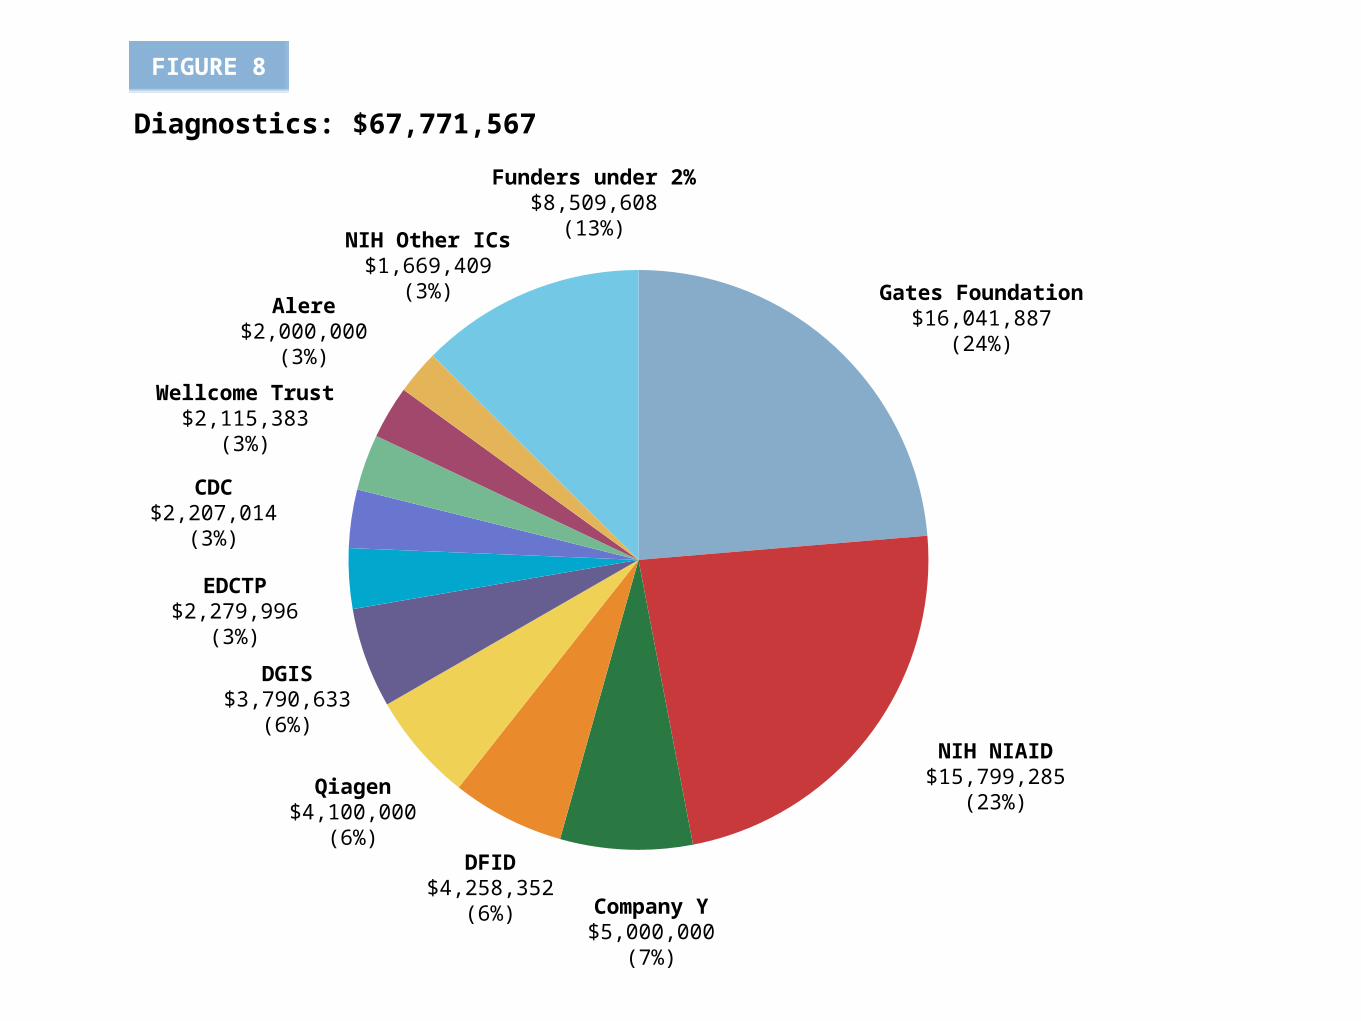
FIGURE 8
NIH Other ICs$1,669,409
(3%)
Funders under 2%$8,509,608
(13%)
Diagnostics: $67,771,567
Gates Foundation$16,041,887
(24%)
NIH NIAID$15,799,285
(23%)
Company Y$5,000,000
(7%)
DFID$4,258,352
(6%)
Qiagen$4,100,000
(6%)
DGIS$3,790,633
(6%)
EDCTP$2,279,996
(3%)
CDC$2,207,014
(3%)
Wellcome Trust$2,115,383
(3%)
Alere$2,000,000
(3%)

FIGURE 9
Funders under 2%$28,976,179
(11%)
Company X$11,640,556
(5%)
CDC$7,970,437
(3%)
Otsuka Pharmaceuticals$58,717,259
(23%)
USAID$8,748,00
(3%)
EDCTP$12,494,787
(5%)
Gates Foundation$86,696,528
(27%)
NIH Other ICs$7,074,534
(3%)
NIH NIAID$34,680,504
(14%)
DFID$9,885,460
(4%)
EuropeanCommission$6,544,567
(2%)
Drugs: $255,428,811

FIGURE 10
Vaccines: $95,172,788
Funders under 2%$13,980,422
(15%)DFAT AusAID
$2,320,509(2%)
U.K. MRC$2,516,682
(3%)
GHIT$3,200,208
(3%)
EDCTP$4,082,007
(4%)
DGIS$4,348,086
(5%)
EmergentBioSolutions
$4,882,000(5%)
NIH NIAID$17,302,047
(18%)
Gates Foundation$39,599,146
(42%)DFID
$3,041,680(3%)

FIGURE 11
Funders under 2%$10,378,761
(15%)
Foundation Mérieux$1,560,852
(2%)
NHMRC$1,720,430
(2%)
PEPFAR$2,028,593
(3%)
CDC$3,968,429
(6%)
Wellcome Trust$3,999,501
(6%)USAID
$5,652,363(8%) DFID
$7,454,580(10%)
Gates Foundation$10,331,275
(14%)
NIH Other ICs$10,977,466
(15%)
NIH NIAID$13,682,061
(19%)
Operational Research: $71,754,311
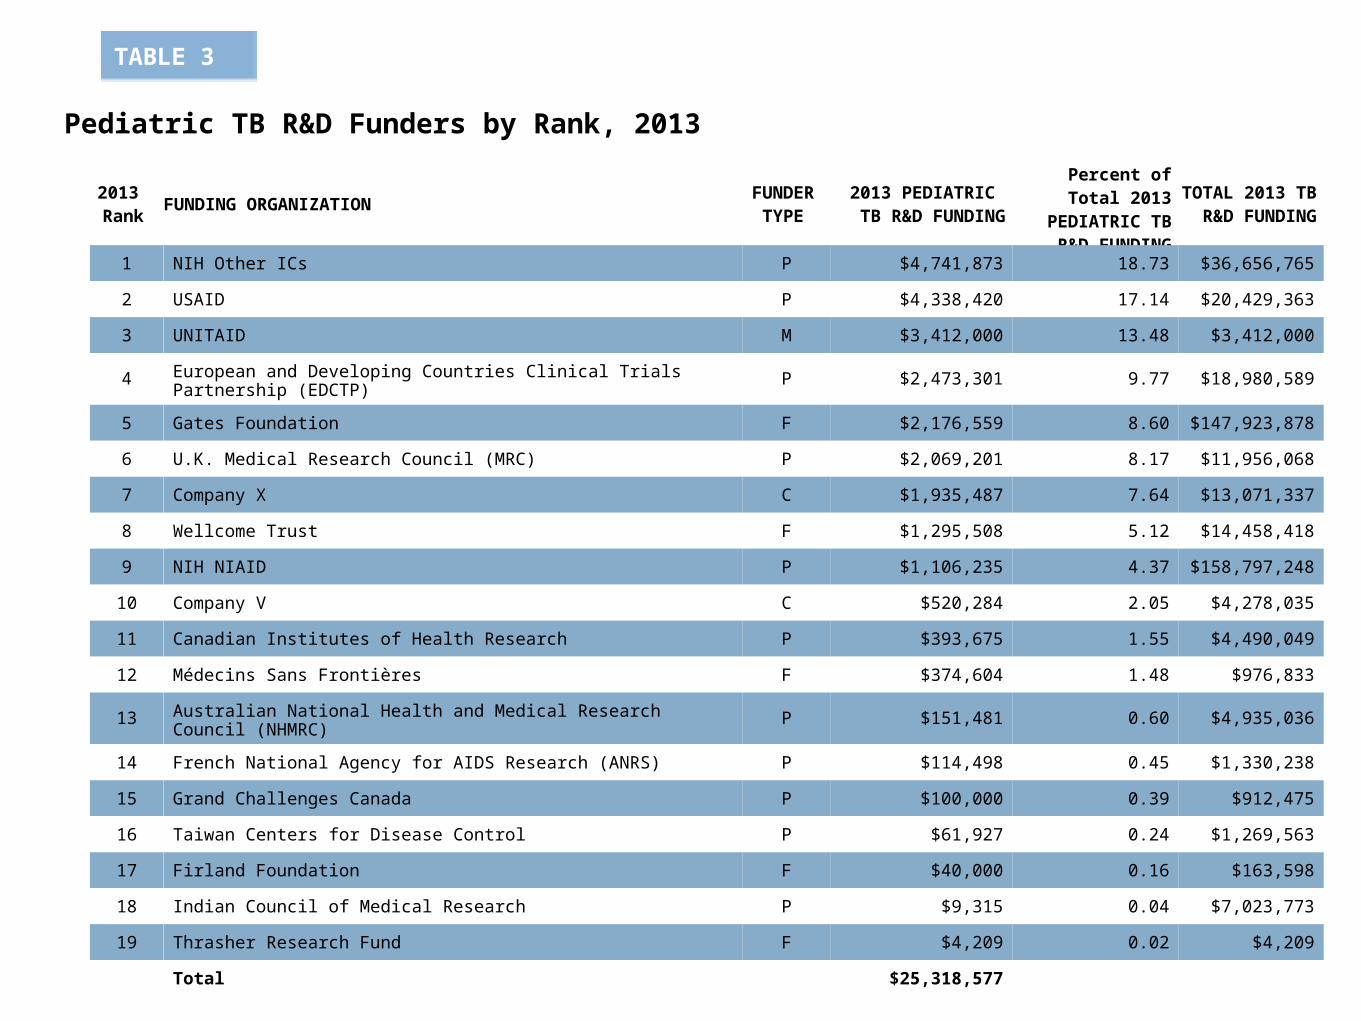
Pediatric TB R&D Funders by Rank, 2013
2013 Rank FUNDING ORGANIZATION FUNDER
TYPE2013 PEDIATRIC TB
R&D FUNDING
Percent of Total 2013 PEDIATRIC
TB R&D FUNDING
TOTAL 2013 TB R&D FUNDING
1 NIH Other ICs P $4,741,873 18.73 $36,656,765
2 USAID P $4,338,420 17.14 $20,429,363
3 UNITAID M $3,412,000 13.48 $3,412,000
4 European and Developing Countries Clinical Trials Partnership (EDCTP) P $2,473,301 9.77 $18,980,589
5 Gates Foundation F $2,176,559 8.60 $147,923,878
6 U.K. Medical Research Council (MRC) P $2,069,201 8.17 $11,956,068
7 Company X C $1,935,487 7.64 $13,071,337
8 Wellcome Trust F $1,295,508 5.12 $14,458,418
9 NIH NIAID P $1,106,235 4.37 $158,797,248
10 Company V C $520,284 2.05 $4,278,035
11 Canadian Institutes of Health Research P $393,675 1.55 $4,490,049
12 Médecins Sans Frontières F $374,604 1.48 $976,833
13 Australian National Health and Medical Research Council (NHMRC) P $151,481 0.60 $4,935,036
14 French National Agency for AIDS Research (ANRS) P $114,498 0.45 $1,330,238
15 Grand Challenges Canada P $100,000 0.39 $912,475
16 Taiwan Centers for Disease Control P $61,927 0.24 $1,269,563
17 Firland Foundation F $40,000 0.16 $163,598
18 Indian Council of Medical Research P $9,315 0.04 $7,023,773
19 Thrasher Research Fund F $4,209 0.02 $4,209
Total $25,318,577
TABLE 3

FIGURE 12
Pediatric TB R&D Funding by Research Category, 2013
Total: $25,318,577
Vaccines$4,692,887
(19%)
Operational Research$3,321,459
(13%)
Basic Science$3,312,681
(13%)
Infrastructure/Unspecified$583,631
(2%)
Diagnostics$2,564,036
(10%)
Drugs$10,843,882
(43%)

Total TB R&D Spending by PDPs, 2005-2013
$55,000,000
$60,000,000
$30,000,000
$15,000,000
$0
Aeras TB Alliance FIND TBVI
FIGURE 13

Country Contributions to TB R&D, 2013
FIGURE 14
Denmark
France
Germany
Ireland
Norway
Spain
Sweden
Switzerland
The Netherlands
United Kingdom
$951,731
$8,494,130
$7,720,717
$2,646,350
$3,506,782
$2,427,077
$1,806,504
$42,304
$9,750,636
$37,463,920
Europe by Country
United States$248,507,222
Canada$7,058,047
European Union Total $35,850,662
India $8,570,914Gabon
$320,598
Brazil$864,596
South Africa$2,708,858
Australia $12,874,184
New Zealand $853,766
South Korea $2,050,952
Japan
$3,424,751
Taiwan$1,299,563

Research Area 2005 2006 2007 2008 2009* 2010* 2011 2012 2013
Tuberculosis $158 $150 $188 $142 $216 $224 $209 $218 $207
HIV/AIDS $2,921 $2,902 $2,906 $2,928 $3,338 $3,407 $3,059 $3,074 $2,898
Malaria $104 $98 $112 $142 $121 $148 $145 $152 $147
Smallpox $187 $149 $142 $94 $98 $97 $41 $40 $30
Anthrax $183 $150 $160 $134 $115 $130 $87 $84 $70
2005–2013 NIH Funding for Selected Infectious Diseases (in USD millions)
*Includes American Recovery and Reinvestment Act stimulus funds
Source: NIH Estimates of Funding for Various Research, Condition, and Disease Categories (RCDC).
Available from: http://report.nih.gov/categorical_spending.aspx.
TABLE 4
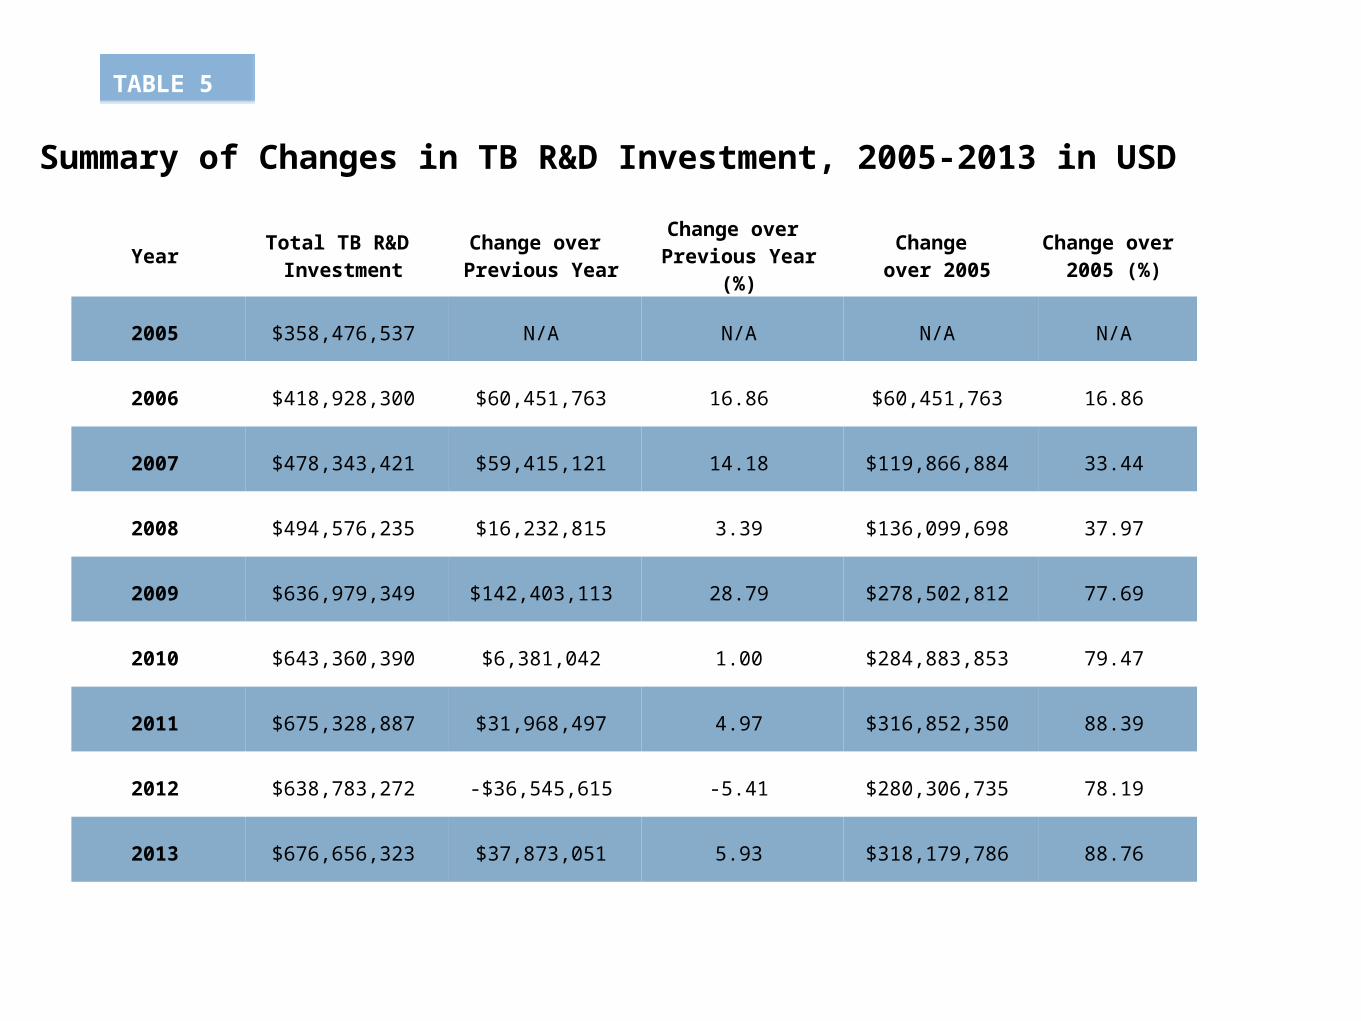
Year Total TB R&D Investment
Change over Previous Year
Change over Previous Year (%)
Change over 2005
Change over 2005 (%)
2005 $358,476,537 N/A N/A N/A N/A
2006 $418,928,300 $60,451,763 16.86 $60,451,763 16.86
2007 $478,343,421 $59,415,121 14.18 $119,866,884 33.44
2008 $494,576,235 $16,232,815 3.39 $136,099,698 37.97
2009 $636,979,349 $142,403,113 28.79 $278,502,812 77.69
2010 $643,360,390 $6,381,042 1.00 $284,883,853 79.47
2011 $675,328,887 $31,968,497 4.97 $316,852,350 88.39
2012 $638,783,272 -$36,545,615 -5.41 $280,306,735 78.19
2013 $676,656,323 $37,873,051 5.93 $318,179,786 88.76
Summary of Changes in TB R&D Investment, 2005-2013 in USD
TABLE 5