OCT 2013 MA and Investment Summary - Petsky Prunier...
56
October 2013 M&A and Investment Summary Expertise Commitment Results Expertise. Commitment. Results.
Transcript of OCT 2013 MA and Investment Summary - Petsky Prunier...

October 2013 M&A and Investment Summary
Expertise Commitment ResultsExpertise. Commitment. Results.
Table of Contents
Overview of Monthly M&A and Investment Activity 31
Monthly M&A and Investment Activity by Industry Segment 102
Additional Monthly M&A and Investment Activity Data 403 Additional Monthly M&A and Investment Activity Data 403
About Petsky Prunier 534
Securities offered through Petsky Prunier Securities, LLC, member of FINRA.
This M&A and Investment Summary has been prepared by and is being distributed in the United States by Petsky Prunier, a broker dealer register with the d b f k ff l d h l l d b h d h l d l
2 | M&A and Investment Summary October 2013
U.S. SEC and a member of FINRA. Petsky Prunier is not affiliated with Altium Capital Ltd, but has partnered with Altium to expand its international presence. Altium has not prepared or verified the information in this Summary. Persons in the United States should contact Petsky Prunier for further information or services. This M&A and Investment Summary is not being distributed by Altium Capital Ltd in the United States and Altium Capital Ltd is not offering any services to persons in the United States.
M&A and Investment Summary for All Segments
Transaction Distribution
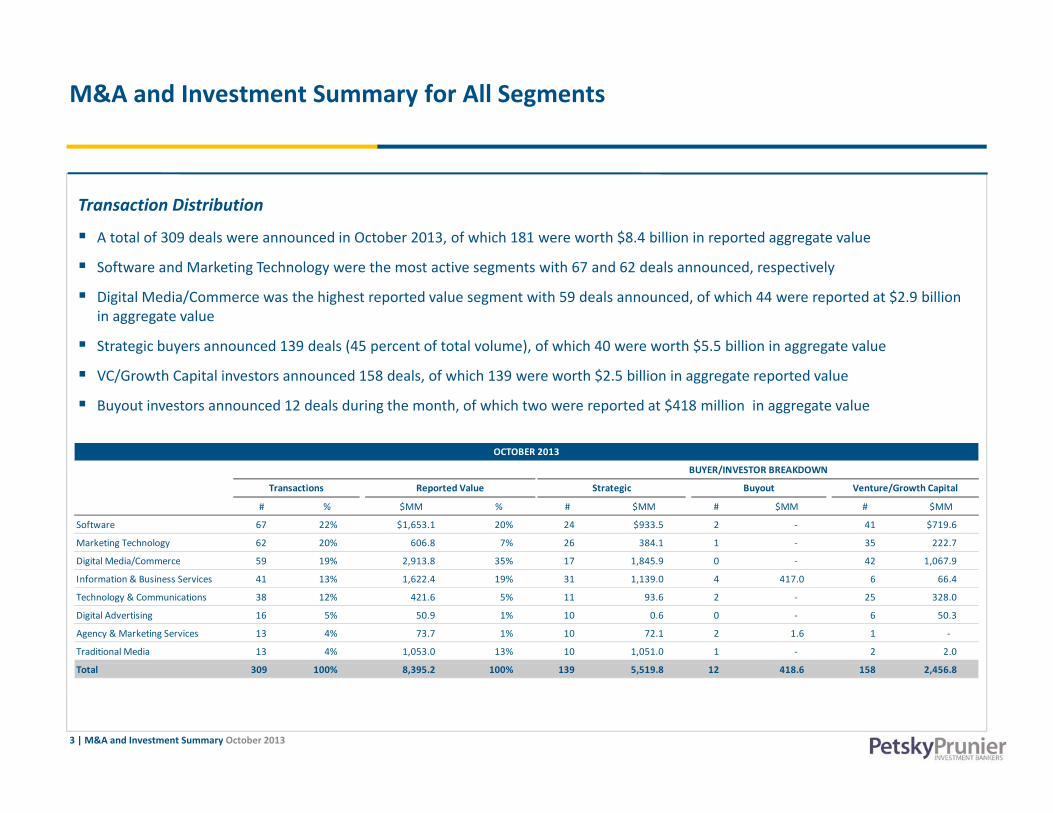
A total of 309 deals were announced in October 2013, of which 181 were worth $8.4 billion in reported aggregate value
Software and Marketing Technology were the most active segments with 67 and 62 deals announced, respectively
Digital Media/Commerce was the highest reported value segment with 59 deals announced, of which 44 were reported at $2.9 billionin aggregate value
Strategic buyers announced 139 deals (45 percent of total volume), of which 40 were worth $5.5 billion in aggregate value
VC/Growth Capital investors announced 158 deals, of which 139 were worth $2.5 billion in aggregate reported value
Buyout investors announced 12 deals during the month, of which two were reported at $418 million in aggregate value
OCTOBER 2013
# % $MM % # $MM # $MM # $MM
Software 67 22% $1,653.1 20% 24 $933.5 2 ‐ 41 $719.6
Marketing Technology 62 20% 606.8 7% 26 384.1 1 ‐ 35 222.7
Digital Media/Commerce 59 19% 2 913 8 35% 17 1 845 9 0 42 1 067 9
BUYER/INVESTOR BREAKDOWN
Transactions Reported Value Strategic Buyout Venture/Growth Capital
Digital Media/Commerce 59 19% 2,913.8 35% 17 1,845.9 0 ‐ 42 1,067.9
Information & Business Services 41 13% 1,622.4 19% 31 1,139.0 4 417.0 6 66.4
Technology & Communications 38 12% 421.6 5% 11 93.6 2 ‐ 25 328.0
Digital Advertising 16 5% 50.9 1% 10 0.6 0 ‐ 6 50.3
Agency & Marketing Services 13 4% 73.7 1% 10 72.1 2 1.6 1 ‐
Traditional Media 13 4% 1,053.0 13% 10 1,051.0 1 ‐ 2 2.0
3 | M&A and Investment Summary October 2013
Total 309 100% 8,395.2 100% 139 5,519.8 12 418.6 158 2,456.8
M&A and Investment Summary for All Segments
Transaction Distribution
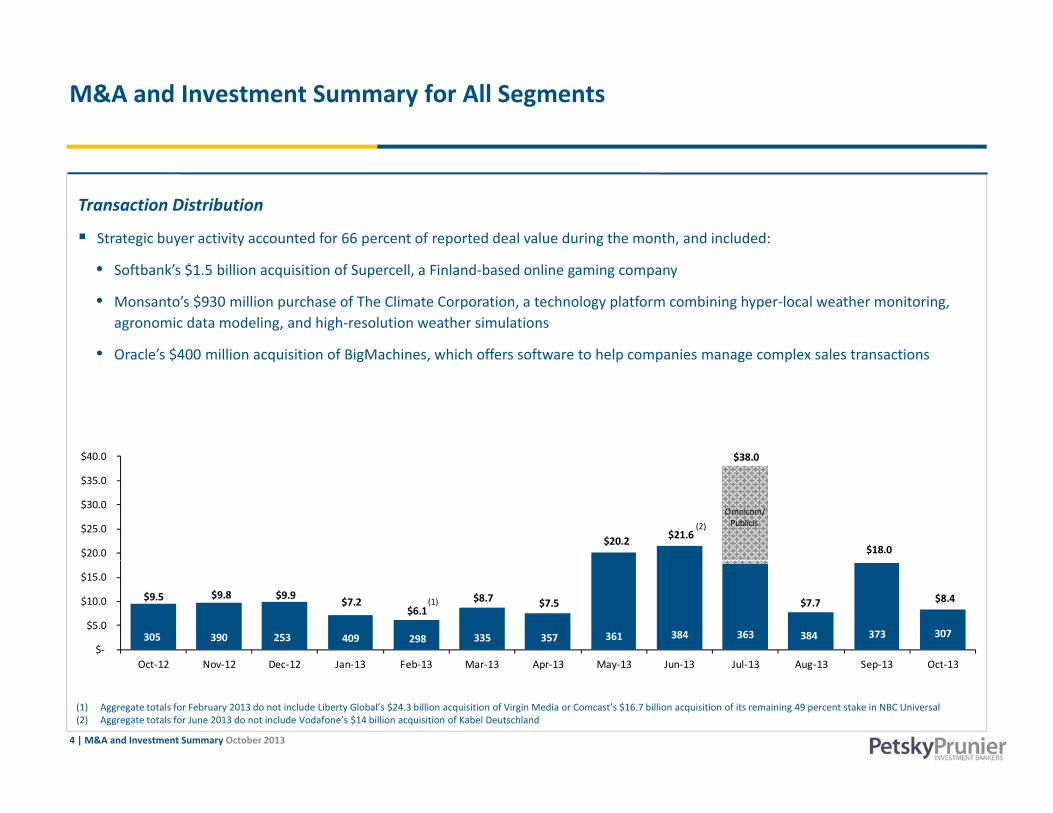
Strategic buyer activity accounted for 66 percent of reported deal value during the month, and included:
• Softbank’s $1.5 billion acquisition of Supercell, a Finland‐based online gaming company
• Monsanto’s $930 million purchase of The Climate Corporation, a technology platform combining hyper‐local weather monitoring, agronomic data modeling, and high‐resolution weather simulations
• Oracle’s $400 million acquisition of BigMachines which offers software to help companies manage complex sales transactionsOracle s $400 million acquisition of BigMachines, which offers software to help companies manage complex sales transactions
$38 0$40 0
Omnicom/Publicis
$20.2 $21.6
$38.0
$18.0 $20.0
$25.0
$30.0
$35.0
$40.0
(2)
$9.5 $9.8 $9.9 $7.2 $6.1
$8.7 $7.5 $7.7 $8.4
305 390 253 409 298 335 357 361 384 363 384 373 307$‐
$5.0
$10.0
$15.0
Oct 12 Nov 12 Dec 12 Jan 13 Feb 13 Mar 13 Apr 13 May 13 Jun 13 Jul 13 Aug 13 Sep 13 Oct 13
(1)
4 | M&A and Investment Summary October 2013
(1) Aggregate totals for February 2013 do not include Liberty Global’s $24.3 billion acquisition of Virgin Media or Comcast’s $16.7 billion acquisition of its remaining 49 percent stake in NBC Universal(2) Aggregate totals for June 2013 do not include Vodafone’s $14 billion acquisition of Kabel Deutschland
Oct‐12 Nov‐12 Dec‐12 Jan‐13 Feb‐13 Mar‐13 Apr‐13 May‐13 Jun‐13 Jul‐13 Aug‐13 Sep‐13 Oct‐13
Selected Transactions with Valuation Information Disclosed($ in Millions)
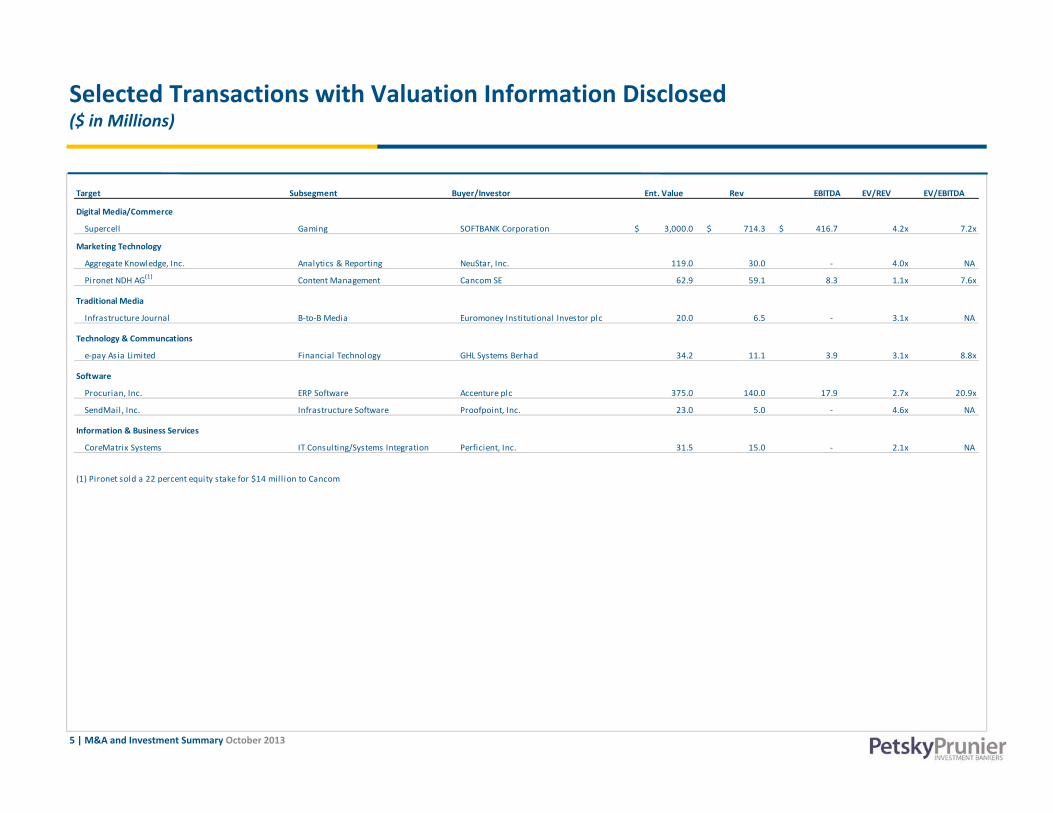
Target Subsegment Buyer/Investor Ent. Value Rev EBITDA EV/REV EV/EBITDA
Digital Media/Commerce
Supercell Gaming SOFTBANK Corporation 3,000.0$ 714.3$ 416.7$ 4.2x 7.2x
Marketing Technology
Aggregate Knowledge, Inc. Analytics & Reporting NeuStar, Inc. 119.0 30.0 ‐ 4.0x NA
Pironet NDH AG(1) Content Management Cancom SE 62.9 59.1 8.3 1.1x 7.6x
Traditional Media
Infrastructure Journal B‐to‐B Media Euromoney Institutional Investor plc 20.0 6.5 ‐ 3.1x NA
Technology & Communcations
e pay Asia Limited Financial Technology GHL Systems Berhad 34 2 11 1 3 9 3 1x 8 8xe‐pay Asia Limited Financial Technology GHL Systems Berhad 34.2 11.1 3.9 3.1x 8.8x
Software
Procurian, Inc. ERP Software Accenture plc 375.0 140.0 17.9 2.7x 20.9x
SendMail, Inc. Infrastructure Software Proofpoint, Inc. 23.0 5.0 ‐ 4.6x NA
Information & Business Services
CoreMatrix Systems IT Consulting/Systems Integration Perficient, Inc. 31.5 15.0 ‐ 2.1x NA
(1) Pironet sold a 22 percent equity stake for $14 million to Cancom
5 | M&A and Investment Summary October 2013
Selected IPOs with Valuation Information Disclosed($ in Millions)
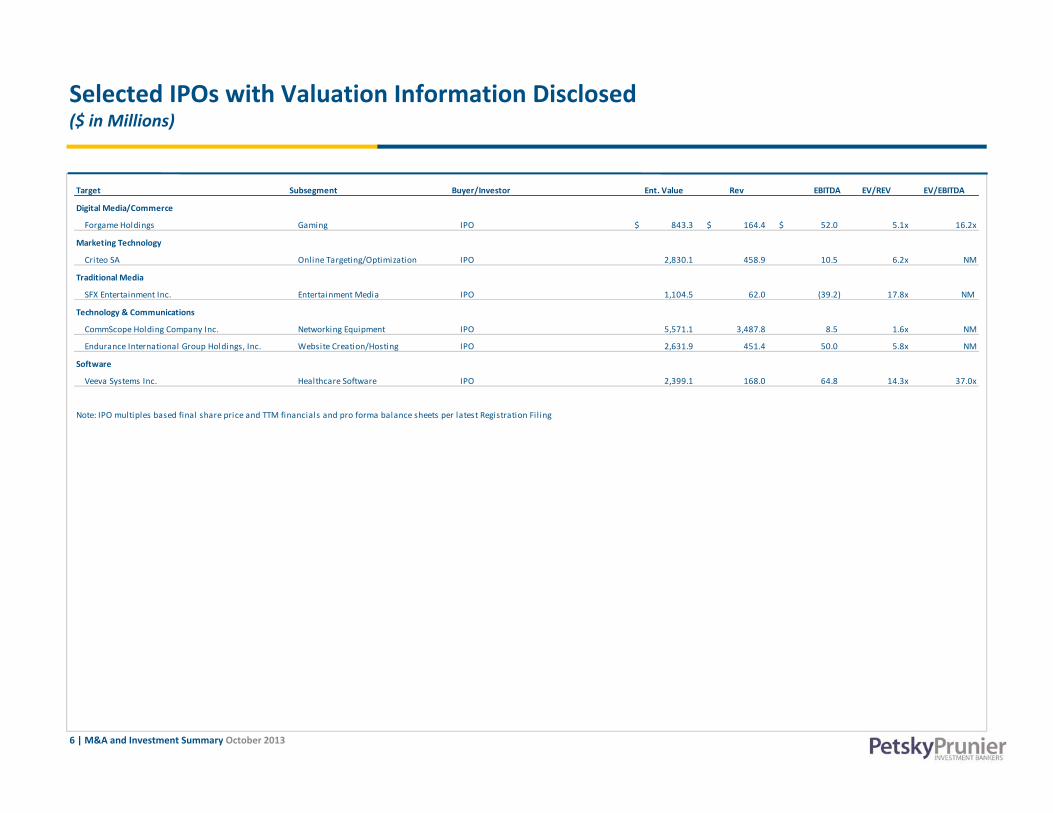
Target Subsegment Buyer/Investor Ent. Value Rev EBITDA EV/REV EV/EBITDA
Digital Media/Commerce
Forgame Holdings Gaming IPO 843.3$ 164.4$ 52.0$ 5.1x 16.2x
Marketing Technology
Criteo SA Online Targeting/Optimization IPO 2,830.1 458.9 10.5 6.2x NM
Traditional Media
SFX Entertainment Inc. Entertainment Media IPO 1,104.5 62.0 (39.2) 17.8x NM
Technology & Communications
CommScope Holding Company Inc. Networking Equipment IPO 5,571.1 3,487.8 8.5 1.6x NM
Endurance International Group Holdings, Inc. Website Creation/Hosting IPO 2,631.9 451.4 50.0 5.8x NM
Software
Veeva Systems Inc. Healthcare Software IPO 2,399.1 168.0 64.8 14.3x 37.0x
Note: IPO multiples based final share price and TTM financials and pro forma balance sheets per latest Registration Fil ing
6 | M&A and Investment Summary October 2013
Securities in Registration($ in Millions)
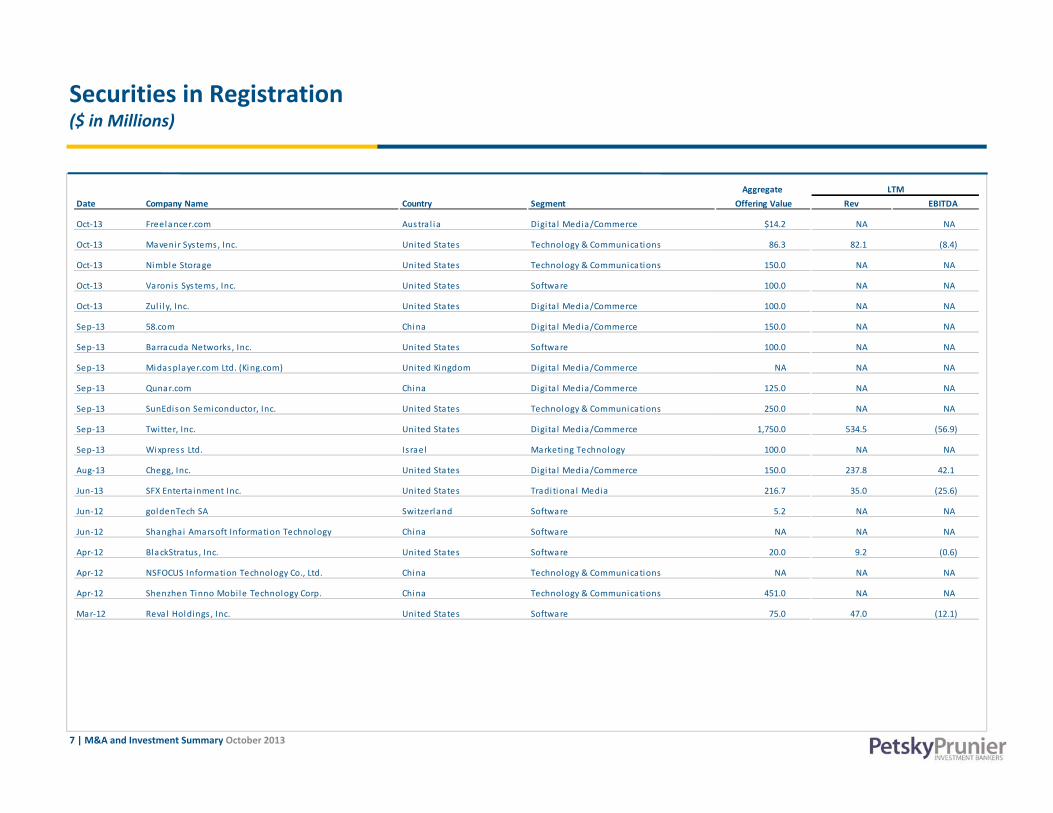
Aggregate Date Company Name Country Segment Offering Value Rev EBITDA
Oct‐13 Freelancer.com Austra l ia Digi ta l Media/Commerce $14.2 NA NA
Oct‐13 Mavenir Systems, Inc. United States Technology & Communications 86.3 82.1 (8.4)
LTM
Oct‐13 Nimble Storage United States Technology & Communications 150.0 NA NA
Oct‐13 Varonis Sys tems, Inc. United States Software 100.0 NA NA
Oct‐13 Zul i l y, Inc. United States Digi ta l Media/Commerce 100.0 NA NA
Sep‐13 58.com China Digita l Media/Commerce 150.0 NA NA
Sep‐13 Barracuda Networks , Inc. United States Software 100.0 NA NA
Sep‐13 Midasplayer.com Ltd. (King.com) United Kingdom Digita l Media/Commerce NA NA NA
Sep‐13 Qunar.com China Digita l Media/Commerce 125.0 NA NA
Sep‐13 SunEdison Semiconductor, Inc. United States Technology & Communications 250.0 NA NA
Sep‐13 Twitter, Inc. United States Digi ta l Media/Commerce 1,750.0 534.5 (56.9)
Sep‐13 Wixpress Ltd. Is rael Marketing Technology 100.0 NA NA
Aug‐13 Chegg, Inc. United States Digi ta l Media/Commerce 150.0 237.8 42.1
Jun‐13 SFX Enterta inment Inc. United States Tradi tional Media 216.7 35.0 (25.6)
Jun‐12 goldenTech SA Switzerland Software 5.2 NA NA
Jun‐12 Shanghai Amarsoft Information Technology China Software NA NA NA
Apr‐12 BlackStratus , Inc. United States Software 20.0 9.2 (0.6)
Apr‐12 NSFOCUS Information Technology Co., Ltd. China Technology & Communications NA NA NA
Apr‐12 Shenzhen Tinno Mobi le Technology Corp. China Technology & Communications 451.0 NA NA
Mar‐12 Reva l Holdings , Inc. United States Software 75.0 47.0 (12.1)
7 | M&A and Investment Summary October 2013
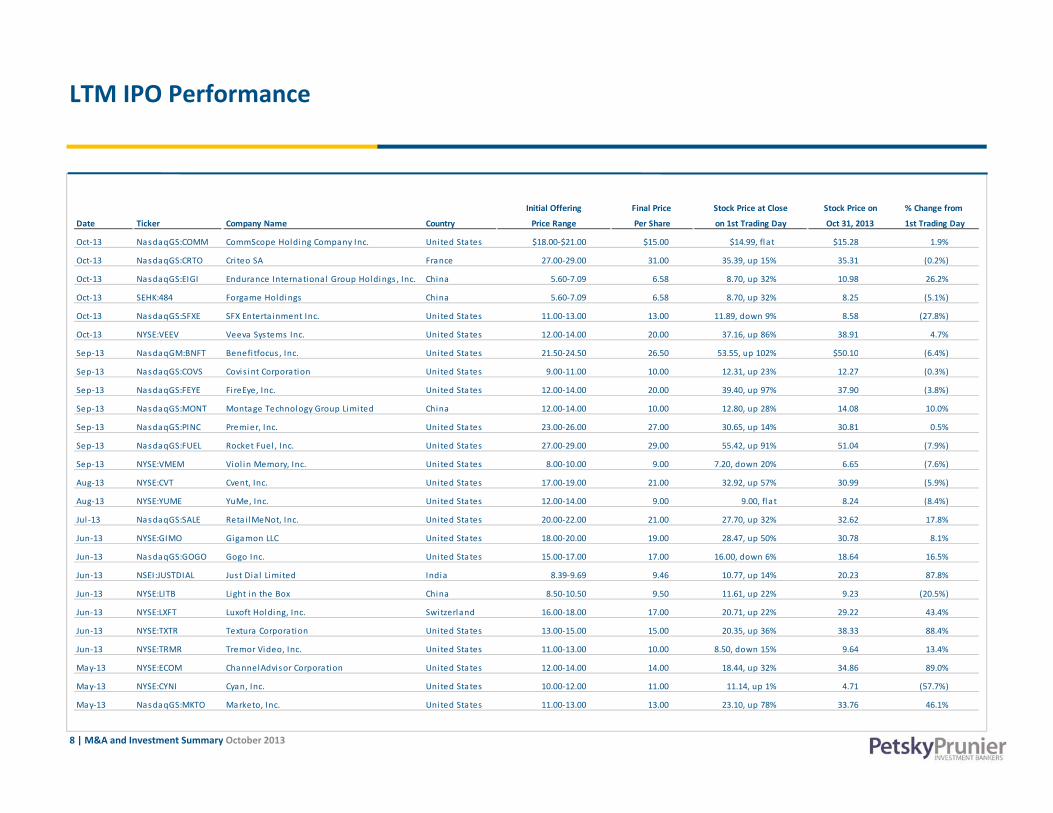
LTM IPO Performance
Initial Offering Final Price Stock Price at Close Stock Price on % Change from
Date Ticker Company Name Country Price Range Per Share on 1st Trading Day Oct 31, 2013 1st Trading Day
Oct‐13 NasdaqGS:COMM CommScope Holding Company Inc. Uni ted States $18.00‐$21.00 $15.00 $14.99, fla t $15.28 1.9%
LTM IPO Performance
Oct‐13 NasdaqGS:CRTO Cri teo SA France 27.00‐29.00 31.00 35.39, up 15% 35.31 (0.2%)
Oct‐13 NasdaqGS:EIGI Endurance International Group Holdings , Inc. China 5.60‐7.09 6.58 8.70, up 32% 10.98 26.2%
Oct‐13 SEHK:484 Forgame Holdings China 5.60‐7.09 6.58 8.70, up 32% 8.25 (5.1%)
Oct‐13 NasdaqGS:SFXE SFX Enterta inment Inc. Uni ted States 11.00‐13.00 13.00 11.89, down 9% 8.58 (27.8%)
Oct‐13 NYSE:VEEV Veeva Systems Inc. Uni ted States 12.00‐14.00 20.00 37.16, up 86% 38.91 4.7%
Sep‐13 NasdaqGM:BNFT Benefitfocus , Inc. Uni ted States 21.50‐24.50 26.50 53.55, up 102% $50.10 (6.4%)Sep 13 NasdaqGM:BNFT Benefitfocus , Inc. Uni ted States 21.50 24.50 26.50 53.55, up 102% $50.10 (6.4%)
Sep‐13 NasdaqGS:COVS Covis int Corporation United States 9.00‐11.00 10.00 12.31, up 23% 12.27 (0.3%)
Sep‐13 NasdaqGS:FEYE Fi reEye, Inc. Uni ted States 12.00‐14.00 20.00 39.40, up 97% 37.90 (3.8%)
Sep‐13 NasdaqGS:MONT Montage Technology Group Limited China 12.00‐14.00 10.00 12.80, up 28% 14.08 10.0%
Sep‐13 NasdaqGS:PINC Premier, Inc. Uni ted States 23.00‐26.00 27.00 30.65, up 14% 30.81 0.5%
Sep‐13 NasdaqGS:FUEL Rocket Fuel , Inc. Uni ted States 27.00‐29.00 29.00 55.42, up 91% 51.04 (7.9%)
Sep‐13 NYSE:VMEM Viol in Memory, Inc. Uni ted States 8.00‐10.00 9.00 7.20, down 20% 6.65 (7.6%)
Aug‐13 NYSE:CVT Cvent, Inc. Uni ted States 17.00‐19.00 21.00 32.92, up 57% 30.99 (5.9%)
Aug‐13 NYSE:YUME YuMe, Inc. Uni ted States 12.00‐14.00 9.00 9.00, fla t 8.24 (8.4%)
Jul ‐13 NasdaqGS:SALE Reta i lMeNot, Inc. Uni ted States 20.00‐22.00 21.00 27.70, up 32% 32.62 17.8%
Jun‐13 NYSE:GIMO Gigamon LLC United States 18.00‐20.00 19.00 28.47, up 50% 30.78 8.1%
Jun‐13 NasdaqGS:GOGO Gogo Inc. Uni ted States 15.00‐17.00 17.00 16.00, down 6% 18.64 16.5%q g ,
Jun‐13 NSEI:JUSTDIAL Just Dia l Limited India 8.39‐9.69 9.46 10.77, up 14% 20.23 87.8%
Jun‐13 NYSE:LITB Light in the Box China 8.50‐10.50 9.50 11.61, up 22% 9.23 (20.5%)
Jun‐13 NYSE:LXFT Luxoft Holding, Inc. Switzerland 16.00‐18.00 17.00 20.71, up 22% 29.22 43.4%
Jun‐13 NYSE:TXTR Textura Corporation United States 13.00‐15.00 15.00 20.35, up 36% 38.33 88.4%
Jun‐13 NYSE:TRMR Tremor Video, Inc. Uni ted States 11.00‐13.00 10.00 8.50, down 15% 9.64 13.4%
8 | M&A and Investment Summary October 2013
May‐13 NYSE:ECOM ChannelAdvisor Corporation United States 12.00‐14.00 14.00 18.44, up 32% 34.86 89.0%
May‐13 NYSE:CYNI Cyan, Inc. Uni ted States 10.00‐12.00 11.00 11.14, up 1% 4.71 (57.7%)
May‐13 NasdaqGS:MKTO Marketo, Inc. Uni ted States 11.00‐13.00 13.00 23.10, up 78% 33.76 46.1%
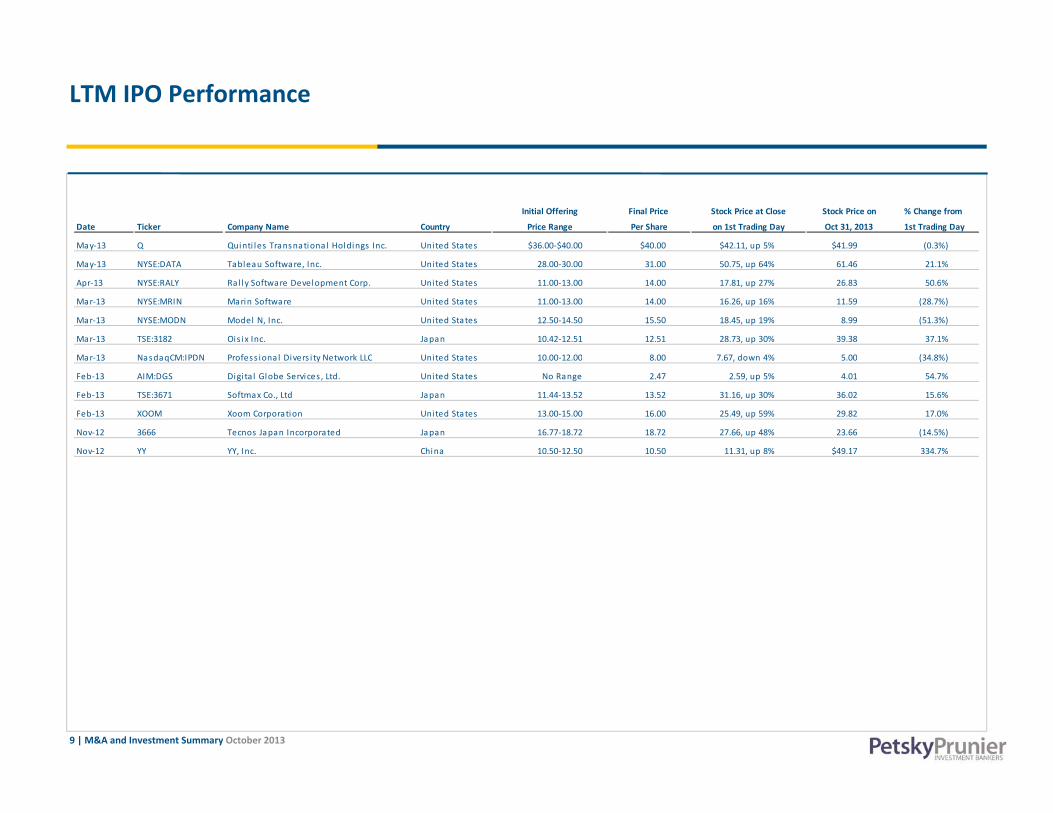
LTM IPO Performance
Initial Offering Final Price Stock Price at Close Stock Price on % Change from
Date Ticker Company Name Country Price Range Per Share on 1st Trading Day Oct 31, 2013 1st Trading Day
May‐13 Q Quinti les Transnationa l Holdings Inc. United States $36.00‐$40.00 $40.00 $42.11, up 5% $41.99 (0.3%)
LTM IPO Performance
May‐13 NYSE:DATA Tableau Software, Inc. United States 28.00‐30.00 31.00 50.75, up 64% 61.46 21.1%
Apr‐13 NYSE:RALY Ral ly Software Development Corp. United States 11.00‐13.00 14.00 17.81, up 27% 26.83 50.6%
Mar‐13 NYSE:MRIN Marin Software United States 11.00‐13.00 14.00 16.26, up 16% 11.59 (28.7%)
Mar‐13 NYSE:MODN Model N, Inc. United States 12.50‐14.50 15.50 18.45, up 19% 8.99 (51.3%)
Mar‐13 TSE:3182 Ois ix Inc. Japan 10.42‐12.51 12.51 28.73, up 30% 39.38 37.1%
M 13 N d CM IPDN P f i l Di i t N t k LLC U it d St t 10 00 12 00 8 00 7 67 d 4% 5 00 (34 8%)Mar‐13 NasdaqCM:IPDN Profess iona l Divers i ty Network LLC United States 10.00‐12.00 8.00 7.67, down 4% 5.00 (34.8%)
Feb‐13 AIM:DGS Digi ta l Globe Services , Ltd. United States No Range 2.47 2.59, up 5% 4.01 54.7%
Feb‐13 TSE:3671 Softmax Co., Ltd Japan 11.44‐13.52 13.52 31.16, up 30% 36.02 15.6%
Feb‐13 XOOM Xoom Corporation United States 13.00‐15.00 16.00 25.49, up 59% 29.82 17.0%
Nov‐12 3666 Tecnos Japan Incorporated Japan 16.77‐18.72 18.72 27.66, up 48% 23.66 (14.5%)
Nov‐12 YY YY, Inc. China 10.50‐12.50 10.50 11.31, up 8% $49.17 334.7%
9 | M&A and Investment Summary October 2013

Digital Media/Commerce
Of the total $2.9 billion in value reported in the Digital Media/Commerce segment, $1.8 billion in strategic and buyout exits were reported, while another $1.1 billion of investments were made
C d M bil C t t/A th t ti b t ll t ith 16 d 15 t ti d eCommerce and Mobile Content/Apps were the most active subsegment across all segments, with 16 and 15 transactions announced, respectively, worth a combined total of $711 million
Select acquisitions:
• Softbank’s $1.5 billion acquisition of Finland‐based online gaming company Supercell
• Grupa o2’s $124 million acquisition of Wirtualna Polska, a Poland‐based Web search portal
Select investments:
• Fidelity Investments’ $225 million investment in social scrapbooking site Pinterest
• The $206 million investment in retail shipping service ShopRunner from Alibaba Group, valuing the company at $600 million
# % $MM % # $MM # $MM # $MM
BUYER/INVESTOR BREAKDOWN
Transactions Reported Value Strategic Buyout Venture/Growth Capital
DIGITAL MEDIA/COMMERCE TRANSACTIONS BY SEGMENT
$ $ $ $
eCommerce 16 27% $568.4 20% 3 $117.4 0 ‐ 13 $451.0
Mobile Content/Apps 15 25% 142.8 5% 6 70.0 0 ‐ 9 72.8
Social Media/Apps 10 17% 327.8 11% 1 ‐ 0 ‐ 9 327.8
Niche Content 8 14% 89.3 3% 2 ‐ 0 ‐ 6 89.3
Gaming 5 8% 1,599.8 55% 4 1,534.8 0 ‐ 1 65.0
Classifieds/Auctions/P to P 4 7% 62 0 2% 0 0 4 62 0
10 | M&A and Investment Summary October 2013
Classifieds/Auctions/P‐to‐P 4 7% 62.0 2% 0 ‐ 0 ‐ 4 62.0
Web Search/Portals 1 2% 123.7 4% 1 123.7 0 ‐ 0 ‐
Total 59 100% 2,913.8 100% 17 1,845.9 0 0.0 42 1,067.9
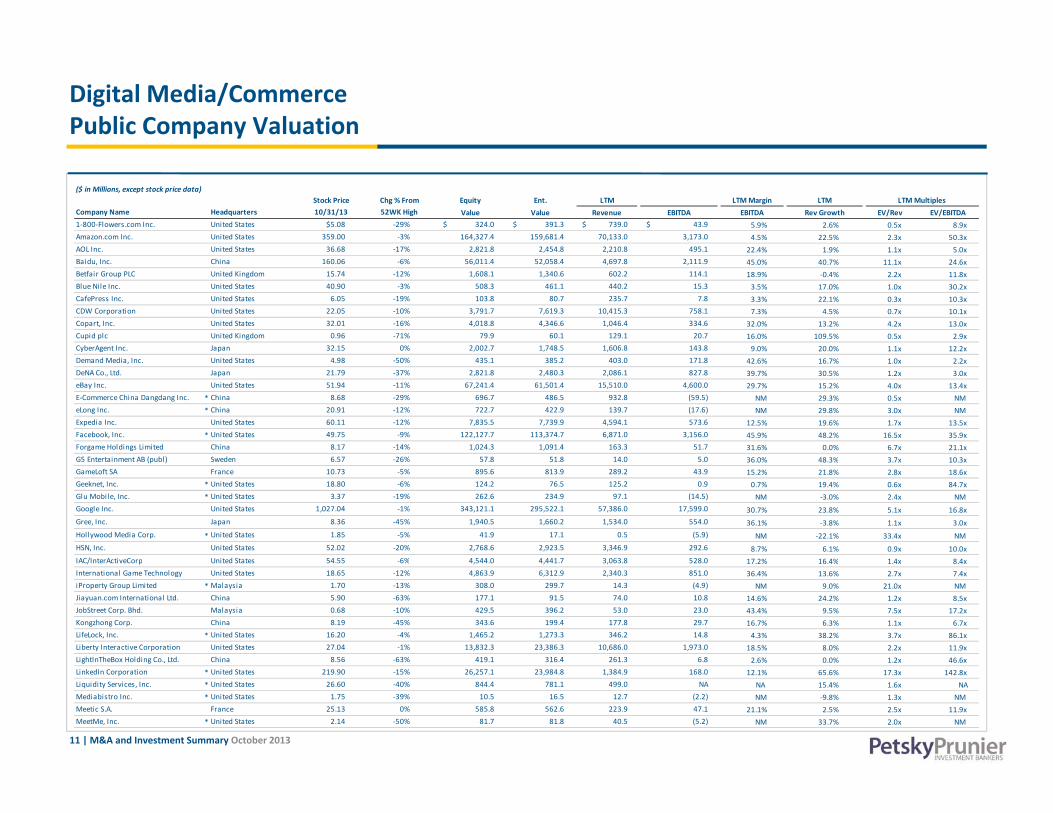
Digital Media/CommercePublic Company Valuation
($ in Millions, except stock price data)Stock Price Chg % From Equity Ent. LTM LTM Margin LTM LTM Multiples
Company Name Headquarters 10/31/13 52WK High Value Value Revenue EBITDA EBITDA Rev Growth EV/Rev EV/EBITDA1‐800‐Flowers.com Inc. United States $5.08 ‐29% $ 324.0 $ 391.3 $ 739.0 $ 43.9 5.9% 2.6% 0.5x 8.9xAmazon.com Inc. United States 359.00 ‐3% 164,327.4 159,681.4 70,133.0 3,173.0 4.5% 22.5% 2.3x 50.3xAOL Inc. United States 36.68 ‐17% 2,821.8 2,454.8 2,210.8 495.1 22.4% 1.9% 1.1x 5.0xBaidu, Inc. China 160.06 ‐6% 56,011.4 52,058.4 4,697.8 2,111.9 45.0% 40.7% 11.1x 24.6xBetfair Group PLC United Kingdom 15.74 ‐12% 1,608.1 1,340.6 602.2 114.1 18.9% ‐0.4% 2.2x 11.8xBlue Nile Inc. United States 40.90 ‐3% 508.3 461.1 440.2 15.3 3.5% 17.0% 1.0x 30.2xCafePress Inc. United States 6.05 ‐19% 103.8 80.7 235.7 7.8 3.3% 22.1% 0.3x 10.3xCDW Corporation United States 22.05 ‐10% 3,791.7 7,619.3 10,415.3 758.1 7.3% 4.5% 0.7x 10.1xCopart, Inc. United States 32.01 ‐16% 4,018.8 4,346.6 1,046.4 334.6 32.0% 13.2% 4.2x 13.0xCupid plc United Kingdom 0.96 ‐71% 79.9 60.1 129.1 20.7 16.0% 109.5% 0.5x 2.9xCyberAgent Inc. Japan 32.15 0% 2,002.7 1,748.5 1,606.8 143.8 9.0% 20.0% 1.1x 12.2xDemand Media, Inc. United States 4.98 ‐50% 435.1 385.2 403.0 171.8 42.6% 16.7% 1.0x 2.2xDeNA Co., Ltd. Japan 21.79 ‐37% 2,821.8 2,480.3 2,086.1 827.8 39.7% 30.5% 1.2x 3.0xeBay Inc. United States 51.94 ‐11% 67,241.4 61,501.4 15,510.0 4,600.0 29.7% 15.2% 4.0x 13.4xE‐Commerce China Dangdang Inc. * China 8.68 ‐29% 696.7 486.5 932.8 (59.5) NM 29.3% 0.5x NM eLong Inc. * China 20.91 ‐12% 722.7 422.9 139.7 (17.6) NM 29.8% 3.0x NM Expedia Inc. United States 60.11 ‐12% 7,835.5 7,739.9 4,594.1 573.6 12.5% 19.6% 1.7x 13.5xFacebook, Inc. * United States 49.75 ‐9% 122,127.7 113,374.7 6,871.0 3,156.0 45.9% 48.2% 16.5x 35.9xForgame Holdings Limited China 8.17 ‐14% 1,024.3 1,091.4 163.3 51.7 31.6% 0.0% 6.7x 21.1xG5 E t t i t AB ( bl) S d 6 57 26% 57 8 51 8 14 0 5 0 36 0% 48 3% 3 7 10 3G5 Entertainment AB (publ) Sweden 6.57 ‐26% 57.8 51.8 14.0 5.0 36.0% 48.3% 3.7x 10.3xGameLoft SA France 10.73 ‐5% 895.6 813.9 289.2 43.9 15.2% 21.8% 2.8x 18.6xGeeknet, Inc. * United States 18.80 ‐6% 124.2 76.5 125.2 0.9 0.7% 19.4% 0.6x 84.7xGlu Mobile, Inc. * United States 3.37 ‐19% 262.6 234.9 97.1 (14.5) NM ‐3.0% 2.4x NM Google Inc. United States 1,027.04 ‐1% 343,121.1 295,522.1 57,386.0 17,599.0 30.7% 23.8% 5.1x 16.8xGree, Inc. Japan 8.36 ‐45% 1,940.5 1,660.2 1,534.0 554.0 36.1% ‐3.8% 1.1x 3.0xHollywood Media Corp. * United States 1.85 ‐5% 41.9 17.1 0.5 (5.9) NM ‐22.1% 33.4x NM HSN, Inc. United States 52.02 ‐20% 2,768.6 2,923.5 3,346.9 292.6 8.7% 6.1% 0.9x 10.0xIAC/InterActiveCorp United States 54 55 6% 4 544 0 4 441 7 3 063 8 528 0 17 2% 16 4% 1 4x 8 4xIAC/InterActiveCorp United States 54.55 ‐6% 4,544.0 4,441.7 3,063.8 528.0 17.2% 16.4% 1.4x 8.4xInternational Game Technology United States 18.65 ‐12% 4,863.9 6,312.9 2,340.3 851.0 36.4% 13.6% 2.7x 7.4xiProperty Group Limited * Malaysia 1.70 ‐13% 308.0 299.7 14.3 (4.9) NM 9.0% 21.0x NM Jiayuan.com International Ltd. China 5.90 ‐63% 177.1 91.5 74.0 10.8 14.6% 24.2% 1.2x 8.5xJobStreet Corp. Bhd. Malaysia 0.68 ‐10% 429.5 396.2 53.0 23.0 43.4% 9.5% 7.5x 17.2xKongzhong Corp. China 8.19 ‐45% 343.6 199.4 177.8 29.7 16.7% 6.3% 1.1x 6.7xLifeLock, Inc. * United States 16.20 ‐4% 1,465.2 1,273.3 346.2 14.8 4.3% 38.2% 3.7x 86.1xLiberty Interactive Corporation United States 27.04 ‐1% 13,832.3 23,386.3 10,686.0 1,973.0 18.5% 8.0% 2.2x 11.9xLightInTheBox Holding Co., Ltd. China 8.56 ‐63% 419.1 316.4 261.3 6.8 2.6% 0.0% 1.2x 46.6x
11 | M&A and Investment Summary October 2013
g g ,LinkedIn Corporation * United States 219.90 ‐15% 26,257.1 23,984.8 1,384.9 168.0 12.1% 65.6% 17.3x 142.8xLiquidity Services, Inc. * United States 26.60 ‐40% 844.4 781.1 499.0 NA NA 15.4% 1.6x NA Mediabistro Inc. * United States 1.75 ‐39% 10.5 16.5 12.7 (2.2) NM ‐9.8% 1.3x NM Meetic S.A. France 25.13 0% 585.8 562.6 223.9 47.1 21.1% 2.5% 2.5x 11.9xMeetMe, Inc. * United States 2.14 ‐50% 81.7 81.8 40.5 (5.2) NM 33.7% 2.0x NM
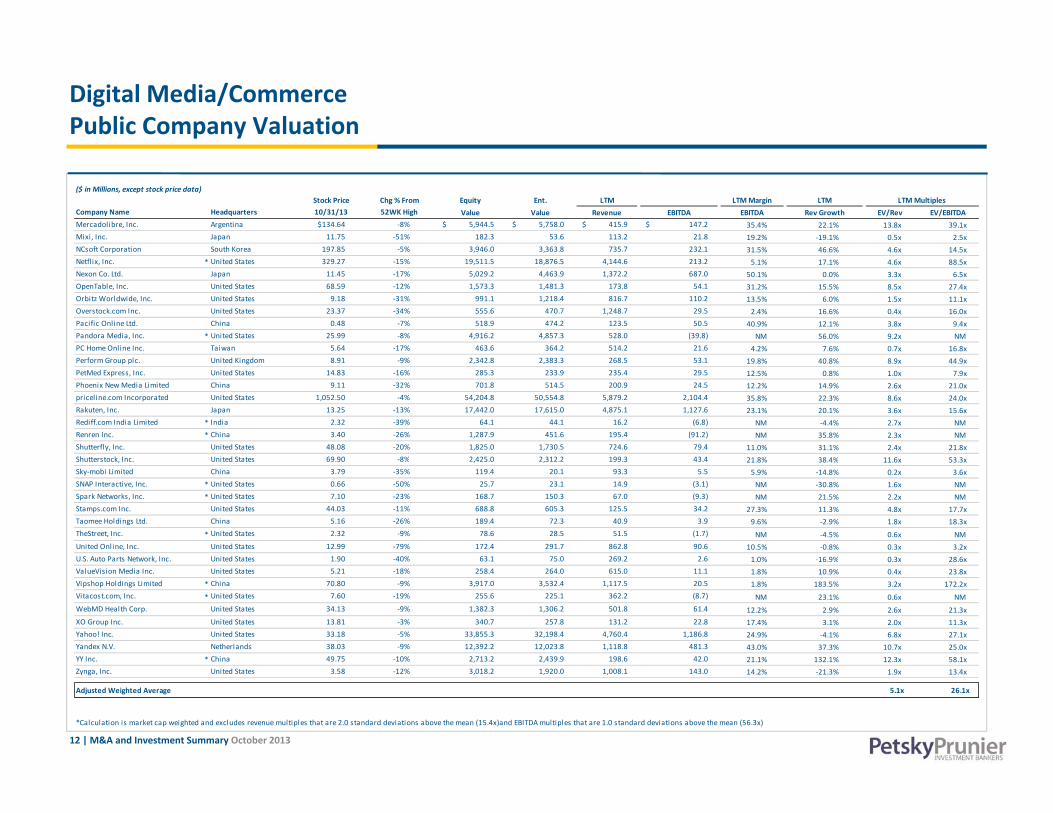
Digital Media/CommercePublic Company Valuation
($ in Millions, except stock price data)Stock Price Chg % From Equity Ent. LTM LTM Margin LTM LTM Multiples
Company Name Headquarters 10/31/13 52WK High Value Value Revenue EBITDA EBITDA Rev Growth EV/Rev EV/EBITDAMercadolibre, Inc. Argentina $134.64 ‐8% $ 5,944.5 $ 5,758.0 $ 415.9 $ 147.2 35.4% 22.1% 13.8x 39.1xMixi, Inc. Japan 11.75 ‐51% 182.3 53.6 113.2 21.8 19.2% ‐19.1% 0.5x 2.5xNCsoft Corporation South Korea 197.85 ‐5% 3,946.0 3,363.8 735.7 232.1 31.5% 46.6% 4.6x 14.5xpNetflix, Inc. * United States 329.27 ‐15% 19,511.5 18,876.5 4,144.6 213.2 5.1% 17.1% 4.6x 88.5xNexon Co. Ltd. Japan 11.45 ‐17% 5,029.2 4,463.9 1,372.2 687.0 50.1% 0.0% 3.3x 6.5xOpenTable, Inc. United States 68.59 ‐12% 1,573.3 1,481.3 173.8 54.1 31.2% 15.5% 8.5x 27.4xOrbitz Worldwide, Inc. United States 9.18 ‐31% 991.1 1,218.4 816.7 110.2 13.5% 6.0% 1.5x 11.1xOverstock.com Inc. United States 23.37 ‐34% 555.6 470.7 1,248.7 29.5 2.4% 16.6% 0.4x 16.0xPacific Online Ltd. China 0.48 ‐7% 518.9 474.2 123.5 50.5 40.9% 12.1% 3.8x 9.4xPandora Media, Inc. * United States 25.99 ‐8% 4,916.2 4,857.3 528.0 (39.8) NM 56.0% 9.2x NM PC Home Online Inc. Taiwan 5.64 ‐17% 463.6 364.2 514.2 21.6 4.2% 7.6% 0.7x 16.8xPerform Group plc. United Kingdom 8.91 ‐9% 2,342.8 2,383.3 268.5 53.1 19.8% 40.8% 8.9x 44.9xPetMed Express, Inc. United States 14.83 ‐16% 285.3 233.9 235.4 29.5 12.5% 0.8% 1.0x 7.9xPhoenix New Media Limited China 9.11 ‐32% 701.8 514.5 200.9 24.5 12.2% 14.9% 2.6x 21.0xpriceline.com Incorporated United States 1,052.50 ‐4% 54,204.8 50,554.8 5,879.2 2,104.4 35.8% 22.3% 8.6x 24.0xRakuten, Inc. Japan 13.25 ‐13% 17,442.0 17,615.0 4,875.1 1,127.6 23.1% 20.1% 3.6x 15.6xRediff.com India Limited * India 2.32 ‐39% 64.1 44.1 16.2 (6.8) NM ‐4.4% 2.7x NM Renren Inc. * China 3.40 ‐26% 1,287.9 451.6 195.4 (91.2) NM 35.8% 2.3x NM Shutterfly, Inc. United States 48.08 ‐20% 1,825.0 1,730.5 724.6 79.4 11.0% 31.1% 2.4x 21.8xShutterstock Inc United States 69 90 8% 2 425 0 2 312 2 199 3 43 4 21 8% 38 4% 11 6 53 3Shutterstock, Inc. United States 69.90 ‐8% 2,425.0 2,312.2 199.3 43.4 21.8% 38.4% 11.6x 53.3xSky‐mobi Limited China 3.79 ‐35% 119.4 20.1 93.3 5.5 5.9% ‐14.8% 0.2x 3.6xSNAP Interactive, Inc. * United States 0.66 ‐50% 25.7 23.1 14.9 (3.1) NM ‐30.8% 1.6x NM Spark Networks, Inc. * United States 7.10 ‐23% 168.7 150.3 67.0 (9.3) NM 21.5% 2.2x NM Stamps.com Inc. United States 44.03 ‐11% 688.8 605.3 125.5 34.2 27.3% 11.3% 4.8x 17.7xTaomee Holdings Ltd. China 5.16 ‐26% 189.4 72.3 40.9 3.9 9.6% ‐2.9% 1.8x 18.3xTheStreet, Inc. * United States 2.32 ‐9% 78.6 28.5 51.5 (1.7) NM ‐4.5% 0.6x NM United Online, Inc. United States 12.99 ‐79% 172.4 291.7 862.8 90.6 10.5% ‐0.8% 0.3x 3.2xU.S. Auto Parts Network, Inc. United States 1.90 ‐40% 63.1 75.0 269.2 2.6 1 0% ‐16 9% 0 3x 28 6xU.S. Auto Parts Network, Inc. United States 1.90 40% 63.1 75.0 269.2 2.6 1.0% 16.9% 0.3x 28.6xValueVision Media Inc. United States 5.21 ‐18% 258.4 264.0 615.0 11.1 1.8% 10.9% 0.4x 23.8xVipshop Holdings Limited * China 70.80 ‐9% 3,917.0 3,532.4 1,117.5 20.5 1.8% 183.5% 3.2x 172.2xVitacost.com, Inc. * United States 7.60 ‐19% 255.6 225.1 362.2 (8.7) NM 23.1% 0.6x NM WebMD Health Corp. United States 34.13 ‐9% 1,382.3 1,306.2 501.8 61.4 12.2% 2.9% 2.6x 21.3xXO Group Inc. United States 13.81 ‐3% 340.7 257.8 131.2 22.8 17.4% 3.1% 2.0x 11.3xYahoo! Inc. United States 33.18 ‐5% 33,855.3 32,198.4 4,760.4 1,186.8 24.9% ‐4.1% 6.8x 27.1xYandex N.V. Netherlands 38.03 ‐9% 12,392.2 12,023.8 1,118.8 481.3 43.0% 37.3% 10.7x 25.0xYY Inc. * China 49.75 ‐10% 2,713.2 2,439.9 198.6 42.0 21.1% 132.1% 12.3x 58.1x
12 | M&A and Investment Summary October 2013
Zynga, Inc. United States 3.58 ‐12% 3,018.2 1,920.0 1,008.1 143.0 14.2% ‐21.3% 1.9x 13.4x
Adjusted Weighted Average 5.1x 26.1x
*Calculation is market cap weighted and excludes revenue multiples that are 2.0 standard deviations above the mean (15.4x)and EBITDA multiples that are 1.0 standard deviations above the mean (56.3x)

Digital Advertising
The highest value subsegment was Digital Video with two investments announced worth $24 million in aggregate value
Select acquisitions:
• Marchex’ divestiture of a number of assets, including its cost‐per‐click ad network formerly known as IndustryBrains, to Adiant
• BOLT solutions’ acquisition of Superior Access Solutions, an online insurance aggregator
Select investments:
$• Comcast Ventures’ $20 million investment in Israel‐based SundaySky, which offers custom video services to creates short videos used by enterprises to better engage customers
• The $16 million ClearVue Partners‐led investment in China‐based B5Msoft, an operator of a comparison shopping engine
DIGITAL ADVERTISING TRANSACTIONS BY SEGMENT BUYER/INVESTOR BREAKDOWN
# % $MM % # $MM # $MM # $MM
Digital Promotion/Coupon 3 19% $3.3 6% 2 ‐ 0 ‐ 1 $3.3
Vertical Search 3 19% 0.6 1% 2 0.6 0 ‐ 1 ‐
Comparison Shopping 2 13% 16.0 31% 1 ‐ 0 ‐ 1 16.0
Digital Video 2 13% 24 0 47% 0 0 2 24 0
/
Transactions Reported Value Strategic Buyout Venture/Growth Capital
Digital Video 2 13% 24.0 47% 0 ‐ 0 ‐ 2 24.0
Online Lead Generation 2 13% ‐ 0% 2 ‐ 0 ‐ 0 ‐
Other* 4 25% 7.0 14% 3 ‐ 0 ‐ 1 7.0
Total 16 100% 50.9 100% 10 0.6 0 0.0 6 50.3
*Other includes Ad Networks/Exchanges, Game Advertising, and Online Lead Generation
13 | M&A and Investment Summary October 2013
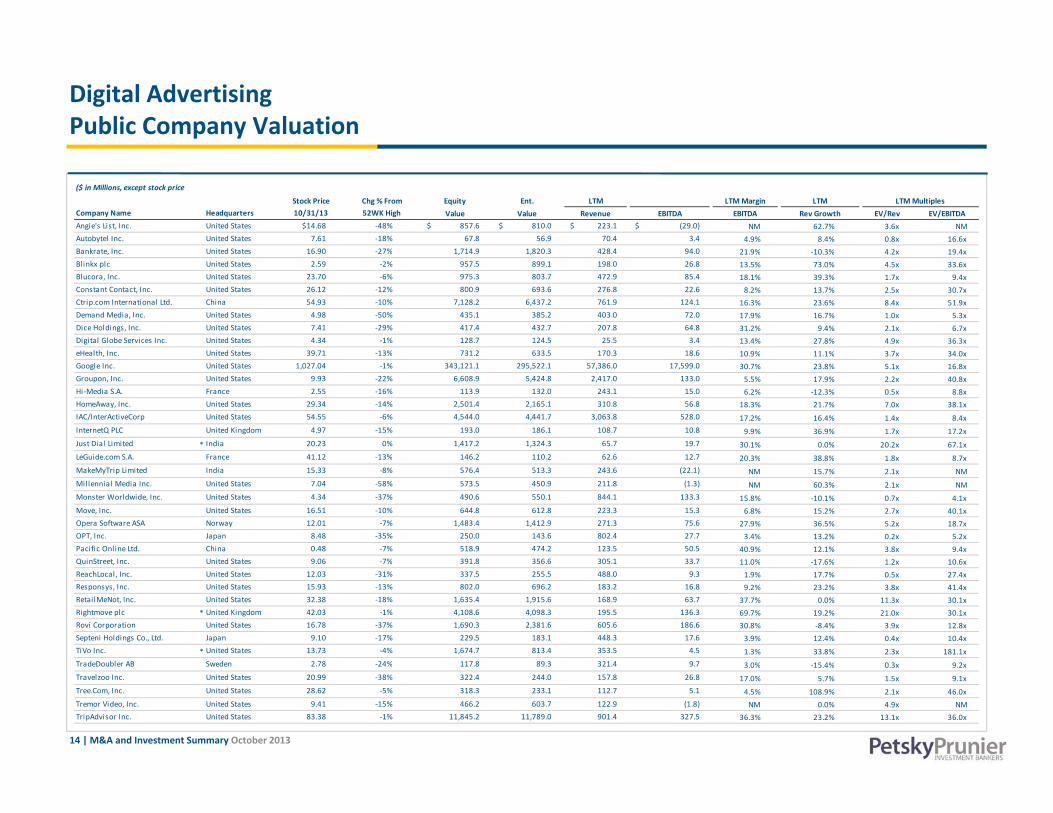
Digital AdvertisingPublic Company Valuation
($ in Millions, except stock price
Stock Price Chg % From Equity Ent. LTM LTM Margin LTM LTM Multiples Company Name Headquarters 10/31/13 52WK High Value Value Revenue EBITDA EBITDA Rev Growth EV/Rev EV/EBITDAAngie's List, Inc. United States $14.68 ‐48% $ 857.6 $ 810.0 $ 223.1 $ (29.0) NM 62.7% 3.6x NM Autobytel Inc. United States 7.61 ‐18% 67.8 56.9 70.4 3.4 4.9% 8.4% 0.8x 16.6xBankrate, Inc. United States 16.90 ‐27% 1,714.9 1,820.3 428.4 94.0 21 9% ‐10 3% 4 2x 19 4xBankrate, Inc. United States 16.90 27% 1,714.9 1,820.3 428.4 94.0 21.9% 10.3% 4.2x 19.4xBlinkx plc United States 2.59 ‐2% 957.5 899.1 198.0 26.8 13.5% 73.0% 4.5x 33.6xBlucora, Inc. United States 23.70 ‐6% 975.3 803.7 472.9 85.4 18.1% 39.3% 1.7x 9.4xConstant Contact, Inc. United States 26.12 ‐12% 800.9 693.6 276.8 22.6 8.2% 13.7% 2.5x 30.7xCtrip.com International Ltd. China 54.93 ‐10% 7,128.2 6,437.2 761.9 124.1 16.3% 23.6% 8.4x 51.9xDemand Media, Inc. United States 4.98 ‐50% 435.1 385.2 403.0 72.0 17.9% 16.7% 1.0x 5.3xDice Holdings, Inc. United States 7.41 ‐29% 417.4 432.7 207.8 64.8 31.2% 9.4% 2.1x 6.7xDigital Globe Services Inc. United States 4.34 ‐1% 128.7 124.5 25.5 3.4 13.4% 27.8% 4.9x 36.3xeHealth, Inc. United States 39.71 ‐13% 731.2 633.5 170.3 18.6 10.9% 11.1% 3.7x 34.0xeHealth, Inc. United States 39.71 13% 731.2 633.5 170.3 18.6 10.9% 11.1% 3.7x 34.0xGoogle Inc. United States 1,027.04 ‐1% 343,121.1 295,522.1 57,386.0 17,599.0 30.7% 23.8% 5.1x 16.8xGroupon, Inc. United States 9.93 ‐22% 6,608.9 5,424.8 2,417.0 133.0 5.5% 17.9% 2.2x 40.8xHi‐Media S.A. France 2.55 ‐16% 113.9 132.0 243.1 15.0 6.2% ‐12.3% 0.5x 8.8xHomeAway, Inc. United States 29.34 ‐14% 2,501.4 2,165.1 310.8 56.8 18.3% 21.7% 7.0x 38.1xIAC/InterActiveCorp United States 54.55 ‐6% 4,544.0 4,441.7 3,063.8 528.0 17.2% 16.4% 1.4x 8.4xInternetQ PLC United Kingdom 4.97 ‐15% 193.0 186.1 108.7 10.8 9.9% 36.9% 1.7x 17.2xJust Dial Limited * India 20.23 0% 1,417.2 1,324.3 65.7 19.7 30.1% 0.0% 20.2x 67.1xLeGuide com S A France 41 12 ‐13% 146 2 110 2 62 6 12 7 20 3% 38 8% 1 8x 8 7xLeGuide.com S.A. France 41.12 13% 146.2 110.2 62.6 12.7 20.3% 38.8% 1.8x 8.7xMakeMyTrip Limited India 15.33 ‐8% 576.4 513.3 243.6 (22.1) NM 15.7% 2.1x NM Millennial Media Inc. United States 7.04 ‐58% 573.5 450.9 211.8 (1.3) NM 60.3% 2.1x NM Monster Worldwide, Inc. United States 4.34 ‐37% 490.6 550.1 844.1 133.3 15.8% ‐10.1% 0.7x 4.1xMove, Inc. United States 16.51 ‐10% 644.8 612.8 223.3 15.3 6.8% 15.2% 2.7x 40.1xOpera Software ASA Norway 12.01 ‐7% 1,483.4 1,412.9 271.3 75.6 27.9% 36.5% 5.2x 18.7xOPT, Inc. Japan 8.48 ‐35% 250.0 143.6 802.4 27.7 3.4% 13.2% 0.2x 5.2xPacific Online Ltd. China 0.48 ‐7% 518.9 474.2 123.5 50.5 40.9% 12.1% 3.8x 9.4xQuinStreet Inc United States 9 06 7% 391 8 356 6 305 1 33 7 11 0% 17 6% 1 2 10 6QuinStreet, Inc. United States 9.06 ‐7% 391.8 356.6 305.1 33.7 11.0% ‐17.6% 1.2x 10.6xReachLocal, Inc. United States 12.03 ‐31% 337.5 255.5 488.0 9.3 1.9% 17.7% 0.5x 27.4xResponsys, Inc. United States 15.93 ‐13% 802.0 696.2 183.2 16.8 9.2% 23.2% 3.8x 41.4xRetailMeNot, Inc. United States 32.38 ‐18% 1,635.4 1,915.6 168.9 63.7 37.7% 0.0% 11.3x 30.1xRightmove plc * United Kingdom 42.03 ‐1% 4,108.6 4,098.3 195.5 136.3 69.7% 19.2% 21.0x 30.1xRovi Corporation United States 16.78 ‐37% 1,690.3 2,381.6 605.6 186.6 30.8% ‐8.4% 3.9x 12.8xSepteni Holdings Co., Ltd. Japan 9.10 ‐17% 229.5 183.1 448.3 17.6 3.9% 12.4% 0.4x 10.4xTiVo Inc. * United States 13.73 ‐4% 1,674.7 813.4 353.5 4.5 1.3% 33.8% 2.3x 181.1xTradeDoubler AB Sweden 2 78 24% 117 8 89 3 321 4 9 7 3 0% 15 4% 0 3 9 2
14 | M&A and Investment Summary October 2013
TradeDoubler AB Sweden 2.78 ‐24% 117.8 89.3 321.4 9.7 3.0% ‐15.4% 0.3x 9.2xTravelzoo Inc. United States 20.99 ‐38% 322.4 244.0 157.8 26.8 17.0% 5.7% 1.5x 9.1xTree.Com, Inc. United States 28.62 ‐5% 318.3 233.1 112.7 5.1 4.5% 108.9% 2.1x 46.0xTremor Video, Inc. United States 9.41 ‐15% 466.2 603.7 122.9 (1.8) NM 0.0% 4.9x NM TripAdvisor Inc. United States 83.38 ‐1% 11,845.2 11,789.0 901.4 327.5 36.3% 23.2% 13.1x 36.0x

Digital AdvertisingPublic Company Valuation
($ in Millions, except stock price
Stock Price Chg % From Equity Ent. LTM LTM Margin LTM LTM Multiples Company Name Headquarters 10/31/13 52WK High Value Value Revenue EBITDA EBITDA Rev Growth EV/Rev EV/EBITDATrulia, Inc. United States $39.97 ‐24% $ 1,513.7 $ 1,478.3 $ 114.6 $ (2.5) NM 93.3% 12.9x NM ValueClick, Inc. United States 19.20 ‐40% 1,426.5 1,402.0 685.7 217.9 31.8% 13.6% 2.0x 6.4xVelti Plc Ireland 0.27 ‐96% 24.5 36.8 232.1 (136.5) NM ‐1 6% 0 2x NMVelti Plc Ireland 0.27 96% 24.5 36.8 232.1 (136.5) NM 1.6% 0.2x NM Vocus Inc. * United States 8.27 ‐55% 174.7 217.6 186.6 3.3 1.8% 21.0% 1.2x 65.6xVoltari Corporation United States 4.69 ‐51% 21.9 18.7 89.4 18.1 20.3% 61.7% 0.2x 1.0xWeb.com Group, Inc. United States 26.65 ‐21% 1,270.0 1,921.6 453.2 81.3 17.9% 47.2% 4.2x 23.6xYahoo! Inc. United States 33.18 ‐5% 33,855.3 32,198.4 4,760.4 1,186.8 24.9% ‐4.1% 6.8x 27.1xYelp, Inc. * United States 67.15 ‐11% 4,667.7 4,566.5 203.5 (0.7) NM 67.7% 22.4x NM Yandex N.V. Netherlands 38.03 ‐9% 12,392.2 12,023.8 1,118.8 481.3 43.0% 37.3% 10.7x 25.0xYouku Tudou Inc. China 27.09 ‐14% 4,492.9 3,951.1 392.0 9.7 2.5% 95.8% 10.1x NM YuMe, Inc. United States 8.11 ‐33% 259.2 312.5 132.4 7.9 6.0% 0.0% 2.4x 39.7xYuMe, Inc. United States 8.11 33% 259.2 312.5 132.4 7.9 6.0% 0.0% 2.4x 39.7xZil low, Inc. * United States 79.83 ‐22% 2,997.7 2,828.0 152.1 (2.4) NM 69.9% 18.6x NM
Adjusted Weighted Average 5.6x 19.5x
*Calculation is market cap weighted and excludes revenue multiples that are 2.0 standard deviations above the mean (16.3x)and EBITDA multiples that are 1.0 standard deviations above the mean (55.2x)
15 | M&A and Investment Summary October 2013
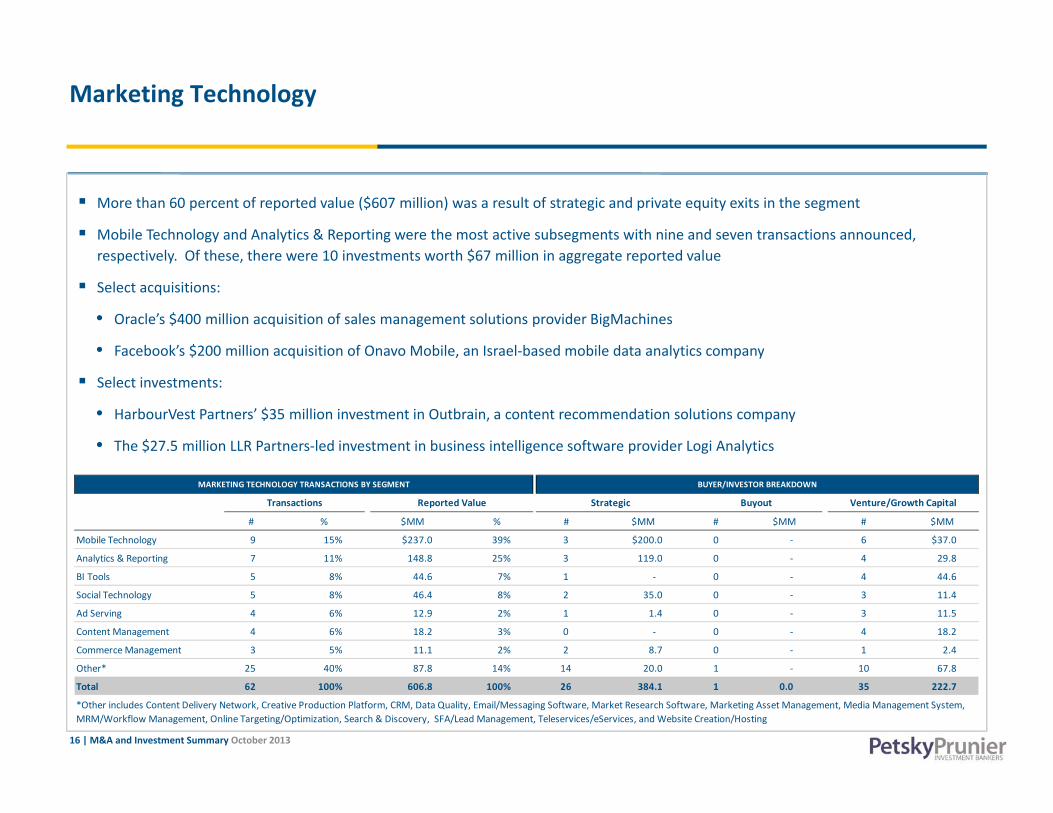
Marketing Technology
More than 60 percent of reported value ($607 million) was a result of strategic and private equity exits in the segment
Mobile Technology and Analytics & Reporting were the most active subsegments with nine and seven transactions announced, ti l Of th th 10 i t t th $67 illi i t t d lrespectively. Of these, there were 10 investments worth $67 million in aggregate reported value
Select acquisitions:
• Oracle’s $400 million acquisition of sales management solutions provider BigMachines
• Facebook’s $200 million acquisition of Onavo Mobile, an Israel‐based mobile data analytics companyFacebook s $200 million acquisition of Onavo Mobile, an Israel based mobile data analytics company
Select investments:
• HarbourVest Partners’ $35 million investment in Outbrain, a content recommendation solutions company
• The $27.5 million LLR Partners‐led investment in business intelligence software provider Logi Analytics
# % $MM % # $MM # $MM # $MM
Mobile Technology 9 15% $237.0 39% 3 $200.0 0 ‐ 6 $37.0
Analytics & Reporting 7 11% 148.8 25% 3 119.0 0 ‐ 4 29.8
MARKETING TECHNOLOGY TRANSACTIONS BY SEGMENT BUYER/INVESTOR BREAKDOWN
Transactions Reported Value Strategic Buyout Venture/Growth Capital
Analytics & Reporting 7 11% 148.8 25% 3 119.0 0 4 29.8
BI Tools 5 8% 44.6 7% 1 ‐ 0 ‐ 4 44.6
Social Technology 5 8% 46.4 8% 2 35.0 0 ‐ 3 11.4
Ad Serving 4 6% 12.9 2% 1 1.4 0 ‐ 3 11.5
Content Management 4 6% 18.2 3% 0 ‐ 0 ‐ 4 18.2
Commerce Management 3 5% 11.1 2% 2 8.7 0 ‐ 1 2.4
16 | M&A and Investment Summary October 2013
Other* 25 40% 87.8 14% 14 20.0 1 ‐ 10 67.8
Total 62 100% 606.8 100% 26 384.1 1 0.0 35 222.7
*Other includes Content Delivery Network, Creative Production Platform, CRM, Data Quality, Email/Messaging Software, Market Research Software, Marketing Asset Management, Media Management System, MRM/Workflow Management, Online Targeting/Optimization, Search & Discovery, SFA/Lead Management, Teleservices/eServices, and Website Creation/Hosting

Marketing TechnologyPublic Company Valuation
($ in Millions, except stock price data)Stock Price Chg % From Equity Ent. LTM LTM Margin LTM LTM Multiples
Company Name Headquarters 11/04/13 52WK High Value Value Revenue EBITDA EBITDA Rev Growth EV/Rev EV/EBITDAAccelrys Inc. United States $9.27 ‐7% $ 516.0 $ 412.6 $ 166.2 $ 11.0 6.6% 5.2% 2.5x 37.4xActuate Corporation United States 8.00 ‐3% 383.5 310.4 137.6 17.3 12.6% ‐1.9% 2.3x 17.9xAdobe Systems Inc. United States 55.39 0% 27,688.7 26,044.6 4,167.0 970.1 23.3% ‐5.3% 6.3x 26.8xBazaarvoice, Inc. United States 9.05 ‐29% 675.3 590.6 169.2 (46.4) NM 41.3% 3.5x NM Bitauto Holdings Limited China 24.49 ‐14% 985.3 900.0 196.8 34.8 17.7% 45.6% 4.6x 25.8xBlackbaud Inc. United States 35.87 ‐15% 1,642.7 1,799.8 489.0 98.7 20.2% 15.8% 3.7x 18.2xBrightcove, Inc. United States 15.07 ‐7% 426.8 392.7 104.5 (5.8) NM 27.2% 3.8x NM ChannelAdvisor Corporation United States 33.72 ‐18% 731.3 653.9 63.5 (5.2) NM 26.0% 10.3x NM ChinaCache International Holdings China 7.23 ‐32% 169.2 127.4 150.2 4.2 2.8% 28.2% 0.8x 30.5xConstant Contact, Inc. United States 27.20 ‐8% 834.0 726.8 276.8 23.4 8.5% 13.7% 2.6x 31.0xCovisint Corporation United States 12.02 ‐19% 437.6 436.5 98.1 (17.9) NM 20.6% 4.4x NM Criteo SA * France 34.46 ‐23% 1,905.6 1,860.6 458.9 10.5 2.3% 0.0% 4.1x 176.5xCvent, Inc. * United States 31.99 ‐31% 1,285.2 1,251.8 96.7 7.7 8.0% 0.0% 12.9x 162.2xDealertrack Technologies, Inc. United States 37.65 ‐13% 1,647.2 1,648.0 431.7 60.9 14.1% 15.1% 3.8x 27.0xDemandware, Inc. * United States 51.20 ‐2% 1,568.1 1,463.6 88.7 (12.0) NM 33.4% 16.5x NM Digital Generation, Inc. United States 12.99 ‐8% 362.6 701.4 385.7 103.1 26.7% 1.0% 1.8x 6.8xDigital River Inc. United States 17.77 ‐12% 608.6 323.6 402.3 20.2 5.0% 1.4% 0.8x 16.1xE2open, Inc. United States 22.57 ‐13% 598.3 585.6 70.2 (12.3) NM 0.0% 8.3x NM eBay Inc. United States 51.37 ‐11% 66,503.5 60,763.5 15,510.0 4,600.0 29.7% 15.2% 3.9x 13.2xEndurance International Group United States 10.97 ‐7% 1,384.8 2,501.8 451.4 53.7 11.9% 0.0% 5.5x 46.6xInformatica Corporation United States 38.71 ‐8% 4,189.9 3,569.2 906.9 169.4 18.7% 12.8% 3.9x 21.1xInfosystems S.A. Poland 0.92 ‐50% 3.8 3.4 2.6 0.7 25.1% 58.3% 1.3x 5.2xInteractive Intelligence Group Inc. United States 57.19 ‐15% 1,145.9 1,070.1 279.3 19.3 6.9% 28.5% 3.8x 55.4xIBM Corporation United States 180.27 ‐17% 195,746.9 221,784.9 101,356.0 25,939.0 25.6% ‐3.2% 2.2x 8.6xJive Software, Inc. United States 10.85 ‐41% 751.3 644.2 139.0 (54.1) NM 34.1% 4.6x NM LivePerson Inc. United States 9.29 ‐39% 502.0 427.0 167.9 12.5 7.5% 14.9% 2.5x 34.1xMarin Software Incorporated United States 11.40 ‐43% 370.2 255.5 67.9 (27.6) NM 0.0% 3.8x NM Marketo, Inc. United States 33.98 ‐15% 1,279.9 1,146.8 84.6 (36.2) NM 0.0% 13.6x NM Mercadolibre, Inc. Argentina 135.80 ‐7% 5,996.0 5,809.4 415.9 147.2 35.4% 22.1% 14.0x 39.5xMicroStrategy Inc. United States 126.56 ‐1% 1,430.3 1,086.3 594.9 34.4 5.8% 4.4% 1.8x 31.6xNetSuite Inc. * United States 99.15 ‐13% 7,404.9 7,201.4 384.5 (31.3) NM 33.5% 18.7x NM Nuance Communications, Inc. United States 15.99 ‐36% 4,960.6 6,440.6 1,851.8 345.0 18.6% 19.5% 3.5x 18.7xOpen Text Corporation Canada 74.38 ‐5% 4,395.0 4,461.9 1,361.6 415.1 30.5% 9.3% 3.3x 10.8xOpera Software ASA Norway 11.77 ‐9% 1,454.1 1,383.2 271.3 75.6 27.9% 36.5% 5.1x 18.3xOracle Corporation United States 33.71 ‐7% 153,631.9 139,062.9 37,371.0 16,259.0 43.5% 1.2% 3.7x 8.6xPitney Bowes Inc United States 21 88 1% 4 415 7 7 583 1 4 842 7 935 1 19 3% 2 2% 1 6 8 1
17 | M&A and Investment Summary October 2013
Pitney Bowes Inc. United States 21.88 ‐1% 4,415.7 7,583.1 4,842.7 935.1 19.3% 2.2% 1.6x 8.1xPROS Holdings, Inc. * United States 34.73 ‐6% 976.7 886.0 131.8 8.6 6.5% 23.6% 6.7x 103.2xPTC Inc. United States 27.97 ‐5% 3,341.9 3,353.0 1,274.0 252.9 19.9% 0.3% 2.6x 13.3xQlik Technologies, Inc. United States 26.21 ‐30% 2,326.2 2,091.1 446.1 4.3 1.0% 24.2% 4.7x NM RealNetworks Inc. United States 7.47 ‐17% 266.5 48.1 222.9 (20.7) NM ‐18.0% 0.2x NM
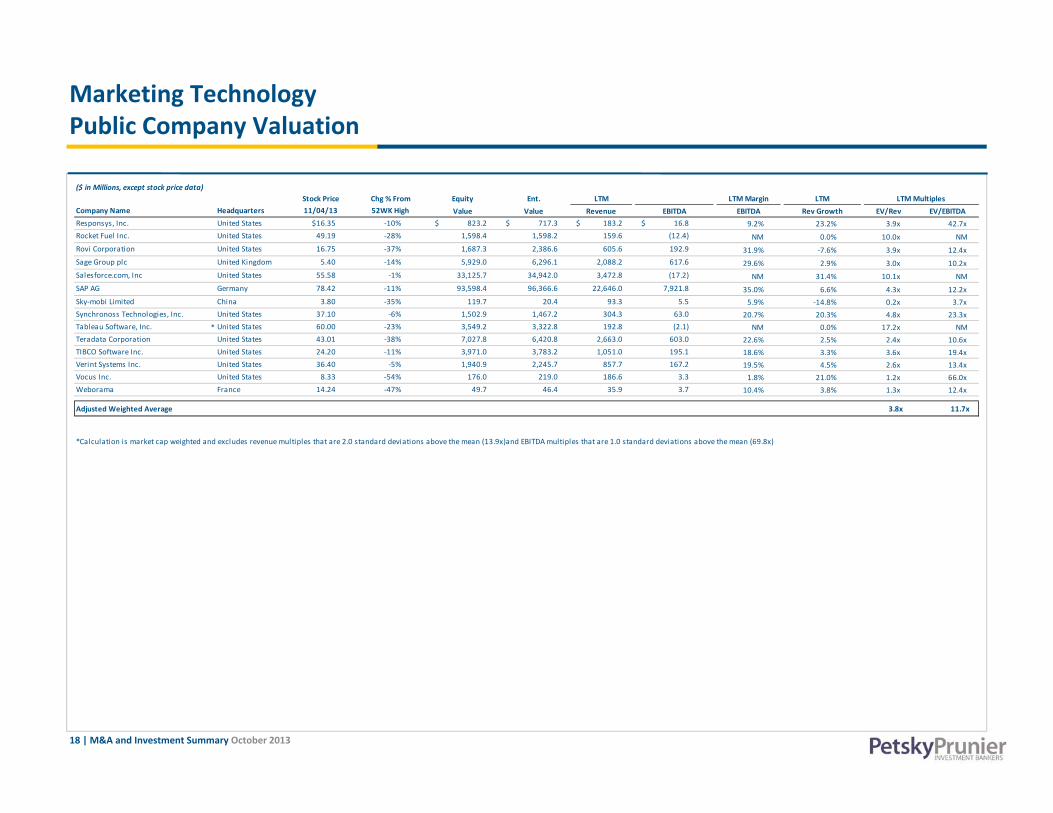
Marketing TechnologyPublic Company Valuation
($ in Millions, except stock price data)Stock Price Chg % From Equity Ent. LTM LTM Margin LTM LTM Multiples
Company Name Headquarters 11/04/13 52WK High Value Value Revenue EBITDA EBITDA Rev Growth EV/Rev EV/EBITDAResponsys, Inc. United States $16.35 ‐10% $ 823.2 $ 717.3 $ 183.2 $ 16.8 9.2% 23.2% 3.9x 42.7xRocket Fuel Inc. United States 49.19 ‐28% 1,598.4 1,598.2 159.6 (12.4) NM 0.0% 10.0x NM Rovi Corporation United States 16.75 ‐37% 1,687.3 2,386.6 605.6 192.9 31.9% ‐7.6% 3.9x 12.4xSage Group plc United Kingdom 5.40 ‐14% 5,929.0 6,296.1 2,088.2 617.6 29.6% 2.9% 3.0x 10.2xSalesforce.com, Inc United States 55.58 ‐1% 33,125.7 34,942.0 3,472.8 (17.2) NM 31.4% 10.1x NM SAP AG Germany 78.42 ‐11% 93,598.4 96,366.6 22,646.0 7,921.8 35.0% 6.6% 4.3x 12.2xSky‐mobi Limited China 3.80 ‐35% 119.7 20.4 93.3 5.5 5.9% ‐14.8% 0.2x 3.7xSynchronoss Technologies, Inc. United States 37.10 ‐6% 1,502.9 1,467.2 304.3 63.0 20.7% 20.3% 4.8x 23.3xTableau Software, Inc. * United States 60.00 ‐23% 3,549.2 3,322.8 192.8 (2.1) NM 0.0% 17.2x NM Teradata Corporation United States 43.01 ‐38% 7,027.8 6,420.8 2,663.0 603.0 22.6% 2.5% 2.4x 10.6xTIBCO Software Inc. United States 24.20 ‐11% 3,971.0 3,783.2 1,051.0 195.1 18.6% 3.3% 3.6x 19.4x, , ,Verint Systems Inc. United States 36.40 ‐5% 1,940.9 2,245.7 857.7 167.2 19.5% 4.5% 2.6x 13.4xVocus Inc. United States 8.33 ‐54% 176.0 219.0 186.6 3.3 1.8% 21.0% 1.2x 66.0xWeborama France 14.24 ‐47% 49.7 46.4 35.9 3.7 10.4% 3.8% 1.3x 12.4x
Adjusted Weighted Average 3.8x 11.7x
*Calculation is market cap weighted and excludes revenue multiples that are 2.0 standard deviations above the mean (13.9x)and EBITDA multiples that are 1.0 standard deviations above the mean (69.8x)
18 | M&A and Investment Summary October 2013

Agency & Marketing Services
There were 13 transactions announced in the Agency & Marketing Services segment In October. Digital Agency was the most active subsegment with five transactions announced
S l t i iti Select acquisitions:
• UK‐based Chime Communications’ $72 million acquisition of India‐based Just Marketing, a motorsports marketing services agency
• Deloitte Digital’s acquisition of Banyan Branch, digital and social media agency offering strategy development, social media creative work, engagement, and research and analytics services
• Match Marketing Group’s acquisition of Convergence Marketing, a provider of retail merchandising solutions and services
• McKinsey Development’s acquisition of Brick and Click Solutions, a marketing, communication, and advertising services provider
AGENCY & MARKETING SERVICES TRANSACTIONS BY SEGMENT BUYER/INVESTOR BREAKDOWN
# % $MM % # $MM # $MM # $MM
Digital Agency 5 38% ‐ 0% 5 ‐ 0 ‐ 0 ‐
Retail Services 1 8% ‐ 0% 1 ‐ 0 ‐ 0 ‐
Ad Specialty/Premiums 1 8% ‐ 0% 1 ‐ 0 ‐ 0 ‐
Branded Communications 1 8% ‐ 0% 1 ‐ 0 ‐ 0 ‐
Transactions Reported Value Strategic Buyout Venture/Growth Capital
Branded Communications 1 8% 0% 1 0 0
Other* 5 38% 73.7 100% 2 72.1 2 1.6 1 ‐
Total 13 100% 73.7 100% 10 72.1 2 1.6 1 0.0
*Other includes Experiential Marketing, Healthcare Agency, Media Planning/Buying, Public Relations, and Social Agency
19 | M&A and Investment Summary October 2013

AgencyPublic Company Valuation
($ in Millions, except stock price data)
Stock Price Chg % From Equity Ent. LTM LTM Margin LTM LTM Multiples Company Name Headquarters 10/31/13 52WK High Value Value Revenue EBITDA EBITDA Rev Growth EV/Rev EV/EBITDACello Group Plc United Kingdom $1.11 ‐2% $ 91.7 $ 109.8 $ 219.0 $ 12.6 5.8% 11.9% 0.5x 8.7xCharm Communications Inc. China 4.32 ‐28% 172.9 86.9 176.9 (2.4) NM ‐19.6% 0.5x NM Chime Communications plc * United Kingdom 5 00 ‐4% 467 5 493 7 481 5 14 1 2 9% ‐0 7% 1 0x 35 1xChime Communications plc United Kingdom 5.00 4% 467.5 493.7 481.5 14.1 2.9% ‐0.7% 1.0x 35.1xCreston plc United Kingdom 1.58 ‐10% 94.6 76.9 114.2 17.9 15.7% 0.4% 0.7x 4.3xDentsu Inc. * Japan 36.80 ‐7% 9,546.1 12,940.3 20,232.6 661.1 3.3% 3.6% 0.6x 19.6xEnero Group Limited Austral ia 0.64 ‐13% 54.5 39.1 227.1 0.3 0.1% ‐26.0% 0.2x NM Havas France 8.20 ‐4% 3,224.3 3,855.4 2,321.7 376.1 16.2% 4.5% 1.7x 10.3xHuntsworth plc United Kingdom 1.04 ‐2% 325.4 435.2 264.0 46.0 17.4% ‐1.5% 1.6x 9.5xM&C Saatchi plc United Kingdom 4.97 ‐2% 338.3 310.6 264.1 30.6 11.6% 5.9% 1.2x 10.2xMDC Partners Inc. United States 31.02 ‐5% 976.2 1,635.0 1,141.3 111.0 9.7% 10.7% 1.4x 14.7xNext Fifteen Communications Group plc United Kingdom 1.16 ‐37% 69.4 81.2 147.2 17.3 11.7% 2.6% 0.6x 4.7xOmnicom Group Inc. United States 68.98 ‐2% 17,752.8 20,934.8 14,471.0 2,135.3 14.8% 2.4% 1.4x 9.8xOPT, Inc. Japan 8.48 ‐35% 250.0 143.6 802.4 27.7 3.4% 13.2% 0.2x 5.2xPorta Communications Plc United Kingdom 0.22 ‐7% 32.8 38.7 23.1 (2.8) NM 531.3% 1.7x NM Publicis Groupe SA France 83.40 ‐2% 17,776.5 18,706.9 8,939.9 1,732.2 19.4% 10.9% 2.1x 10.8xSapient Corp. United States 15.92 ‐1% 2,225.4 1,970.9 1,188.6 152.8 12.9% 11.7% 1.7x 12.9xThe Interpublic Group of Companies, Inc. United States 16.91 ‐4% 7,038.7 8,185.7 7,062.9 840.6 11.9% 1.4% 1.2x 9.7xWPP plc United Kingdom 21.10 ‐2% 28,382.0 33,130.0 16,305.5 2,780.6 17.1% 4.4% 2.0x 11.9x
1 7x 10 9xAdjusted Weighted Average 1.7x 10.9xAdjusted Weighted Average
*Calculation is market cap weighted and excludes revenue multiples that are 2.0 standard deviations above the mean (2.4x)and EBITDA multiples that are 1.0 standard deviations above the mean (19.3x)
20 | M&A and Investment Summary October 2013
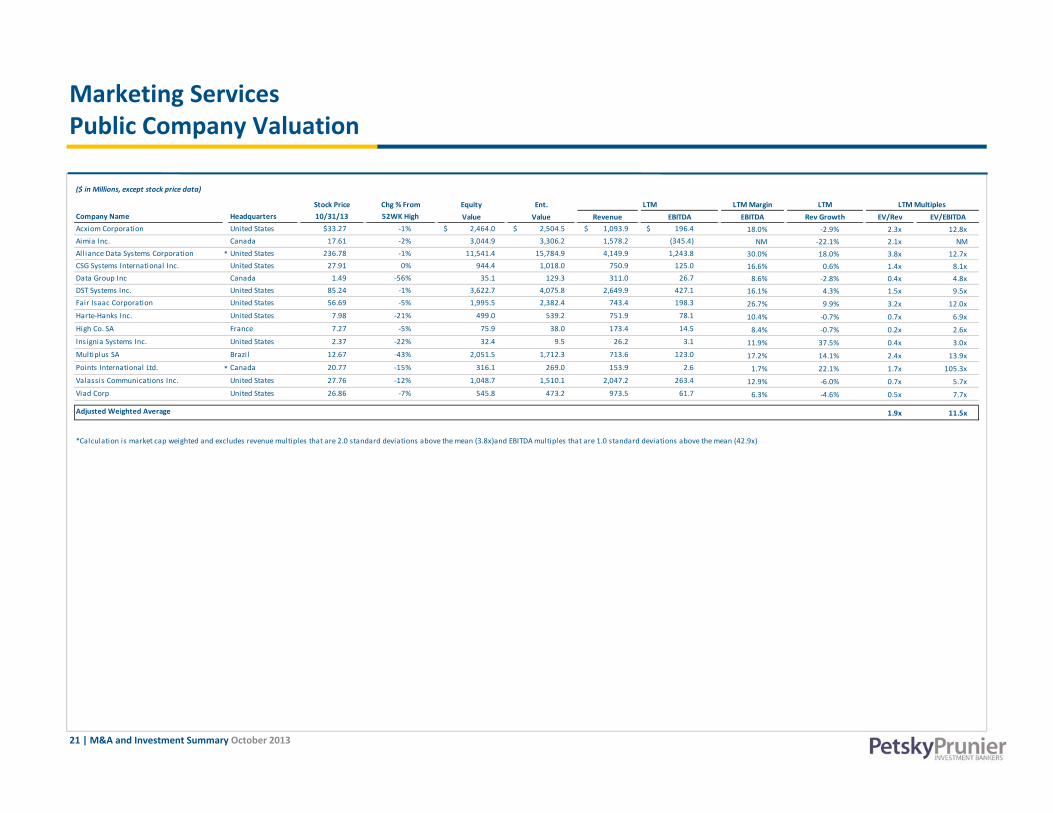
Marketing ServicesPublic Company Valuation
($ in Millions, except stock price data)
Stock Price Chg % From Equity Ent. LTM LTM Margin LTM LTM Multiples Company Name Headquarters 10/31/13 52WK High Value Value Revenue EBITDA EBITDA Rev Growth EV/Rev EV/EBITDAAcxiom Corporation United States $33.27 ‐1% $ 2,464.0 $ 2,504.5 $ 1,093.9 $ 196.4 18.0% ‐2.9% 2.3x 12.8xAimia Inc. Canada 17.61 ‐2% 3,044.9 3,306.2 1,578.2 (345.4) NM ‐22.1% 2.1x NM Alliance Data Systems Corporation * United States 236 78 1% 11 541 4 15 784 9 4 149 9 1 243 8 30 0% 18 0% 3 8x 12 7xAlliance Data Systems Corporation * United States 236.78 ‐1% 11,541.4 15,784.9 4,149.9 1,243.8 30.0% 18.0% 3.8x 12.7xCSG Systems International Inc. United States 27.91 0% 944.4 1,018.0 750.9 125.0 16.6% 0.6% 1.4x 8.1xData Group Inc Canada 1.49 ‐56% 35.1 129.3 311.0 26.7 8.6% ‐2.8% 0.4x 4.8xDST Systems Inc. United States 85.24 ‐1% 3,622.7 4,075.8 2,649.9 427.1 16.1% 4.3% 1.5x 9.5xFair Isaac Corporation United States 56.69 ‐5% 1,995.5 2,382.4 743.4 198.3 26.7% 9.9% 3.2x 12.0xHarte‐Hanks Inc. United States 7.98 ‐21% 499.0 539.2 751.9 78.1 10.4% ‐0.7% 0.7x 6.9xHigh Co. SA France 7.27 ‐5% 75.9 38.0 173.4 14.5 8.4% ‐0.7% 0.2x 2.6xInsignia Systems Inc. United States 2.37 ‐22% 32.4 9.5 26.2 3.1 11.9% 37.5% 0.4x 3.0xMultiplus SA Brazil 12 67 ‐43% 2 051 5 1 712 3 713 6 123 0 17 2% 14 1% 2 4x 13 9xMultiplus SA Brazil 12.67 43% 2,051.5 1,712.3 713.6 123.0 17.2% 14.1% 2.4x 13.9xPoints International Ltd. * Canada 20.77 ‐15% 316.1 269.0 153.9 2.6 1.7% 22.1% 1.7x 105.3xValassis Communications Inc. United States 27.76 ‐12% 1,048.7 1,510.1 2,047.2 263.4 12.9% ‐6.0% 0.7x 5.7xViad Corp United States 26.86 ‐7% 545.8 473.2 973.5 61.7 6.3% ‐4.6% 0.5x 7.7x
1.9x 11.5xAdjusted Weighted Average
*Calculation is market cap weighted and excludes revenue multiples that are 2.0 standard deviations above the mean (3.8x)and EBITDA multiples that are 1.0 standard deviations above the mean (42.9x)
21 | M&A and Investment Summary October 2013
Traditional Media
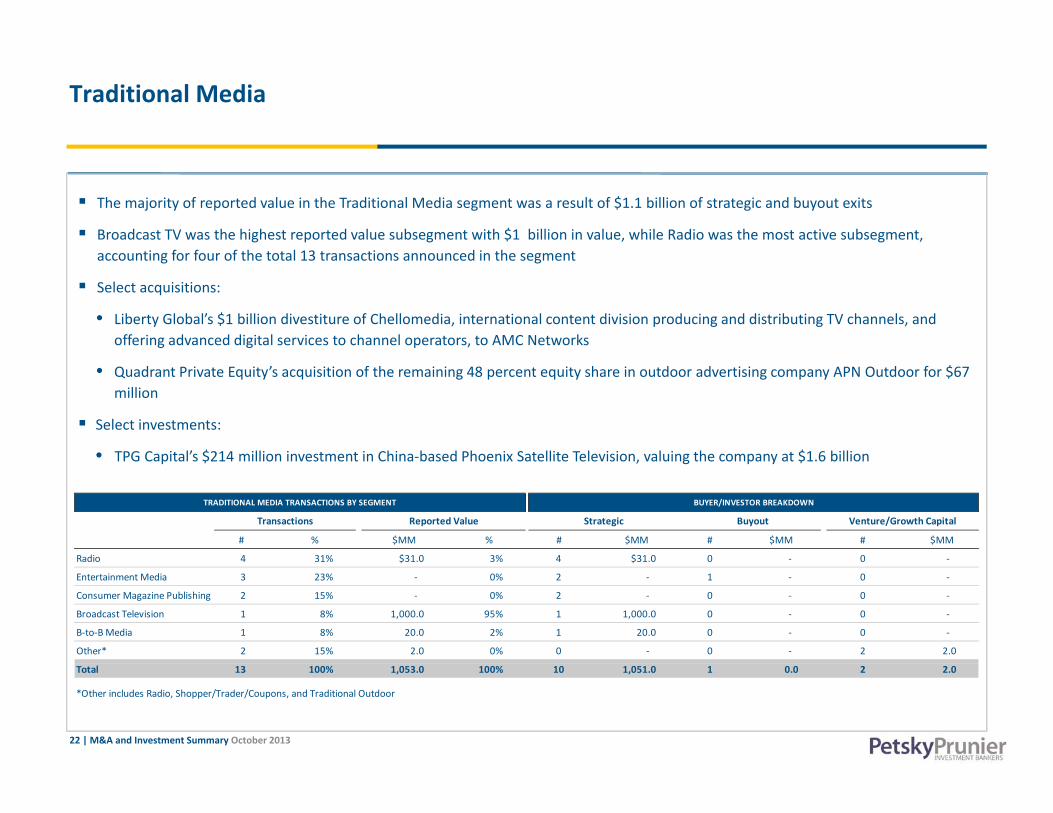
The majority of reported value in the Traditional Media segment was a result of $1.1 billion of strategic and buyout exits
Broadcast TV was the highest reported value subsegment with $1 billion in value, while Radio was the most active subsegment,ti f f f th t t l 13 t ti d i th taccounting for four of the total 13 transactions announced in the segment
Select acquisitions:
• Liberty Global’s $1 billion divestiture of Chellomedia, international content division producing and distributing TV channels, and offering advanced digital services to channel operators, to AMC Networks
• Quadrant Private Equity’s acquisition of the remaining 48 percent equity share in outdoor advertising company APN Outdoor for $67 million
Select investments:
• TPG Capital’s $214 million investment in China‐based Phoenix Satellite Television valuing the company at $1 6 billionTPG Capital s $214 million investment in China based Phoenix Satellite Television, valuing the company at $1.6 billion
# % $MM % # $MM # $MM # $MM
Radio 4 31% $31 0 3% 4 $31 0 0 ‐ 0 ‐
TRADITIONAL MEDIA TRANSACTIONS BY SEGMENT BUYER/INVESTOR BREAKDOWN
Transactions Reported Value Strategic Buyout Venture/Growth Capital
Radio 4 31% $31.0 3% 4 $31.0 0 0
Entertainment Media 3 23% ‐ 0% 2 ‐ 1 ‐ 0 ‐
Consumer Magazine Publishing 2 15% ‐ 0% 2 ‐ 0 ‐ 0 ‐
Broadcast Television 1 8% 1,000.0 95% 1 1,000.0 0 ‐ 0 ‐
B‐to‐B Media 1 8% 20.0 2% 1 20.0 0 ‐ 0 ‐
Other* 2 15% 2.0 0% 0 ‐ 0 ‐ 2 2.0
22 | M&A and Investment Summary October 2013
Total 13 100% 1,053.0 100% 10 1,051.0 1 0.0 2 2.0
*Other includes Radio, Shopper/Trader/Coupons, and Traditional Outdoor
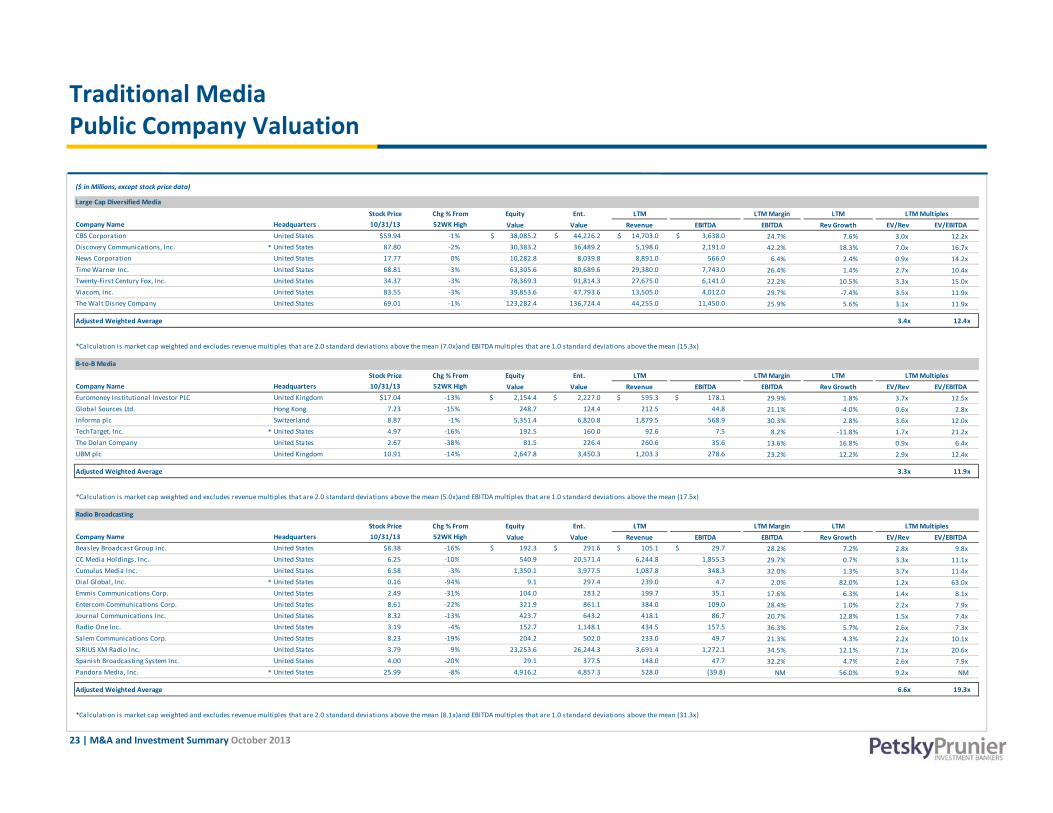
Traditional Media Public Company Valuation
($ in Millions, except stock price data)
Stock Price Chg % From Equity Ent. LTM LTM Margin LTM LTM Multiples Company Name Headquarters 10/31/13 52WK High Value Value Revenue EBITDA EBITDA Rev Growth EV/Rev EV/EBITDACBS Corporation United States $59.94 ‐1% $ 38,085.2 $ 44,226.2 $ 14,703.0 $ 3,638.0 24.7% 7.6% 3.0x 12.2xDiscovery Communications, Inc. * United States 87.80 ‐2% 30,383.2 36,489.2 5,198.0 2,191.0 42.2% 18.3% 7.0x 16.7x
Large Cap Diversified Media
News Corporation United States 17.77 0% 10,282.8 8,039.8 8,891.0 566.0 6.4% 2.4% 0.9x 14.2xTime Warner Inc. United States 68.81 ‐3% 63,305.6 80,689.6 29,380.0 7,743.0 26.4% 1.4% 2.7x 10.4xTwenty‐First Century Fox, Inc. United States 34.37 ‐3% 78,369.3 91,814.3 27,675.0 6,141.0 22.2% 10.5% 3.3x 15.0xViacom, Inc. United States 83.55 ‐3% 39,853.6 47,793.6 13,505.0 4,012.0 29.7% ‐7.4% 3.5x 11.9xThe Walt Disney Company United States 69.01 ‐1% 123,282.4 136,724.4 44,255.0 11,450.0 25.9% 5.6% 3.1x 11.9x
Adjusted Weighted Average 3.4x 12.4x
*Calculation is market cap weighted and excludes revenue multiples that are 2.0 standard deviations above the mean (7.0x)and EBITDA multiples that are 1.0 standard deviations above the mean (15.3x)
B‐to‐B Media
Stock Price Chg % From Equity Ent. LTM LTM Margin LTM LTM Multiples Company Name Headquarters 10/31/13 52WK High Value Value Revenue EBITDA EBITDA Rev Growth EV/Rev EV/EBITDAEuromoney Institutional Investor PLC United Kingdom $17.04 ‐13% $ 2,154.4 $ 2,227.0 $ 595.3 $ 178.1 29.9% 1.8% 3.7x 12.5xGlobal Sources Ltd. Hong Kong 7.23 ‐15% 248.7 124.4 212.5 44.8 21.1% ‐4.0% 0.6x 2.8xInforma plc Switzerland 8.87 ‐1% 5,351.4 6,820.8 1,879.5 568.9 30.3% 2.8% 3.6x 12.0xTechTarget, Inc. * United States 4.97 ‐16% 192.5 160.0 92.6 7.5 8.2% ‐11.8% 1.7x 21.2xThe Dolan Company United States 2.67 ‐38% 81.5 226.4 260.6 35.6 13.6% 16.8% 0.9x 6.4xUBM plc United Kingdom 10.91 ‐14% 2,647.8 3,450.3 1,203.3 278.6 23.2% 12.2% 2.9x 12.4x
Adjusted Weighted Average 3.3x 11.9x
Radio Broadcasting
Stock Price Chg % From Equity Ent. LTM LTM Margin LTM LTM Multiples Company Name Headquarters 10/31/13 52WK High Value Value Revenue EBITDA EBITDA Rev Growth EV/Rev EV/EBITDABeasley Broadcast Group Inc. United States $8.38 ‐16% $ 192.3 $ 291.6 $ 105.1 $ 29.7 28.2% 7.2% 2.8x 9.8xCC Media Holdings Inc United States 6 25 ‐10% 540 9 20 571 4 6 244 8 1 855 3 29 7% 0 7% 3 3x 11 1x
*Calculation is market cap weighted and excludes revenue multiples that are 2.0 standard deviations above the mean (5.0x)and EBITDA multiples that are 1.0 standard deviations above the mean (17.5x)
CC Media Holdings, Inc. United States 6.25 10% 540.9 20,571.4 6,244.8 1,855.3 29.7% 0.7% 3.3x 11.1xCumulus Media Inc. United States 6.58 ‐3% 1,350.1 3,977.5 1,087.8 348.3 32.0% 1.3% 3.7x 11.4xDial Global, Inc. * United States 0.16 ‐94% 9.1 297.4 239.0 4.7 2.0% 82.0% 1.2x 63.0xEmmis Communications Corp. United States 2.49 ‐31% 104.0 283.2 199.7 35.1 17.6% 6.3% 1.4x 8.1xEntercom Communications Corp. United States 8.61 ‐22% 321.9 861.1 384.0 109.0 28.4% 1.0% 2.2x 7.9xJournal Communications Inc. United States 8.32 ‐13% 423.7 643.2 418.1 86.7 20.7% 12.8% 1.5x 7.4xRadio One Inc. United States 3.19 ‐4% 152.7 1,148.1 434.5 157.5 36.3% 5.7% 2.6x 7.3xSalem Communications Corp. United States 8.23 ‐19% 204.2 502.0 233.0 49.7 21.3% 4.3% 2.2x 10.1xSIRIUS XM Radio Inc. United States 3.79 ‐9% 23,253.6 26,244.3 3,691.4 1,272.1 34.5% 12.1% 7.1x 20.6xSpanish Broadcasting System Inc. United States 4.00 ‐20% 29.1 377.5 148.0 47.7 32.2% 4.7% 2.6x 7.9x
23 | M&A and Investment Summary October 2013
Spanish roadcasting System Inc. United States 4.00 0% 9. 377.5 48.0 47.7 32.2% 4.7% 2.6x 7.9xPandora Media, Inc. * United States 25.99 ‐8% 4,916.2 4,857.3 528.0 (39.8) NM 56.0% 9.2x NM
Adjusted Weighted Average 6.6x 19.3x
*Calculation is market cap weighted and excludes revenue multiples that are 2.0 standard deviations above the mean (8.1x)and EBITDA multiples that are 1.0 standard deviations above the mean (31.3x)
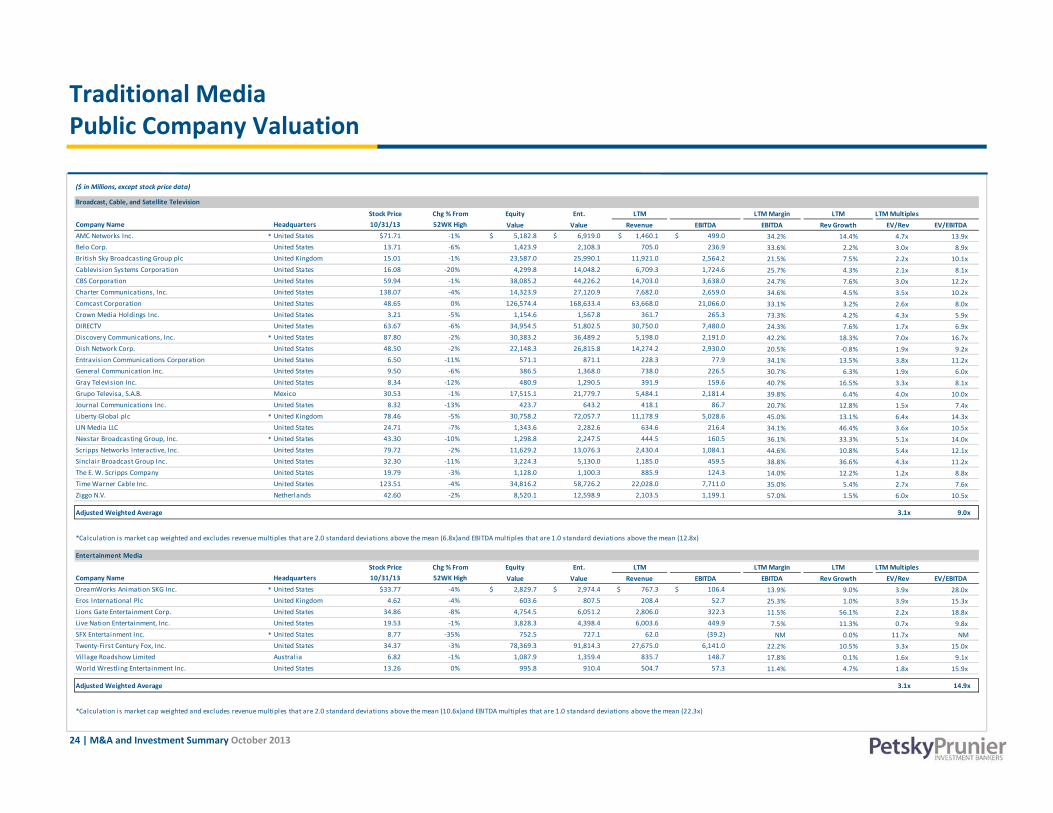
Traditional Media Public Company Valuation
($ in Millions, except stock price data)
Broadcast, Cable, and Satellite Television
Stock Price Chg % From Equity Ent. LTM LTM Margin LTM LTM Multiples Company Name Headquarters 10/31/13 52WK High Value Value Revenue EBITDA EBITDA Rev Growth EV/Rev EV/EBITDAAMC Networks Inc. * United States $71.71 ‐1% $ 5,182.8 $ 6,919.0 $ 1,460.1 $ 499.0 34.2% 14.4% 4.7x 13.9xBelo Corp. United States 13.71 ‐6% 1,423.9 2,108.3 705.0 236.9 33.6% 2.2% 3.0x 8.9xBritish Sky Broadcasting Group plc United Kingdom 15.01 ‐1% 23,587.0 25,990.1 11,921.0 2,564.2 21.5% 7.5% 2.2x 10.1xCablevision Systems Corporation United States 16.08 ‐20% 4,299.8 14,048.2 6,709.3 1,724.6 25.7% 4.3% 2.1x 8.1xCBS Corporation United States 59.94 ‐1% 38,085.2 44,226.2 14,703.0 3,638.0 24.7% 7.6% 3.0x 12.2xCharter Communications, Inc. United States 138.07 ‐4% 14,323.9 27,120.9 7,682.0 2,659.0 34.6% 4.5% 3.5x 10.2xComcast Corporation United States 48.65 0% 126,574.4 168,633.4 63,668.0 21,066.0 33.1% 3.2% 2.6x 8.0xCrown Media Holdings Inc. United States 3.21 ‐5% 1,154.6 1,567.8 361.7 265.3 73.3% 4.2% 4.3x 5.9xDIRECTV United States 63.67 ‐6% 34,954.5 51,802.5 30,750.0 7,480.0 24.3% 7.6% 1.7x 6.9xDiscovery Communications, Inc. * United States 87.80 ‐2% 30,383.2 36,489.2 5,198.0 2,191.0 42.2% 18.3% 7.0x 16.7xDish Network Corp. United States 48.50 ‐2% 22,148.3 26,815.8 14,274.2 2,930.0 20.5% ‐0.8% 1.9x 9.2xEntravision Communications Corporation United States 6.50 ‐11% 571.1 871.1 228.3 77.9 34.1% 13.5% 3.8x 11.2xGeneral Communication Inc. United States 9.50 ‐6% 386.5 1,368.0 738.0 226.5 30.7% 6.3% 1.9x 6.0xGray Television Inc. United States 8.34 ‐12% 480.9 1,290.5 391.9 159.6 40.7% 16.5% 3.3x 8.1xGrupo Televisa, S.A.B. Mexico 30.53 ‐1% 17,515.1 21,779.7 5,484.1 2,181.4 39.8% 6.4% 4.0x 10.0xJournal Communications Inc. United States 8.32 ‐13% 423.7 643.2 418.1 86.7 20.7% 12.8% 1.5x 7.4xLiberty Global plc * United Kingdom 78.46 ‐5% 30,758.2 72,057.7 11,178.9 5,028.6 45.0% 13.1% 6.4x 14.3xLIN Media LLC United States 24.71 ‐7% 1,343.6 2,282.6 634.6 216.4 34.1% 46.4% 3.6x 10.5xNexstar Broadcasting Group, Inc. * United States 43.30 ‐10% 1,298.8 2,247.5 444.5 160.5 36.1% 33.3% 5.1x 14.0xScripps Networks Interactive, Inc. United States 79.72 ‐2% 11,629.2 13,076.3 2,430.4 1,084.1 44.6% 10.8% 5.4x 12.1xSinclair Broadcast Group Inc. United States 32.30 ‐11% 3,224.3 5,130.0 1,185.0 459.5 38.8% 36.6% 4.3x 11.2xThe E. W. Scripps Company United States 19.79 ‐3% 1,128.0 1,100.3 885.9 124.3 14.0% 12.2% 1.2x 8.8xTime Warner Cable Inc. United States 123.51 ‐4% 34,816.2 58,726.2 22,028.0 7,711.0 35.0% 5.4% 2.7x 7.6xZiggo N.V. Netherlands 42.60 ‐2% 8,520.1 12,598.9 2,103.5 1,199.1 57.0% 1.5% 6.0x 10.5x
Adjusted Weighted Average 3.1x 9.0x
Entertainment Media
*Calculation is market cap weighted and excludes revenue multiples that are 2.0 standard deviations above the mean (6.8x)and EBITDA multiples that are 1.0 standard deviations above the mean (12.8x)
Stock Price Chg % From Equity Ent. LTM LTM Margin LTM LTM Multiples Company Name Headquarters 10/31/13 52WK High Value Value Revenue EBITDA EBITDA Rev Growth EV/Rev EV/EBITDADreamWorks Animation SKG Inc. * United States $33.77 ‐4% $ 2,829.7 $ 2,974.4 $ 767.3 $ 106.4 13.9% 9.0% 3.9x 28.0xEros International Plc United Kingdom 4.62 ‐4% 603.6 807.5 208.4 52.7 25.3% 1.0% 3.9x 15.3xLions Gate Entertainment Corp. United States 34.86 ‐8% 4,754.5 6,051.2 2,806.0 322.3 11.5% 56.1% 2.2x 18.8xLive Nation Entertainment, Inc. United States 19.53 ‐1% 3,828.3 4,398.4 6,003.6 449.9 7.5% 11.3% 0.7x 9.8xSFX Entertainment Inc. * United States 8.77 ‐35% 752.5 727.1 62.0 (39.2) NM 0.0% 11.7x NM Twenty‐First Century Fox, Inc. United States 34.37 ‐3% 78,369.3 91,814.3 27,675.0 6,141.0 22.2% 10.5% 3.3x 15.0xVillage Roadshow Limited Austral ia 6.82 ‐1% 1,087.9 1,359.4 835.7 148.7 17.8% 0.1% 1.6x 9.1x
24 | M&A and Investment Summary October 2013
World Wrestling Entertainment Inc. United States 13.26 0% 995.8 910.4 504.7 57.3 11.4% 4.7% 1.8x 15.9x
Adjusted Weighted Average 3.1x 14.9x
*Calculation is market cap weighted and excludes revenue multiples that are 2.0 standard deviations above the mean (10.6x)and EBITDA multiples that are 1.0 standard deviations above the mean (22.3x)
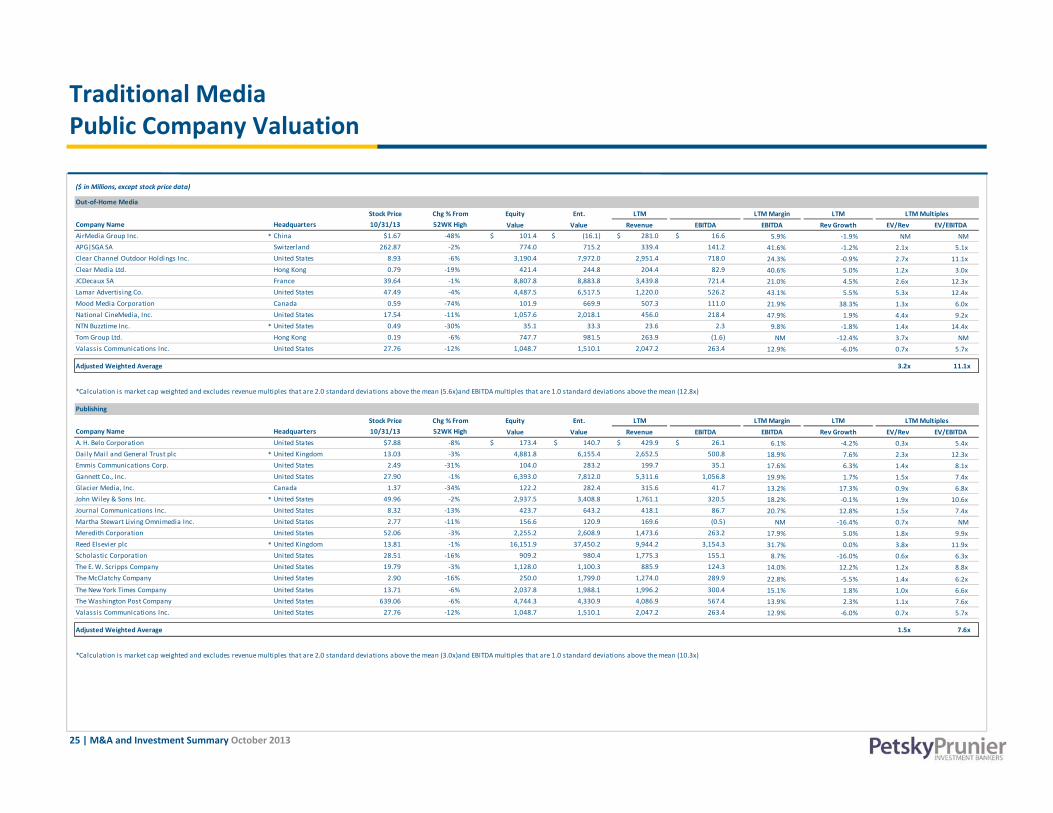
Traditional Media Public Company Valuation
($ in Millions, except stock price data)
Out‐of‐Home Media
Stock Price Chg % From Equity Ent. LTM LTM Margin LTM LTM Multiples Company Name Headquarters 10/31/13 52WK High Value Value Revenue EBITDA EBITDA Rev Growth EV/Rev EV/EBITDAAirMedia Group Inc. * China $1.67 ‐48% $ 101.4 $ (16.1) $ 281.0 $ 16.6 5.9% ‐1.9% NM NM APG|SGA SA Switzerland 262.87 ‐2% 774.0 715.2 339.4 141.2 41.6% ‐1.2% 2.1x 5.1xClear Channel Outdoor Holdings Inc. United States 8.93 ‐6% 3,190.4 7,972.0 2,951.4 718.0 24.3% ‐0.9% 2.7x 11.1xClear Media Ltd. Hong Kong 0.79 ‐19% 421.4 244.8 204.4 82.9 40.6% 5.0% 1.2x 3.0xJCDecaux SA France 39.64 ‐1% 8,807.8 8,883.8 3,439.8 721.4 21.0% 4.5% 2.6x 12.3xLamar Advertising Co. United States 47.49 ‐4% 4,487.5 6,517.5 1,220.0 526.2 43.1% 5.5% 5.3x 12.4xMood Media Corporation Canada 0.59 ‐74% 101.9 669.9 507.3 111.0 21.9% 38.3% 1.3x 6.0xNational CineMedia, Inc. United States 17.54 ‐11% 1,057.6 2,018.1 456.0 218.4 47.9% 1.9% 4.4x 9.2xNTN Buzztime Inc. * United States 0.49 ‐30% 35.1 33.3 23.6 2.3 9.8% ‐1.8% 1.4x 14.4xTom Group Ltd. Hong Kong 0.19 ‐6% 747.7 981.5 263.9 (1.6) NM ‐12.4% 3.7x NM Valassis Communications Inc. United States 27.76 ‐12% 1,048.7 1,510.1 2,047.2 263.4 12.9% ‐6.0% 0.7x 5.7x
Adjusted Weighted Average 3.2x 11.1x
Publishing
Stock Price Chg % From Equity Ent. LTM LTM Margin LTM LTM Multiples Company Name Headquarters 10/31/13 52WK High Value Value Revenue EBITDA EBITDA Rev Growth EV/Rev EV/EBITDAA. H. Belo Corporation United States $7.88 ‐8% $ 173.4 $ 140.7 $ 429.9 $ 26.1 6.1% ‐4.2% 0.3x 5.4xDaily Mail and General Trust plc * United Kingdom 13.03 ‐3% 4,881.8 6,155.4 2,652.5 500.8 18.9% 7.6% 2.3x 12.3x
*Calculation is market cap weighted and excludes revenue multiples that are 2.0 standard deviations above the mean (5.6x)and EBITDA multiples that are 1.0 standard deviations above the mean (12.8x)
Emmis Communications Corp. United States 2.49 ‐31% 104.0 283.2 199.7 35.1 17.6% 6.3% 1.4x 8.1xGannett Co., Inc. United States 27.90 ‐1% 6,393.0 7,812.0 5,311.6 1,056.8 19.9% 1.7% 1.5x 7.4xGlacier Media, Inc. Canada 1.37 ‐34% 122.2 282.4 315.6 41.7 13.2% 17.3% 0.9x 6.8xJohn Wiley & Sons Inc. * United States 49.96 ‐2% 2,937.5 3,408.8 1,761.1 320.5 18.2% ‐0.1% 1.9x 10.6xJournal Communications Inc. United States 8.32 ‐13% 423.7 643.2 418.1 86.7 20.7% 12.8% 1.5x 7.4xMartha Stewart Living Omnimedia Inc. United States 2.77 ‐11% 156.6 120.9 169.6 (0.5) NM ‐16.4% 0.7x NM Meredith Corporation United States 52.06 ‐3% 2,255.2 2,608.9 1,473.6 263.2 17.9% 5.0% 1.8x 9.9xReed Elsevier plc * United Kingdom 13.81 ‐1% 16,151.9 37,450.2 9,944.2 3,154.3 31.7% 0.0% 3.8x 11.9xScholastic Corporation United States 28.51 ‐16% 909.2 980.4 1,775.3 155.1 8.7% ‐16.0% 0.6x 6.3xThe E. W. Scripps Company United States 19.79 ‐3% 1,128.0 1,100.3 885.9 124.3 14.0% 12.2% 1.2x 8.8xThe McClatchy Company United States 2.90 ‐16% 250.0 1,799.0 1,274.0 289.9 22.8% ‐5.5% 1.4x 6.2xThe New York Times Company United States 13.71 ‐6% 2,037.8 1,988.1 1,996.2 300.4 15.1% 1.8% 1.0x 6.6xThe Washington Post Company United States 639.06 ‐6% 4,744.3 4,330.9 4,086.9 567.4 13.9% 2.3% 1.1x 7.6xValassis Communications Inc. United States 27.76 ‐12% 1,048.7 1,510.1 2,047.2 263.4 12.9% ‐6.0% 0.7x 5.7x
Adjusted Weighted Average 1.5x 7.6x
*Calculation is market cap weighted and excludes revenue multiples that are 2.0 standard deviations above the mean (3.0x)and EBITDA multiples that are 1.0 standard deviations above the mean (10.3x)
25 | M&A and Investment Summary October 2013

Technology & Communications
Of the $422 million reported in the Technology & Communications segment, $328 million was a result of venture and growth capitalinvestments, while strategic exits accounted for the remaining $94 million in value
A ti it i th t l d b th Fi i l T h l b t ith i d l d hil D t C t T h l Activity in the segment was led by the Financial Technology subsegment with nine deals announced, while Data Center Technology was the highest reported value subsegment with $164 million
Select acquisitions:
• Marlin Equity Partner’s $349 purchase of Tellabs, a provider of networking products for communications service providers
• Pace’s $310 million acquisition of Aurora Networks, a developer and manufacturer of optical transport and access network solution
• Google’s $23 million acquisition of FlexyCore, a developer of technologies to improve the performance of Android operating systems
Select investments:
• The $35 million investment in Wilocity, a developer of wireless semiconductor solutions that bring desktop experiences to mobile computers
$ $ $ $
TECHNOLOGY & COMMUNICATIONS TRANSACTIONS BY SEGMENT BUYER/INVESTOR BREAKDOWN
Transactions Reported Value Strategic Buyout Venture/Growth Capital
# % $MM % # $MM # $MM # $MM
Financial Technology 9 24% $85.6 20% 1 $34.2 0 ‐ 8 $51.4
Cloud Storage 6 16% 70.3 17% 1 37.3 0 ‐ 5 33.0
Communications Software 6 16% 14.0 3% 3 ‐ 1 ‐ 2 14.0
Data Center Technology 4 11% 164.0 39% 0 ‐ 1 ‐ 3 164.0
Enterprise Mobility 4 11% 26.1 6% 1 5.0 0 ‐ 3 21.1
26 | M&A and Investment Summary October 2013
Networking Equipment 3 8% 40.9 10% 2 5.9 0 ‐ 1 35.0
Total 38 100% 421.6 100% 11 93.6 2 0.0 25 328.0
*Other includes Big Data Technology, Mobile Infrastructure, Network Infrastructure Software, Satellite & Microwave Equipment, and Video Communications Software
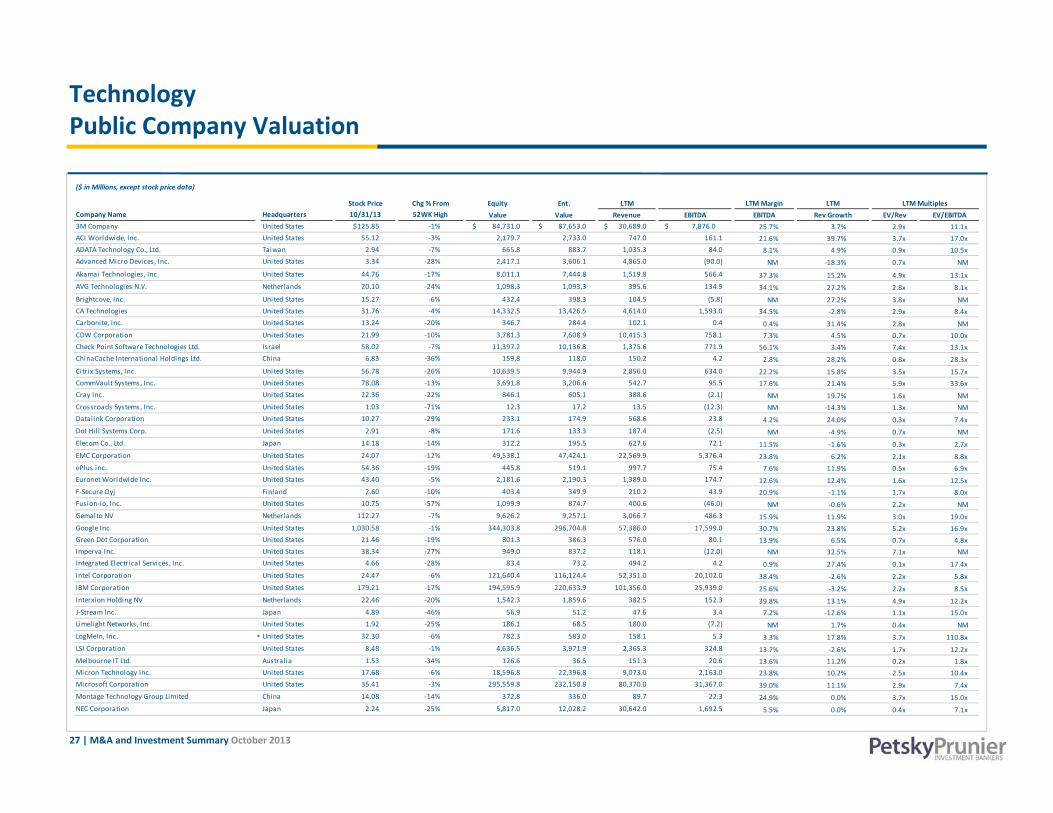
TechnologyPublic Company Valuation
($ in Millions, except stock price data)
Stock Price Chg % From Equity Ent. LTM LTM Margin LTM LTM Multiples Company Name Headquarters 10/31/13 52WK High Value Value Revenue EBITDA EBITDA Rev Growth EV/Rev EV/EBITDA3M Company United States $125.85 ‐1% $ 84,731.0 $ 87,653.0 $ 30,689.0 $ 7,876.0 25.7% 3.7% 2.9x 11.1xACI Worldwide, Inc. United States 55.12 ‐3% 2,179.7 2,733.0 747.0 161.1 21.6% 39.7% 3.7x 17.0xADATA Technology Co., Ltd. Taiwan 2.94 ‐7% 665.8 883.7 1,035.3 84.0 8.1% 4.9% 0.9x 10.5xgy , ,Advanced Micro Devices, Inc. United States 3.34 ‐28% 2,417.1 3,606.1 4,865.0 (90.0) NM ‐18.3% 0.7x NM Akamai Technologies, Inc. United States 44.76 ‐17% 8,011.1 7,444.8 1,519.8 566.4 37.3% 15.2% 4.9x 13.1xAVG Technologies N.V. Netherlands 20.10 ‐24% 1,098.3 1,093.3 395.6 134.9 34.1% 27.2% 2.8x 8.1xBrightcove, Inc. United States 15.27 ‐6% 432.4 398.3 104.5 (5.8) NM 27.2% 3.8x NM CA Technologies United States 31.76 ‐4% 14,332.5 13,426.5 4,614.0 1,593.0 34.5% ‐2.8% 2.9x 8.4xCarbonite, Inc. United States 13.24 ‐20% 346.7 284.4 102.1 0.4 0.4% 31.4% 2.8x NM CDW Corporation United States 21.99 ‐10% 3,781.3 7,608.9 10,415.3 758.1 7.3% 4.5% 0.7x 10.0xCheck Point Software Technologies Ltd. Israel 58.02 ‐7% 11,397.2 10,136.8 1,375.6 771.9 56.1% 3.4% 7.4x 13.1xChinaCache International Holdings Ltd. China 6.83 ‐36% 159.8 118.0 150.2 4.2 2.8% 28.2% 0.8x 28.3xCitrix Systems, Inc. United States 56.78 ‐26% 10,639.5 9,944.9 2,856.0 634.0 22.2% 15.8% 3.5x 15.7xCommVault Systems, Inc. United States 78.08 ‐13% 3,691.8 3,206.6 542.7 95.5 17.6% 21.4% 5.9x 33.6xCray Inc. United States 22.36 ‐22% 846.1 605.1 388.6 (2.1) NM 19.7% 1.6x NM Crossroads Systems, Inc. United States 1.03 ‐71% 12.3 17.2 13.5 (12.3) NM ‐14.3% 1.3x NM Datalink Corporation United States 10.27 ‐29% 233.1 174.9 568.6 23.8 4.2% 24.0% 0.3x 7.4xDot Hil l Systems Corp. United States 2.91 ‐8% 171.6 133.3 187.4 (2.5) NM ‐4.9% 0.7x NM Elecom Co., Ltd. Japan 14.18 ‐14% 312.2 195.5 627.6 72.1 11.5% ‐1.6% 0.3x 2.7xEMC Corporation United States 24.07 ‐12% 49,538.1 47,424.1 22,569.9 5,376.4 23 8% 6 2% 2 1x 8 8xp , , , , 23.8% 6.2% 2.1x 8.8xePlus inc. United States 54.36 ‐19% 445.8 519.1 997.7 75.4 7.6% 11.9% 0.5x 6.9xEuronet Worldwide Inc. United States 43.40 ‐5% 2,181.6 2,190.3 1,389.0 174.7 12.6% 12.4% 1.6x 12.5xF‐Secure Oyj Finland 2.60 ‐10% 403.4 349.9 210.2 43.9 20.9% ‐1.1% 1.7x 8.0xFusion‐io, Inc. United States 10.75 ‐57% 1,099.9 874.7 400.6 (46.0) NM ‐0.6% 2.2x NM Gemalto NV Netherlands 112.27 ‐7% 9,626.2 9,257.1 3,066.7 486.3 15.9% 11.9% 3.0x 19.0xGoogle Inc. United States 1,030.58 ‐1% 344,303.8 296,704.8 57,386.0 17,599.0 30.7% 23.8% 5.2x 16.9xGreen Dot Corporation United States 21.46 ‐19% 801.3 386.3 576.0 80.1 13.9% 6.5% 0.7x 4.8xImperva Inc. United States 38.34 ‐27% 949.0 837.2 118.1 (12.0) NM 32.5% 7.1x NM
d l i l S i i d S 66 28% 83 3 2 9 2 2Integrated Electrical Services, Inc. United States 4.66 ‐28% 83.4 73.2 494.2 4.2 0.9% 27.4% 0.1x 17.4xIntel Corporation United States 24.47 ‐6% 121,640.4 116,124.4 52,351.0 20,102.0 38.4% ‐2.6% 2.2x 5.8xIBM Corporation United States 179.21 ‐17% 194,595.9 220,633.9 101,356.0 25,939.0 25.6% ‐3.2% 2.2x 8.5xInterxion Holding NV Netherlands 22.46 ‐20% 1,542.3 1,859.6 382.5 152.3 39.8% 13.1% 4.9x 12.2xJ‐Stream Inc. Japan 4.89 ‐46% 56.9 51.2 47.6 3.4 7.2% ‐12.6% 1.1x 15.0xLimelight Networks, Inc. United States 1.92 ‐25% 186.1 68.5 180.0 (7.2) NM 1.7% 0.4x NM LogMeIn, Inc. * United States 32.30 ‐6% 782.3 583.0 158.1 5.3 3.3% 17.8% 3.7x 110.8xLSI Corporation United States 8.48 ‐1% 4,636.5 3,971.9 2,365.3 324.8 13.7% ‐2.6% 1.7x 12.2xMelbourne IT Ltd. Australia 1.53 ‐34% 126.6 36.5 151.3 20.6 13.6% 11.2% 0.2x 1.8x
27 | M&A and Investment Summary October 2013
Melbourne IT td. Australia .53 34% 6.6 36.5 5 .3 0.6 13.6% 11.2% 0.2x 1.8xMicron Technology Inc. United States 17.68 ‐6% 18,596.8 22,396.8 9,073.0 2,163.0 23.8% 10.2% 2.5x 10.4xMicrosoft Corporation United States 35.41 ‐3% 295,559.8 232,150.8 80,370.0 31,367.0 39.0% 11.1% 2.9x 7.4xMontage Technology Group Limited China 14.08 ‐14% 372.8 336.0 89.7 22.3 24.9% 0.0% 3.7x 15.0xNEC Corporation Japan 2.24 ‐25% 5,817.0 12,028.2 30,642.0 1,692.5 5.5% 0.0% 0.4x 7.1x

TechnologyPublic Company Valuation
($ in Millions, except stock price data)
Stock Price Chg % From Equity Ent. LTM LTM Margin LTM LTM Multiples Company Name Headquarters 10/31/13 52WK High Value Value Revenue EBITDA EBITDA Rev Growth EV/Rev EV/EBITDANetApp, Inc. United States $38.81 ‐13% $ 13,199.1 $ 9,109.9 $ 6,404.0 $ 889.7 13.9% 3.0% 1.4x 10.2xOracle Corporation United States 33.50 ‐8% 152,674.9 138,105.9 37,371.0 16,259.0 43.5% 1.2% 3.7x 8.5xProAct IT Group AB Sweden 10.98 ‐35% 102.2 131.2 354.9 21.0 5.9% ‐5.8% 0.4x 6.2xp 5.9% 5.8% 0.4x 6.2xQualys, Inc. * United States 20.80 ‐10% 665.6 560.6 99.2 12.2 12.3% 18.9% 5.7x 45.8xQuantum Corporation United States 1.24 ‐29% 307.0 438.2 578.8 18.1 3.1% ‐6.9% 0.8x 24.3xRackspace Hosting, Inc. United States 51.23 ‐37% 7,117.8 6,943.2 1,426.9 414.2 29.0% 22.2% 4.9x 16.8xRed Hat, Inc. United States 43.27 ‐24% 8,199.6 7,336.0 1,429.2 289.0 20.2% 16.7% 5.1x 25.4xSanDisk Corp. United States 69.50 ‐2% 15,698.3 14,469.5 5,983.6 1,929.3 32.2% 17.6% 2.4x 7.5xSAP AG Germany 78.64 ‐10% 93,854.7 96,637.3 22,646.0 7,921.8 35.0% 6.6% 4.3x 12.2xSeagate Technology Public Limited Company Ireland 48.69 ‐4% 15,879.9 16,250.9 14,108.0 2,839.0 20.1% ‐11.0% 1.2x 5.7xSil icon Graphics International Corp. United States 12.76 ‐39% 437.7 277.7 721.9 8.4 1.2% ‐5.9% 0.4x 33.1xSK H i I S th K 30 02 9% 21 319 6 24 906 3 10 353 6 4 204 4SK Hynix, Inc. South Korea 30.02 ‐9% 21,319.6 24,906.3 10,353.6 4,204.4 40.6% 20.2% 2.4x 5.9xSony Corporation Japan 19.10 ‐22% 19,818.2 33,578.5 72,772.6 3,162.9 4.3% 9.5% 0.5x 10.6xSplunk, Inc. * United States 62.71 ‐3% 6,634.7 6,287.6 241.4 (34.8) NM 54.7% 26.1x NM Symantec Corporation United States 22.76 ‐16% 15,838.2 14,100.2 6,885.0 1,903.0 27.6% 1.8% 2.0x 7.4xSynchronoss Technologies, Inc. United States 34.62 ‐12% 1,340.5 1,290.5 304.3 63.0 20.7% 20.3% 4.2x 20.5xTableau Software, Inc. * United States 61.46 ‐21% 3,635.5 3,409.2 192.8 (2.1) NM 0.0% 17.7x NM Teradata Corporation United States 44.07 ‐37% 7,187.8 6,580.8 2,663.0 603.0 22.6% 2.5% 2.5x 10.9xTrend Micro Inc. Japan 37.04 ‐5% 4,919.8 3,612.2 1,017.3 335.9 33.0% 7.7% 3.6x 10.8xThe KEYW Holding Corporation United States 11.52 ‐30% 422.4 500.6 304.1 23.9 7.9% 38.7% 1.6x 20.9xg p 7.9% 38.7% 1.6x 20.9xUnisys Corporation United States 26.35 ‐7% 1,150.0 804.2 3,439.9 226.2 6.6% ‐7.3% 0.2x 3.6xVeriSign, Inc. United States 54.28 ‐1% 7,439.2 6,996.1 949.7 594.0 62.5% 12.1% 7.4x 11.8xViolin Memory, Inc. United States 6.65 ‐17% 544.1 530.8 94.8 (109.9) NM 27.4% 5.6x NM VMware, Inc. United States 81.28 ‐18% 35,031.7 29,644.7 5,017.0 1,323.0 26.4% 14.7% 5.9x 22.4xWestern Digital Corporation United States 69.63 ‐6% 16,454.8 13,983.8 15,120.0 3,202.0 21.2% 9.4% 0.9x 4.4xXoom Corporation * United States 29.82 ‐18% 1,114.0 912.8 112.2 8.7 7.7% 52.9% 8.1x 105.0x
3.4x 10.9xAdjusted Weighted Average
*Calculation is market cap weighted and excludes revenue multiples that are 2.0 standard deviations above the mean (11.1x)and EBITDA multiples that are 1.0 standard deviations above the mean (36.3x)
28 | M&A and Investment Summary October 2013

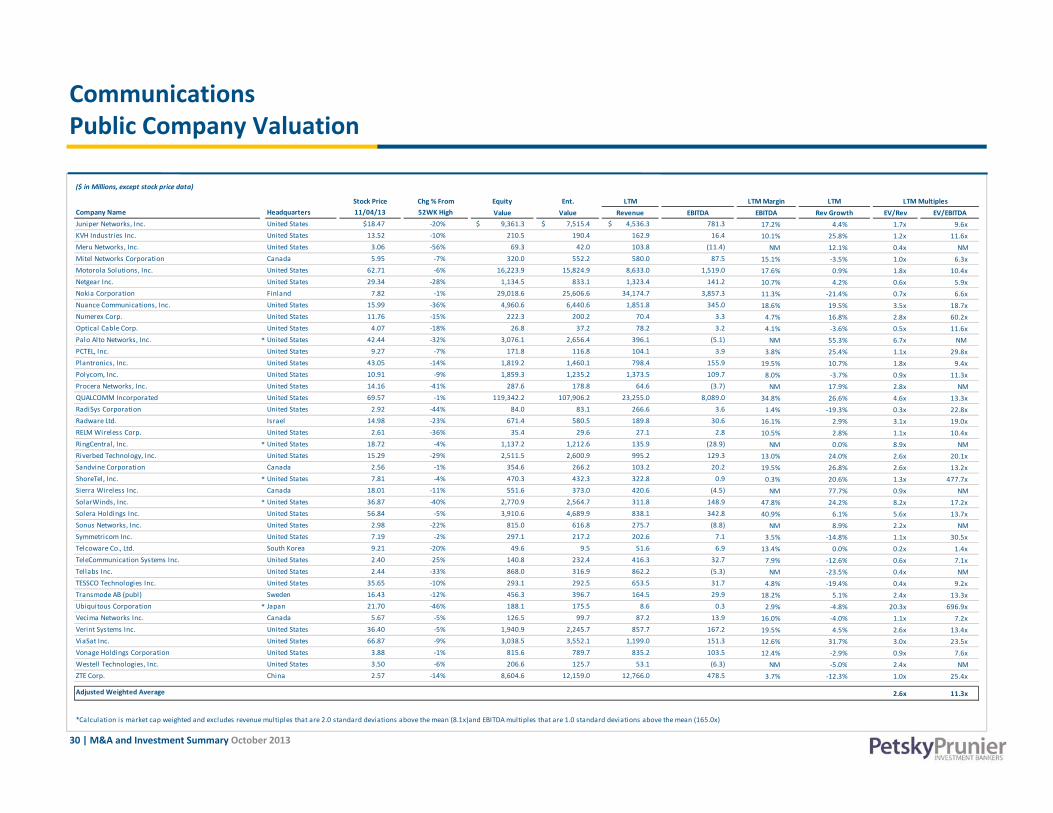
CommunicationsPublic Company Valuation
($ in Millions, except stock price data)
Stock Price Chg % From Equity Ent. LTM LTM Margin LTM LTM Multiples Company Name Headquarters 11/04/13 52WK High Value Value Revenue EBITDA EBITDA Rev Growth EV/Rev EV/EBITDAAastra Technologies Ltd. Canada $27.87 0% $ 328.8 $ 246.2 $ 582.4 $ 43.8 7.5% ‐5.1% 0.4x 5.6xADTRAN Inc. United States 23.77 ‐15% 1,371.3 1,226.8 622.4 55.4 8.9% ‐5.1% 2.0x 22.1xAlcatel‐Lucent, S.A. France 3.86 ‐5% 8,797.7 11,072.3 19,759.1 1,480.7 7.5% 0.7% 0.6x 7.5xAllot Communications Ltd. Israel 13.01 ‐47% 423.5 308.5 95.6 (3.9) NM ‐4.8% 3.2x NM Ambient Corporation United States 2.04 ‐55% 34.0 27.5 26.6 (12.1) NM ‐53.8% 1.0x NM Anaren, Inc. United States 27.75 0% 350.4 299.4 157.9 27.6 17.5% 6.9% 1.9x 10.8xAruba Networks, Inc. United States 18.57 ‐31% 2,044.4 1,629.6 600.0 25.8 4.3% 16.1% 2.7x 63.2xAudioCodes Ltd. Israel 6.30 ‐17% 240.1 205.8 133.8 5.5 4.1% 1.4% 1.5x 37.6xAviat Networks, Inc. United States 2.10 ‐46% 131.0 57.7 449.7 1.1 0.2% 0.5% 0.1x 52.5xAxesstel Inc. United States 0.14 ‐93% 3.5 14.5 43.4 0.5 1.1% ‐29.4% 0.3x 30.8xBlackBerry Limited Canada 6.48 ‐63% 3,337.7 963.4 10,048.0 156.0 1.6% ‐33.1% 0.1x 6.2xBlonder Tongue Laboratories Inc. United States 0.94 ‐44% 5.9 11.6 30.2 (0.2) NM 8.7% 0.4x NM BroadSoft, Inc. United States 33.14 ‐16% 931.8 864.3 169.6 15.6 9.2% 9.4% 5.1x 55.5xBrocade Communications Systems, Inc. United States 8.10 ‐4% 3,581.8 3,390.6 2,242.4 497.6 22.2% 1.5% 1.5x 6.8xCalAmp Corp. United States 24.01 ‐8% 828.6 806.1 205.3 21.1 10.3% 29.7% 3.9x 38.2xCalix Inc. United States 10.30 ‐26% 512.7 433.6 380.0 11.8 3.1% 15.0% 1.1x 36.8xCiena Corporation United States 23.36 ‐16% 2,409.4 3,142.1 1,964.7 115.7 5.9% 7.7% 1.6x 27.2xCisco Systems, Inc. United States 22.58 ‐15% 121,581.2 87,190.2 48,607.0 13,865.0 28.5% 5.5% 1.8x 6.3xClearfield, Inc. United States 14.67 ‐14% 189.2 174.3 44.7 5.4 12.2% 18.4% 3.9x 32.0xClearOne, Inc. United States 9.19 ‐6% 82.6 62.4 48.4 7.6 15.7% 6.7% 1.3x 8.2xCOM DEV International Ltd. Canada 3.98 ‐6% 304.6 300.4 212.1 33.7 15.9% 8.3% 1.4x 8.9x % 15.9% 8.3% 1.4x 8.9xCommScope Holding Company Inc. United States 15.29 ‐4% 2,838.6 5,631.7 3,487.8 657.3 18.8% 0.0% 1.6x 8.6xCommunications Systems Inc. United States 11.11 ‐10% 95.0 78.0 113.8 6.9 6.1% ‐2.8% 0.7x 11.3xCorning Inc. United States 17.26 ‐4% 24,978.7 22,442.7 8,009.0 2,601.0 32.5% 3.3% 2.8x 8.6xCTX Virtual Technologies, Inc. United States 1.87 ‐25% 14.9 15.1 119.2 16.9 14.2% 198.1% 0.1x 0.9xCyan, Inc. United States 4.36 ‐71% 201.7 137.3 125.5 (26.0) NM 58.4% 1.1x NM DDS Wireless International Inc. Canada 1.81 ‐23% 24.9 15.1 35.7 2.7 7.5% ‐15.0% 0.4x 5.7xDigi International Inc. United States 10.43 ‐1% 266.5 178.2 195.4 15.7 8.1% 2.5% 0.9x 11.3xDragonWave Inc. Canada 1.33 ‐63% 66.3 74.9 116.7 (43.8) NM 49.4% 0.6x NM EchoStar Corp United States 47 74 ‐2% 4 278 2 5 128 8 3 176 4 605 5 19 1% 2 8% 1 6x 8 5xEchoStar Corp. United States 47.74 2% 4,278.2 5,128.8 3,176.4 605.5 19.1% ‐2.8% 1.6x 8.5xEmulex Corporation United States 7.70 ‐14% 703.8 598.9 474.1 48.5 10.2% ‐5.7% 1.3x 12.3xEricsson Sweden 11.93 ‐15% 38,321.9 33,166.0 35,381.9 4,218.3 11.9% 1.2% 0.9x 7.9xExtreme Networks Inc. United States 6.30 ‐5% 595.1 395.7 299.3 14.2 4.7% ‐7.2% 1.3x 27.8xF5 Networks, Inc. United States 79.55 ‐26% 6,212.1 5,669.9 1,481.3 470.8 31.8% 7.6% 3.8x 12.0xFinisar Corp. United States 22.90 ‐14% 2,194.5 1,951.8 979.9 100.7 10.3% 3.7% 2.0x 19.4xFleetmatics Group PLC Ireland 31.67 ‐39% 1,128.7 1,047.1 150.0 37.0 24.7% 38.7% 7.0x 28.3xFranklin Wireless Corp. United States 1.78 ‐24% 18.5 8.4 32.8 1.4 4.4% 35.0% 0.3x 5.8xGigamon Inc. United States 32.62 ‐22% 1,013.5 892.0 115.8 (25.9) NM 41.8% 7.7x NM Gogo Inc United States 18 25 8% 1 534 8 1 468 5 271 6 9 4 3 5% 36 2% 5 4 155 9
29 | M&A and Investment Summary October 2013
Gogo Inc. United States 18.25 ‐8% 1,534.8 1,468.5 271.6 9.4 3.5% 36.2% 5.4x 155.9xHarmonic Inc. United States 7.37 ‐11% 743.6 574.3 513.3 31.9 6.2% ‐1.1% 1.1x 18.0xHarris Corporation United States 62.11 ‐1% 6,637.9 7,971.1 5,042.1 1,095.3 21.7% ‐6.2% 1.6x 7.3xInfoblox Inc. * United States 45.36 ‐7% 2,347.1 2,137.8 225.0 3.5 1.6% 33.0% 9.5x 605.3xInteractive Intell igence Group Inc. United States 57.19 ‐15% 1,145.9 1,070.1 279.3 19.3 6.9% 28.5% 3.8x 55.4xJDS Uniphase Corporation United States 13.10 ‐21% 3,043.2 2,504.3 1,685.0 149.1 8.8% ‐0.1% 1.5x 16.8x
CommunicationsPublic Company Valuation
($ in Millions, except stock price data)
Stock Price Chg % From Equity Ent. LTM LTM Margin LTM LTM Multiples Company Name Headquarters 11/04/13 52WK High Value Value Revenue EBITDA EBITDA Rev Growth EV/Rev EV/EBITDAJuniper Networks, Inc. United States $18.47 ‐20% $ 9,361.3 $ 7,515.4 $ 4,536.3 781.3 17.2% 4.4% 1.7x 9.6xKVH Industries Inc. United States 13.52 ‐10% 210.5 190.4 162.9 16.4 10.1% 25.8% 1.2x 11.6xMeru Networks, Inc. United States 3.06 ‐56% 69.3 42.0 103.8 (11.4) NM 12.1% 0.4x NM Mitel Networks Corporation Canada 5.95 ‐7% 320.0 552.2 580.0 87.5 15.1% ‐3.5% 1.0x 6.3xMotorola Solutions, Inc. United States 62.71 ‐6% 16,223.9 15,824.9 8,633.0 1,519.0 17.6% 0.9% 1.8x 10.4xNetgear Inc. United States 29.34 ‐28% 1,134.5 833.1 1,323.4 141.2 10.7% 4.2% 0.6x 5.9xNokia Corporation Finland 7.82 ‐1% 29,018.6 25,606.6 34,174.7 3,857.3 11.3% ‐21.4% 0.7x 6.6xNuance Communications, Inc. United States 15.99 ‐36% 4,960.6 6,440.6 1,851.8 345.0 18.6% 19.5% 3.5x 18.7xNumerex Corp. United States 11.76 ‐15% 222.3 200.2 70.4 3.3 4.7% 16.8% 2.8x 60.2xOptical Cable Corp. United States 4.07 ‐18% 26.8 37.2 78.2 3.2 4.1% ‐3.6% 0.5x 11.6xPalo Alto Networks, Inc. * United States 42.44 ‐32% 3,076.1 2,656.4 396.1 (5.1) NM 55.3% 6.7x NM PCTEL, Inc. United States 9.27 ‐7% 171.8 116.8 104.1 3.9 3.8% 25.4% 1.1x 29.8xPlantronics, Inc. United States 43.05 ‐14% 1,819.2 1,460.1 798.4 155.9 19.5% 10.7% 1.8x 9.4xPolycom, Inc. United States 10.91 ‐9% 1,859.3 1,235.2 1,373.5 109.7 8.0% ‐3.7% 0.9x 11.3xProcera Networks, Inc. United States 14.16 ‐41% 287.6 178.8 64.6 (3.7) NM 17.9% 2.8x NM QUALCOMM Incorporated United States 69.57 ‐1% 119,342.2 107,906.2 23,255.0 8,089.0 34.8% 26.6% 4.6x 13.3xRadiSys Corporation United States 2.92 ‐44% 84.0 83.1 266.6 3.6 1.4% ‐19.3% 0.3x 22.8xRadware Ltd. Israel 14.98 ‐23% 671.4 580.5 189.8 30.6 16.1% 2.9% 3.1x 19.0xRELM Wireless Corp. United States 2.61 ‐36% 35.4 29.6 27.1 2.8 10.5% 2.8% 1.1x 10.4xRingCentral, Inc. * United States 18.72 ‐4% 1,137.2 1,212.6 135.9 (28.9) NM 0.0% 8.9x NM Riverbed Technology, Inc. United States 15.29 ‐29% 2,511.5 2,600.9 995.2 129.3 13.0% 24.0% 2.6x 20.1xgy, % , , 13.0% 24.0% 2.6x 20.1xSandvine Corporation Canada 2.56 ‐1% 354.6 266.2 103.2 20.2 19.5% 26.8% 2.6x 13.2xShoreTel, Inc. * United States 7.81 ‐4% 470.3 432.3 322.8 0.9 0.3% 20.6% 1.3x 477.7xSierra Wireless Inc. Canada 18.01 ‐11% 551.6 373.0 420.6 (4.5) NM 77.7% 0.9x NM SolarWinds, Inc. * United States 36.87 ‐40% 2,770.9 2,564.7 311.8 148.9 47.8% 24.2% 8.2x 17.2xSolera Holdings Inc. United States 56.84 ‐5% 3,910.6 4,689.9 838.1 342.8 40.9% 6.1% 5.6x 13.7xSonus Networks, Inc. United States 2.98 ‐22% 815.0 616.8 275.7 (8.8) NM 8.9% 2.2x NM Symmetricom Inc. United States 7.19 ‐2% 297.1 217.2 202.6 7.1 3.5% ‐14.8% 1.1x 30.5xTelcoware Co., Ltd. South Korea 9.21 ‐20% 49.6 9.5 51.6 6.9 13.4% 0.0% 0.2x 1.4xTeleCommunication Systems Inc United States 2 40 ‐25% 140 8 232 4 416 3 32 7 7 9% 12 6% 0 6x 7 1xTeleCommunication Systems Inc. United States 2.40 25% 140.8 232.4 416.3 32.7 7.9% ‐12.6% 0.6x 7.1xTellabs Inc. United States 2.44 ‐33% 868.0 316.9 862.2 (5.3) NM ‐23.5% 0.4x NM TESSCO Technologies Inc. United States 35.65 ‐10% 293.1 292.5 653.5 31.7 4.8% ‐19.4% 0.4x 9.2xTransmode AB (publ) Sweden 16.43 ‐12% 456.3 396.7 164.5 29.9 18.2% 5.1% 2.4x 13.3xUbiquitous Corporation * Japan 21.70 ‐46% 188.1 175.5 8.6 0.3 2.9% ‐4.8% 20.3x 696.9xVecima Networks Inc. Canada 5.67 ‐5% 126.5 99.7 87.2 13.9 16.0% ‐4.0% 1.1x 7.2xVerint Systems Inc. United States 36.40 ‐5% 1,940.9 2,245.7 857.7 167.2 19.5% 4.5% 2.6x 13.4xViaSat Inc. United States 66.87 ‐9% 3,038.5 3,552.1 1,199.0 151.3 12.6% 31.7% 3.0x 23.5xVonage Holdings Corporation United States 3.88 ‐1% 815.6 789.7 835.2 103.5 12.4% ‐2.9% 0.9x 7.6xWestell Technologies Inc United States 3 50 6% 206 6 125 7 53 1 (6 3) NM 5 0% 2 4 NM
30 | M&A and Investment Summary October 2013
Westell Technologies, Inc. United States 3.50 ‐6% 206.6 125.7 53.1 (6.3) NM ‐5.0% 2.4x NM ZTE Corp. China 2.57 ‐14% 8,604.6 12,159.0 12,766.0 478.5 3.7% ‐12.3% 1.0x 25.4x
2.6x 11.3xAdjusted Weighted Average
*Calculation is market cap weighted and excludes revenue multiples that are 2.0 standard deviations above the mean (8.1x)and EBITDA multiples that are 1.0 standard deviations above the mean (165.0x)
Software
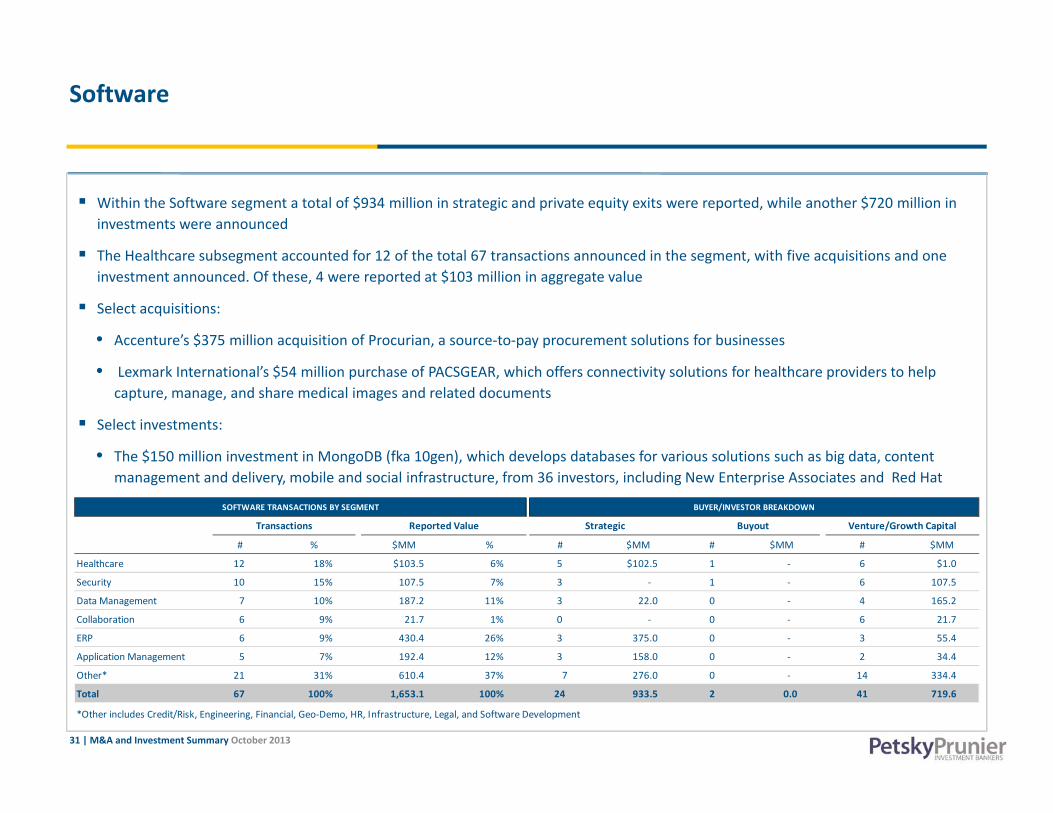
Within the Software segment a total of $934 million in strategic and private equity exits were reported, while another $720 million in investments were announced
Th H lth b t t d f 12 f th t t l 67 t ti d i th t ith fi i iti d The Healthcare subsegment accounted for 12 of the total 67 transactions announced in the segment, with five acquisitions and oneinvestment announced. Of these, 4 were reported at $103 million in aggregate value
Select acquisitions:
• Accenture’s $375 million acquisition of Procurian, a source‐to‐pay procurement solutions for businesses
• Lexmark International’s $54 million purchase of PACSGEAR, which offers connectivity solutions for healthcare providers to help capture, manage, and share medical images and related documents
Select investments:
• The $150 million investment in MongoDB (fka 10gen) which develops databases for various solutions such as big data contentThe $150 million investment in MongoDB (fka 10gen), which develops databases for various solutions such as big data, content management and delivery, mobile and social infrastructure, from 36 investors, including New Enterprise Associates and Red Hat
# % $MM % # $MM # $MM # $MM
H l h 12 18% $103 5 6% 5 $102 5 1 6 $1 0
SOFTWARE TRANSACTIONS BY SEGMENT BUYER/INVESTOR BREAKDOWN
Transactions Reported Value Strategic Buyout Venture/Growth Capital
Healthcare 12 18% $103.5 6% 5 $102.5 1 ‐ 6 $1.0
Security 10 15% 107.5 7% 3 ‐ 1 ‐ 6 107.5
Data Management 7 10% 187.2 11% 3 22.0 0 ‐ 4 165.2
Collaboration 6 9% 21.7 1% 0 ‐ 0 ‐ 6 21.7
ERP 6 9% 430.4 26% 3 375.0 0 ‐ 3 55.4
Application Management 5 7% 192.4 12% 3 158.0 0 ‐ 2 34.4
31 | M&A and Investment Summary October 2013
Other* 21 31% 610.4 37% 7 276.0 0 ‐ 14 334.4
Total 67 100% 1,653.1 100% 24 933.5 2 0.0 41 719.6
*Other includes Credit/Risk, Engineering, Financial, Geo‐Demo, HR, Infrastructure, Legal, and Software Development
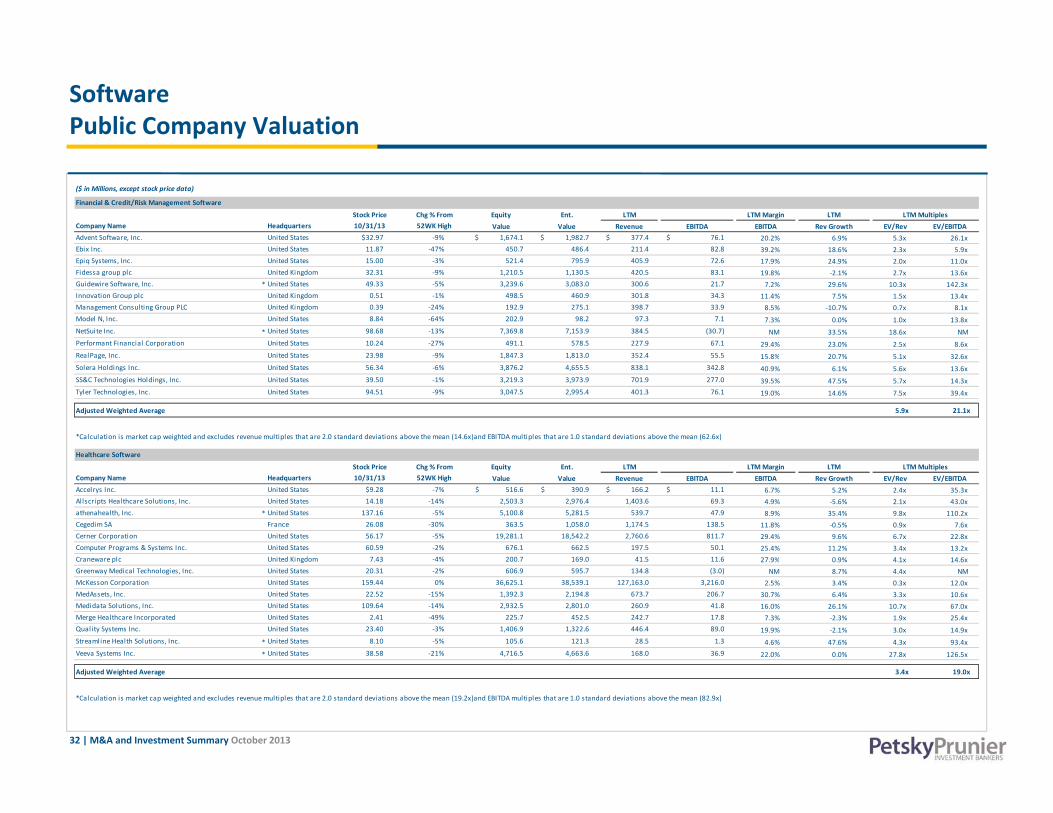
SoftwarePublic Company Valuation
($ in Millions, except stock price data)
Stock Price Chg % From Equity Ent. LTM LTM Margin LTM LTM Multiples Company Name Headquarters 10/31/13 52WK High Value Value Revenue EBITDA EBITDA Rev Growth EV/Rev EV/EBITDAAdvent Software, Inc. United States $32.97 ‐9% $ 1,674.1 $ 1,982.7 $ 377.4 $ 76.1 20.2% 6.9% 5.3x 26.1xEbix Inc. United States 11.87 ‐47% 450.7 486.4 211.4 82.8 39.2% 18.6% 2.3x 5.9x
Financial & Credit/Risk Management Software
Epiq Systems, Inc. United States 15.00 ‐3% 521.4 795.9 405.9 72.6 17.9% 24.9% 2.0x 11.0xFidessa group plc United Kingdom 32.31 ‐9% 1,210.5 1,130.5 420.5 83.1 19.8% ‐2.1% 2.7x 13.6xGuidewire Software, Inc. * United States 49.33 ‐5% 3,239.6 3,083.0 300.6 21.7 7.2% 29.6% 10.3x 142.3xInnovation Group plc United Kingdom 0.51 ‐1% 498.5 460.9 301.8 34.3 11.4% 7.5% 1.5x 13.4xManagement Consulting Group PLC United Kingdom 0.39 ‐24% 192.9 275.1 398.7 33.9 8.5% ‐10.7% 0.7x 8.1xModel N, Inc. United States 8.84 ‐64% 202.9 98.2 97.3 7.1 7.3% 0.0% 1.0x 13.8xNetSuite Inc. * United States 98.68 ‐13% 7,369.8 7,153.9 384.5 (30.7) NM 33.5% 18.6x NM Performant Financial Corporation United States 10.24 ‐27% 491.1 578.5 227.9 67.1 29.4% 23.0% 2.5x 8.6xRealPage Inc United States 23 98 9% 1 847 3 1 813 0 352 4 55 5 15 8% 20 7% 5 1x 32 6xRealPage, Inc. United States 23.98 ‐9% 1,847.3 1,813.0 352.4 55.5 15.8% 20.7% 5.1x 32.6xSolera Holdings Inc. United States 56.34 ‐6% 3,876.2 4,655.5 838.1 342.8 40.9% 6.1% 5.6x 13.6xSS&C Technologies Holdings, Inc. United States 39.50 ‐1% 3,219.3 3,973.9 701.9 277.0 39.5% 47.5% 5.7x 14.3xTyler Technologies, Inc. United States 94.51 ‐9% 3,047.5 2,995.4 401.3 76.1 19.0% 14.6% 7.5x 39.4x
Adjusted Weighted Average 5.9x 21.1x
Healthcare Software
*Calculation is market cap weighted and excludes revenue multiples that are 2.0 standard deviations above the mean (14.6x)and EBITDA multiples that are 1.0 standard deviations above the mean (62.6x)
Stock Price Chg % From Equity Ent. LTM LTM Margin LTM LTM Multiples Company Name Headquarters 10/31/13 52WK High Value Value Revenue EBITDA EBITDA Rev Growth EV/Rev EV/EBITDAAccelrys Inc. United States $9.28 ‐7% $ 516.6 $ 390.9 $ 166.2 $ 11.1 6.7% 5.2% 2.4x 35.3xAllscripts Healthcare Solutions, Inc. United States 14.18 ‐14% 2,503.3 2,976.4 1,403.6 69.3 4.9% ‐5.6% 2.1x 43.0xathenahealth, Inc. * United States 137.16 ‐5% 5,100.8 5,281.5 539.7 47.9 8.9% 35.4% 9.8x 110.2xCegedim SA France 26.08 ‐30% 363.5 1,058.0 1,174.5 138.5 11.8% ‐0.5% 0.9x 7.6xCerner Corporation United States 56.17 ‐5% 19,281.1 18,542.2 2,760.6 811.7 29.4% 9.6% 6.7x 22.8xComputer Programs & Systems Inc. United States 60.59 ‐2% 676.1 662.5 197.5 50.1 25.4% 11.2% 3.4x 13.2xCraneware plc United Kingdom 7 43 ‐4% 200 7 169 0 41 5 11 6 27 9% 0 9% 4 1x 14 6xCraneware plc United Kingdom 7.43 4% 200.7 169.0 41.5 11.6 27.9% 0.9% 4.1x 14.6xGreenway Medical Technologies, Inc. United States 20.31 ‐2% 606.9 595.7 134.8 (3.0) NM 8.7% 4.4x NM McKesson Corporation United States 159.44 0% 36,625.1 38,539.1 127,163.0 3,216.0 2.5% 3.4% 0.3x 12.0xMedAssets, Inc. United States 22.52 ‐15% 1,392.3 2,194.8 673.7 206.7 30.7% 6.4% 3.3x 10.6xMedidata Solutions, Inc. United States 109.64 ‐14% 2,932.5 2,801.0 260.9 41.8 16.0% 26.1% 10.7x 67.0xMerge Healthcare Incorporated United States 2.41 ‐49% 225.7 452.5 242.7 17.8 7.3% ‐2.3% 1.9x 25.4xQuality Systems Inc. United States 23.40 ‐3% 1,406.9 1,322.6 446.4 89.0 19.9% ‐2.1% 3.0x 14.9xStreamline Health Solutions, Inc. * United States 8.10 ‐5% 105.6 121.3 28.5 1.3 4.6% 47.6% 4.3x 93.4xVeeva Systems Inc. * United States 38.58 ‐21% 4,716.5 4,663.6 168.0 36.9 22.0% 0.0% 27.8x 126.5x
32 | M&A and Investment Summary October 2013
Adjusted Weighted Average 3.4x 19.0x
*Calculation is market cap weighted and excludes revenue multiples that are 2.0 standard deviations above the mean (19.2x)and EBITDA multiples that are 1.0 standard deviations above the mean (82.9x)
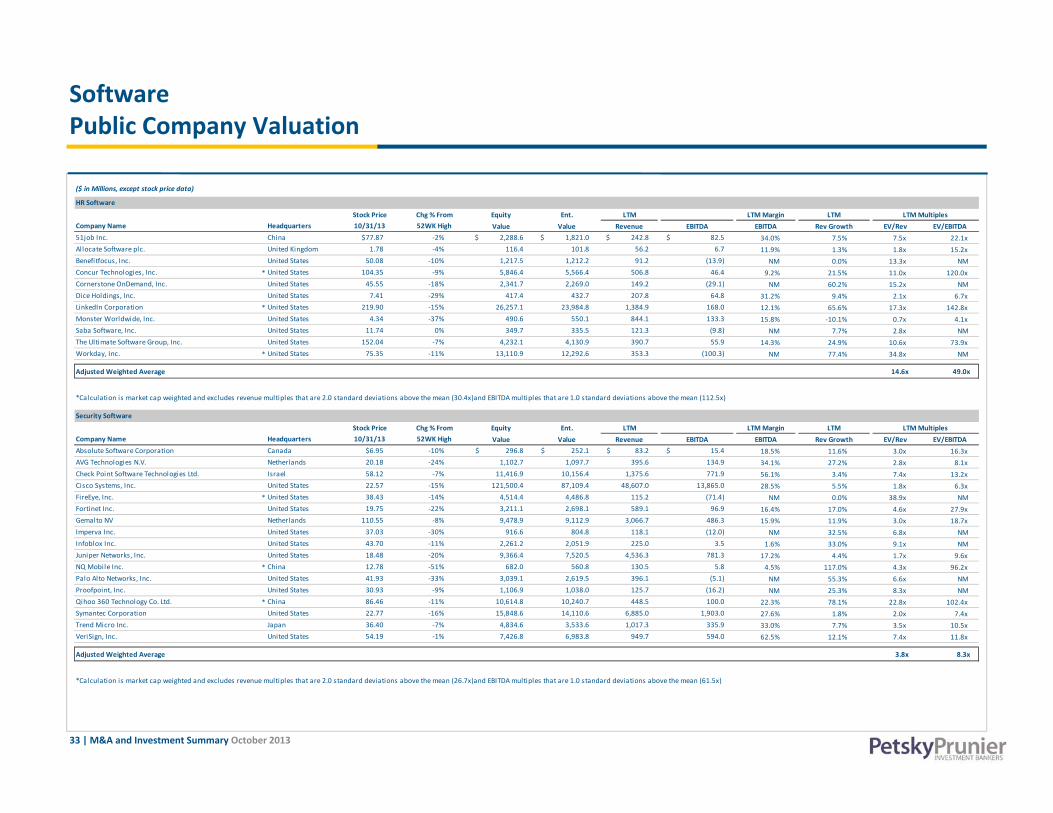
SoftwarePublic Company Valuation
($ in Millions, except stock price data)
HR Software
Stock Price Chg % From Equity Ent. LTM LTM Margin LTM LTM Multiples Company Name Headquarters 10/31/13 52WK High Value Value Revenue EBITDA EBITDA Rev Growth EV/Rev EV/EBITDA51job Inc. China $77.87 ‐2% $ 2,288.6 $ 1,821.0 $ 242.8 $ 82.5 34.0% 7.5% 7.5x 22.1xAllocate Software plc. United Kingdom 1.78 ‐4% 116.4 101.8 56.2 6.7 11.9% 1.3% 1.8x 15.2xBenefitfocus, Inc. United States 50.08 ‐10% 1,217.5 1,212.2 91.2 (13.9) NM 0.0% 13.3x NM Concur Technologies, Inc. * United States 104.35 ‐9% 5,846.4 5,566.4 506.8 46.4 9.2% 21.5% 11.0x 120.0xCornerstone OnDemand, Inc. United States 45.55 ‐18% 2,341.7 2,269.0 149.2 (29.1) NM 60.2% 15.2x NM Dice Holdings, Inc. United States 7.41 ‐29% 417.4 432.7 207.8 64.8 31.2% 9.4% 2.1x 6.7xLinkedIn Corporation * United States 219.90 ‐15% 26,257.1 23,984.8 1,384.9 168.0 12.1% 65.6% 17.3x 142.8xMonster Worldwide, Inc. United States 4.34 ‐37% 490.6 550.1 844.1 133.3 15.8% ‐10.1% 0.7x 4.1xSaba Software, Inc. United States 11.74 0% 349.7 335.5 121.3 (9.8) NM 7.7% 2.8x NM The Ultimate Software Group, Inc. United States 152.04 ‐7% 4,232.1 4,130.9 390.7 55.9 14.3% 24.9% 10.6x 73.9xWorkday, Inc. * United States 75.35 ‐11% 13,110.9 12,292.6 353.3 (100.3) NM 77 4% 34 8x NMWorkday, Inc. United States 75.35 11% 13,110.9 12,292.6 353.3 (100.3) NM 77.4% 34.8x NM
Adjusted Weighted Average 14.6x 49.0x
Security Software
Stock Price Chg % From Equity Ent. LTM LTM Margin LTM LTM Multiples Company Name Headquarters 10/31/13 52WK High Value Value Revenue EBITDA EBITDA Rev Growth EV/Rev EV/EBITDAAbsolute Software Corporation Canada $6.95 ‐10% $ 296.8 $ 252.1 $ 83.2 $ 15.4 18.5% 11.6% 3.0x 16.3x
*Calculation is market cap weighted and excludes revenue multiples that are 2.0 standard deviations above the mean (30.4x)and EBITDA multiples that are 1.0 standard deviations above the mean (112.5x)
AVG Technologies N.V. Netherlands 20.18 ‐24% 1,102.7 1,097.7 395.6 134.9 34.1% 27.2% 2.8x 8.1xCheck Point Software Technologies Ltd. Israel 58.12 ‐7% 11,416.9 10,156.4 1,375.6 771.9 56.1% 3.4% 7.4x 13.2xCisco Systems, Inc. United States 22.57 ‐15% 121,500.4 87,109.4 48,607.0 13,865.0 28.5% 5.5% 1.8x 6.3xFireEye, Inc. * United States 38.43 ‐14% 4,514.4 4,486.8 115.2 (71.4) NM 0.0% 38.9x NM Fortinet Inc. United States 19.75 ‐22% 3,211.1 2,698.1 589.1 96.9 16.4% 17.0% 4.6x 27.9xGemalto NV Netherlands 110.55 ‐8% 9,478.9 9,112.9 3,066.7 486.3 15.9% 11.9% 3.0x 18.7xImperva Inc. United States 37.03 ‐30% 916.6 804.8 118.1 (12.0) NM 32.5% 6.8x NM Infoblox Inc. United States 43.70 ‐11% 2,261.2 2,051.9 225.0 3.5 1.6% 33.0% 9.1x NM Juniper Networks, Inc. United States 18.48 ‐20% 9,366.4 7,520.5 4,536.3 781.3 17.2% 4.4% 1.7x 9.6xNQ Mobile Inc. * China 12.78 ‐51% 682.0 560.8 130.5 5.8 4.5% 117.0% 4.3x 96.2xPalo Alto Networks, Inc. United States 41.93 ‐33% 3,039.1 2,619.5 396.1 (5.1) NM 55.3% 6.6x NM Proofpoint, Inc. United States 30.93 ‐9% 1,106.9 1,038.0 125.7 (16.2) NM 25.3% 8.3x NM Qihoo 360 Technology Co. Ltd. * China 86.46 ‐11% 10,614.8 10,240.7 448.5 100.0 22.3% 78.1% 22.8x 102.4xSymantec Corporation United States 22.77 ‐16% 15,848.6 14,110.6 6,885.0 1,903.0 27.6% 1.8% 2.0x 7.4xTrend Micro Inc. Japan 36.40 ‐7% 4,834.6 3,533.6 1,017.3 335.9 33.0% 7.7% 3.5x 10.5xVeriSign, Inc. United States 54.19 ‐1% 7,426.8 6,983.8 949.7 594.0 62.5% 12.1% 7.4x 11.8x
Adjusted Weighted Average 3.8x 8.3x
33 | M&A and Investment Summary October 2013
*Calculation is market cap weighted and excludes revenue multiples that are 2.0 standard deviations above the mean (26.7x)and EBITDA multiples that are 1.0 standard deviations above the mean (61.5x)
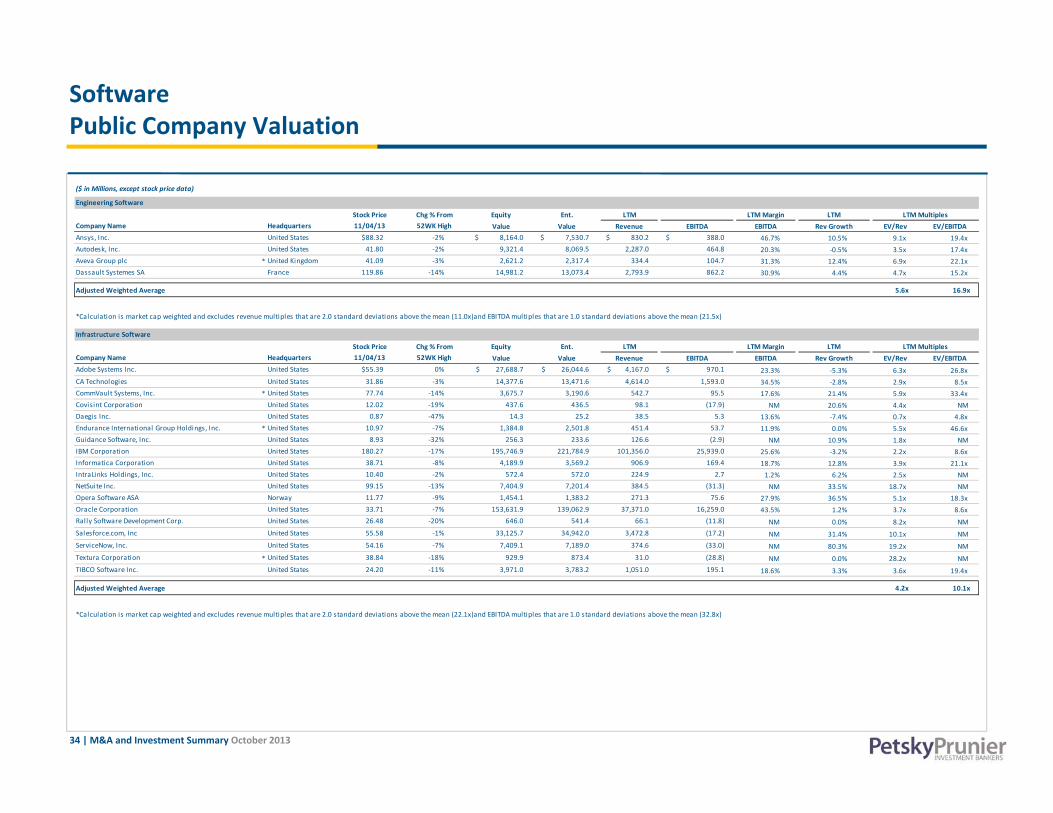
SoftwarePublic Company Valuation
($ in Millions, except stock price data)
Engineering Software
Stock Price Chg % From Equity Ent. LTM LTM Margin LTM LTM Multiples Company Name Headquarters 11/04/13 52WK High Value Value Revenue EBITDA EBITDA Rev Growth EV/Rev EV/EBITDAAnsys, Inc. United States $88.32 ‐2% $ 8,164.0 $ 7,530.7 $ 830.2 $ 388.0 46.7% 10.5% 9.1x 19.4xAutodesk, Inc. United States 41.80 ‐2% 9,321.4 8,069.5 2,287.0 464.8 20.3% ‐0.5% 3.5x 17.4xAveva Group plc * United Kingdom 41.09 ‐3% 2,621.2 2,317.4 334.4 104.7 31.3% 12.4% 6.9x 22.1xDassault Systemes SA France 119.86 ‐14% 14,981.2 13,073.4 2,793.9 862.2 30.9% 4.4% 4.7x 15.2x
Adjusted Weighted Average 5.6x 16.9x
Infrastructure Software
Stock Price Chg % From Equity Ent. LTM LTM Margin LTM LTM Multiples C N H d 11/04/13 52WK Hi h l l h / /
*Calculation is market cap weighted and excludes revenue multiples that are 2.0 standard deviations above the mean (11.0x)and EBITDA multiples that are 1.0 standard deviations above the mean (21.5x)
Company Name Headquarters 11/04/13 52WK High Value Value Revenue EBITDA EBITDA Rev Growth EV/Rev EV/EBITDAAdobe Systems Inc. United States $55.39 0% $ 27,688.7 $ 26,044.6 $ 4,167.0 $ 970.1 23.3% ‐5.3% 6.3x 26.8xCA Technologies United States 31.86 ‐3% 14,377.6 13,471.6 4,614.0 1,593.0 34.5% ‐2.8% 2.9x 8.5xCommVault Systems, Inc. * United States 77.74 ‐14% 3,675.7 3,190.6 542.7 95.5 17.6% 21.4% 5.9x 33.4xCovisint Corporation United States 12.02 ‐19% 437.6 436.5 98.1 (17.9) NM 20.6% 4.4x NM Daegis Inc. United States 0.87 ‐47% 14.3 25.2 38.5 5.3 13.6% ‐7.4% 0.7x 4.8xEndurance International Group Holdings, Inc. * United States 10.97 ‐7% 1,384.8 2,501.8 451.4 53.7 11.9% 0.0% 5.5x 46.6xGuidance Software, Inc. United States 8.93 ‐32% 256.3 233.6 126.6 (2.9) NM 10.9% 1.8x NM IBM Corporation United States 180.27 ‐17% 195,746.9 221,784.9 101,356.0 25,939.0 25.6% ‐3.2% 2.2x 8.6xInformatica Corporation United States 38.71 ‐8% 4,189.9 3,569.2 906.9 169.4 18.7% 12.8% 3.9x 21.1xIntraLinks Holdings, Inc. United States 10.40 ‐2% 572.4 572.0 224.9 2.7 1.2% 6.2% 2.5x NM NetSuite Inc. United States 99.15 ‐13% 7,404.9 7,201.4 384.5 (31.3) NM 33.5% 18.7x NM Opera Software ASA Norway 11.77 ‐9% 1,454.1 1,383.2 271.3 75.6 27.9% 36.5% 5.1x 18.3xOracle Corporation United States 33.71 ‐7% 153,631.9 139,062.9 37,371.0 16,259.0 43.5% 1.2% 3.7x 8.6xRally Software Development Corp. United States 26.48 ‐20% 646.0 541.4 66.1 (11.8) NM 0.0% 8.2x NM Salesforce.com, Inc United States 55.58 ‐1% 33,125.7 34,942.0 3,472.8 (17.2) NM 31.4% 10.1x NM ServiceNow, Inc. United States 54.16 ‐7% 7,409.1 7,189.0 374.6 (33.0) NM 80.3% 19.2x NM Textura Corporation * United States 38.84 ‐18% 929.9 873.4 31.0 (28.8) NM 0.0% 28.2x NMp ( ) NM 0.0% 28.2x NM TIBCO Software Inc. United States 24.20 ‐11% 3,971.0 3,783.2 1,051.0 195.1 18.6% 3.3% 3.6x 19.4x
Adjusted Weighted Average 4.2x 10.1x
*Calculation is market cap weighted and excludes revenue multiples that are 2.0 standard deviations above the mean (22.1x)and EBITDA multiples that are 1.0 standard deviations above the mean (32.8x)
34 | M&A and Investment Summary October 2013
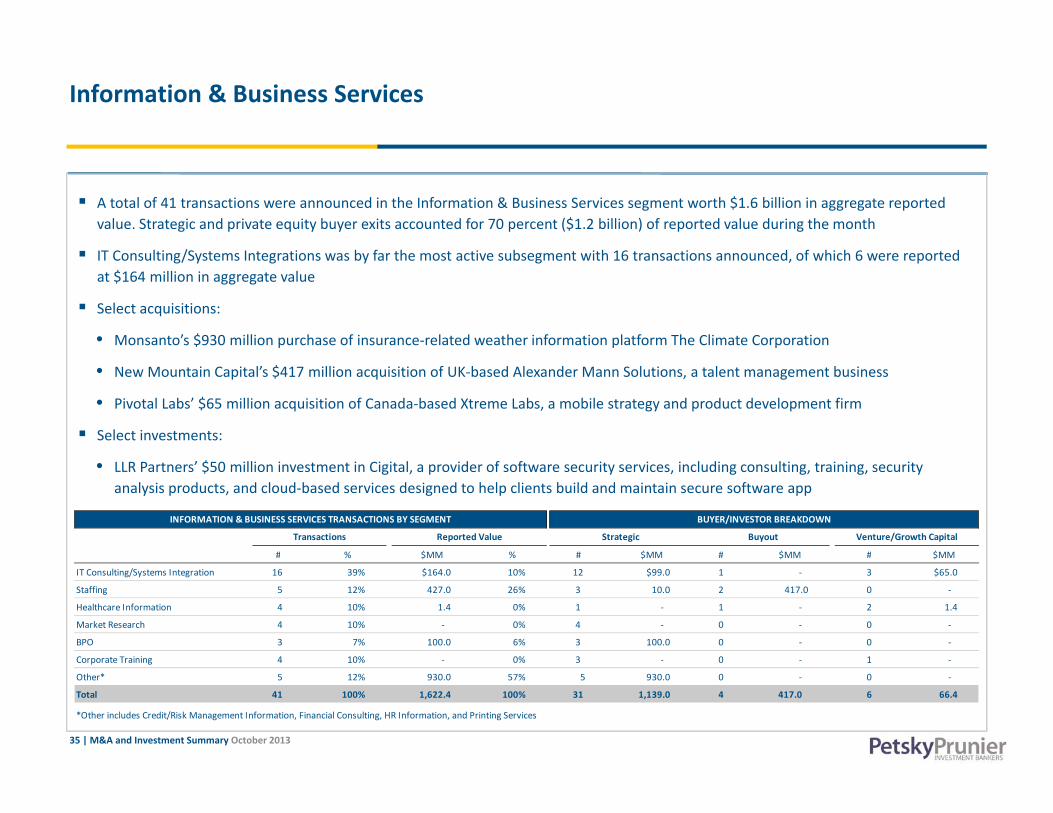
Information & Business Services
A total of 41 transactions were announced in the Information & Business Services segment worth $1.6 billion in aggregate reported value. Strategic and private equity buyer exits accounted for 70 percent ($1.2 billion) of reported value during the month
IT C lti /S t I t ti b f th t ti b t ith 16 t ti d f hi h 6 t d IT Consulting/Systems Integrations was by far the most active subsegment with 16 transactions announced, of which 6 were reported at $164 million in aggregate value
Select acquisitions:
• Monsanto’s $930 million purchase of insurance‐related weather information platform The Climate Corporation
• New Mountain Capital’s $417 million acquisition of UK‐based Alexander Mann Solutions, a talent management business
• Pivotal Labs’ $65 million acquisition of Canada‐based Xtreme Labs, a mobile strategy and product development firm
Select investments:
• LLR Partners’ $50 million investment in Cigital, a provider of software security services, including consulting, training, security analysis products, and cloud‐based services designed to help clients build and maintain secure software app
# % $MM % # $MM # $MM # $MM
INFORMATION & BUSINESS SERVICES TRANSACTIONS BY SEGMENT BUYER/INVESTOR BREAKDOWN
Transactions Reported Value Strategic Buyout Venture/Growth Capital
IT Consulting/Systems Integration 16 39% $164.0 10% 12 $99.0 1 ‐ 3 $65.0
Staffing 5 12% 427.0 26% 3 10.0 2 417.0 0 ‐
Healthcare Information 4 10% 1.4 0% 1 ‐ 1 ‐ 2 1.4
Market Research 4 10% ‐ 0% 4 ‐ 0 ‐ 0 ‐
BPO 3 7% 100.0 6% 3 100.0 0 ‐ 0 ‐
Corporate Training 4 10% ‐ 0% 3 ‐ 0 ‐ 1 ‐
35 | M&A and Investment Summary October 2013
p g
Other* 5 12% 930.0 57% 5 930.0 0 ‐ 0 ‐
Total 41 100% 1,622.4 100% 31 1,139.0 4 417.0 6 66.4
*Other includes Credit/Risk Management Information, Financial Consulting, HR Information, and Printing Services
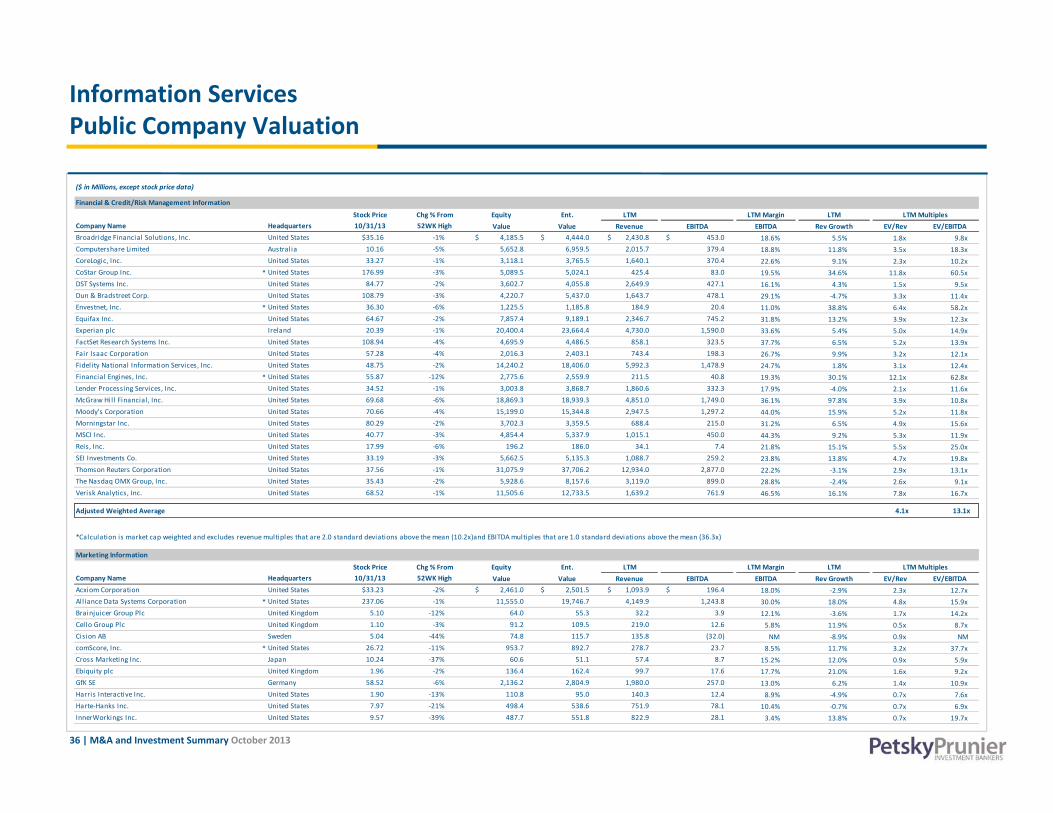
Information ServicesPublic Company Valuation
($ in Millions, except stock price data)
Stock Price Chg % From Equity Ent. LTM LTM Margin LTM LTM Multiples Company Name Headquarters 10/31/13 52WK High Value Value Revenue EBITDA EBITDA Rev Growth EV/Rev EV/EBITDABroadridge Financial Solutions, Inc. United States $35.16 ‐1% $ 4,185.5 $ 4,444.0 $ 2,430.8 $ 453.0 18.6% 5.5% 1.8x 9.8xComputershare Limited Australia 10.16 ‐5% 5,652.8 6,959.5 2,015.7 379.4 18.8% 11.8% 3.5x 18.3x
Financial & Credit/Risk Management Information
CoreLogic, Inc. United States 33.27 ‐1% 3,118.1 3,765.5 1,640.1 370.4 22.6% 9.1% 2.3x 10.2xCoStar Group Inc. * United States 176.99 ‐3% 5,089.5 5,024.1 425.4 83.0 19.5% 34.6% 11.8x 60.5xDST Systems Inc. United States 84.77 ‐2% 3,602.7 4,055.8 2,649.9 427.1 16.1% 4.3% 1.5x 9.5xDun & Bradstreet Corp. United States 108.79 ‐3% 4,220.7 5,437.0 1,643.7 478.1 29.1% ‐4.7% 3.3x 11.4xEnvestnet, Inc. * United States 36.30 ‐6% 1,225.5 1,185.8 184.9 20.4 11.0% 38.8% 6.4x 58.2xEquifax Inc. United States 64.67 ‐2% 7,857.4 9,189.1 2,346.7 745.2 31.8% 13.2% 3.9x 12.3xExperian plc Ireland 20.39 ‐1% 20,400.4 23,664.4 4,730.0 1,590.0 33.6% 5.4% 5.0x 14.9xFactSet Research Systems Inc. United States 108.94 ‐4% 4,695.9 4,486.5 858.1 323.5 37.7% 6.5% 5.2x 13.9xFair Isaac Corporation United States 57.28 ‐4% 2,016.3 2,403.1 743.4 198.3 26 7% 9 9% 3 2x 12 1xFair Isaac Corporation United States 57.28 4% 2,016.3 2,403.1 743.4 198.3 26.7% 9.9% 3.2x 12.1xFidelity National Information Services, Inc. United States 48.75 ‐2% 14,240.2 18,406.0 5,992.3 1,478.9 24.7% 1.8% 3.1x 12.4xFinancial Engines, Inc. * United States 55.87 ‐12% 2,775.6 2,559.9 211.5 40.8 19.3% 30.1% 12.1x 62.8xLender Processing Services, Inc. United States 34.52 ‐1% 3,003.8 3,868.7 1,860.6 332.3 17.9% ‐4.0% 2.1x 11.6xMcGraw Hill Financial, Inc. United States 69.68 ‐6% 18,869.3 18,939.3 4,851.0 1,749.0 36.1% 97.8% 3.9x 10.8xMoody's Corporation United States 70.66 ‐4% 15,199.0 15,344.8 2,947.5 1,297.2 44.0% 15.9% 5.2x 11.8xMorningstar Inc. United States 80.29 ‐2% 3,702.3 3,359.5 688.4 215.0 31.2% 6.5% 4.9x 15.6xMSCI Inc. United States 40.77 ‐3% 4,854.4 5,337.9 1,015.1 450.0 44.3% 9.2% 5.3x 11.9xReis, Inc. United States 17.99 ‐6% 196.2 186.0 34.1 7.4 21.8% 15.1% 5.5x 25.0xSEI Investments Co United States 33 19 3% 5 662 5 5 135 3 1 088 7 259 2 23 8% 13 8% 4 7x 19 8xSEI Investments Co. United States 33.19 ‐3% 5,662.5 5,135.3 1,088.7 259.2 23.8% 13.8% 4.7x 19.8xThomson Reuters Corporation United States 37.56 ‐1% 31,075.9 37,706.2 12,934.0 2,877.0 22.2% ‐3.1% 2.9x 13.1xThe Nasdaq OMX Group, Inc. United States 35.43 ‐2% 5,928.6 8,157.6 3,119.0 899.0 28.8% ‐2.4% 2.6x 9.1xVerisk Analytics, Inc. United States 68.52 ‐1% 11,505.6 12,733.5 1,639.2 761.9 46.5% 16.1% 7.8x 16.7x
Adjusted Weighted Average 4.1x 13.1x
Marketing Information
*Calculation is market cap weighted and excludes revenue multiples that are 2.0 standard deviations above the mean (10.2x)and EBITDA multiples that are 1.0 standard deviations above the mean (36.3x)
Stock Price Chg % From Equity Ent. LTM LTM Margin LTM LTM Multiples Company Name Headquarters 10/31/13 52WK High Value Value Revenue EBITDA EBITDA Rev Growth EV/Rev EV/EBITDAAcxiom Corporation United States $33.23 ‐2% $ 2,461.0 $ 2,501.5 $ 1,093.9 $ 196.4 18.0% ‐2.9% 2.3x 12.7xAlliance Data Systems Corporation * United States 237.06 ‐1% 11,555.0 19,746.7 4,149.9 1,243.8 30.0% 18.0% 4.8x 15.9xBrainjuicer Group Plc United Kingdom 5.10 ‐12% 64.0 55.3 32.2 3.9 12.1% ‐3.6% 1.7x 14.2xCello Group Plc United Kingdom 1.10 ‐3% 91.2 109.5 219.0 12.6 5.8% 11.9% 0.5x 8.7xCision AB Sweden 5.04 ‐44% 74.8 115.7 135.8 (32.0) NM ‐8.9% 0.9x NM comScore, Inc. * United States 26.72 ‐11% 953.7 892.7 278.7 23.7 8.5% 11.7% 3.2x 37.7xCross Marketing Inc. Japan 10.24 ‐37% 60.6 51.1 57.4 8.7 15.2% 12.0% 0.9x 5.9x
36 | M&A and Investment Summary October 2013
Ebiquity plc United Kingdom 1.96 ‐2% 136.4 162.4 99.7 17.6 17.7% 21.0% 1.6x 9.2xGfK SE Germany 58.52 ‐6% 2,136.2 2,804.9 1,980.0 257.0 13.0% 6.2% 1.4x 10.9xHarris Interactive Inc. United States 1.90 ‐13% 110.8 95.0 140.3 12.4 8.9% ‐4.9% 0.7x 7.6xHarte‐Hanks Inc. United States 7.97 ‐21% 498.4 538.6 751.9 78.1 10.4% ‐0.7% 0.7x 6.9xInnerWorkings Inc. United States 9.57 ‐39% 487.7 551.8 822.9 28.1 3.4% 13.8% 0.7x 19.7x

Information Services Public Company Valuation
($ in Millions, except stock price data)
Marketing Information (Contd.)
Stock Price Chg % From Equity Ent. LTM LTM Margin LTM LTM Multiples Company Name Headquarters 10/31/13 52WK High Value Value Revenue EBITDA EBITDA Rev Growth EV/Rev EV/EBITDAIntage Holdings Inc. Japan 13.19 ‐7% 265.3 235.9 406.1 51.6 12.7% 7.3% 0.6x 4.6xIpsos SA France 42.23 ‐6% 1,913.0 2,795.4 2,283.2 261.2 11.4% 7.0% 1.2x 10.7xMacromill, Inc. Japan 6.28 ‐30% 396.0 318.7 172.5 44.0 25.5% 20.3% 1.8x 7.2xNeuStar, Inc. United States 45.92 ‐20% 2,875.5 3,141.8 878.6 369.0 42.0% 11.0% 3.6x 8.5xNielsen Holdings N.V. Netherlands 39.44 ‐2% 14,895.9 21,099.9 5,716.0 1,607.0 28.1% 6.6% 3.7x 13.1xOnvia Inc. United States 4.90 ‐12% 35.9 28.1 21.9 (0.7) NM ‐1.4% 1.3x NM Pearson plc United Kingdom 20.94 ‐4% 16,924.0 20,342.1 7,842.5 1,337.5 17.1% 13.6% 2.6x 15.2xRentrak Corporation United States 37.49 0% 446.6 425.9 104.8 (4.5) NM 14.1% 4.1x NM YouGov PLC United Kingdom 1.37 ‐1% 130.7 120.1 95.0 6.8 7.2% 7.6% 1.3x 17.7x
Adjusted Weighted Average 2.8x 13.8x
Other Information
Stock Price Chg % From Equity Ent. LTM LTM Margin LTM LTM Multiples Company Name Headquarters 10/31/13 52WK High Value Value Revenue EBITDA EBITDA Rev Growth EV/Rev EV/EBITDACentaur Media plc United Kingdom $0.90 ‐9% $ 120.4 $ 151.5 $ 109.4 $ 14.6 13.3% 9.8% 1.4x 10.4xCorporate Executive Board Co. United States 72.90 ‐5% 2,448.9 2,889.4 790.3 175.6 22.2% 40.9% 3.7x 16.5xForrester Research Inc. United States 38.81 ‐6% 784.1 605.4 294.3 37.4 12.7% 0.6% 2.1x 16.2x
*Calculation is market cap weighted and excludes revenue multiples that are 2.0 standard deviations above the mean (4.4x)and EBITDA multiples that are 1.0 standard deviations above the mean (20.1x)
Gartner Inc. United States 58.95 ‐6% 5,491.7 5,371.1 1,702.0 284.3 16.7% 10.5% 3.2x 18.9xIHS Inc. * United States 109.05 ‐7% 7,326.8 9,365.6 1,695.3 367.0 21.6% 14.1% 5.5x 25.5xInforma plc Switzerland 8.98 0% 5,418.0 6,900.4 1,879.5 568.9 30.3% 2.8% 3.7x 12.1xNational Research Corp. United States 27.99 ‐40% 460.4 461.4 90.6 28.3 31.2% 12.3% 5.1x 16.3xNIC Inc. United States 24.62 ‐5% 1,598.0 1,517.3 237.6 63.2 26.6% 23.4% 6.4x 24.0xPremier, Inc. United States 30.81 ‐7% 997.5 604.1 764.3 302.0 39.5% ‐0.5% 0.8x 2.0xProofpoint, Inc. * United States 31.64 ‐7% 1,132.3 1,063.5 125.7 (16.2) NM 25.3% 8.5x NM
Reed Elsevier plc(1) United Kingdom 14.03 0% 30,523.0 37,462.4 9,944.2 3,154.3 31.7% 6.6% 3.8x 11.9xSolera Holdings Inc. United States 56.22 ‐6% 3,867.9 4,647.3 838.1 342.8 40.9% 6.1% 5.5x 13.6xTarsus Group plc Ireland 3.97 0% 381.8 435.3 88.8 26.9 30.3% ‐5.2% 4.9x 16.2xTechTarget, Inc. United States 5.02 ‐16% 194.4 161.9 92.6 7.5 8.2% ‐11.8% 1.7x 21.5xThe Advisory Board Company * United States 68.60 ‐3% 2,458.9 2,418.7 469.9 63.0 13.4% 19.1% 5.1x 38.4xUBM plc United Kingdom 10.97 ‐13% 2,663.3 3,473.0 1,203.3 278.6 23.2% 12.2% 2.9x 12.5xWolters Kluwer NV Netherlands 27.16 ‐1% 8,028.4 11,127.7 4,692.9 1,176.5 25.1% 4.0% 2.4x 9.5x
Adjusted Weighted Average 3.8x 12.8x
(1) All financials are representative of the Reed Elsevier combined businesses, except per stock data, which represents Reed Elsevier (LSE:REL)
37 | M&A and Investment Summary October 2013
*Calculation is market cap weighted and excludes revenue multiples that are 2.0 standard deviations above the mean (7.9x)and EBITDA multiples that are 1.0 standard deviations above the mean (24.8x)
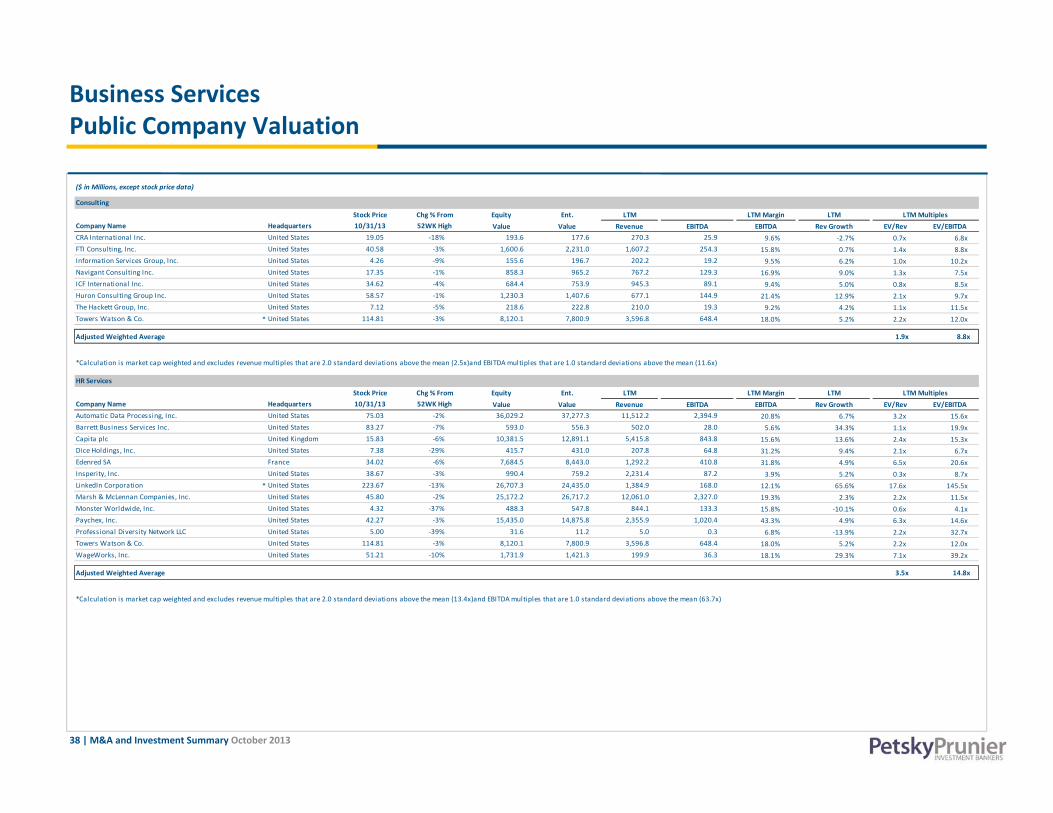
Business Services Public Company Valuation
($ in Millions, except stock price data)
Consulting
Stock Price Chg % From Equity Ent. LTM LTM Margin LTM LTM Multiples Company Name Headquarters 10/31/13 52WK High Value Value Revenue EBITDA EBITDA Rev Growth EV/Rev EV/EBITDACRA International Inc. United States 19.05 ‐18% 193.6 177.6 270.3 25.9 9.6% ‐2.7% 0.7x 6.8xFTI Consulting, Inc. United States 40.58 ‐3% 1,600.6 2,231.0 1,607.2 254.3 15.8% 0.7% 1.4x 8.8xInformation Services Group, Inc. United States 4.26 ‐9% 155.6 196.7 202.2 19.2 9.5% 6.2% 1.0x 10.2xNavigant Consulting Inc. United States 17.35 ‐1% 858.3 965.2 767.2 129.3 16.9% 9.0% 1.3x 7.5xICF International Inc. United States 34.62 ‐4% 684.4 753.9 945.3 89.1 9.4% 5.0% 0.8x 8.5xHuron Consulting Group Inc. United States 58.57 ‐1% 1,230.3 1,407.6 677.1 144.9 21.4% 12.9% 2.1x 9.7xThe Hackett Group, Inc. United States 7.12 ‐5% 218.6 222.8 210.0 19.3 9.2% 4.2% 1.1x 11.5xTowers Watson & Co. * United States 114.81 ‐3% 8,120.1 7,800.9 3,596.8 648.4 18.0% 5.2% 2.2x 12.0x
Adjusted Weighted Average 1.9x 8.8x
HR Services
Stock Price Chg % From Equity Ent. LTM LTM Margin LTM LTM Multiples Company Name Headquarters 10/31/13 52WK High Value Value Revenue EBITDA EBITDA Rev Growth EV/Rev EV/EBITDAAutomatic Data Processing, Inc. United States 75.03 ‐2% 36,029.2 37,277.3 11,512.2 2,394.9 20.8% 6.7% 3.2x 15.6xBarrett Business Services Inc. United States 83.27 ‐7% 593.0 556.3 502.0 28.0 5.6% 34.3% 1.1x 19.9xCapita plc United Kingdom 15.83 ‐6% 10,381.5 12,891.1 5,415.8 843.8 15.6% 13.6% 2.4x 15.3xDice Holdings, Inc. United States 7.38 ‐29% 415.7 431.0 207.8 64.8 31.2% 9.4% 2.1x 6.7x
*Calculation is market cap weighted and excludes revenue multiples that are 2.0 standard deviations above the mean (2.5x)and EBITDA multiples that are 1.0 standard deviations above the mean (11.6x)
Edenred SA France 34.02 ‐6% 7,684.5 8,443.0 1,292.2 410.8 31.8% 4.9% 6.5x 20.6xInsperity, Inc. United States 38.67 ‐3% 990.4 759.2 2,231.4 87.2 3.9% 5.2% 0.3x 8.7xLinkedIn Corporation * United States 223.67 ‐13% 26,707.3 24,435.0 1,384.9 168.0 12.1% 65.6% 17.6x 145.5xMarsh & McLennan Companies, Inc. United States 45.80 ‐2% 25,172.2 26,717.2 12,061.0 2,327.0 19.3% 2.3% 2.2x 11.5xMonster Worldwide, Inc. United States 4.32 ‐37% 488.3 547.8 844.1 133.3 15.8% ‐10.1% 0.6x 4.1xPaychex, Inc. United States 42.27 ‐3% 15,435.0 14,875.8 2,355.9 1,020.4 43.3% 4.9% 6.3x 14.6xProfessional Diversity Network LLC United States 5.00 ‐39% 31.6 11.2 5.0 0.3 6.8% ‐13.9% 2.2x 32.7xTowers Watson & Co. United States 114.81 ‐3% 8,120.1 7,800.9 3,596.8 648.4 18.0% 5.2% 2.2x 12.0xWageWorks, Inc. United States 51.21 ‐10% 1,731.9 1,421.3 199.9 36.3 18.1% 29.3% 7.1x 39.2x
Adjusted Weighted Average 3.5x 14.8x
*Calculation is market cap weighted and excludes revenue multiples that are 2.0 standard deviations above the mean (13.4x)and EBITDA multiples that are 1.0 standard deviations above the mean (63.7x)
38 | M&A and Investment Summary October 2013
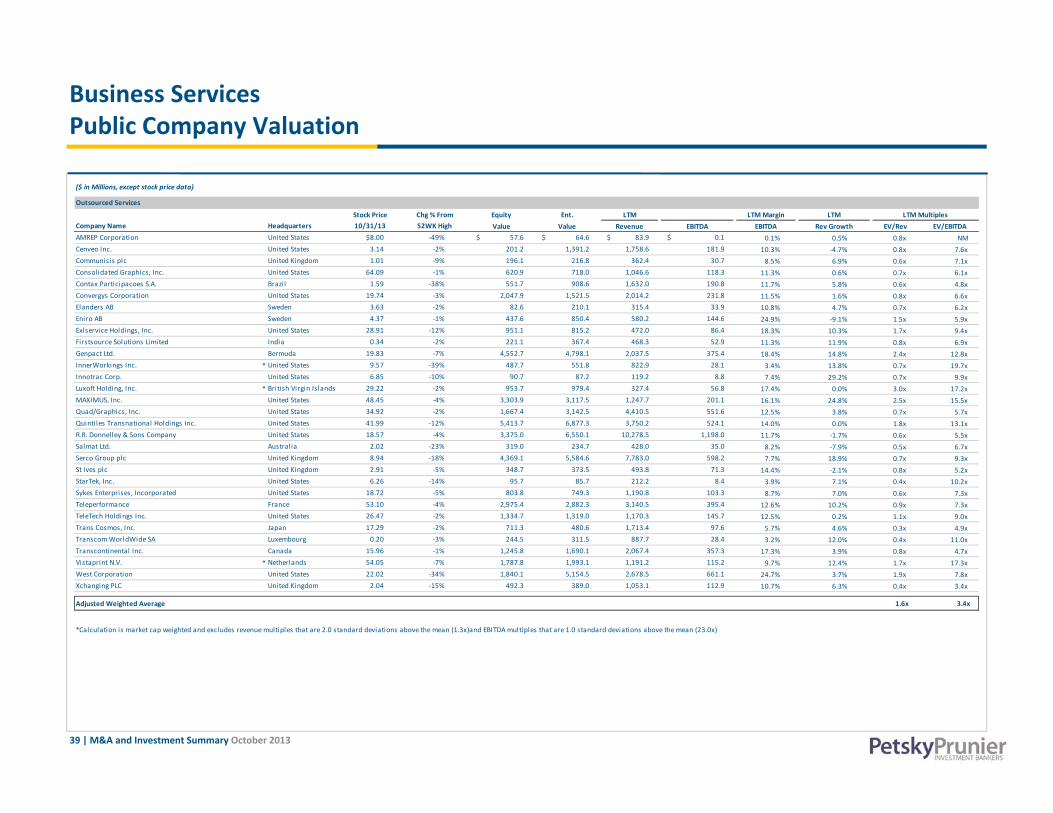
Business Services Public Company Valuation
($ in Millions, except stock price data)
Outsourced Services
Stock Price Chg % From Equity Ent. LTM LTM Margin LTM LTM Multiples Company Name Headquarters 10/31/13 52WK High Value Value Revenue EBITDA EBITDA Rev Growth EV/Rev EV/EBITDAAMREP Corporation United States $8.00 ‐49% $ 57.6 $ 64.6 $ 83.9 $ 0.1 0.1% 0.5% 0.8x NM Cenveo Inc. United States 3.14 ‐2% 201.2 1,391.2 1,758.6 181.9 10.3% ‐4.7% 0.8x 7.6xCommunisis plc United Kingdom 1.01 ‐9% 196.1 216.8 362.4 30.7 8.5% 6.9% 0.6x 7.1xConsolidated Graphics, Inc. United States 64.09 ‐1% 620.9 718.0 1,046.6 118.3 11.3% 0.6% 0.7x 6.1xContax Participacoes S.A. Brazil 1.59 ‐38% 551.7 908.6 1,632.0 190.8 11.7% 5.8% 0.6x 4.8xConvergys Corporation United States 19.74 ‐3% 2,047.9 1,521.5 2,014.2 231.8 11.5% 1.6% 0.8x 6.6xElanders AB Sweden 3.63 ‐2% 82.6 210.1 315.4 33.9 10.8% 4.7% 0.7x 6.2xEniro AB Sweden 4.37 ‐1% 437.6 850.4 580.2 144.6 24.9% ‐9.1% 1.5x 5.9xExlservice Holdings, Inc. United States 28.91 ‐12% 951.1 815.2 472.0 86.4 18.3% 10.3% 1.7x 9.4xFirstsource Solutions Limited India 0.34 ‐2% 221.1 367.4 468.3 52.9 11.3% 11.9% 0.8x 6.9xGenpact Ltd. Bermuda 19.83 ‐7% 4,552.7 4,798.1 2,037.5 375.4 18 4% 14 8% 2 4x 12 8xGenpact Ltd. Bermuda 19.83 7% 4,552.7 4,798.1 2,037.5 375.4 18.4% 14.8% 2.4x 12.8xInnerWorkings Inc. * United States 9.57 ‐39% 487.7 551.8 822.9 28.1 3.4% 13.8% 0.7x 19.7xInnotrac Corp. United States 6.85 ‐10% 90.7 87.2 119.2 8.8 7.4% 29.2% 0.7x 9.9xLuxoft Holding, Inc. * British Virgin Islands 29.22 ‐2% 953.7 979.4 327.4 56.8 17.4% 0.0% 3.0x 17.2xMAXIMUS, Inc. United States 48.45 ‐4% 3,303.9 3,117.5 1,247.7 201.1 16.1% 24.8% 2.5x 15.5xQuad/Graphics, Inc. United States 34.92 ‐2% 1,667.4 3,142.5 4,410.5 551.6 12.5% 3.8% 0.7x 5.7xQuintiles Transnational Holdings Inc. United States 41.99 ‐12% 5,413.7 6,877.3 3,750.2 524.1 14.0% 0.0% 1.8x 13.1xR.R. Donnelley & Sons Company United States 18.57 ‐4% 3,375.0 6,550.1 10,278.5 1,198.0 11.7% ‐1.7% 0.6x 5.5xSalmat Ltd. Australia 2.02 ‐23% 319.0 234.7 428.0 35.0 8.2% ‐7.9% 0.5x 6.7xSerco Group plc United Kingdom 8 94 18% 4 369 1 5 584 6 7 783 0 598 2 7 7% 18 9% 0 7x 9 3xSerco Group plc United Kingdom 8.94 ‐18% 4,369.1 5,584.6 7,783.0 598.2 7.7% 18.9% 0.7x 9.3xSt Ives plc United Kingdom 2.91 ‐5% 348.7 373.5 493.8 71.3 14.4% ‐2.1% 0.8x 5.2xStarTek, Inc. United States 6.26 ‐14% 95.7 85.7 212.2 8.4 3.9% 7.1% 0.4x 10.2xSykes Enterprises, Incorporated United States 18.72 ‐5% 803.8 749.3 1,190.8 103.3 8.7% 7.0% 0.6x 7.3xTeleperformance France 53.10 ‐4% 2,975.4 2,882.3 3,140.5 395.4 12.6% 10.2% 0.9x 7.3xTeleTech Holdings Inc. United States 26.47 ‐2% 1,334.7 1,319.0 1,170.3 145.7 12.5% 0.2% 1.1x 9.0xTrans Cosmos, Inc. Japan 17.29 ‐2% 711.3 480.6 1,713.4 97.6 5.7% 4.6% 0.3x 4.9xTranscom WorldWide SA Luxembourg 0.20 ‐3% 244.5 311.5 887.7 28.4 3.2% 12.0% 0.4x 11.0xTranscontinental Inc. Canada 15.96 ‐1% 1,245.8 1,690.1 2,067.4 357.3 17.3% 3.9% 0.8x 4.7xVi t i t N V * N th l d 54 05 7% 1 787 8 1 993 1 1 191 2 115 2 9 % 12 4% 1 1 3Vistaprint N.V. * Netherlands 54.05 ‐7% 1,787.8 1,993.1 1,191.2 115.2 9.7% 12.4% 1.7x 17.3xWest Corporation United States 22.02 ‐34% 1,840.1 5,154.5 2,678.5 661.1 24.7% 3.7% 1.9x 7.8xXchanging PLC United Kingdom 2.04 ‐15% 492.3 389.0 1,053.1 112.9 10.7% 6.3% 0.4x 3.4x
Adjusted Weighted Average 1.6x 3.4x
*Calculation is market cap weighted and excludes revenue multiples that are 2.0 standard deviations above the mean (1.3x)and EBITDA multiples that are 1.0 standard deviations above the mean (23.0x)
39 | M&A and Investment Summary October 2013
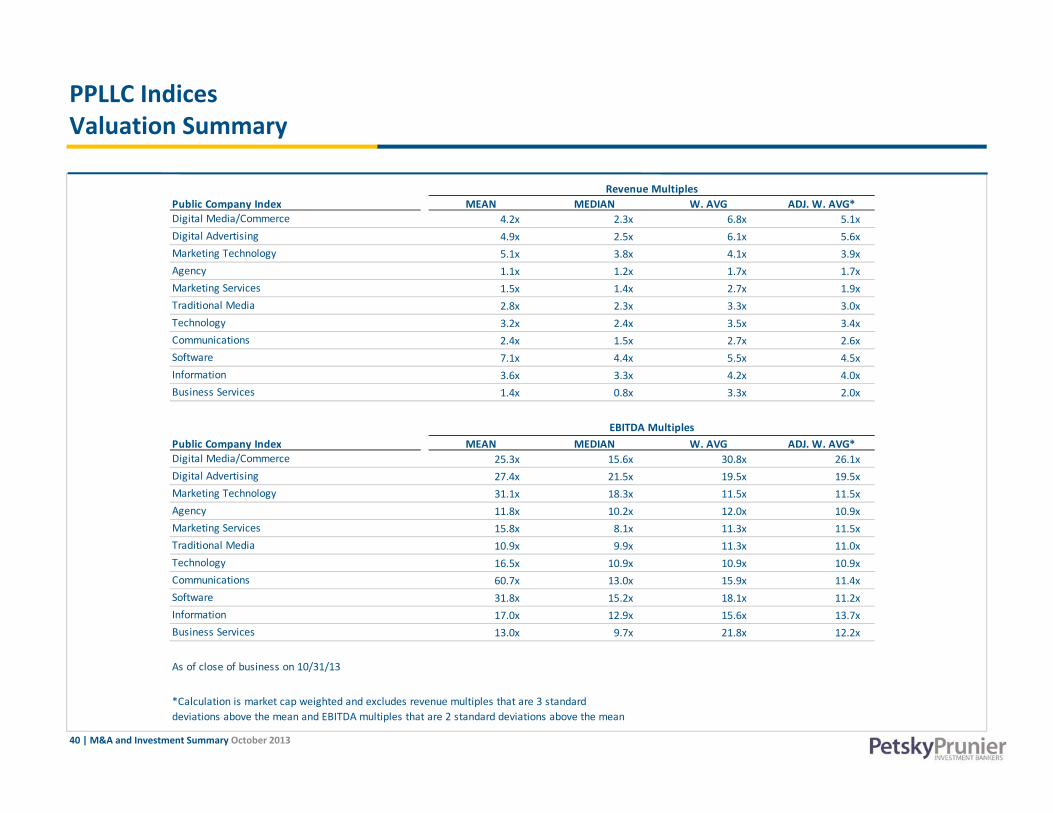
PPLLC Indices Valuation Summary
Public Company Index MEAN MEDIAN W. AVG ADJ. W. AVG*Digital Media/Commerce 4.2x 2.3x 6.8x 5.1xDigital Advertising 4.9x 2.5x 6.1x 5.6xMarketing Technology 5 1x 3 8x 4 1x 3 9x
Revenue Multiples
Marketing Technology 5.1x 3.8x 4.1x 3.9xAgency 1.1x 1.2x 1.7x 1.7xMarketing Services 1.5x 1.4x 2.7x 1.9xTraditional Media 2.8x 2.3x 3.3x 3.0xTechnology 3.2x 2.4x 3.5x 3.4xCommunications 2.4x 1.5x 2.7x 2.6xSoft are 7 1 4 4 5 5 4 5Software 7.1x 4.4x 5.5x 4.5xInformation 3.6x 3.3x 4.2x 4.0xBusiness Services 1.4x 0.8x 3.3x 2.0x
Public Company Index MEAN MEDIAN W. AVG ADJ. W. AVG*Digital Media/Commerce 25 3x 15 6x 30 8x 26 1x
EBITDA Multiples
Digital Media/Commerce 25.3x 15.6x 30.8x 26.1xDigital Advertising 27.4x 21.5x 19.5x 19.5xMarketing Technology 31.1x 18.3x 11.5x 11.5xAgency 11.8x 10.2x 12.0x 10.9xMarketing Services 15.8x 8.1x 11.3x 11.5xTraditional Media 10.9x 9.9x 11.3x 11.0xT h l 16 5 10 9 10 9 10 9Technology 16.5x 10.9x 10.9x 10.9xCommunications 60.7x 13.0x 15.9x 11.4xSoftware 31.8x 15.2x 18.1x 11.2xInformation 17.0x 12.9x 15.6x 13.7xBusiness Services 13.0x 9.7x 21.8x 12.2x
A f l f b i 10/31/13
40 | M&A and Investment Summary October 2013
deviations above the mean and EBITDA multiples that are 2 standard deviations above the mean
As of close of business on 10/31/13
*Calculation is market cap weighted and excludes revenue multiples that are 3 standard
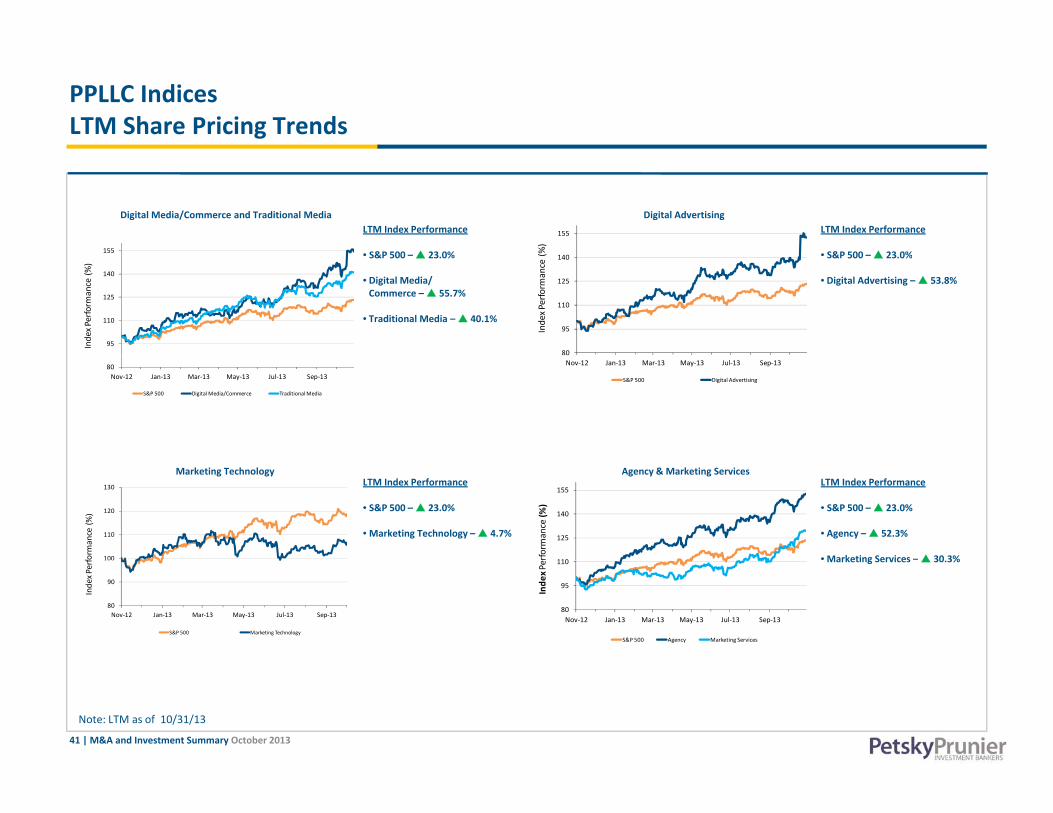
PPLLC IndicesLTM Share Pricing Trends
LTM Index Performance
S&P 500 23 0%
LTM Index Performance
S&P 500 23 0%
Digital Media/Commerce and Traditional Media Digital Advertising
155
155
%)
• S&P 500 – 23.0%
• Digital Media/ Commerce – 55.7%
• Traditional Media – 40.1%
• S&P 500 – 23.0%
• Digital Advertising – 53.8%
95
110
125
140
Index P
erform
ance (%
)
80
95
110
125
140
Index P
erform
ance (%
80Nov‐12 Jan‐13 Mar‐13 May‐13 Jul‐13 Sep‐13
S&P 500 Digital Media/Commerce Traditional Media
Nov‐12 Jan‐13 Mar‐13 May‐13 Jul‐13 Sep‐13
S&P 500 Digital Advertising
LTM Index Performance
• S&P 500 – 23.0%
• Marketing Technology – 4.7%
LTM Index Performance
• S&P 500 – 23.0%
• Agency – 52.3%
• Marketing Services – 30 3%
Agency & Marketing ServicesMarketing Technology
100
110
120
130
form
ance (%
)
110
125
140
155
rform
ance
(%)
Marketing Services 30.3%
80
90
Nov‐12 Jan‐13 Mar‐13 May‐13 Jul‐13 Sep‐13
Index P
erf
S&P 500 Marketing Technology
80
95
110
Nov‐12 Jan‐13 Mar‐13 May‐13 Jul‐13 Sep‐13
Inde
x Pe
S&P 500 Agency Marketing Services
41 | M&A and Investment Summary October 2013
Note: LTM as of 10/31/13

PPLLC IndicesLTM Share Pricing Trends
LTM Index Performance
S&P 500 23 0%
LTM Index Performance
S&P 500 23 0%
Technology Communications
130
130
140
• S&P 500 – 23.0%
• Technology – 18.7%
• S&P 500 – 23.0%
• Communications – 28.9%
90
100
110
120
Index P
erform
ance (%
)
90
100
110
120
130
Index P
erform
ance (%
)
80Nov‐12 Jan‐13 Mar‐13 May‐13 Jul‐13 Sep‐13
S&P 500 Technology
80Nov‐12 Jan‐13 Mar‐13 May‐13 Jul‐13 Sep‐13
S&P 500 Communications
LTM Index Performance
• S&P 500 – 23.0%
• Software – 17.0%
LTM Index Performance
• S&P 500 – 23.0%
• Information – 35.3%
• Business Services – 31 6%
Information & Business ServicesSoftware
110
120
130
ormance (%
)
120
130
140
150
rmance (%
)
Business Services 31.6%
80
90
100
Nov‐12 Jan‐13 Mar‐13 May‐13 Jul‐13 Sep‐13
Index P
erfo
S&P 500 Software
90
100
110
Nov‐12 Jan‐13 Mar‐13 May‐13 Jul‐13 Sep‐13
Index P
erfor
S&P 500 Information Business Services
42 | M&A and Investment Summary October 2013
Note: LTM as of 10/31/13

All Segments($ in Millions)
Strategic Transactions
Target Target Segment Buyer/Investor Reported TV StrategicValues Disclosed
Supercel l Digi ta l Media/Commerce SOFTBANK Corporation 1,530.0$ Chel lomedia Tradi tional Media AMC Networks , Inc. 1,000.0The Cl imate Corporation Information & Bus iness Services Monsanto Company 930.0Procurian, Inc. Software Accenture plc 375.0Onavo Mobile Ltd. Marketing Technology Facebook 200.0ServiceMesh Software Computer Sciences Corporation 158 0ServiceMesh Software Computer Sciences Corporation 158.0Soluto Software Asurion, Inc. 130.0Wirtualna Polska SA Digi ta l Media/Commerce Grupa o2, Inc. 123.7Aggregate Knowledge, Inc. Marketing Technology NeuStar, Inc. 119.0On The Beach Limited Digi ta l Media/Commerce Inflexion Partners 117.4Confio Software Software SolarWinds 103.0Partners Rx Management, LLC Information & Bus iness Services Magel lan Health Services , Inc. 100.0Just Marketing, Inc. Agency & Marketing Services Chime Communications , PLC 72.1Xtreme Labs Information & Bus iness Services Pivotal Labs 65.0PACSGEAR Inc Software Lexmark Internationa l Inc 54 0PACSGEAR, Inc. Software Lexmark Internationa l , Inc. 54.0Cue Digi ta l Media/Commerce Apple Inc. 40.0Backup Technology Ltd. Technology & Communications iomart Group 37.3Optimal , Inc. Marketing Technology Brand Networks , Inc. 35.0e‐pay As ia Limited Technology & Communications GHL Systems Berhad 34.2CoreMatrix Systems Information & Bus iness Services Perficient, Inc. 31.5Border Media Partners , L.L.C., Eight Radio Stations Tradi tional Media L&L ing, LLC 31.0Perka Digi ta l Media/Commerce Fi rs t Data Corporation 30.0Concui ty, Inc. Software The Advisory Board Company 28.5S dM i l I S ft P f i t I 23 0SendMai l , Inc. Software Proofpoint, Inc. 23.0Multidimens ional Database Management Systems Software Rocket Software, Inc. 22.0Avado, Inc. Software WebMD Health Corporation 20.0Sensory Networks , Inc. Software Intel Corporation 20.0Infrastructure Journa l Tradi tional Media Euromoney Insti tutional Investor plc 20.0Convergent Media Systems Corporation Marketing Technology Bal lantyne Strong, Inc. 16.0Al l s tates Technical Services , LLC Information & Bus iness Services Fus ion Solutions LLC 10.0One iota Limited Marketing Technology Sanderson Multi ‐Channel Solutions 8.7AnyDATA Corp. Technology & Communications Sierra Wireless 5.9
43 | M&A and Investment Summary October 2013
BOX telematics Limited Technology & Communications Trakm8 Holdings plc 5.6BOX telematics Limited Technology & Communications Trakm8 Holdings plc 5.6Noti fy Technology Corporation Technology & Communications Globo Plc 5.0Vernons Games Limited Digi ta l Media/Commerce NetPlay TV plc 4.8OpenCredo Ltd. Information & Bus iness Services Tri fork A/S 2.5Republ ic Project, Inc. Marketing Technology Digi ta l Generation, Inc. 1.4
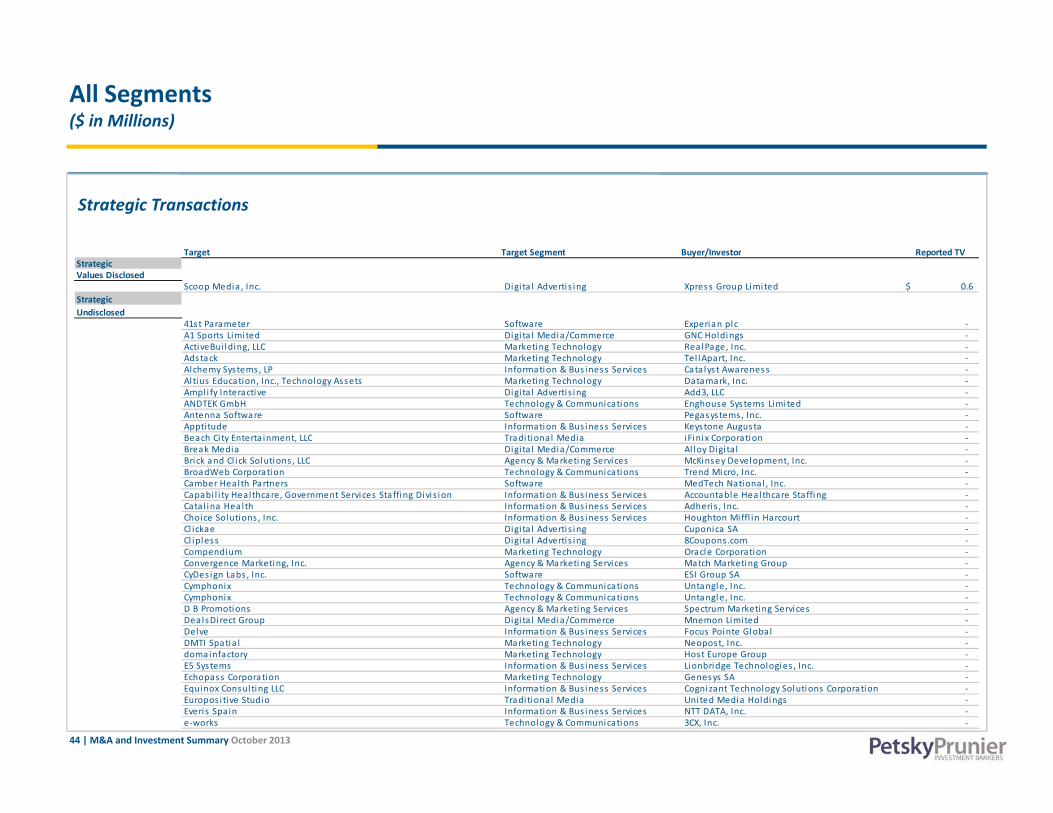
All Segments($ in Millions)
Strategic Transactions
Target Target Segment Buyer/Investor Reported TVTarget Target Segment Buyer/Investor Reported TV StrategicValues Disclosed
Scoop Media, Inc. Digi ta l Adverti s ing Xpress Group Limited 0.6$ StrategicUndisclosed
41st Parameter Software Experian plc ‐ A1 Sports Limited Digi ta l Media/Commerce GNC Holdings ‐ ActiveBui lding, LLC Marketing Technology Rea lPage, Inc. ‐ Ad t k M k ti T h l T l lA t IAdstack Marketing Technology Tel lApart, Inc. ‐ Alchemy Systems, LP Information & Bus iness Services Catalyst Awareness ‐ Altius Education, Inc., Technology Assets Marketing Technology Datamark, Inc. ‐ Ampl i fy Interactive Digi ta l Adverti s ing Add3, LLC ‐ ANDTEK GmbH Technology & Communications Enghouse Systems Limited ‐ Antenna Software Software Pegasystems , Inc. ‐ Apptitude Information & Bus iness Services Keystone Augusta ‐ Beach City Enterta inment, LLC Tradi tional Media iFinix Corporation ‐ Break Media Digi ta l Media/Commerce Al loy Digi ta l ‐ B i k d Cl i k S l ti LLC A & M k ti S i M Ki D l t IBrick and Cl ick Solutions , LLC Agency & Marketing Services McKinsey Development, Inc. ‐ BroadWeb Corporation Technology & Communications Trend Micro, Inc. ‐ Camber Health Partners Software MedTech Nationa l , Inc. ‐ Capabi l i ty Healthcare, Government Services Staffing Divis ion Information & Bus iness Services Accountable Healthcare Staffing ‐ Catal ina Health Information & Bus iness Services Adheris , Inc. ‐ Choice Solutions , Inc. Information & Bus iness Services Houghton Miffl in Harcourt ‐ Cl ickae Digi ta l Adverti s ing Cuponica SA ‐ Cl ipless Digi ta l Adverti s ing 8Coupons.com ‐ Compendium Marketing Technology Oracle Corporation ‐ C M k ti I A & M k ti S i M t h M k ti GConvergence Marketing, Inc. Agency & Marketing Services Match Marketing Group ‐ CyDes ign Labs , Inc. Software ESI Group SA ‐ Cymphonix Technology & Communications Untangle, Inc. ‐ Cymphonix Technology & Communications Untangle, Inc. ‐ D B Promotions Agency & Marketing Services Spectrum Marketing Services ‐ DealsDirect Group Digi ta l Media/Commerce Mnemon Limited ‐ Delve Information & Bus iness Services Focus Pointe Global ‐ DMTI Spatia l Marketing Technology Neopost, Inc. ‐ domainfactory Marketing Technology Host Europe Group ‐ E5 S t I f ti & B i S i Li b id T h l i I
44 | M&A and Investment Summary October 2013
E5 Systems Information & Bus iness Services Lionbridge Technologies , Inc. ‐ Echopass Corporation Marketing Technology Genesys SA ‐ Equinox Consul ting LLC Information & Bus iness Services Cognizant Technology Solutions Corporation ‐ Europos i tive Studio Tradi tional Media United Media Holdings ‐ Everis Spain Information & Bus iness Services NTT DATA, Inc. ‐ e‐works Technology & Communications 3CX, Inc. ‐
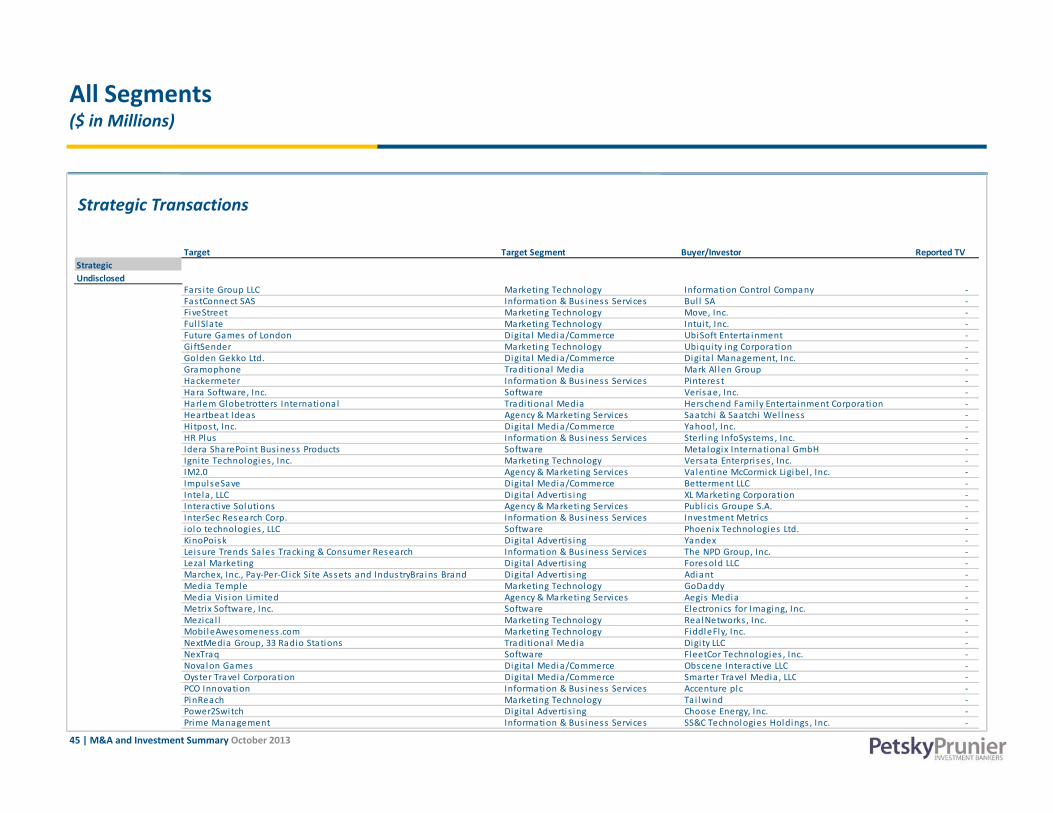
All Segments($ in Millions)
Strategic Transactions
Target Target Segment Buyer/Investor Reported TVTarget Target Segment Buyer/Investor Reported TV StrategicUndisclosed
Fars i te Group LLC Marketing Technology Information Control Company ‐ FastConnect SAS Information & Bus iness Services Bul l SA ‐ FiveStreet Marketing Technology Move, Inc. ‐ Ful lSlate Marketing Technology Intui t, Inc. ‐ Future Games of London Digi ta l Media/Commerce UbiSoft Enterta inment ‐ GiftSender Marketing Technology Ubiqui ty ing Corporation ‐ G ld G kk Ltd Di i t l M di /C Di i t l M t IGolden Gekko Ltd. Digi ta l Media/Commerce Digi ta l Management, Inc. ‐ Gramophone Tradi tional Media Mark Al len Group ‐ Hackermeter Information & Bus iness Services Pinteres t ‐ Hara Software, Inc. Software Verisae, Inc. ‐ Harlem Globetrotters Internationa l Tradi tional Media Herschend Fami ly Enterta inment Corporation ‐ Heartbeat Ideas Agency & Marketing Services Saatchi & Saatchi Wel lness ‐ Hitpost, Inc. Digi ta l Media/Commerce Yahoo!, Inc. ‐ HR Plus Information & Bus iness Services Sterl ing InfoSystems , Inc. ‐ Idera SharePoint Bus iness Products Software Metalogix Internationa l GmbH ‐ I i t T h l i I M k ti T h l V t E t i IIgni te Technologies , Inc. Marketing Technology Versata Enterprises , Inc. ‐ IM2.0 Agency & Marketing Services Valentine McCormick Ligibel , Inc. ‐ ImpulseSave Digi ta l Media/Commerce Betterment LLC ‐ Intela , LLC Digi ta l Adverti s ing XL Marketing Corporation ‐ Interactive Solutions Agency & Marketing Services Publ ici s Groupe S.A. ‐ InterSec Research Corp. Information & Bus iness Services Investment Metrics ‐ iolo technologies , LLC Software Phoenix Technologies Ltd. ‐ KinoPoisk Digi ta l Advertis ing Yandex ‐ Leisure Trends Sa les Tracking & Consumer Research Information & Bus iness Services The NPD Group, Inc. ‐ L l M k ti Di i t l Ad ti i F ld LLCLezal Marketing Digi ta l Adverti s ing Foresold LLC ‐ Marchex, Inc., Pay‐Per‐Cl ick Si te Assets and IndustryBrains Brand Digi ta l Adverti s ing Adiant ‐ Media Temple Marketing Technology GoDaddy ‐ Media Vis ion Limited Agency & Marketing Services Aegis Media ‐ Metrix Software, Inc. Software Electronics for Imaging, Inc. ‐ Mezical l Marketing Technology Rea lNetworks , Inc. ‐ Mobi leAwesomeness .com Marketing Technology FiddleFly, Inc. ‐ NextMedia Group, 33 Radio Stations Tradi tional Media Digi ty LLC ‐ NexTraq Software FleetCor Technologies , Inc. ‐ N l G Di i t l M di /C Ob I t ti LLC
45 | M&A and Investment Summary October 2013
Novalon Games Digi ta l Media/Commerce Obscene Interactive LLC ‐ Oyster Travel Corporation Digi ta l Media/Commerce Smarter Travel Media , LLC ‐ PCO Innovation Information & Bus iness Services Accenture plc ‐ PinReach Marketing Technology Tai lwind ‐ Power2Switch Digi ta l Adverti s ing Choose Energy, Inc. ‐ Prime Management Information & Bus iness Services SS&C Technologies Holdings , Inc. ‐
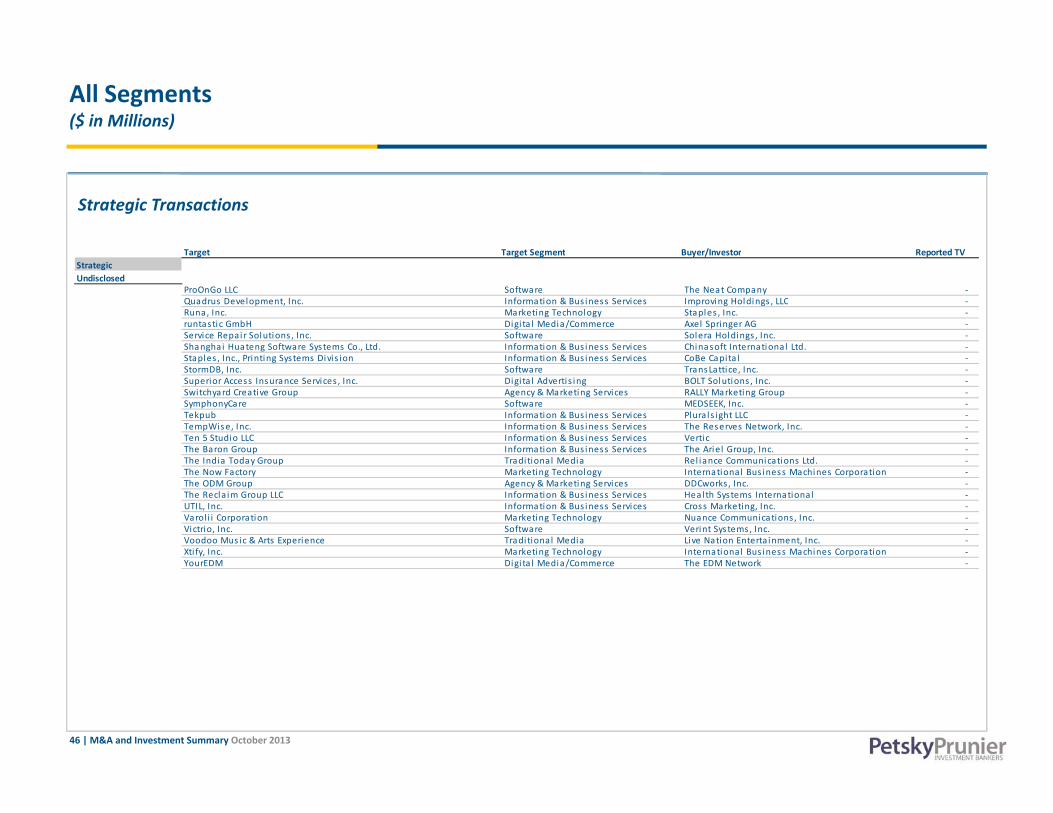
All Segments($ in Millions)
Strategic Transactions
Target Target Segment Buyer/Investor Reported TVTarget Target Segment Buyer/Investor Reported TV StrategicUndisclosed
ProOnGo LLC Software The Neat Company ‐ Quadrus Development, Inc. Information & Bus iness Services Improving Holdings , LLC ‐ Runa, Inc. Marketing Technology Staples , Inc. ‐ runtastic GmbH Digi ta l Media/Commerce Axel Springer AG ‐ Service Repair Solutions , Inc. Software Solera Holdings , Inc. ‐ Shanghai Huateng Software Systems Co., Ltd. Information & Bus iness Services Chinasoft International Ltd. ‐ St l I P i ti S t Di i i I f ti & B i S i C B C it lStaples , Inc., Printing Systems Divis ion Information & Bus iness Services CoBe Capita l ‐ StormDB, Inc. Software TransLattice, Inc. ‐ Superior Access Insurance Services , Inc. Digi ta l Adverti s ing BOLT Solutions , Inc. ‐ Switchyard Creative Group Agency & Marketing Services RALLY Marketing Group ‐ SymphonyCare Software MEDSEEK, Inc. ‐ Tekpub Information & Bus iness Services Plura ls ight LLC ‐ TempWise, Inc. Information & Bus iness Services The Reserves Network, Inc. ‐ Ten 5 Studio LLC Information & Bus iness Services Vertic ‐ The Baron Group Information & Bus iness Services The Ariel Group, Inc. ‐ Th I di T d G T diti l M di R l i C i ti LtdThe India Today Group Tradi tional Media Rel iance Communications Ltd. ‐ The Now Factory Marketing Technology International Bus iness Machines Corporation ‐ The ODM Group Agency & Marketing Services DDCworks , Inc. ‐ The Recla im Group LLC Information & Bus iness Services Heal th Systems International ‐ UTIL, Inc. Information & Bus iness Services Cross Marketing, Inc. ‐ Varol i i Corporation Marketing Technology Nuance Communications , Inc. ‐ Victrio, Inc. Software Verint Systems, Inc. ‐ Voodoo Music & Arts Experience Tradi tional Media Live Nation Enterta inment, Inc. ‐ Xti fy, Inc. Marketing Technology International Bus iness Machines Corporation ‐ Y EDM Di i t l M di /C Th EDM N t kYourEDM Digi ta l Media/Commerce The EDM Network ‐
46 | M&A and Investment Summary October 2013
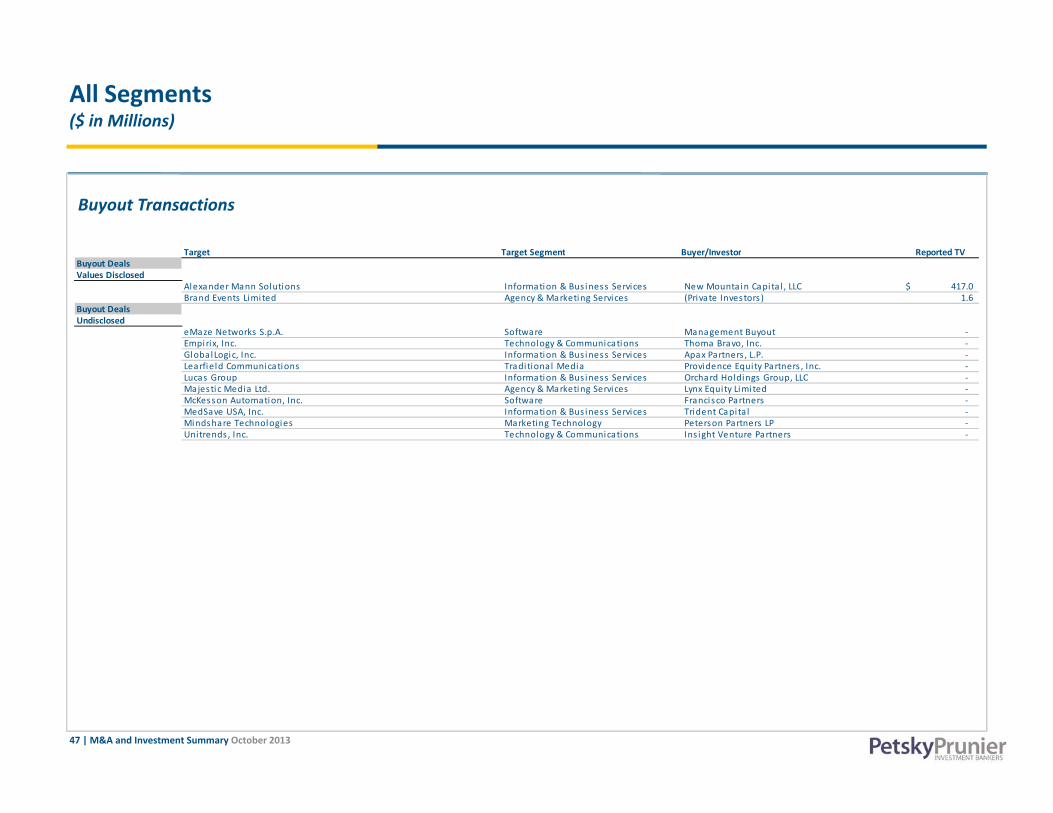
All Segments($ in Millions)
Buyout Transactions
Target Target Segment Buyer/Investor Reported TVTarget Target Segment Buyer/Investor Reported TV Buyout DealsValues Disclosed
Alexander Mann Solutions Information & Bus iness Services New Mountain Capita l , LLC 417.0$ Brand Events Limited Agency & Marketing Services (Private Investors ) 1.6
Buyout DealsUndisclosed
eMaze Networks S.p.A. Software Management Buyout ‐ Empirix, Inc. Technology & Communications Thoma Bravo, Inc. ‐ GlobalLogic Inc Information & Bus iness Services Apax Partners L P ‐GlobalLogic, Inc. Information & Bus iness Services Apax Partners , L.P. ‐ Learfield Communications Tradi tional Media Providence Equity Partners , Inc. ‐ Lucas Group Information & Bus iness Services Orchard Holdings Group, LLC ‐ Majestic Media Ltd. Agency & Marketing Services Lynx Equity Limited ‐ McKesson Automation, Inc. Software Francisco Partners ‐ MedSave USA, Inc. Information & Bus iness Services Trident Capita l ‐ Mindshare Technologies Marketing Technology Peterson Partners LP ‐ Unitrends , Inc. Technology & Communications Ins ight Venture Partners ‐
47 | M&A and Investment Summary October 2013
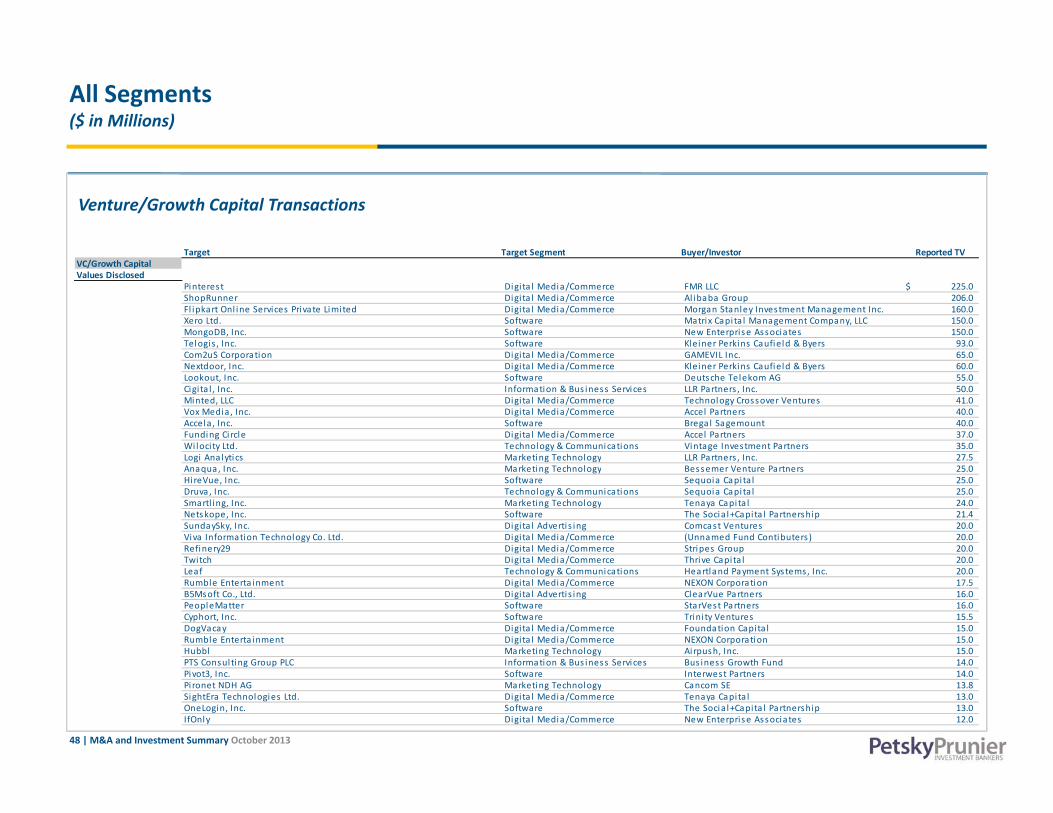
All Segments($ in Millions)
Venture/Growth Capital Transactions
Target Target Segment Buyer/Investor Reported TVTarget Target Segment Buyer/Investor Reported TV VC/Growth CapitalValues Disclosed
Pinterest Digita l Media/Commerce FMR LLC 225.0$ ShopRunner Digita l Media/Commerce Al ibaba Group 206.0Fl ipkart Onl ine Services Private Limited Digita l Media/Commerce Morgan Stanley Investment Management Inc. 160.0Xero Ltd. Software Matrix Capita l Management Company, LLC 150.0MongoDB, Inc. Software New Enterprise Associates 150.0Telogis , Inc. Software Kleiner Perkins Caufield & Byers 93.0Com2uS Corporation Digita l Media/Commerce GAMEVIL Inc 65 0Com2uS Corporation Digita l Media/Commerce GAMEVIL Inc. 65.0Nextdoor, Inc. Digita l Media/Commerce Kleiner Perkins Caufield & Byers 60.0Lookout, Inc. Software Deutsche Telekom AG 55.0Cigi ta l , Inc. Information & Bus iness Services LLR Partners , Inc. 50.0Minted, LLC Digita l Media/Commerce Technology Crossover Ventures 41.0Vox Media , Inc. Digita l Media/Commerce Accel Partners 40.0Accela , Inc. Software Brega l Sagemount 40.0Funding Circle Digita l Media/Commerce Accel Partners 37.0Wi locity Ltd. Technology & Communications Vintage Investment Partners 35.0Logi Ana lytics Marketing Technology LLR Partners Inc 27 5Logi Analytics Marketing Technology LLR Partners , Inc. 27.5Anaqua, Inc. Marketing Technology Bessemer Venture Partners 25.0HireVue, Inc. Software Sequoia Capita l 25.0Druva , Inc. Technology & Communications Sequoia Capita l 25.0Smartl ing, Inc. Marketing Technology Tenaya Capita l 24.0Netskope, Inc. Software The Socia l+Capita l Partnership 21.4SundaySky, Inc. Digita l Adverti s ing Comcast Ventures 20.0Viva Information Technology Co. Ltd. Digita l Media/Commerce (Unnamed Fund Contibuters ) 20.0Refinery29 Digita l Media/Commerce Stripes Group 20.0Twitch Digita l Media/Commerce Thrive Capita l 20 0Twitch Digita l Media/Commerce Thrive Capita l 20.0Leaf Technology & Communications Heartland Payment Systems, Inc. 20.0Rumble Enterta inment Digita l Media/Commerce NEXON Corporation 17.5B5Msoft Co., Ltd. Digita l Advertis ing ClearVue Partners 16.0PeopleMatter Software StarVest Partners 16.0Cyphort, Inc. Software Trini ty Ventures 15.5DogVacay Digita l Media/Commerce Foundation Capita l 15.0Rumble Enterta inment Digita l Media/Commerce NEXON Corporation 15.0Hubbl Marketing Technology Airpush, Inc. 15.0PTS Consul ting Group PLC Information & Bus iness Services Bus iness Growth Fund 14 0
48 | M&A and Investment Summary October 2013
PTS Consul ting Group PLC Information & Bus iness Services Bus iness Growth Fund 14.0Pivot3, Inc. Software Interwest Partners 14.0Pi ronet NDH AG Marketing Technology Cancom SE 13.8SightEra Technologies Ltd. Digita l Media/Commerce Tenaya Capita l 13.0OneLogin, Inc. Software The Socia l+Capita l Partnership 13.0IfOnly Digita l Media/Commerce New Enterprise Associates 12.0
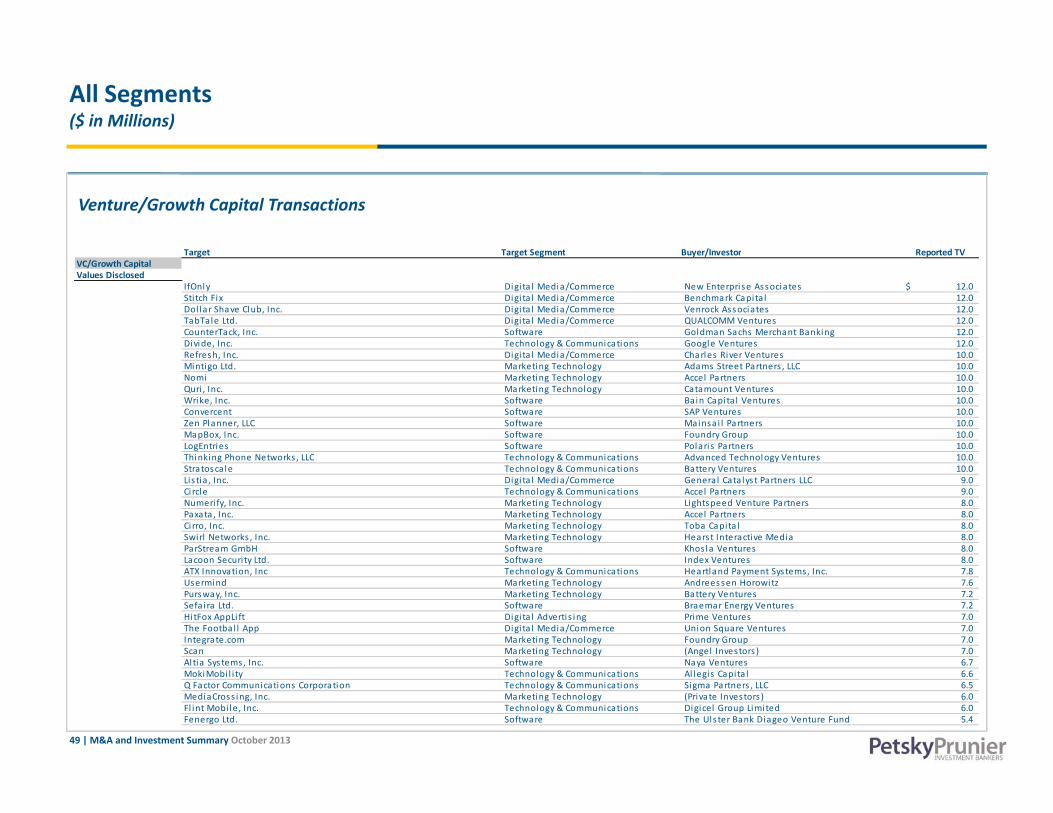
All Segments($ in Millions)
Venture/Growth Capital Transactions
Target Target Segment Buyer/Investor Reported TVTarget Target Segment Buyer/Investor Reported TV VC/Growth CapitalValues Disclosed
IfOnly Digi ta l Media/Commerce New Enterprise Associates 12.0$ Stitch Fix Digi ta l Media/Commerce Benchmark Capita l 12.0Dol lar Shave Club, Inc. Digi ta l Media/Commerce Venrock Associates 12.0TabTale Ltd. Digi ta l Media/Commerce QUALCOMM Ventures 12.0CounterTack, Inc. Software Goldman Sachs Merchant Banking 12.0Divide, Inc. Technology & Communications Google Ventures 12.0Refresh Inc Digi ta l Media/Commerce Charles River Ventures 10 0Refresh, Inc. Digi ta l Media/Commerce Charles River Ventures 10.0Mintigo Ltd. Marketing Technology Adams Street Partners , LLC 10.0Nomi Marketing Technology Accel Partners 10.0Quri , Inc. Marketing Technology Catamount Ventures 10.0Wrike, Inc. Software Bain Capita l Ventures 10.0Convercent Software SAP Ventures 10.0Zen Planner, LLC Software Mainsa i l Partners 10.0MapBox, Inc. Software Foundry Group 10.0LogEntries Software Polaris Partners 10.0Thinking Phone Networks LLC Technology & Communications Advanced Technology Ventures 10 0Thinking Phone Networks , LLC Technology & Communications Advanced Technology Ventures 10.0Stratoscale Technology & Communications Battery Ventures 10.0Lis tia , Inc. Digi ta l Media/Commerce Genera l Cata lys t Partners LLC 9.0Circle Technology & Communications Accel Partners 9.0Numerify, Inc. Marketing Technology Lightspeed Venture Partners 8.0Paxata , Inc. Marketing Technology Accel Partners 8.0Cirro, Inc. Marketing Technology Toba Capita l 8.0Swirl Networks , Inc. Marketing Technology Hearst Interactive Media 8.0ParStream GmbH Software Khos la Ventures 8.0Lacoon Securi ty Ltd Software Index Ventures 8 0Lacoon Securi ty Ltd. Software Index Ventures 8.0ATX Innovation, Inc Technology & Communications Heartland Payment Systems, Inc. 7.8Usermind Marketing Technology Andreessen Horowitz 7.6Pursway, Inc. Marketing Technology Battery Ventures 7.2Sefa i ra Ltd. Software Braemar Energy Ventures 7.2HitFox AppLi ft Digi ta l Adverti s ing Prime Ventures 7.0The Footba l l App Digi ta l Media/Commerce Union Square Ventures 7.0Integrate.com Marketing Technology Foundry Group 7.0Scan Marketing Technology (Angel Investors ) 7.0Altia Sys tems Inc Software Naya Ventures 6 7
49 | M&A and Investment Summary October 2013
Altia Sys tems, Inc. Software Naya Ventures 6.7MokiMobi l i ty Technology & Communications Al legis Capita l 6.6Q Factor Communications Corporation Technology & Communications Sigma Partners , LLC 6.5MediaCross ing, Inc. Marketing Technology (Private Investors ) 6.0Fl int Mobi le, Inc. Technology & Communications Digicel Group Limited 6.0Fenergo Ltd. Software The Ulster Bank Diageo Venture Fund 5.4

All Segments($ in Millions)
Venture/Growth Capital Transactions
Target Target Segment Buyer/Investor Reported TVTarget Target Segment Buyer/Investor Reported TV VC/Growth CapitalValues Disclosed
Madefi re, Inc. Digi ta l Media/Commerce True Ventures 5.2$ Level Money, Inc. Digi ta l Media/Commerce Kleiner Perkins Caufield & Byers 5.0Apps Dai ly Solutions Pvt. Ltd. Marketing Technology ru‐Net 5.0LiquidM, Inc. Marketing Technology Blumberg Capita l 5.0Revenew Marketing Technology Al los Ventures , LLC 5.0Money Forward Software JAFCO Co., Ltd 5.0Cozy Services Ltd Software Genera l Cata lys t Partners LLC 5 0Cozy Services Ltd. Software Genera l Cata lys t Partners LLC 5.0Sparkcentra l Marketing Technology (Unnamed Fund Contibuters ) 4.5Personal , Inc. Technology & Communications Legg Mason, Inc. 4.5Traxo LLC Marketing Technology Advantage Capita l Partners 4.2DanceOn, Inc. Digi ta l Adverti s ing AMC Enterta inment 4.0Shopcade Digi ta l Media/Commerce (Private Investors ) 4.0OpenNews Digi ta l Media/Commerce John S. and James L. Knight Foundation, Inc. 4.0Nutonian, Inc. Software Atlas Venture 4.07s igna l Solutions , Inc. Technology & Communications Al los Ventures , LLC 4.0Idea Device Technologies Pvt Ltd Technology & Communications Sequoia Capita l 4 0Idea Device Technologies Pvt. Ltd. Technology & Communications Sequoia Capita l 4.0Snapverse LLC Digi ta l Media/Commerce (Private Investors ) 3.5Bread Labs , Inc. Marketing Technology Yahoo!, Inc. 3.5LUXA, Inc. Digi ta l Adverti s ing KDDI Group 3.3TempoDB, Inc. Software Hyde Park Venture Partners 3.2Mic Network, Inc. Digi ta l Media/Commerce Lightspeed Venture Partners 3.0ByteLight, Inc. Marketing Technology Flywheel Ventures 3.0Trustev Limited Software Greycroft LLC 3.0Fastacash Pte Ltd. Technology & Communications Jungle Ventures 3.0Jumbuck Enterta inment Ltd Digi ta l Media/Commerce (Private Investors ) 2 8Jumbuck Enterta inment Ltd. Digi ta l Media/Commerce (Private Investors ) 2.8Spl ice Marketing Technology Union Square Ventures 2.8StarMobi le, Inc. Technology & Communications U.S. Venture Partners 2.5Tul ip Reta i l Marketing Technology SoftTech VC, Inc. 2.4Everest, Inc. Digi ta l Media/Commerce (Private Investors ) 2.0Kahuna, Inc. Marketing Technology SoftTech VC, Inc. 2.0Runnable Software Sierra Ventures 2.0Runnable Software Sierra Ventures 2.0RocketBank Technology & Communications Runa Capita l 2.0RocketBank Technology & Communications Runa Capita l 2 0
50 | M&A and Investment Summary October 2013
RocketBank Technology & Communications Runa Capita l 2.0Breathometer, Inc. Technology & Communications Structure Capita l 2.0Smart Checkout Tradi tional Media Prostor Capita l 2.0Gobstopper, Inc. Digi ta l Media/Commerce Relay Ventures 1.8Appoxee Ltd. Marketing Technology Lazarus Is rael Opportuni ties Fund 1.8IRIS.TV Marketing Technology (Angel Investors ) 1.7

All Segments($ in Millions)
Venture/Growth Capital Transactions
Target Target Segment Buyer/Investor Reported TVTarget Target Segment Buyer/Investor Reported TV VC/Growth CapitalValues Disclosed
BloomNation, LLC Digi ta l Media/Commerce Spark Capita l 1.7$ Si lk Marketing Technology New Enterprise Associates 1.6CardFl ight, Inc. Technology & Communications ff Venture Capita l 1.6UpCounsel , Inc. Digi ta l Media/Commerce SV Angel , LLC 1.5Socratic Digi ta l Media/Commerce Spark Capita l 1.5Angol ia Software Index Ventures 1.5Loom Inc Technology & Communications Google Ventures 1 4Loom, Inc. Technology & Communications Google Ventures 1.4Diagnos ia Internet Services GmbH Information & Bus iness Services FFG 1.4Govtoday Digi ta l Media/Commerce AXM Venture Capita l Limited 1.19Lenses Marketing Technology Kinetic Ventures 1.1Rees io, Inc. Software Digi ta l Garage, Inc. 1.1Keepy, Inc. Technology & Communications (Angel Investors ) 1.1Depop Digi ta l Media/Commerce Red Circle Inves tments SRL 1.0Mach 1 Development Information & Bus iness Services (Private Investors ) 1.0adFreeq, LLC Marketing Technology (Unnamed Fund Contibuters ) 1.0Samuday Web Technologies Pvt Ltd Software (Unnamed Fund Contibuters ) 1 0Samuday Web Technologies Pvt. Ltd. Software (Unnamed Fund Contibuters ) 1.0Luminate Health, Inc. Software KEC Holdings LLC 1.0ERN Globa l Limited Technology & Communications (Unnamed Fund Contibuters ) 1.0Socia lSafe Limited Technology & Communications (Private Investors ) 1.01855 SA Digi ta l Media/Commerce Aphrodite SAS 0.8Siamese Systems, Inc. Software (Angel Investors ) 0.6TRAFI Digi ta l Media/Commerce Practica Capita l UAB 0.5
VC/Growth CapitalUndisclosed
Aridhia Informatics Ltd Software Scotti sh Equity Partners ‐Aridhia Informatics Ltd. Software Scotti sh Equity Partners ‐ Convers io Health, LLC Software Heri tage Group, LLC ‐ Declara Software (Private Investors ) ‐ Duet Health LLC Agency & Marketing Services Baird Capita l Partners ‐ EosHealth, Inc. Software 7wire Ventures ‐ Far Glory Marketing Technology Cheer Plan Limited ‐ GamePlan Technologies , Inc. Marketing Technology Invest Nebraska Corporation ‐ NexTech Systems, Inc. Software Francisco Partners ‐ On Center Software, Inc. Software Accel ‐KKR, LLC ‐ PaletteApp Inc Digi ta l Media/Commerce Batterson Venture Capita l LLC ‐
51 | M&A and Investment Summary October 2013
PaletteApp, Inc. Digi ta l Media/Commerce Batterson Venture Capita l , LLC ‐ Pursway, Inc. Marketing Technology Battery Ventures ‐ Rhapsody International Digi ta l Media/Commerce Telefonica Digi ta l ‐ Skyscanner Limited Digi ta l Adverti s ing Sequoia Capita l ‐ Solarvis ta Media Tradi tional Media Nokia Growth Partners ‐ Tyched Web Services Digi ta l Media/Commerce India Quotient ‐
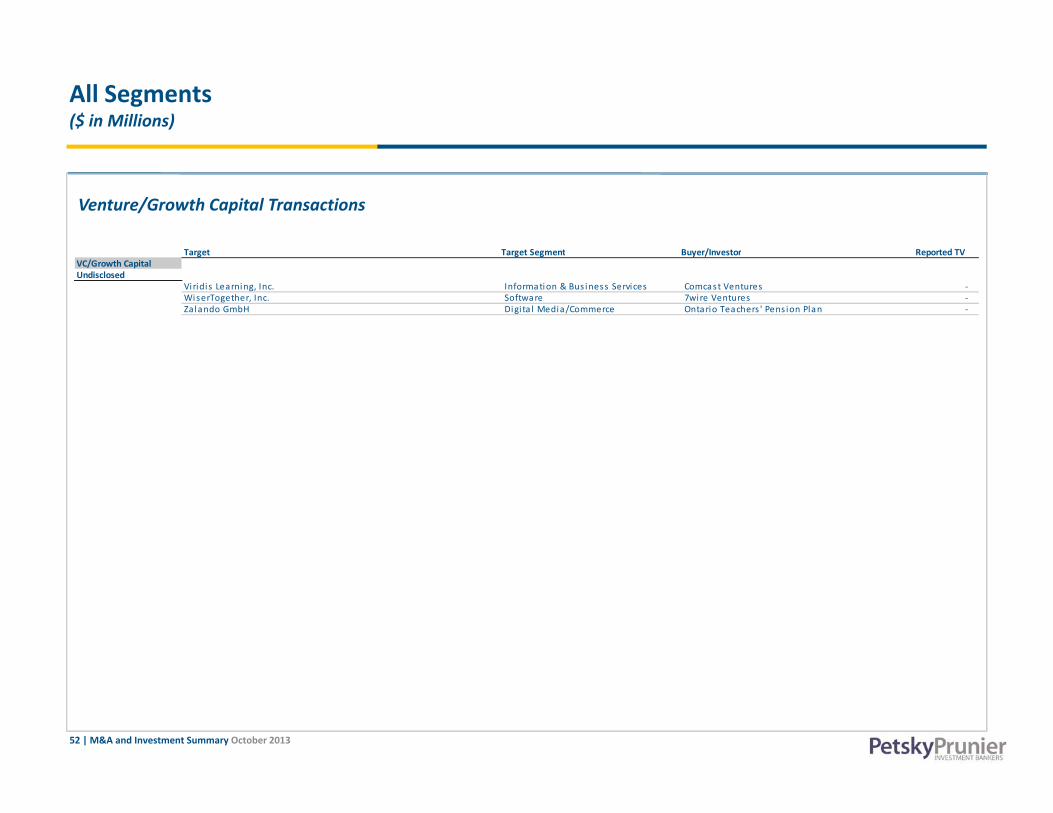
All Segments($ in Millions)
Venture/Growth Capital Transactions
Target Target Segment Buyer/Investor Reported TVTarget Target Segment Buyer/Investor Reported TV VC/Growth CapitalUndisclosed
Viridis Learning, Inc. Information & Bus iness Services Comcast Ventures ‐ WiserTogether, Inc. Software 7wire Ventures ‐ Zalando GmbH Digi ta l Media/Commerce Ontario Teachers ' Pens ion Plan ‐
52 | M&A and Investment Summary October 2013
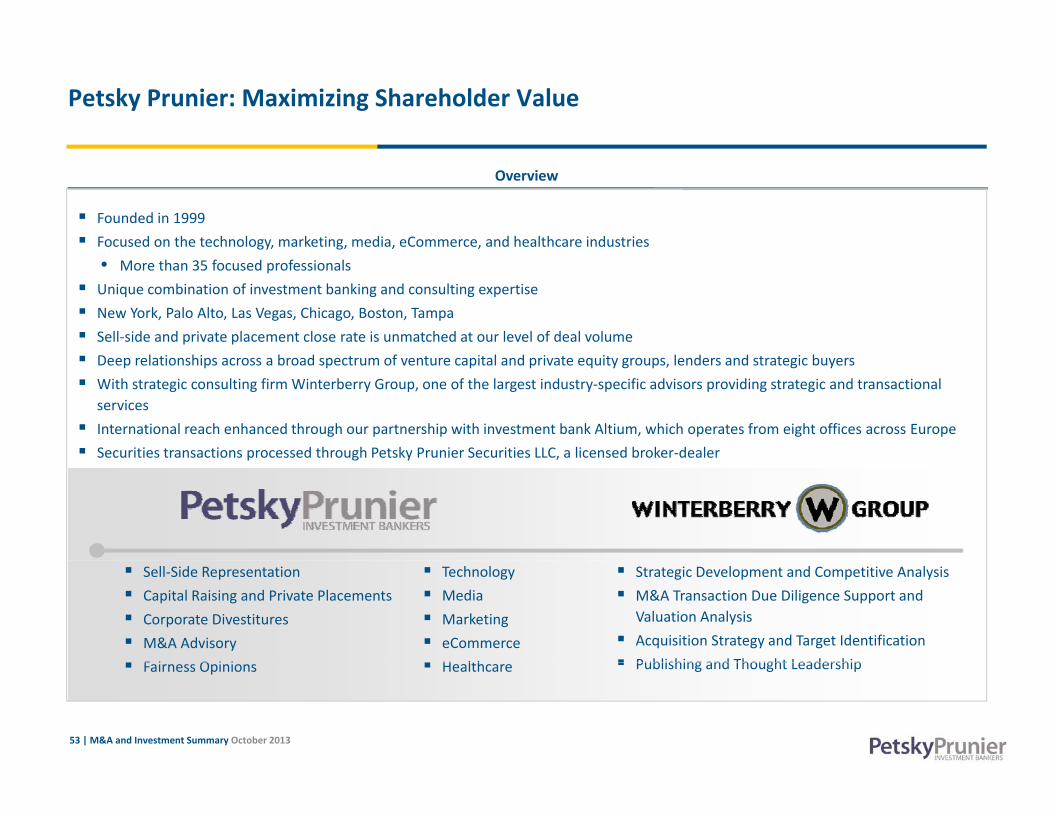
Petsky Prunier: Maximizing Shareholder Value
Overview
Founded in 1999 Focused on the technology, marketing, media, eCommerce, and healthcare industries
• More than 35 focused professionals Unique combination of investment banking and consulting expertise New York, Palo Alto, Las Vegas, Chicago, Boston, Tampa Sell‐side and private placement close rate is unmatched at our level of deal volume
D l i hi b d f i l d i i l d d i b Deep relationships across a broad spectrum of venture capital and private equity groups, lenders and strategic buyers With strategic consulting firm Winterberry Group, one of the largest industry‐specific advisors providing strategic and transactional
services International reach enhanced through our partnership with investment bank Altium, which operates from eight offices across Europe Securities transactions processed through Petsky Prunier Securities LLC, a licensed broker‐dealerp g y ,
Sell‐Side Representation Capital Raising and Private Placements Corporate Divestitures M&A Advisory F i O i i
Strategic Development and Competitive Analysis M&A Transaction Due Diligence Support and
Valuation Analysis Acquisition Strategy and Target Identification Publishing and Thought Leadership
Technology Media Marketing eCommerce H lth
53 | M&A and Investment Summary October 2013
Fairness Opinions Publishing and Thought Leadership Healthcare

Petsky Prunier was Ranked #1 by Bloomberg in 2011‐2012 for Mid‐Market Internet & Advertising Transactions
Rank Advisor Deal Count1 Petsky Prunier LLC 302 Nomura Holdings Inc 243 GCA Savvian Group Corp 234 Goldman Sachs & Co. 205 Morgan Stanley 196 Jordan Edmiston Group 187 Jefferies Group Inc. 168 China Renaissance Partners 158 Sumitomo Mitsui Financial 1510 JP Morgan 1410 RBC Capital Markets 14
Based on number of deals announced in 2011‐2012 valued at $500 million or less
More than 60 transactions closed since 2010:
Ranging from strategic sales and divestitures to private equity recaps to growth, mezzanine, and alternative financings Across a broad universe of industries including digital advertising and marketing eCommerce and digital
54 | M&A and Investment Summary October 2013
Across a broad universe of industries, including digital advertising and marketing, eCommerce and digital media, technology and software, information services, and healthcare
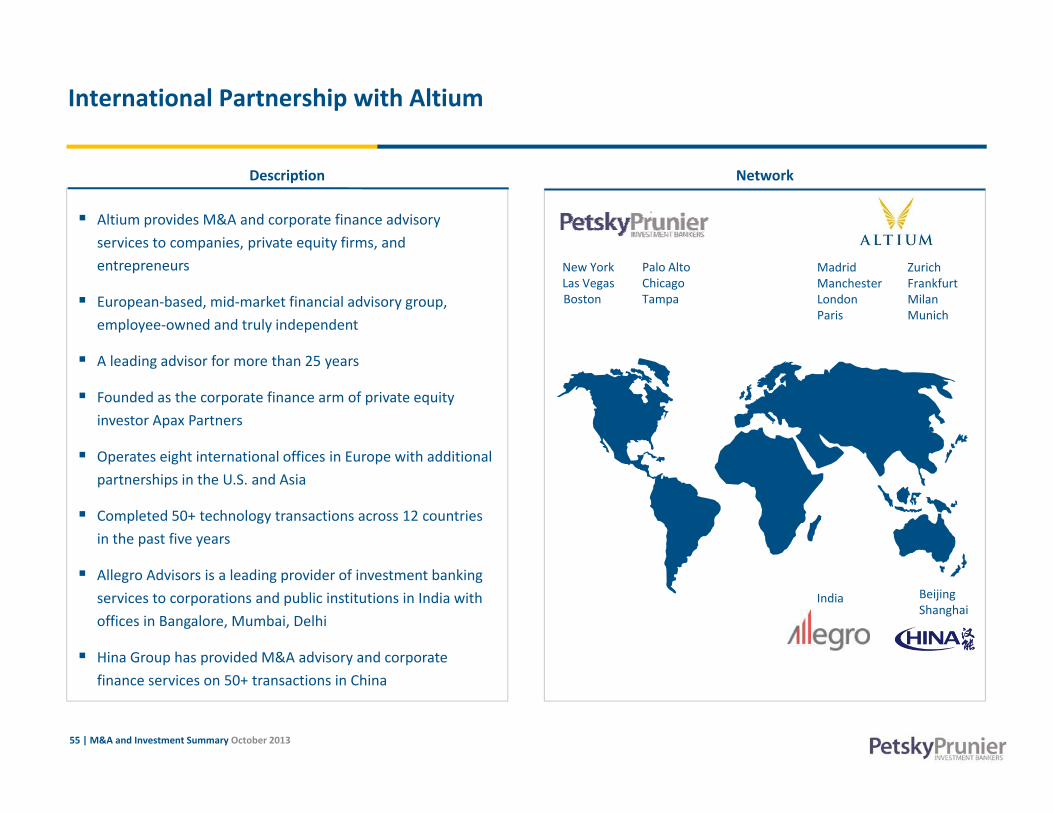
International Partnership with Altium
Description Network
Altium provides M&A and corporate finance advisory services to companies, private equity firms, and entrepreneurs
European‐based, mid‐market financial advisory group, employee‐owned and truly independent
l d d f h
New York Palo AltoLas Vegas ChicagoBoston Tampa
Madrid ManchesterLondonParis
Zurich FrankfurtMilanMunich
A leading advisor for more than 25 years
Founded as the corporate finance arm of private equity investor Apax Partners
Operates eight international offices in Europe with additionalOperates eight international offices in Europe with additional partnerships in the U.S. and Asia
Completed 50+ technology transactions across 12 countries in the past five years
Allegro Advisors is a leading provider of investment banking services to corporations and public institutions in India with offices in Bangalore, Mumbai, Delhi
Hina Group has provided M&A advisory and corporate
BeijingShanghai
India
55 | M&A and Investment Summary October 2013
p p y pfinance services on 50+ transactions in China
Representative Recent Transactions
has been sold to
a leading multiplatform travel and lifestyle media company
a subsidiary of
has been sold to
the largest provider of cloud‐based SaaS tools for printing signs, labels and tags,
and publishing digital displays for retailers
a unit ofhas received a $68M minority investment
from
a leading provider of social software solutions and digital marketing services for some of the world’s largest brands, one of just thirteen Facebook Strategic Preferred Marketing Developers (sPMD)
has been sold to
a leading developer of popular real‐money and social gaming
has been sold to
one of the largest digital agencies
has been sold to
a premier global provider of SaaS‐based online brand protection and domain recovery solutionsa portfolio company of
a leading UK‐based supplier of healthcare software and IT services
a portfolio company of
has been sold to
a leading provider of data‐driven enrollment marketing solutions to
higher education institutions
has acquired select assets of
h i d i d bt
a leading provider of transportation‐based digital media networks
a dynamic display media andretargeting companya leading provider of digital production
services to brands and agenciesa real‐time behavioral advertisingcompany
a leading provider of in‐store and shopper marketing signage to major
h i il
has sold
along with digital subsidiary
a leading digital advertising monetization and shopper marketing partner for e‐commerce
retailersa portfolio company of
has sold
(NYSE: LXK )(Nasdaq: RNWK)(Nasdaq: RNWK)(ENXTPA: PUB)(Euronext Amsterdam: WKL)(AIM: EMIS)
has received a mezzanine debt investment from
has been acquired by
(JASDAQ:4755)
has been sold to
(NYSE: ACN)
has been acquired by
(NYSE: AOL)
has been sold to
North American retailers
specializing in retail, digital, shopper marketing and consumer services
to
has been sold to
with financing from
provider of online travel guides for top destinations around the world
to
(NYSE: GCI )
a leading provider of taxi‐based outdoor media
has been sold to
(NYSE: PAY)
has sold
and
leading provider of services for domain name registration, acquisition, brokerage
and sales
has been sold to
the top independentdirect‐to‐consumer marketer of
dental savings planshas been sold to
a leader in global healthcare primary market research and influence
network mapping
a portfolio company of
a provider of a cloud‐based integration platform for the digital marketing industry
has received $15M financing led by
a leader in multichannel retail, ecommerce and loyalty marketing
services
has been sold to
a leader in technology and global in‐app advertising for Facebook,
Apple (iOS), and Android developers
has received $66M investmentfrom
a leading digital direct marketing company utilizing a proprietary database to provide
customer acquisition solutions formajor brands
has received an equity investment from
with debt financing from
has acquired
a pioneer in measuring the
a portfolio company of
Vestar Capital Partners has sold
has received a majority investment from
has sold
a leading provider of integrated data, technology and analytics solutions
has been sold to
(TSX: PTO)
a leading shopper marketing execution company
a leading online video advertising network
has received a growth capital investment from
a digital communications agency with a proprietary software platform serving
biopharmaceutical companies
has been sold to
has been sold to
56 | M&A and Investment Summary October 2013
a pioneer in measuring the impact of promotion on
physician prescribing behavior
toto