OCR GCE Psychology - An anthology of core studies for · PDF fileJournal of Cross-cultural...
64
PSYCHOLOGY A LEVEL Teacher Guide H567 Guide to Core Studies 2 Version 3
Transcript of OCR GCE Psychology - An anthology of core studies for · PDF fileJournal of Cross-cultural...

PSYCHOLOGY
A LEVELTeacher Guide
H567
Guide to Core Studies 2Version 3

2
CONTENTS
A LEVELPSYCHOLOGY
Social Psychology Responses to people in needPiliavin, I. M., Rodin, J., & Piliavin, J. A. (1969) Page 3 Good Samaritanism: An underground phenomenon? Levine, R.V., Norenzayan,A. & Philbrick,K. (2001) Page 8 Cross-cultural differences in helping strangers
Cognitive Psychology AttentionMoray , N. (1959) Page 15 Attention in dichotic listening: affective cues and the influence of instructionsSimons, D. J. & Chabris, C. F. (1999) Page 21 Gorillas in our midst: sustained inattentional blindness for dynamic events
Developmental Psychology Moral DevelopmentKohlberg, L. (1968) Page 29 The child as a moral philosopher.Lee, K., Cameron, C., Xu, F., Fu,G. Page 35 & Board, J. (1997) Chinese and Canadian children’s evaluations of lying and truth telling: Similarities and differences in the context of pro- and antisocial behaviours.
Biological Psychology Brain plasticityBlakemore, C. & Cooper, G. F. (1970) Page 42 Development of the brain depends on the visual environment.Maguire, E. A., Gadian, D. G., Johnsrude, I. S., Page 46 Good, C. D., Ashburner, J., Frackowiak, R. S. & Frith, C. D. (2000) Navigation-related structural change in the hippocampi of taxi drivers.
Psychology of Individual Differences Measuring differencesGould, S. J. (1982) Page 50 A nation of morons.Hancock, J., Woodworth, Page 57 M.T. & Porter, S. (2011) Hungry like the wolf: a word-pattern analysis of the language of psychopaths.
This Core Studies guide is just a starting point for teachers and students. It is important that students understand the studies in-depth in order to answer any assessment questions. The assessment questions may ask them to extrapolate information from the studies or take their understanding of the studies and what they have taught us further.

3
1. Theory/ies on which the study is based
• Although pluralistic ignorance and/or genuine ambiguity make it less likely that an individual will define a situation as an emergency, in many situations the reason an individual may not help is because they diffuse responsibility.
• Diffusion of responsibility is where the responsibility for the situation is spread (diffused) among the people present. This implies that the more people present, the more the bystander believes the responsibility is spread out so they feel less personally responsibility and are therefore less likely to help.
• Another explanation for not helping a victim in need is that a bystander may believe that someone else will do what’s necessary so there is no need for them to offer assistance. This is known as ‘bystander apathy’.
2. Background to the study
• Since the murder of Kitty Genovese in 1964 (a woman stabbed to death over a period of 30 minutes in front of a reported 38 unresponsive witnesses), many social psychologists have studied the concept of good Samaritanism.
• Research by Darley and Latané (1968) found that bystanders hearing an epileptic fit over earphones, led to those who believed other witnesses to be present being less likely to help the victim than bystanders who believed they were alone.
• Subsequent research by Latané and Rodin (1969) on the response to the victim of a fall confirmed this finding and suggested that assistance from bystanders was less likely if they were strangers than if they were acquaintances.
• Field experiments conducted by Bryan and Test (1967) showed that individuals are more likely to be good Samaritans if they have just observed another individual performing a helpful act.
• Much of the work on victimisation has been conducted in laboratory settings, using non-visual emergency situations.
• This study was designed to investigate, under real life conditions, the effect of several variables on helping behaviour.
PILIAVIN, I. M., RODIN, J., & PILIAVIN, J. A. (1969)Good Samaritanism: An underground phenomenon? Journal of Personality and Social Psychology. Volume 13, No. 4, pages 289-299.
Social Psychology Responses to people in need

4
3. Research Method
• The study was a field experiment.
• The field situation was the A and D trains of the 8th Avenue New York Subway between 59th Street and 125 Street. The journeys lasted about 7½ minutes.
• The experiment had four independent variables (IVs):
(i) Type of victim (drunk or carrying a cane).
(ii) Race of victim (black or white).
(iii) Effect of a model (after 70 or 150 seconds, from the critical or adjacent area), or no model at all.
(iv) Size of the witnessing group (a naturally occurring independent variable).
• The dependent variables (DVs) - recorded by two female observers seated in the adjacent area - were:
(i) Frequency of help.
(ii) Speed of help.
(iii) Race of helper.
(iv) Sex of helper.
(v) Movement out of critical area.
(vi) Verbal comments by bystanders.
4. Sample
• Participants were about 4,450 men and women who used the New York subway on weekdays between 11.00 am and 3.00 pm between April 15 and June 26, 1968.
• About 45% were black, 55% white.
PILIAVIN, I. M., RODIN, J., & PILIAVIN, J. A. (1969)Good Samaritanism: An underground phenomenon? Journal of Personality and Social Psychology. Volume 13, No. 4, pages 289-299.
Social Psychology Responses to people in need

5
5. Outline of the procedure/study
• There were 4 teams of 4 researchers: 2 female observers, 2 males – one acting as victim, one the model.
• The victims (3 white, 1 black) were all male, General Studies students, aged 26-35 years, and dressed alike. They either smelled of liquor and carried a liquor bottle wrapped tightly in a brown bag or appeared sober and carried a black cane. In all aspects they acted identically in both conditions.
• The models (all white) were males aged 24-29 years. There were 4 model conditions:
(i) Critical area - early.
(ii) Critical area – late.
(iii) Adjacent area – early.
(iv) Adjacent area – late.
• The observers recorded the dependent variables. On each trial one observer noted the race, sex and location of every rider seated or standing in the critical area. In addition she counted the total number of individuals who came to the victim’s assistance. She also recorded the race, sex and location of every helper. The second observer coded the race, sex and location of all persons in the adjacent area. She also recorded the latency of the first helper’s arrival after the victim had fallen and on appropriate trials, the latency of the first helper’s arrival after the programmed model had arrived. Both observers recorded comments spontaneously made by nearby passengers and attempted to elicit comments from a rider sitting next to them.
• The victim stood near a pole in the critical area. After about 70 seconds he staggered forward and collapsed. Until receiving help he remained supine on the floor looking at the ceiling. If he received no help by the time the train stopped the model helped him to his feet. At the stop the team disembarked and waited separately until other passengers had left the station. They then changed platforms to repeat the process in the opposite direction.
• Between 6-8 trials were run on a given day, all using the same ‘victim condition’.
• There were more cane trials than drunk trials which were distributed unevenly across black and white victims because Team 2 violated intructions by running cane rather than drunk trials because the victim “didn’t like” playing the drunk! Subsequent student strikes prevented additional trials to correct this.
PILIAVIN, I. M., RODIN, J., & PILIAVIN, J. A. (1969)Good Samaritanism: An underground phenomenon? Journal of Personality and Social Psychology. Volume 13, No. 4, pages 289-299.
Social Psychology Responses to people in need

6
6. Key findings
• The cane victim received spontaneous help 95% of the time (62/65 trails) compared to the drunk victim 50% of the time (19/38 trials).
• Overall there was 100% help for the cane victim compared to 81% help for the drunk victim.
• Help was offered more quickly to the cane victim (a median of 5 seconds compared to 109 seconds delay for the drunk victim).
• On 49/81 (60%) trials when help was given this was provided by 2 or more helpers.
• 90% of the first helpers were males.
• There was a slight tendency for same race helping especially in the drunk condition.
• No diffusion of responsibility was found, in fact response times were faster with larger groups than smaller.
• More comments were made by passengers in the drunk than the cane condition and most comments were made when no help was given within the first 70 seconds.
PILIAVIN, I. M., RODIN, J., & PILIAVIN, J. A. (1969)Good Samaritanism: An underground phenomenon? Journal of Personality and Social Psychology. Volume 13, No. 4, pages 289-299.
Social Psychology Responses to people in need

7
7. Possible conclusions
• An individual who appears ill is more likely to receive help than one who appears drunk.
• With mixed groups of men and women, men are more likely than women to help a male victim.
• With mixed-race groups, people are more likely to help those of the same race as themselves, particularly if they deem the victim’s situation to be of his own making e.g. drunk.
• There is no strong relationship between number of bystanders and speed of helping when an incident is visible.
• When escape is not possible and bystanders are face-to-face with a victim, help is likely to be forthcoming.
• Bystanders conduct a cost-reward analysis before deciding whether or not to help a victim.
• Subsequent spontaneous help from others was irrespective of race or victim type.
PILIAVIN, I. M., RODIN, J., & PILIAVIN, J. A. (1969)Good Samaritanism: An underground phenomenon? Journal of Personality and Social Psychology. Volume 13, No. 4, pages 289-299.
Social Psychology Responses to people in need

8
1. Theory/ies on which the study is based
• Helping behaviour refers to voluntary actions intended to help others and is a form of prosocial behaviour.
• Theories about helping behaviour include:
- Kin selection theory: this refers to the tendency to perform behaviours that may favour the chance of survival of people with a similar genetic base (e.g. Hoffman, 1981).
- Reciprocal altruism: this holds that the incentive for an individual to help in the present is based on the expectation of the potential receipt in the future (Trivers, 1971).
- Responsibility-prosocial value orientation: holds that a strong influence on helping behaviour is a feeling of and belief in one’s responsibility to help, especially when combined with the belief that one is able to help the other person (Staub, 2003).
- Social exchange theory: people help because they want to gain goods from the one being helped. They calculate rewards and costs of helping others, aiming to maximise the rewards and minimise the costs (Foa & Foa, 1975).
• Milgram (1970) proposed that people in urban areas are less helpful than those in rural areas because they cope with stimulus overload differently: urban dwellers restrict their attention mainly to personally relevant events. Strangers, and their situations of need may, therefore, go unnoticed.
LEVINE, R.V., NORENZAYAN,A. & PHILBRICK,K. (2001) Cross-cultural differences in helping strangers.Journal of Cross-cultural Psychology, Volume 32, No. 5, pages 543-560.
Social Psychology Responses to people in need

9
2. Background to the study
• Studies conducted in several different countries (including the USA, Saudi Arabia and Sudan) have found that people living in urban areas tend to be less helpful than those in rural settings (Hedge & Yousif, 1992; Yousif & Korte, 1995).
• Virtually all of the studies of community differences in helping have focused on the single variable of population size, most often testing the hypothesis that the tendency to help strangers declines as the size of the city increases. Steblay (1987) found general support for this hypothesis with the decline in helping rate beginning at populations of 300,000. She also found that urban environments of 300,000 people or more and rural environments of 5,000 people or less were the worst places if one was looking for help.
• A major cultural difference in helping behaviour is the difference between collectivism and individualism. Collectivists attend more to the needs and goals of the group they belong to, and individualists focus on their own selves. Therefore, collectivists would be more likely to help in group members, but less frequent than individuals to help strangers (Triandis, 1991).
• Although many studies have demonstrated that helping rates differ between communities in a single country, almost no systematic cross-cultural research of helping behaviour had been conducted prior to this study.
• The aim of this study was therefore to look at helping behaviour, in a wide range of cultures, in large cities around the world in relation to four specific community variables:(i) population size(ii) economic well-being(iii) cultural values (individualism-collectivism, simpatia)(iv) walking speed (pace of life).
• This study had three main goals:(i) To determine if a city’s tendency to offer non emergency help to strangers is stable across situations over a wide range of cultures i.e. is helping strangers a cross-culturally meaningful characteristic of a place?(ii) To obtain a descriptive body of data on helping behaviour across cultures using identical procedures i.e. does helping strangers vary cross-culturally?(iii) To identify country-level variables that might relate to differences in helping i.e. what are some community characteristics that are related to helping of strangers across cultures?
• Three overlapping theoretical explanations for community-level differences in helping behaviour, none of which had been previously considered in cross-cultural research, were tested:(i) economic explanations(ii) cultural values(iii) cognitive explanations: pace of life.
LEVINE, R.V., NORENZAYAN,A. & PHILBRICK,K. (2001) Cross-cultural differences in helping strangers.Journal of Cross-cultural Psychology, Volume 32, No. 5, pages 543-560.
Social Psychology Responses to people in need

10
3. Research method
• This was a cross-cultural quasi experiment carried out in the field that used an independent measures design.
• The field situation was 23 large cities around the world including Rio de Janeiro (Brazil), Calcutta (India), Madrid (Spain), Shanghai (China), Budapest (Hungary), Rome (Italy), New York (USA) and Kuala Lampur (Malaysia). The study should be considered as a quasi- experiment because the independent variable – the people in each city – was naturally occurring.
• The experiment measured, through the use of a series of correlations of co-variables, helping behaviour in three non emergency situations:
(i) whether the victim dropped a pen
(ii) whether the victim had a hurt/injured leg
(iii) whether the victim was blind and trying to cross the street.
• The dependent variable (DV) was the helping rate of the 23 individual cities (calculated to give each city an Overall Helping Index).
• The three measures of helping were correlated with statistics reflecting population size, economic well-being, cultural values (individualism-collectivism, simpatia) and the pace of life for each of the 23 locations.
4. Sample
• Participants in this study were large cities in each of 23 countries – in most cases the largest in each country i.e. individuals in each of these cities at the time of the experiment.
• Each of the three helping measures and the walking speed measure were administered in two or more locations, in main downtown areas, during main business hours, on clear days, during the summer months of one or more years between 1992 and 1997.
• For the dropped pen and hurt leg situations, only individuals walking alone were selected. Children (younger than 17 years old), and people who were physically disabled, very old, carrying packages etc (i.e. those who might not be fully capable or expected to help) were excluded.
• Participants were selected by approaching the second potential person who crossed a predetermined line.
LEVINE, R.V., NORENZAYAN,A. & PHILBRICK,K. (2001) Cross-cultural differences in helping strangers.Journal of Cross-cultural Psychology, Volume 32, No. 5, pages 543-560.
Social Psychology Responses to people in need

11
LEVINE, R.V., NORENZAYAN,A. & PHILBRICK,K. (2001) Cross-cultural differences in helping strangers.Journal of Cross-cultural Psychology, Volume 32, No. 5, pages 543-560.
Social Psychology Responses to people in need
5. Outline of the procedure/study
• Data was collected by either interested, responsible students who were either travelling to foreign countries or returning to their home countries for the summer, or by cross-cultural psychologists and their students in other countries who volunteered to assist the authors.
• All experimenters were college age and dressed neatly and casually. To control for experimenter gender effects and to avoid potential problems in some cities, all experimenters were men.
• To ensure standardisation in scoring and to minimise experimenter effects:
(i) all experimenters received both a detailed instruction sheet and on-site field training for acting their roles, learning the procedure for participant selection and scoring of participants
(ii) the experimenters practised together
(ii) no verbal communication was required of the experimenter.
• The three helping measures were:
(i) Dropped pen. Walking at a carefully practised, moderate pace (15 paces/10 seconds), experimenters walked toward a solitary pedestrian passing in the opposite direction. When 10 to 15 feet from the participant, the experimenter reached into his pocket and accidentally, without appearing to notice, dropped his pen behind him, in full view of the participant, and continued walking past the participant. A total of 214 men and 210 women were approached. Participants were scored as having helped if they called back to the experimenter that he had dropped the pen and/or picked up the pen and brought it to the experimenter.
(ii) Hurt leg. Walking with a heavy limp and wearing a large and clearly visible leg brace, experimenters accidentally dropped and unsuccessfully struggled to reach down for a pile of magazines as they came within 20 feet of a passing pedestrian. A total of 253 men and 240 women were approached. Helping was defined as offering to help and/or beginning to help without offering.
(iii) Helping a blind person across the street. Experimenters, dressed in dark glasses and carrying white canes, acted the role of a blind person needing help getting across the street. (The canes and training for the role were provided by the Fresno Friendship Centre for the Blind). Experimenters attempted to locate downtown corners with crosswalks, traffic signals, and moderate, steady pedestrian flow. They stepped up to the corner just before the light turned green, held out their cane, and waited until someone offered help. A trial was terminated after 60 seconds or when the light turned red, whichever occurred first, after which the experimenter walked away from the corner. A total of 281 trials were conducted. Helping was scored if participants, at a minimum, informed the experimenter that the light was green.

12
6. Key findings
NB: For purposes of analyses, each of the 23 cities/countries was treated as a single participant.
- The above table shows that two of the three correlations were significant.
- All three intercorrelations were in the positive direction.
• No significant gender differences in helping behaviour were found in the two conditions in which relatively equal numbers of male and female participants were targeted by the experimenter (hurt leg, dropped pen): dropped pen, M (men) = .67, M (women) = .69, t(22) = .39, ns; hurt leg, M (men) = .63, M (women) = .65, t(22) = .75, ns.
• An Overall Helping Index was calculated, combining results for the three helping measures. Results showed that the most helpful cities/countries were (1) Rio de Janeiro (Brazil), 93%, (2) San Jose (Costa Rica), 91% (3) Lilongwe (Malawi), 86%. The least helpful cities/countries were (23) Kuala Lampur (Malaysia), 40% (22) New York (USA), 45%, (21) Singapore (Singapore), 48%.
. . . continues
LEVINE, R.V., NORENZAYAN,A. & PHILBRICK,K. (2001) Cross-cultural differences in helping strangers.Journal of Cross-cultural Psychology, Volume 32, No. 5, pages 543-560.
Social Psychology Responses to people in need
Intercorrelations of Helping MeasuresHelping Measure
Blind Person Dropped Pen Hurt Leg
Dropped Pen .28**
Hurt Leg .21 .36***
Blind + Pen + Leg .67**** .77**** .73****
**p < .10. ***p < .05. ****p < .01 using 1-tailed significance test. n = 23 in all cases.

13
6. Key findings
. . . continued Correlations Between Helping Measures and Other Community Characteristics
- The above table shows that, on average, there were low correlations between the community variables and helping measures.
- The only statistically reliable relationship was between the economic productivity measure and overall helping: cities that were more helpful tended to have lower PPP.
• Although statistically insignificant, there was a small relationship between walking speed and overall helping, with participants in faster cities somewhat less likely to help.
• More individualistic countries showed somewhat less overall helping and less helping in the hurt leg situation than collectivist countries, but none of the correlations reached significance.
• There was no relationship between population size and helping behaviour.
• The two community variables of economic productivity and individualism-collectivism and walking speed were highly intercorrelated: economic productivity was positively correlated with individualism and negatively correlated with walking speed i.e. faster places had stronger economic productivity. Individualism was also negatively correlated with walking speed i.e. faster places were more individualistic.
• Simpatia countries (Brazil, Costa Rica, El Salvador, Mexico and Spain) were, on average, more helpful than non simpatia countries.
• Overall, a city’s helping rate was relatively stable across all three measures.
LEVINE, R.V., NORENZAYAN,A. & PHILBRICK,K. (2001) Cross-cultural differences in helping strangers.Journal of Cross-cultural Psychology, Volume 32, No. 5, pages 543-560.
Social Psychology Responses to people in need
Helping Measure
Community Characteristic Overall Helping Blind Person Hurt Leg Dropped Pen
Population size (city) -.03
(23)
–.06
(23)
.22
(23)
–.21
(23)
Purchasing power parity (PPP) –.43***
(22)
–.42***
(22)
–.21
(22)
–.32*
(22)
Walking speed .26
(20)
.06
(20)
.23
(20)
.24
(20)
Individualism-collectivism –.17
(23)
–.09
(23)
–.21
(23)
–.07
(23)
NOTE: *p <.15. ***p <.05, 2-tailed. Sample sizes in parentheses. Statistics for some community characteristics were not available for some countries, resulting in smaller sample sizes for those analyses.

14
7. Possible conclusions
• The helping of strangers is a cross-culturally meaningful characteristic of a place.
• There are large cross-cultural variations in helping rates.
• Helping across cultures is inversely related to a country’s economic productivity.
• Countries with the cultural tradition of simpatia are, on average, more helpful than counties with no such tradition.
• Although faster cities tend to be less helpful than slower cities, the link between economic health and helping is not a by-product of a fast pace of life in affluent societies.
• The value of collectivism-individualism is unrelated to helping behaviours.
LEVINE, R.V., NORENZAYAN,A. & PHILBRICK,K. (2001) Cross-cultural differences in helping strangers.Journal of Cross-cultural Psychology, Volume 32, No. 5, pages 543-560.
Social Psychology Responses to people in need

15
1. Theory/ies on which the study is based
• Attention has a selective nature.
• Broadbent (1958) argued that the world is composed of many more sensations than can be handled by the perceptual and cognitive capabilities of the human observer. To cope with the flood of available information, humans must selectively attend to only some information and somehow ‘tune out’ the rest. Attention, therefore, is the result of a limited-capacity information-processing system.
• Almost all early models of attention assumed serial processing, a step-by-step process in which each operation is carried out in turn. The first of these was Broadbent’s (1958) filter model, followed by Treisman’s (1964) attention model and the pertinence model (Deutsch & Deutsch, 1963; Norman, 1969).
• Early attempts to explain divided attention, such as Kahneman’s (1973) central capacity theory, also assumed serial processing.
• However, Allport’s (1980b) multi-channel theory of divided attention holds that two or more operations can be carried out at the same time.
• There are two main methods of studying attention:
(i) Selective attention – here people are presented with two or more simultaneous ‘messages’, and are instructed to process and respond to only one of them. The most popular way of doing this is to use shadowing in which one message is fed into the left ear and a different message into the right ear (through headphones). Participants have to repeat one of these messages aloud as they hear it. The shadowing technique is a form of dichotic listening which was first used by Cherry (1953) when he studied the cocktail party phenomenon.
(ii) Divided attention – this is a dual-task technique in which people are asked to attend and respond to both (or all) the messages. Whereas shadowing focuses attention on a particular message, the dual-task method deliberately divides people’s attention.
2. Background to the study
• Cherry’s (1953) method of ‘shadowing’ one of two dichotic messages for his study of attention in listening found participants who shadowed a message presented to one ear were ignorant of the content of a message simultaneously presented to the other ear.
• Other researchers then moved on from Cherry’s work on how people can attend to one message by investigating why so little seemed to be remembered about the other conversations (Hampton & Morris, 1996).
• The first experiment in this study aimed to test Cherry’s findings more rigorously whilst the second and third experiments aimed to investigate other factors that can affect attention in dichotic listening.
MORAY, N. (1959) Attention in dichotic listening: affective cues and the influence of instructions. Quarterly Journal of Experimental psychology, Volume 11, No. 1, pages 56-60.
Cognitive Psychology Attention

16
3. Research method
• All tasks were laboratory-based, had high levels of control and had an IV and DV. Therefore they were all laboratory experiments.
• In all tasks, the apparatus used was a Brenell Mark IV stereophonic tape recorder modified with two amplifiers to give two independent outputs through attenuators, one output going to each of the earpieces of a pair of headphones. Matching for loudness was approximate, by asking participants to say when two messages that seemed equally loud to the experimenter were subjectively equal to them.
Experiment 1This used a repeated measures design.
This independent variables (IVs) were:
(i) the dichotic listening test
(ii) the recognition test
The dependent variable (DV) was: the number of words recognised correctly in the rejected message.
Experiment 2This used a repeated measures design.
The independent variable (IV) was: whether or not instructions were prefixed by the participant’s own name.
The dependent variable (DV) was: the number of affective instructions.
Experiment 3This also used an independent measures design.
The independent variables (IVs) were:
(i) whether digits were inserted into both messages or only one
(ii) whether participants had to answer questions about the shadowed message at the end of each passage or whether participants had to merely remember all the numbers s/he could.
The dependent variable (DV) was: the number of digits correctly reported.
MORAY, N. (1959) Attention in dichotic listening: affective cues and the influence of instructions. Quarterly Journal of Experimental psychology, Volume 11, No. 1, pages 56-60.
Cognitive Psychology Attention

17
4. Sample
• Participants were undergraduates and research workers of both sexes.
• Participant numbers are not given for Experiment 1 but 12 participants took part in the experimental conditions in Experiment 2 and two groups of 14 participants were used in Experiment 3.
MORAY, N. (1959) Attention in dichotic listening: affective cues and the influence of instructions. Quarterly Journal of Experimental psychology, Volume 11, No. 1, pages 56-60.
Cognitive Psychology Attention
5. Outline of the procedure/study
• Before each experiment the participants were given four passages of prose to shadow for practice. All passages throughout the study were recorded by one male speaker.
Experiment 1• A short list of simple words was repeatedly presented to one of the participant’s ears whilst they shadowed a prose message presented to the
other ear. (The word list was faded in after shadowing had begun, and was equal in intensity to the shadowed message. At the end of the prose passage it was faded out so as to become inaudible as the prose finished.)
• The word list was repeated 35 times.
• The participant was then asked to report all he could of the content of the rejected message.
• S/he was then given a recognition test using similar material, present in neither the list nor the passage, as a control.
• The gap between the end of shadowing and the beginning of the recognition test was about 30 seconds.
Experiment 2• This experiment was conducted to find out the limits of the efficiency of the attentional block.
• Participants shadowed ten short passages of light fiction.
• They were told that their responses would be recorded and that the object of the experiment was for them to try to score as few mistakes as possible.
• In some of the passages instructions were interpolated, but in two instances the participants were not warned of these.
• In half of the cases with instructions these were prefixed by the participant’s own name.

18
5. Outline of the procedure/study
• The order of presentation is shown below:
Passage Instructions as start of passage Instructions within passage
1 Listen to your right ear All right, you may stop now.
2 Listen to your right ear No instructions.
3 Listen to your right ear John Smith, you may stop now.
4 Listen to your right ear No instructions.
5 Listen to your right ear Change to your other ear.
6 Listen to your right ear No instruction.
7 Listen to your right ear John Smith, change to you other ear.
8 Listen to your right ear: you will receive instructions to change ears. Change to your other ear.
• The ‘no instructions’ passages were interpolated in the table at random.
• The passages were read in a steady monotone voice at about 130 words per minute.
• Participants’ responses were tape-recorded and later analysed.
Experiment 3• Experiment 2 indicated that instructions might alter the set of instructions a participant in such a way as to alter the chances of material in the
rejected message being perceived. Experiment 3 tested this point further.
• Two groups of 14 participants shadowed one of two simultaneous dichotic messages.
• In some of the messages digits were interpolated towards the end of the message. These were sometimes present in both messages, sometimes only in one. The position of the numbers in the message and relative to each other in the two messages were varied, and controls with no numbers were also used, randomly inserted.
• One group of participants was told that it would be asked questions about the content of the shadowed message at the end of each message, the other group was specifically instructed to remember all the numbers that it could.
MORAY, N. (1959) Attention in dichotic listening: affective cues and the influence of instructions. Quarterly Journal of Experimental psychology, Volume 11, No. 1, pages 56-60.
Cognitive Psychology Attention
19
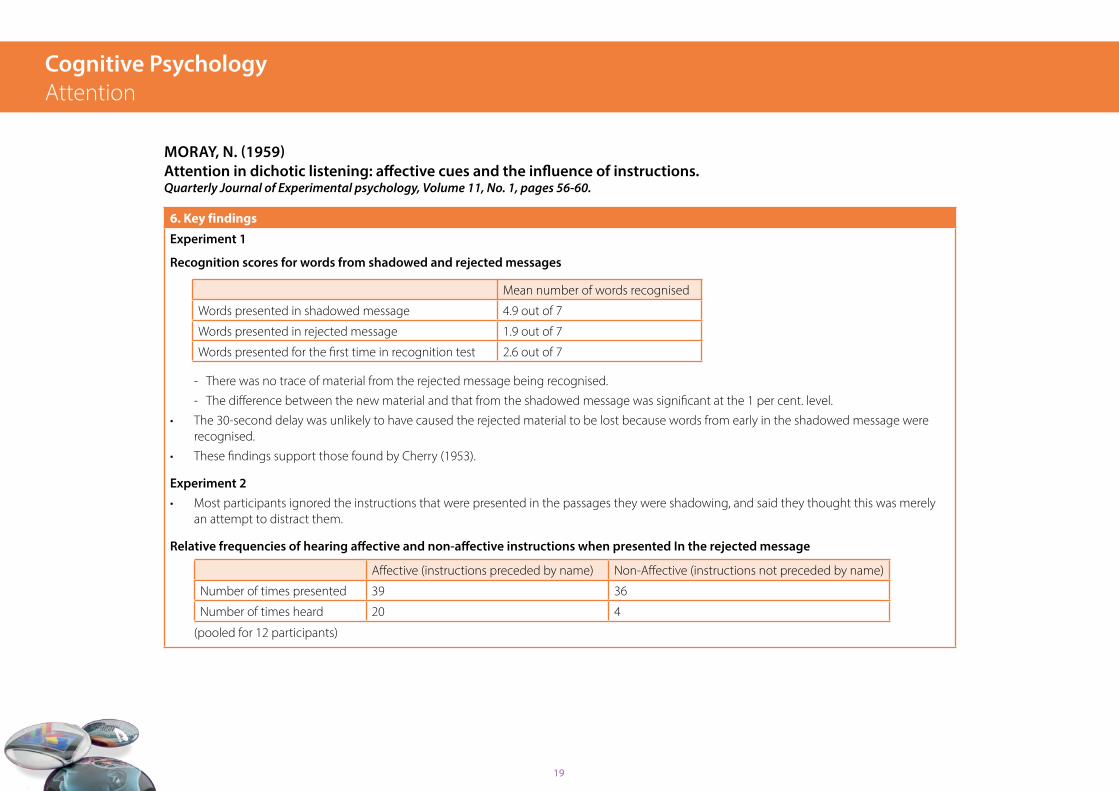
6. Key findings
Experiment 1
Recognition scores for words from shadowed and rejected messages
- There was no trace of material from the rejected message being recognised.
- The difference between the new material and that from the shadowed message was significant at the 1 per cent. level.
• The 30-second delay was unlikely to have caused the rejected material to be lost because words from early in the shadowed message were recognised.
• These findings support those found by Cherry (1953).
Experiment 2• Most participants ignored the instructions that were presented in the passages they were shadowing, and said they thought this was merely
an attempt to distract them.
Relative frequencies of hearing affective and non-affective instructions when presented In the rejected message
(pooled for 12 participants)
MORAY, N. (1959) Attention in dichotic listening: affective cues and the influence of instructions. Quarterly Journal of Experimental psychology, Volume 11, No. 1, pages 56-60.
Cognitive Psychology Attention
Mean number of words recognised
Words presented in shadowed message 4.9 out of 7
Words presented in rejected message 1.9 out of 7
Words presented for the first time in recognition test 2.6 out of 7
Affective (instructions preceded by name) Non-Affective (instructions not preceded by name)
Number of times presented 39 36
Number of times heard 20 4

20
MORAY, N. (1959) Attention in dichotic listening: affective cues and the influence of instructions. Quarterly Journal of Experimental psychology, Volume 11, No. 1, pages 56-60.
Cognitive Psychology Attention
7. Possible conclusions
• In a situation where a participant directs his attention to the reception of a message from one ear, and rejects a message from the other ear, almost none of the verbal content of the rejected message is able to penetrate the block set up.
• A short list of simple words presented as the rejected message shows no trace of being remembered even when presented many times.
• Subjectively ‘important’ messages, such as a person’s own name, can penetrate the block: thus a person will hear instructions if they are presented with their own name as part of the rejected message.
• While perhaps not impossible, it is very difficult to make ‘neutral’ material important enough to break through the block set up in dichotic shadowing.
6. Key findings
- There should have been 36 sets of instructions preceded by the participant’s name presented in the rejected messsage. However the discrepancy is due to three participants who heard the instructions and actually changed over, so that the second set of instructions which would normally have been heard as part of the shadowed message were now heard as part of the rejected message. These all occurred in passage 10.
• The mean number of instructions heard when presented in the rejected message was calculated, and the difference between the ‘names’ and ‘no names’ was significant: t = 3.05 (significant at greater than the 1 per cent. level, where t = 2.81.
• On only 4 out of the 20 occasions in which the ‘names’ instructions were heard did the participants actually make a change to the other message.
Experiment 3• The difference between the mean number of digits reported under the two conditions of set were analysed and submitted to a t test. In none
of the cases, whether the score was the mean number of digits spoken during shadowing, nor in the number reported, nor the sum of these two was the difference significant even at the 5% level of confidence.

21
1. Theory/ies on which the study is based
• Focused visual attention: the cluttered scenes of everyday life present more objects than an individual can respond towards simultaneously, and often more than can be fully perceived at any one time. Accordingly, mechanisms of attention are required to select objects of interest for further processing. In the case of vision, one such mechanism is provided by eye movements, which allow an individual to fixate on particular regions so they benefit from the greater acuity of the fovea (an area at the back of the eye responsible for central, sharp vision) (Driver, 1996).
• Attention is necessary for change detection.
• Change blindness: individuals often do not detect large changes to objects and scenes from one view to the next, particularly if those objects are not the centre of interest in the scene (Rensink et al, 1997).
• Individuals perceive and remember only those objects and details that receive focused attention.
• Inattentional blindness: when attention is diverted to another object or task. Observers often fail to perceive an unexpected object, even if it appears at fixation (e.g. Mack and Rock, 1998).
• A visually demanding task ‘loads’ the brain’s attention so an individual becomes increasingly blind to distractions and performance improves i.e. the harder one has to concentrate, the less likely one is to be distracted (e.g. Fisher, 2007).
• Theories of divided attention include: Kahneman’s limited capacity theory; Allport’s, Eysenck’s, Baddeley’s multi-channel theories; Schneider and Shiffrin’s automaticity model; Norman and Shallice’s SAS (supervisory attentional system) model.
SIMONS, D. J. & CHABRIS, C. F. (1999) Gorillas in our midst: sustained inattentional blindness for dynamic events. Perception, Volume 28, pages 1059-1074.
Cognitive Psychology Attention

22
2. Background to the story
• Previous studies had shown increasing interest in the issue of the precision of visual representations. In these studies observers had to engage in a continuous task that required them to focus on one aspect of a dynamic visual scene whilst ignoring others. At some point during the task an unexpected event occurred. Results showed that the majority of observers did not report seeing the unexpected event even though it was clearly visible to observers not engaged in the concurrent task (e.g. Becklen and Cervone, 1983; Stoffregen and Becklen, 1989).
• Although these previous studies have had profound implications for the understanding of perception with and without attention (e.g. change blindness, inattentional blindness), the empirical approach has recently fallen into disuse. One goal of this study was therefore to revive the empirical approach used in the earlier studies.
• This study includes much information into ‘inattentional blindness’ by such authors as Mack and Rock (1998), Rubin and Hua (1998); and ‘selective looking’ by Neisser and Becklen (1975), Becklen, Neisser and Littman (1979), Becklen and Cervone (1983), Stoffregen et al (1993); all of which helped to form the basis for this study.
• This study therefore builds on classic studies of divided visual attention to examine inattentional blindness for complex objects and events in dynamic scenes.
• To overcome the fact that previous research did not systematically consider the role of task difficulty in detection, and no direct comparisons were made between performance with a superimposed version of the display with a live version, for this study several video segments with the same set of actions, in the same location, on the same day were filmed. A large number of naive observers were asked to watch the video recordings and later answer questions about the unexpected events.
3. Research method
• This is primarily a laboratory experiment that used an independent measures design.
• The independent variables (IVs) were whether the participant took part in:
(i) The Transparent/Umbrella Woman condition
(ii) The Transparent/Gorilla condition
(iii) The Opaque/Umbrella Woman condition
(iv) The Opaque Gorilla condition.
SIMONS, D. J. & CHABRIS, C. F. (1999) Gorillas in our midst: sustained inattentional blindness for dynamic events. Perception, Volume 28, pages 1059-1074.
Cognitive Psychology Attention

23
3. Research method
(From left to right, top to bottom: Transparent/Umbrella Woman, Transparent /Gorilla, Opaque/Umbrella Woman, Opaque/Gorilla)
• For each of the four displays there were four task conditions:
(i) White/Easy
(ii) White/Hard
(iii) Black/Easy
(iv) Black/Hard.
SIMONS, D. J. & CHABRIS, C. F. (1999) Gorillas in our midst: sustained inattentional blindness for dynamic events. Perception, Volume 28, pages 1059-1074.
Cognitive Psychology Attention

24
3. Research method
• Overall there were therefore 16 individual conditions.
• The dependent variable (DV) was the number of participants in each of the 16 conditions who noticed the unexpected event (Umbrella Woman or Gorilla).
• A controlled observation was subsequently conducted in which participants watched a different video and had to attend to the White team and engage in the Easy monitoring task.
Materials• Four video tapes, each 75 seconds in duration were created.
• Each tape showed two teams of three players, one team wearing white shirts, the other black shirts.
• Players moved around in a relatively random fashion in an open area infront of a bank of three elevator doors.
• The members of each team passed a standard orange basketball to one another in a standardised order: player 1→ player 2 → player 3 → player 1. Passes were either bounce or aerial. Players would also dribble the ball, wave their arms and make other movements consistent with their overall pattern of action.
• After 44-48 seconds of action either of two unexpected events occurred: in the Umbrella-Woman condition, a tall woman holding an open umbrella walked from off camera on one side of the action to the other, left to right. (The actions of the players, and the unexpected event were designed to mimic the stimuli used in previous research by Neisser and colleagues.) In the Gorilla condition, a shorter woman wearing a gorilla costume that fully covered her body walked through the action in the same way. In either case, the unexpected event lasted 5 seconds, and the players continued their actions during and after the event.
• There were two styles of video: in the Transparent condition, the white team, black team and unexpected event were all filmed separately , and the three video streams were rendered partially transparent and then superimposed by using digital video-editing software. In the Opaque condition, all seven actors were filmed simultaneously and could thus occlude one another and the basketballs. (This required some rehearsal before filming to eliminate collisions and other accidents and to achieve natural-looking patterns of movement.)
• All videos were filmed with an SVHS video camera and were digitised and edited using a nonlinear digital-editing system.
• In a separate Opaque-style video recording, the gorilla walked from right to left into the live basketball-passing event, stopped in the middle of the players as the action continued all around it, turned to face the camera, thumped its chest, and then resumed walking across the screen.
SIMONS, D. J. & CHABRIS, C. F. (1999) Gorillas in our midst: sustained inattentional blindness for dynamic events. Perception, Volume 28, pages 1059-1074.
Cognitive Psychology Attention
25
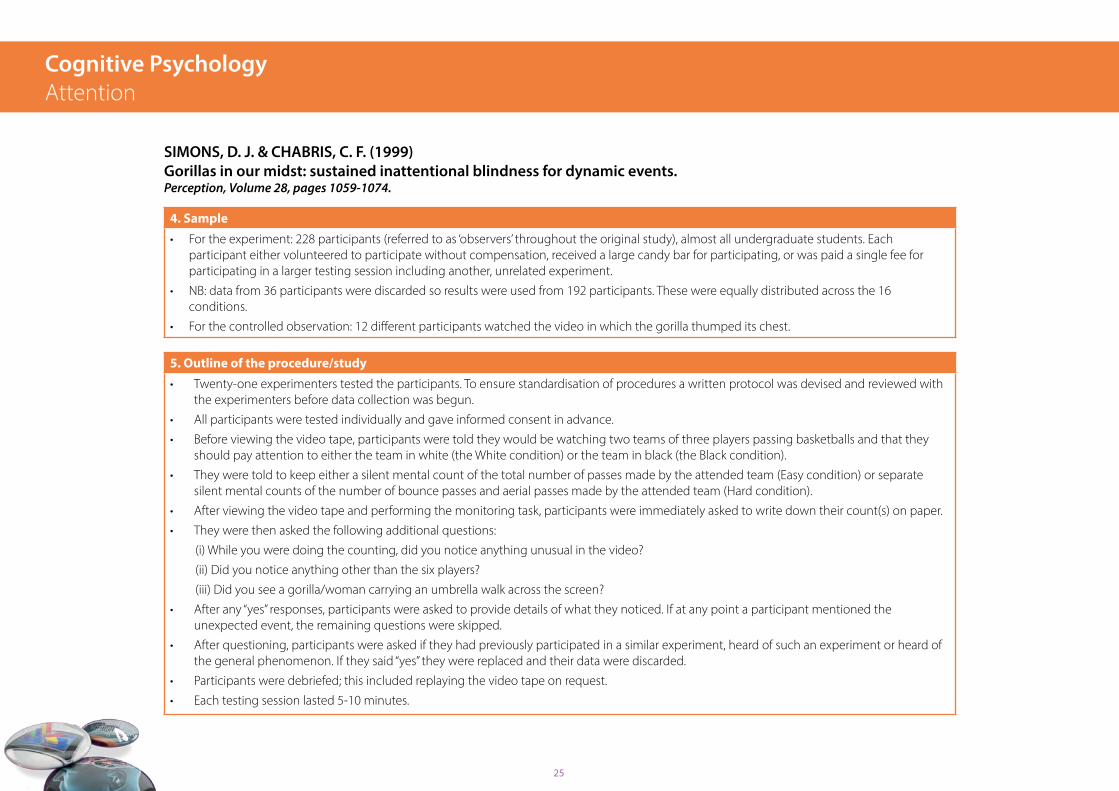
4. Sample
• For the experiment: 228 participants (referred to as ‘observers’ throughout the original study), almost all undergraduate students. Each participant either volunteered to participate without compensation, received a large candy bar for participating, or was paid a single fee for participating in a larger testing session including another, unrelated experiment.
• NB: data from 36 participants were discarded so results were used from 192 participants. These were equally distributed across the 16 conditions.
• For the controlled observation: 12 different participants watched the video in which the gorilla thumped its chest.
5. Outline of the procedure/study
• Twenty-one experimenters tested the participants. To ensure standardisation of procedures a written protocol was devised and reviewed with the experimenters before data collection was begun.
• All participants were tested individually and gave informed consent in advance.
• Before viewing the video tape, participants were told they would be watching two teams of three players passing basketballs and that they should pay attention to either the team in white (the White condition) or the team in black (the Black condition).
• They were told to keep either a silent mental count of the total number of passes made by the attended team (Easy condition) or separate silent mental counts of the number of bounce passes and aerial passes made by the attended team (Hard condition).
• After viewing the video tape and performing the monitoring task, participants were immediately asked to write down their count(s) on paper.
• They were then asked the following additional questions:
(i) While you were doing the counting, did you notice anything unusual in the video?
(ii) Did you notice anything other than the six players?
(iii) Did you see a gorilla/woman carrying an umbrella walk across the screen?
• After any “yes” responses, participants were asked to provide details of what they noticed. If at any point a participant mentioned the unexpected event, the remaining questions were skipped.
• After questioning, participants were asked if they had previously participated in a similar experiment, heard of such an experiment or heard of the general phenomenon. If they said “yes” they were replaced and their data were discarded.
• Participants were debriefed; this included replaying the video tape on request.
• Each testing session lasted 5-10 minutes.
SIMONS, D. J. & CHABRIS, C. F. (1999) Gorillas in our midst: sustained inattentional blindness for dynamic events. Perception, Volume 28, pages 1059-1074.
Cognitive Psychology Attention
26
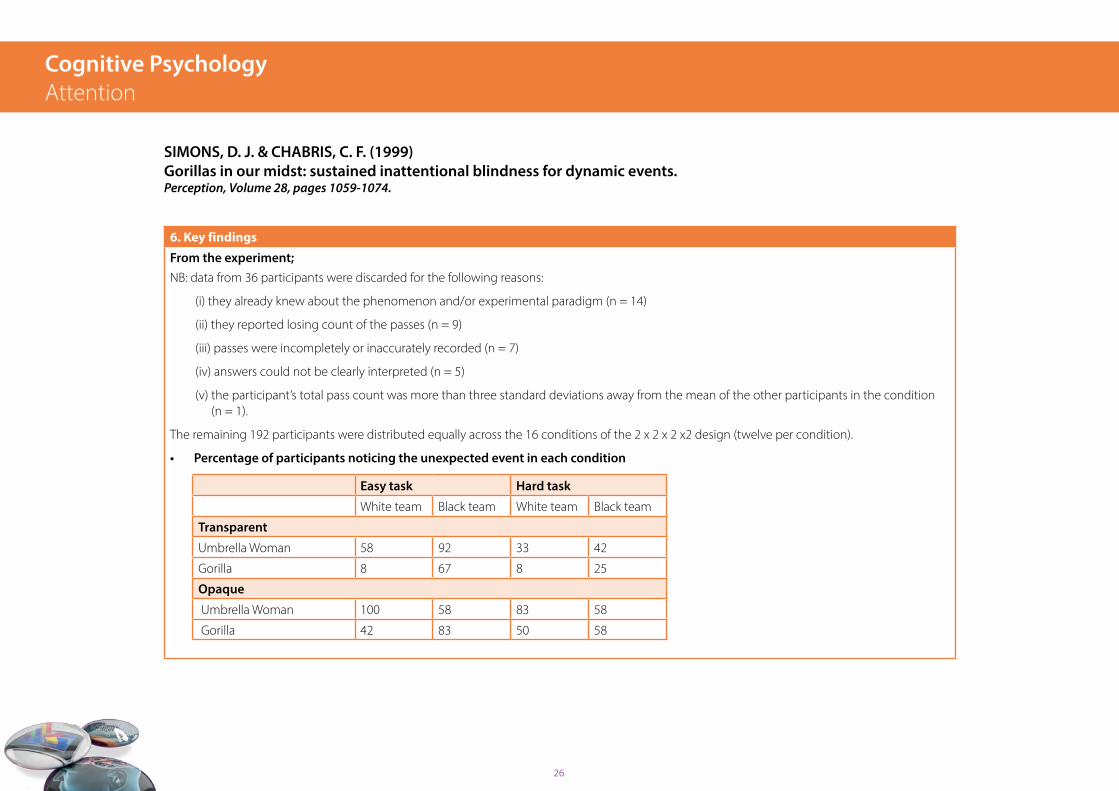
6. Key findings
From the experiment;NB: data from 36 participants were discarded for the following reasons:
(i) they already knew about the phenomenon and/or experimental paradigm (n = 14)
(ii) they reported losing count of the passes (n = 9)
(iii) passes were incompletely or inaccurately recorded (n = 7)
(iv) answers could not be clearly interpreted (n = 5)
(v) the participant’s total pass count was more than three standard deviations away from the mean of the other participants in the condition (n = 1).
The remaining 192 participants were distributed equally across the 16 conditions of the 2 x 2 x 2 x2 design (twelve per condition).
• Percentage of participants noticing the unexpected event in each condition
SIMONS, D. J. & CHABRIS, C. F. (1999) Gorillas in our midst: sustained inattentional blindness for dynamic events. Perception, Volume 28, pages 1059-1074.
Cognitive Psychology Attention
Easy task Hard task
White team Black team White team Black team
Transparent
Umbrella Woman 58 92 33 42
Gorilla 8 67 8 25
Opaque
Umbrella Woman 100 58 83 58
Gorilla 42 83 50 58
27
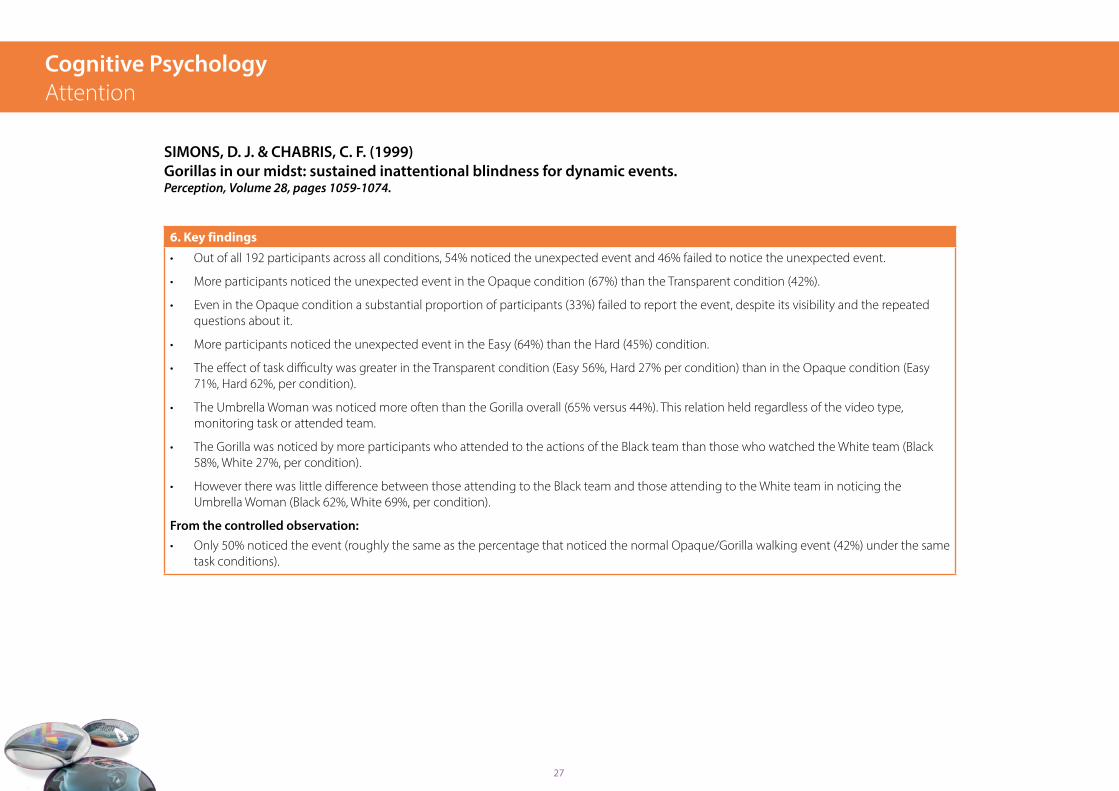
6. Key findings
• Out of all 192 participants across all conditions, 54% noticed the unexpected event and 46% failed to notice the unexpected event.
• More participants noticed the unexpected event in the Opaque condition (67%) than the Transparent condition (42%).
• Even in the Opaque condition a substantial proportion of participants (33%) failed to report the event, despite its visibility and the repeated questions about it.
• More participants noticed the unexpected event in the Easy (64%) than the Hard (45%) condition.
• The effect of task difficulty was greater in the Transparent condition (Easy 56%, Hard 27% per condition) than in the Opaque condition (Easy 71%, Hard 62%, per condition).
• The Umbrella Woman was noticed more often than the Gorilla overall (65% versus 44%). This relation held regardless of the video type, monitoring task or attended team.
• The Gorilla was noticed by more participants who attended to the actions of the Black team than those who watched the White team (Black 58%, White 27%, per condition).
• However there was little difference between those attending to the Black team and those attending to the White team in noticing the Umbrella Woman (Black 62%, White 69%, per condition).
From the controlled observation:• Only 50% noticed the event (roughly the same as the percentage that noticed the normal Opaque/Gorilla walking event (42%) under the same
task conditions).
SIMONS, D. J. & CHABRIS, C. F. (1999) Gorillas in our midst: sustained inattentional blindness for dynamic events. Perception, Volume 28, pages 1059-1074.
Cognitive Psychology Attention

28
7. Possible conclusions
• Individuals have a sustained inattentional blindness for dynamic events.
• Individuals fail to notice an ongoing and highly salient but unexpected event if they are engaged in a primary monitoring task.
• Inattentional blindness is a ubiquitous perceptual phenomenon (rather than an artefact of particular display conditions).
• The level of inattentional blindness depends on the difficulty of the primary task.
• Individuals are more likely to notice unexpected events if these events are visually similar to the events they are paying attention to.
• Objects can pass through the spatial extent of attentional focus (and the fovea) and still not be ‘seen’ if they are not specifically being attended to.
• There is no conscious perception without attention.
SIMONS, D. J. & CHABRIS, C. F. (1999) Gorillas in our midst: sustained inattentional blindness for dynamic events. Perception, Volume 28, pages 1059-1074.
Cognitive Psychology Attention

29
1. Theory/ies on which the study is based
• At birth we’re all amoral, lacking any system of personal values and judgements about what is right and wrong.
• In the field of moral development, morality is usually defined as principles for how individuals ought to treat one another, with respect to justice, others’ welfare, and rights.
• The main theories of moral development include:
• (a) Freud’s psychoanalytic theory (circa 1930). Freud believed that the personality (psychic apparatus) comprises of three parts: the id, ego and superego. The id contains everything that is inherited, that is present at birth, the instincts. The ego is a part of the id which becomes modified by the direct influence of the external world and represents reason and common sense, in contrast to the psyche which contains the passions. Not until the superego has developed can individuals be described as moral beings. The superego represents the internalisation of parental and social moral values. There are two main aspects of the superego, the conscience and the ego-ideal. The conscience represents the punishing parent and imposes feelings of guilt for immoral thoughts or deeds; whereas the ego-ideal represents the rewarding parent and is responsible for feelings of pride and satisfaction, for ‘good’ thoughts or deeds.
• Freud proposed the existence of a tension between the needs of society and the individual. According to Freud, the moral development proceeds when the individual’s selfish desires are repressed and replaced by the values of important socialising agents in one’s life such as parents.
• (b) Skinner’s behaviourist theory (1938). Skinner, like Freud, focused on socialisation as the primary force behind moral development. In contrast to Freud’s notion of a struggle between internal and external forces, Skinner focused on the power of external forces (reinforcement contingencies) to shape an individual’s development.
• (c) Piaget’s cognitive theory (1965). Piaget focused on the individual’s construction, construal and interpretation of morality from a social-cognitive and social-emotional perspective. To understand adult morality, Piaget believed that it was necessary to study both how morality manifests in the child’s world and the factors that contribute to the emergence of central moral concepts such as welfare, justice and rights. Interviewing children using the clinical interview method, Piaget argued that young children (ten years of age and younger) were focused on authority mandates, and that with age children become autonomous, evaluating actions from a set of independent principles of morality.
KOHLBERG, L. (1968) The child as a moral philosopher. Psychology Today, Volume 2, No. 4, pages 24-30.
Developmental Psychology Moral Development

30
2. Background to the study
• The earliest major psychological study of moral character was conducted by Hartshorne and May (1928-30). The study focused on a variety of virtues including honesty, service (altruism or generosity), and self-control. Their findings showed there were no personality traits, psychological dispositions or entities which correspond to words like honest, service and self-control.
• Kohlberg was inspired by Piaget’s pioneering effort to apply a structural approach to moral development rather than linking it to personality traits. He therefore expanded on Piagetian notions of moral development and saw moral development as a more gradual process than Piaget. He provided a systematic three-level, six-stage sequence of development which reflected changes in moral judgement throughout the lifespan. Specifically, Kohlberg argued that development proceeds from a selfish desire to avoid punishment (personal), to a concern for group functioning (societal), to a concern for the consistent application of universal ethical principles.
• Over the years Kohlberg gradually elaborated a typological scheme which described general structures and forms of moral thought which can be defined independently of the specific content of particular moral decisions or actions.
• The typology contains three distinct levels of moral thinking, and within each of these levels distinguishes two related stages,
Kohlberg’s theory of moral development- Everyone progresses through the levels and stages in order.
• In this study Kohlberg aimed to find evidence to support his theory of moral development.
KOHLBERG, L. (1968) The child as a moral philosopher. Psychology Today, Volume 2, No. 4, pages 24-30.
Developmental Psychology Moral Development
Level Stage Moral reasoning shown
1. Preconventional (usually occupies children aged 4-10)
1. Punishment and obedience orientation Rules are kept to avoid punishment
2. Instrumental-relativist orientation ‘Right’ behaviour is that which ultimately brings rewards to oneself
2. Conventional 3. Good boy-good girl orientation ‘Good’ behaviour is what pleases others – conformity to goodness
4. Law and order orientation Doing one’s duty, obeying laws is important
3. Post-conventional 5. Social contract orientation ‘Right’ is what is democratically agreed upon
6. Universal principles orientation
Moral action is taken based upon self-chosen principles

31
3. Research method
• This was a longitudinal study which followed the development of the same group of boys for 12 years by presenting them with hypothetical moral dilemmas, all deliberately philosophical, some of them found in medieval works of casuistry. The aim was to show how, as young adolescents develop into young manhood, they move through the distinct levels and stages of moral development proposed by Kohlberg in his theory of moral development.
• Kohlberg also studied moral development in other cultures using hypothetical moral dilemmas. This study therefore has a cross-cultural element.
4. Sample
• 75 American boys who were aged 10-16 at the start of the study were followed at three-year intervals through to ages 22-28.
• Moral development was also studied in boys of other cultures including Great Britain, Canada, Taiwan, Mexico and Turkey.
KOHLBERG, L. (1968) The child as a moral philosopher. Psychology Today, Volume 2, No. 4, pages 24-30.
Developmental Psychology Moral Development

32
5. Outline of the procedure/study
Using 75 American boys• Participants were presented with hypothetical moral dilemmas in the form of short stories to solve.
• The stories were to determine each participant’s stage of moral reasoning for each of 25 moral concepts/aspects.
• Aspects assessed included:
- Motive Given for Rule Obedience or Moral Action
- The value of human life: tested by asking the participant:
Aged 10: “Is it better to save the life of one important person or a lot of unimportant people?”
Aged 13, 16, 20 and 24: “Should the doctor ‘mercy kill’ a fatally ill woman requesting death because of her pain?”
Using different cultures• Taiwanese boys, aged 10-13, were asked about a story involving theft of food: “A man’s wife is starving to death but the store owner won’t give
the man any food unless he can pay, which he can’t. Should he break in and steal some food? Why?”
• Young boys in Great Britain, Canada, Mexico and Turkey were tested in a similar way.
KOHLBERG, L. (1968) The child as a moral philosopher. Psychology Today, Volume 2, No. 4, pages 24-30.
Developmental Psychology Moral Development
6. Key findings
In relation to ‘Motive Given for Rule Obedience or Moral Action’: Each of Kohlberg’s six stages were shown as follows:
1: Obey rules to avoid punishment.
2: Conform to obtain rewards, have favours returned etc.
3. Conform to avoid disapproval, dislike by others.
4. Conform to avoid censure by legitimate authorities and resultant guilt.
5. Conform to maintain the respect of the impartial spectator judging in terms of community welfare.
6. Conform to avoid self-condemnation.
In relation to the ‘value of human life’: The six stages were shown as follows:
1. The value of a human life is confused with the value of physical objects and is based on the social status or physical attributes of its possessor.
33
6. Key findings
2. The value of human life is seen as instrumental to the satisfaction of the needs of its possessor or of other people.
3. The value of human life is based on the empathy and affection of family members and others toward its possessor.
4. Life is conceived as sacred in terms of its place in a categorical moral or religious order of rights and duties.
5. Life is valued both in terms of its relation to community welfare and in terms of life being a universal human right.
6. Belief in the sacredness of human life as representing a universal human value of respect for the individual.
• In his study Kohlberg gives examples of how boys in his research demonstrated each stage of moral reasoning and how values change as individuals progress through the stages.
• Results showed that about 50% of each of the six stages a participant’s thinking was at a single stage, regardless of the moral dilemma involved and participants showed progress through the stages with increased age.
• Not all participants over the period of the study progressed through all the stages and reached Stage-6.
• Participants progressed through the stages one at a time and always in the same order.
• Once a participant had reached a particular stage, they either stopped or continued to move upward. No adults in Stage-4 had been through Stage-6, but all Stage-6 adults had gone through at least Stage-4.
• A child at an earlier stage of development tends to move forward when confronted with the views of a child one stage further along and they seem to prefer this next stage.
Cross-cultural findings:
• Taiwanese boys aged 10-13 tended to give ‘classic’ Stage-2 responses.
• Middle-class urban boys aged 10 in the US, Taiwan and Mexico showed the order of use of each stage to be the same as the order of its difficulty or maturity.
• In the US, by age 16, Stage-6 was rarely used. At age 13, the good-boy, middle stage (Stage-3) was not used.
• Mexico and Taiwan showed the same results except that development was a little slower.
• At the age of 16, Stage-5 thinking was much more salient in the US than either Mexico or Taiwan.
• Results for two isolated villages, one in Yacatan, one in Turkey, also showed that moral thought increased steadily from ages 10-16 though it had not achieved a clear ascendency over preconventional thought.
• Trends for lower-class urban groups were intermediate in the rate of development between those for middle-class and for village boys. In these three divergent cultures therefore, middle-class children were found to be more advanced in moral judgement than matched lower-class children.
• No important differences were found in the development of moral thinking among Catholics, Protestants, Jews, Buddhists, Muslims or Atheists.
KOHLBERG, L. (1968) The child as a moral philosopher. Psychology Today, Volume 2, No. 4, pages 24-30.
Developmental Psychology Moral Development

34
7. Possible conclusions
• There is an invariant developmental sequence in an individual’s moral development.
• Each stage of moral development comes one at a time and always in the same order.
• An individual may stop at any given stage and at any age.
• Moral development fits with Kohlberg’s stage-pattern theory.
• There is a cultural universality of sequence of stages.
• Middle-class and working-class children move through the same sequence but middle-class children move faster and further.
• This 6-Stage theory of moral development is not significantly affected by widely ranging social, cultural or religious conditions. The only thing that is affected is the rate at which individuals progress through the sequence.
KOHLBERG, L. (1968) The child as a moral philosopher. Psychology Today, Volume 2, No. 4, pages 24-30.
Developmental Psychology Moral Development

35
1. Theory/ies on which the study is based
• Children’s moral judgements about lying and truth telling primarily rely on the extent to which a verbal statement differs from factuality and whether or not the lie is punished. Not until around 11 years of age do children begin to use the protagonist’s intention as the key factor of their moral judgements (Piaget 1932/1965).
• Other researchers disagree with Piaget’s claim that the use of intention emerges at only around 11 years of age. There is now a general consensus that preschool children and young school-aged children are distinctly capable of distinguishing lying from behavioural misdeeds and can make consistent and accurate moral judgements in a similar way to that of older children and adults when both the falsity of a statement and the speaker’s intention to deceive are highlighted e.g. Wimmer et al, 1984.
• The following theories of moral development are referred to in the overview of Kohlberg’s study, ‘The child as a moral philosopher’:
(a) Freud’s psychoanalytic theory
(b) Skinner’s behaviourist theory
(c) Piaget’s cognitive theory
(d) Kohlberg’s cognitive theory.
• Sweetser (1987) proposed a folkloristic model of lying. She suggested that the concept of lying is not simply a cognitive construct defined by such key semantic features as factuality (whether a statement reflects the truth), intention (whether the speaker intends to deceive), and belief (whether the speaker believes the statement) alone, but it is also a socio-cultural construct. She argued that the understanding of lying is greatly influenced by the cultural norms and moral values in which individuals are socialised. However, until this study, little systematic developmental evidence had been found to support this proposal.
• Kohlberg conducted cross-cultural research to support his theory of moral development, but did not specifically focus on the ‘art of lying’.
Developmental Psychology Moral Development
LEE, K., CAMERON, C., XU, F., FU,G. & BOARD, J. (1997) Chinese and Canadian children’s evaluations of lying and truth telling: Similarities and differences in the context of pro- and antisocial behaviours. Child Development, Volume 68, No. 5, pages 924-934

36
2. Background to the study
• Children’s understanding and moral judgement of lying and truth telling was an early topic of investigation in developmental psychology e.g. Binet, 1896; Hall,1891.
• Since the early 1980s, developmental psychologists have showed renewed interest in children’s understanding and moral judgements of lying and truth telling e.g. Wimmer, Gruber & Perner, 1984; Peterson, 1995.
• Despite the advances of research in recent years, understanding of the development of children’s moral development of lying is still somewhat restricted. One of the limitations is that nearly all previous research was conducted with children in Western countries. These children were raised in industrialised environments that emphasise individualism, self-assertion/promotion and competition. It was therefore unclear whether the findings with these children could be generalised to children of other socio-cultural backgrounds.
• This study was conducted to bridge the gap between this literature by directly testing the posited effect of culture on children’s moral evaluations of lying and truth telling.
• This study compares the moral judgements of Canadian children and Chinese children from the People’s Republic of China (PRC) in situations in which pro- and antisocial actions were denied or acknowledged.
• The original study contains a detailed justification for why Chinese children in the PRC were compared with children from the Western culture of Canada.
Developmental Psychology Moral Development
LEE, K., CAMERON, C., XU, F., FU,G. & BOARD, J. (1997) Chinese and Canadian children’s evaluations of lying and truth telling: Similarities and differences in the context of pro- and antisocial behaviours. Child Development, Volume 68, No. 5, pages 924-934

37
3. Research method
• This was a laboratory experiment which used an independent measures design.
• The independent variables (IVs) were:
(i) whether the participant heard the social story or the physical story
(ii) whether the participant heard (prosocial) stories involving a child who intentionally carried out a good deed (a deed valued by adults in both countries) or (antisocial) stories involving a child who intentionally carried out a bad deed (a deed viewed negatively in both cultures).
There were therefore four conditions: Prosocial Behaviour/Truth-Telling stories, Prosocial Behaviour/Lie-Telling stories, Antisocial Behaviour/Truth-Telling stories, Antisocial Behaviour/Lie-Telling stories.
• The dependent variables (DVs) were:
(i) the rating given to the story character’s deed (ranging between very, very good and very, very naughty)
(ii) the rating given to what the character said (verbal statement) (ranging between very, very good and very, very naughty).
• The fact that participants were read four scenarios (two prosocial and two antisocial) and asked to apply the same rating scale to both the character’s deed and its response in each story means the study had elements of a repeated measures design within it.
4. Sample
• 120 Chinese children: 40 7-year-olds (M age = 7.5 years, 20 male, 20 female), 40 9-year-olds (M age = 9.4 years, 20 male, 20 female), and 40 11-year-olds (M age = 11.3years, 20 male, 20 female). They were recruited from elementary schools in Hangzhou, Zhejiang Province, a medium-sized city (provincial capital) in the PRC.
• 108 Canadian children: 36 7-year-olds (M age = 7.4 years, 20 male, 16 female), 40 9-year-olds (M = 9.6 years, 24 male, 16 female), 32 11-year-olds (M age = 11.5 years, 14 male, 18 female). They were recruited from elementary schools in Fredericton, New Brunswick, Canada. Like Hangzhou, Fredericton is a provincial capital but its population is considerably smaller than Hangzhou.
• Although the socio-economic status of the Chinese children was not known (no such categorisation exists in the PRC), most Canadian children were from middle-class families.
Developmental Psychology Moral Development
LEE, K., CAMERON, C., XU, F., FU,G. & BOARD, J. (1997) Chinese and Canadian children’s evaluations of lying and truth telling: Similarities and differences in the context of pro- and antisocial behaviours. Child Development, Volume 68, No. 5, pages 924-934

38
5. Outline of the procedure/study
• Half of the Chinese children participated in the social story condition and the other half were placed in the physical story condition. The children were randomly assigned to each condition.
• From the Canadian sample: 19 7-year-olds, 20 9-year-olds and 17 11-year-olds were randomly assigned to the social story condition and the other children were assigned to the physical story condition.
Materials• Participants were read four scenarios accompanied by illustrations, two prosocial, two antisocial. All 8 stories can be found in Appendix of the
original article, however the Prosocial Behaviour/Lie-Telling story went as follows:
Here is Alex. Alex’s class had to stay inside at recess time because of bad weather, so Alex decided to tidy up the classroom for his teacher.
(Question 1: Is what Alex did good or naughty?)
So Alex cleaned the classroom, and when the teacher returned after recess, she said to her students, “Oh, I see that someone has cleaned the classroom for me.” The teacher then asked Alex, “Do you know who cleaned the classroom?” Alex said to his teacher, “I did not do it.”
(Question 2: Is what Alex did good or naughty?)
• Each participant was tested individually.
• Participants were first instructed about the meaning of the words and the symbols for rating the deeds and verbal statements on a 7-point rating chart. These were: very, very good (3 red stars), very good (2 red stars), good (1 red star), neither good not naughty (blue circle), naughty (1 black cross), very naughty (2 black crosses), very, very naughty (3 black crosses).
• Participants were then read either the four social or four physical stories. The story’s ‘deed’ section was read first and then they would indicate their rating either verbally, non-verbally or both on the rating chart.
• They were then read the second section of the story and would then indicate, in the same way, their rating for the character’s verbal statement.
• The meaning of each symbol was repeated every time a question was asked.
• The words ‘good’ and ‘naughty’, in the two questions were altered within subjects.
• To control for order effects, for each condition, two orders of the four stories were first determined using a randomisation table. About half of the participants in each condition were read the stories in one predetermined order, and the other half were read them in the other order.
• Participants were then involved in post-experimental discussions.
Developmental Psychology Moral Development
LEE, K., CAMERON, C., XU, F., FU,G. & BOARD, J. (1997) Chinese and Canadian children’s evaluations of lying and truth telling: Similarities and differences in the context of pro- and antisocial behaviours. Child Development, Volume 68, No. 5, pages 924-934

39
6. Key findings
NB: Participants’ ratings were converted according to the following scale: very, very good = 3, very good = 2, good =1, neither good nor naughty = 0, naughty = -1, very naughty = -2, very, very naughty = -3.
Preliminary analyses of the effects of order and gender showed no significant differences so the data for these two dimensions were combined for subsequent analyses.
• Prosocial Behaviour/Truth-Telling Situations:A planned 2 (culture: Canadian and Chinese) x 2 (condition: physical and social stories) x 3 (age: 7, 9, 11 years) analysis of covariance with the ratings of deeds as covariates was conducted on participants’ ratings of truth telling. The covariate was not significant, t(1) = .34 ns; indicating that children of both cultures rated the prosocial behaviours similarly. The age and culture main effects were significant with Canadian children at each age giving similar ratings to truth telling whereas Chinese children’s ratings became less positive as age increased. The condition main effect was not significant.
• Prosocial behaviour/Lie-Telling Situations:- A planned 2 x 2 x 3 analysis of covariance with the ratings of deeds as covariates was conducted on participants’ ratings of lie telling. The
covariate was significant, t(1) = 2.88, p≤ .01, indicating that children from the two cultures rated the prosocial behaviours differently both in different age groups and in the two conditions. After partialing out the effect of, the age and culture main effects remained significant. The condition main effect was not significant. Only the interaction between age and culture was therefore significant.
- Overall, Canadian children rated lie telling in this situation negatively but as age increased their ratings became somewhat less negative.
- Overall, Chinese children’s ratings of lie telling in this situation changed from negative to positive as age increased.
• Antisocial Behaviour/Truth-Telling Situations:- A planned 2 x 2 x 3 analysis of covariance with the ratings of deeds as covariates was conducted on participants’ ratings of truth telling.
The covariate was not significant, t(1) = -1.51, ns, indicating that children from both cultures rated the antisocial behaviours similarly. No main effect or interaction was significant.
- Children from both cultures rated truth telling in this situation very positively.
Developmental Psychology Moral Development
LEE, K., CAMERON, C., XU, F., FU,G. & BOARD, J. (1997) Chinese and Canadian children’s evaluations of lying and truth telling: Similarities and differences in the context of pro- and antisocial behaviours. Child Development, Volume 68, No. 5, pages 924-934

40
6. Key findings
• Antisocial behaviour/Lie-Telling Situations:- A planned 2 x 2 x 3 analysis of covariance with the ratings of deeds as covariates was conducted on participants’ ratings of lie telling. The
covariate was significant, t(1) = 4.96, p ≤ .01, indicating that children of both cultures rated the antisocial behaviours differently in different age groups in the two conditions. After partialing out the effect of the covariates, the age main effect remained significant. The culture and conditions main effects were not significant. Only the interaction between age, culture and condition was significant.
- Both Chinese and Canadian children rated lie telling negatively in this condition.
- Overall, negative ratings increased with age, irrespective of culture.
- Chinese 7-year-olds rated lie telling less negatively then older children in the physical story condition, whereas Canadian 7-year-olds rated lie telling less negatively than older children in the social story condition.
LEE, K., CAMERON, C., XU, F., FU,G. & BOARD, J. (1997) Chinese and Canadian children’s evaluations of lying and truth telling: Similarities and differences in the context of pro- and antisocial behaviours. Child Development, Volume 68, No. 5, pages 924-934
Developmental Psychology Moral Development
7. Possible conclusions
• In the realm of lying and truth telling, a close relationship between socio-cultural practices and moral judgements exists.
• Specific social and cultural norms have an impact on children’s developing moral judgements, which in turn, are modified by age and experience in a particular culture.
• Chinese children rate truth telling in prosocial situations less positively and lie telling in the same situations less negatively than Canadian children.
• Both Chinese and Canadian children show similar moral evaluations of lie telling and truth telling related to antisocial behaviours.
• The emphasis on self-effacement and modesty in Chinese culture increasingly exerts its impact on Chinese children’s moral judgements.
• Moral development is a highly contextualised process and is affected by the culture and/or social environment in which individuals are socialised.
41
1. Theory/ies on which the study is based
• Cat intelligence is the capacity of the domesticated cat to learn, solve problems and adapt to its environment.
• According to researchers at Tufts University School of Vetinary Medicine in Boston, the physical structure of the brains of humans and cats is very similar: both have cerebral cortices with similar lobes, both are gyrencephalic i.e. they have a surface folding, both have grey and white matter.
• The thalamus of a cat, constituting a hypothalamus, epithalamus and dorsal parts and including a lateral geniculate nucleus, and additional secondary nuclear structures are responsible for controlling impulses to the cortex, functions of sleep, memory originally formed of sensory data and other cellular functioning.
• Kittens’ brains have a neuroplasticity: control of visual stimuli correlated with changes in RNA structures: cats possess visual-recognition memory and have flexibility of cerebral encoding from visual information, adaptability corresponding to changing environmental stimuli (Grouse et al, 1979; Okujav et al, 2005, Okujav et al, 2009).
• In a normal cat, neurones of the visual cortex are selective for the orientation of lines and edges in the visual field, and the preferred orientations of different cells are distributed all around the clock (Hubel & Wiesel, 1962).
2. Background to the study
• Hirsch and Spinelli (1970) reported that early visual experience can change neural organisation in kittens. They reared kittens with one eye viewing vertical stripes, the other horizontal and found that out of 21 neurones with elongated receptive fields all were monocularly driven, and in all but one case the orientation of the receptive field closely matched the pattern experienced by that eye.
• Blakemore and Cooper therefore began a related project and this study is a preliminary report of their findings.
• Their approach is slightly different to that of Hirsch and Spinelli in that they allowed kittens normal binocular vision in an environment consisting entirely of horizontal or vertical stripes. (Monocular vision is vision in which each eye is used separately whereas binocular vision is vision in which both eyes are used together).
• The aim of this study was therefore to investigate the development of the primary visual cortex (in cats) and to find out if some of its properties such as orientation selectivity are innate (as suggested by Hubel and Wiesel) or learned.
BLAKEMORE, C. & COOPER, G. F. (1970) Development of the brain depends on the visual environment. Nature, Volume 228, pages 477-478.
Biological Psychology Brain plasticity

42
3. Research method
• This was a laboratory experiment which used an independent measures design.
• The independent variable (IV) was: whether the kittens were reared in a horizontal or a vertical environment.
• The dependent variable (DV) was their visuomotor behaviour once they were placed in an illuminated environment i.e. whether the horizontally raised kittens could detect vertically aligned objects and/or if the vertically raised kittens could detect horizontally aligned objects.
4. Sample
• Kittens (studied from birth until this report was compiled) were randomly allocated to one of the two conditions.
• Two of the kittens (one reared in a horizontal and one in a vertical environment) were used to study neurophysical effects.
BLAKEMORE, C. & COOPER, G. F. (1970) Development of the brain depends on the visual environment. Nature, Volume 228, pages 477-478.
Biological Psychology Brain plasticity

43
5. Outline of the procedure/study
• The kittens were housed from birth in a completely dark room.
• From the age of two weeks they were put into a special apparatus for an average of about five hours per day. The kitten stood on a clear glass platform inside a tall cylinder the entire inner surface of which was covered with high contrast black-and-white stripes, either vertical or horizontal. There were no corners to its environment, no edges to its floor and the upper and lower limits to its world of stripes were a long way away. It could not even see its body as it wore a wide black collar that restricted its visual field to a width of about 130o (The kittens did not seem upset by the monotony of their surroundings and sat for long periods inspecting the walls of the tube.)
• This routine was stopped when the kittens were 5 months old (well beyond the ‘critical period’ in which total visual deprivation causes physiological deficits, Hubel & Weisel, 1970).
• The kittens were then taken for several hours each week from their dark cage to a small, well-lit room, furnished with tables and chairs.
• Their visual reactions were observed and recorded/noted.
• At 7.5 months, two of the kittens (one reared in the horizontal and one reared in the vertical environment) were anaesthetised so their neurophysiology could be examined.
BLAKEMORE, C. & COOPER, G. F. (1970) Development of the brain depends on the visual environment. Nature, Volume 228, pages 477-478.
Biological Psychology Brain plasticity

44
6. Some key findings
• Regardless of whether the kittens had been exposed to vertical or horizontal stripes, they were initially extremely visually impaired:
- Their papillary reflexes were normal but they showed no visual placing when brought up to a table top and no startle response when an object was thrust towards them.
- They guided themselves mainly by touch.
- They were frightened when they reached the edge of the surface they were standing on.
- They showed ‘behavioural blindness’ in that the kittens raised in the horizontal environment could not detect vertically aligned objects and vice versa.
- Only the eyes of the kitten brought up in vertical stripes followed a rod held vertically and only the eyes of the kitten reared in horizontal stripes followed the rod if it was held horizontally i.e. both kittens remained blind to contours perpendicular to the stripes they had lived with.
• The kittens quickly recovered from many of the deficiencies and within a total of about 10 hours of normal vision they showed startled responses and visual placing and would jump with ease from a chair to the floor.
• However, some of their defects were permanent:
- They always followed moving objects with very clumsy, jerky head movements.
- They often tried to touch things moving on the other side of the room, well beyond their reach.
• The neurophysiological examination showed:
- No evidence of severe astigmatism, which might have explained the behavioural responses.
- Horizontal plane recognition cells did not ‘fire-off’ in the kitten from the vertical environment and vertical plane cells did not ‘fire-off’ in the kitten from the horizontal environment so there was distinct orientation selectivity, showing the kittens suffered from ‘physical blindness’.
- About 75% of cells in both cats were clearly binocular and in almost every way the responses were like that of a normal kitten.
- The distributions of preferred orientation were however totally abnormal: not one neurone had its optimal orientation within 20o of the inappropriate axis and there were, in total, only twelve within 45o of it. This anisotropy (the property of being directionally dependent) was significant at p≤ 0.00001: chi squared test.
- No obvious large regions of ‘silent’ cortex corresponding to the ‘missing’ cortical columns were observed/found.
BLAKEMORE, C. & COOPER, G. F. (1970) Development of the brain depends on the visual environment. Nature, Volume 228, pages 477-478.
Biological Psychology Brain plasticity

45
7. Possible conclusions
• Visual experiences in the early life of kittens can modify their brains and have profound perceptual consequences.
• A kitten’s visual cortex may adjust itself during maturation to the nature of its visual experience.
• A kitten’s nervous system adapts to match the probability of occurrence of features of its visual input.
• Brain development is determined by the functional demands made upon it, rather than pre-programmed genetic factors.
• The environment can determine perception at both a behavioural and physiological level – at least in cats. It is questionable as to whether results can be generalised to humans.
BLAKEMORE, C. & COOPER, G. F. (1970) Development of the brain depends on the visual environment. Nature, Volume 228, pages 477-478.
Biological Psychology Brain plasticity
46
MAGUIRE, E. A., GADIAN, D. G., JOHNSRUDE, I. S., GOOD, C. D., ASHBURNER, J., FRACKOWIAK, R. S. & FRITH, C. D. (2000) Navigation-related structural change in the hippocampi of taxi drivers. Proceedings of the National Academy of Sciences of the United States of America. Volume 97, No. 8, pages 4398-4403.
Biological Psychology Brain plasticity
1. Theory/ies on which the study is based
• The hippocampus is one of the major structures of the limbic system. The human limbic system is very similar to that of primitive animals and is often referred to as the ‘old mammalian brain’. It is closely involved with behaviours that satisfy certain motivational, learning and emotional needs including feeding, fighting, escape, and mating.
• The hippocampus plays an important role in the laying down of new memories. It is found inside each hemisphere of the brain and is thought to play an important role in facilitating spatial memory and navigation. Recent research, such as this study, has indicated that lesions to the hippocampus affect an individual’s ability to remember the location of different places and things.
2. Background to the study
• Research has shown increased hippocampal volume relative to brain and body size in small mammals and birds who show behaviour requiring spatial memory e.g. food storing.
• In some species, hippocampal volumes enlarge specifically during seasons when spatial ability is greatest.
• Research has also shown that there are differences in the structure of healthy human brains e.g. between males and females, musicians and non-musicians.
• However past research has not shown:
(i) Whether differences in brain structure is susceptible to plastic change in response to environmental stimulation.
(ii) The precise role of the hippocampus in humans.
(iii) Whether the human brain responds to experiences requiring spatial memory in the same way as smaller mammals and birds.
• Maguire therefore aimed to show that the hippocampus in the human brain is the structure associated with spatial memory and navigation.
• Her sample of London taxi drivers was ideal because they have to acquire extensive spatial and navigational information (pass The Knowledge) on the city of London to gain their taxi driving licence.
• Her use of a group of taxi drivers with a wide range of navigational experience allowed her to examine the direct effect of spatial experience on brain structure.

47
3. Research method
• This was a quasi/natural experiment because the independent variable (IV) – whether the participant was a London taxi driver or a person who did not drive taxis – was naturally varying and so could not be manipulated or controlled by the researchers. The dependent variable (DV) was the volume of the hippocampi including their anterior, body and posterior regions; measured by analysing MRI scans of participants’ brain using the two techniques of VBM and pixel counting.
• The study used an independent measures, matched participants design.
MAGUIRE, E. A., GADIAN, D. G., JOHNSRUDE, I. S., GOOD, C. D., ASHBURNER, J., FRACKOWIAK, R. S. & FRITH, C. D. (2000) Navigation-related structural change in the hippocampi of taxi drivers. Proceedings of the National Academy of Sciences of the United States of America. Volume 97, No. 8, pages 4398-4403.
Biological Psychology Brain plasticity
4. Sample
• The experimental group of 16 taxi drivers were all healthy, right-handed, male London taxi drivers, mean age 44 years (range 32-62 years), mean time as a licensed London taxi driver (passed The Knowledge) 14.3 years (range 1.5-42 years).
• The control group who did not drive taxis (50 for the VBM analysis, 16 for the pixel counting) were matched for health, handedness, sex, mean age and age range.
5. Outline of the procedure/study
• The scans of the control group were selected from the structural MRI scan data base at the same unit where the taxi drivers were scanned.• The MRI scans of all participants were analysed using:
(i) VBM (voxel-based morphometry) which is an automatic procedure that ‘normalises’ the scans to a template to eliminate overall brain size as a variable and then identifies differences in grey matter density in different regions of the brain. The brains of the 16 taxi drivers were compared to those of 50 non-taxi drivers to see if there were any differences in structure.
(ii) Pixel counting compared the volume of anterior, body and posterior cross-sections of the taxi drivers’ hippocampi with those of a previously age, gender and handedness-matched sample of 16 controls taken from the 50 used in the VBM analysis. The images were analysed by one person experienced in the technique and blinded to whether the scan was of a taxi driver or a control and the VBM findings. This procedure allowed the total hippocampal volume to be calculated.

48
6. Key Findings
• VBM analysis showed no significant differences between the brains of the two groups except:(i) Taxi drivers had significantly increased grey matter volume in the right and left posterior hippocampi compared to controls.(ii) In the controls there was a relatively greater grey matter volume in the right and left anterior hippocampi compared to taxi drivers.
• Pixel counting showed that although there was no significant difference in overall volume of the hippocampi between the two groups:(i) Taxi drivers had a significantly greater posterior hippocampal volume than controls.(ii) Controls had a significantly greater anterior right hippocampal volume than the taxi drivers. (iii) A significantly greater hippocampal body volume on the right than the left in both the taxi drivers and the Controls.
Regions of the brain with the largest volume
• Correlations showed a significant positive correlation between the length of time as a taxi driver and the right posterior hippocampal volume, but a negative correlation for the anterior hippocampal volume.
MAGUIRE, E. A., GADIAN, D. G., JOHNSRUDE, I. S., GOOD, C. D., ASHBURNER, J., FRACKOWIAK, R. S. & FRITH, C. D. (2000) Navigation-related structural change in the hippocampi of taxi drivers. Proceedings of the National Academy of Sciences of the United States of America. Volume 97, No. 8, pages 4398-4403.
Biological Psychology Brain plasticity
Left hippocampus Right hippocampus
Anterior CONTROLS
Body NO EFFECT OF GROUP
Posterior TAXI DRIVERS TAXI DRIVERS

49
7. Possible conclusions
• There are regionally specific structural differences between the hippocampi of licensed London taxi drivers compared to those who do not drive London taxis.
• The professional dependence on navigational skills in licensed London taxi drivers is associated with a relative redistribution of grey matter in the hippocampus.
• It can be suggested that the changes in the arrangement of hippocampal grey matter are acquired i.e. due to nurture.
• Findings also indicate the possibility of local plasticity in the structure of a normal human brain which allows it to adapt in response to prolonged environmental stimuli.
MAGUIRE, E. A., GADIAN, D. G., JOHNSRUDE, I. S., GOOD, C. D., ASHBURNER, J., FRACKOWIAK, R. S. & FRITH, C. D. (2000) Navigation-related structural change in the hippocampi of taxi drivers. Proceedings of the National Academy of Sciences of the United States of America. Volume 97, No. 8, pages 4398-4403.
Biological Psychology Brain plasticity
50
1. Theory/ies on which the study is based
• Intelligence can be seen as essentially a system of living and acting operations i.e. a state of balance or equilibrium achieved by the person when he is able to deal adequately with the data before him. But it is not a static state, it is dynamic in that it continually adapts itself to new environmental stimuli (Piaget, J 1960 Psychology of Intelligence, Patterson, NJ: Littlefield, Adams.).
• Biological definitions see intelligence as related to adaptation to the environment.
• Intelligence is an innate, general cognitive ability (Burt, C.L. (1955). “The Evidence for the Concept of Intelligence,” British Journal of Educational Psychology, 25, 158–177).
• Intelligence is the ability to deal with cognitive complexity (Gottfredson, Linda S 1998 The general intelligence factor. Scientific American, Incorporated).
• Theories of intelligence include:
- Psychometric (factor-analysis) theories e.g. Spearman’s two-factor theory (1904), Burt (1949) and Vernon’s (1950) hierarchical model, Thurstone’s primary mental abilities.
- Fluid and crystallised intelligence e.g. Cattell, 1963; Horn & Cattell, 1967, 1982.
- Information-processing approach e.g. Sternberg, 1979; Fishbein, 1984.
- Gardner’s (1983, 1998) theory of multiple intelligence.
• Trying to define intelligence has proved problematic so researchers have tended to focus instead on testing intelligence, whatever intelligence may be!
• A key issue related to intelligence is the one of nature and nurture. Is intelligence innate (nature) or learned (nurture)? If it is learned we aren’t testing an unchanging thing but something that is a product of a person’s experience. In which case one should be able to enhance a person’s experience in such a way that their intelligence increases. If intelligence is learned then the only point in testing would be to work out who needs more teaching. On the other hand, if intelligence is innate and unchanging then the point of testing is to classify people. Intelligence tests do assume that intelligence is an innate and fixed quantity, because, otherwise what is the point in doing them?
• The term ‘IQ’ is the usual test score given in an intelligence test. It stands for ‘intelligence quotient’, a quotient being the result of a division – mental age (MA, one’s score on the test) divided by one’s chronological age (CA). This is done because one would expect a 5-year-old to do less well than a 10-year-old; therefore the scores should be adjusted for their age. The quotient is then multiplied by 100 to get rid of decimals:
IQ = MA x 100CA
GOULD, S. J. (1982) A nation of morons. New Scientist, Volume 6, pages 349-352.
Psychology of Individual Differences Measuring differences

51
2. Background to the study
• In 1904, Binet and Simon were commissioned by the French government to devise a test which would identify those children who wouldn’t benefit from ordinary schooling because of their inferior intelligence. The result was the Simon-Binet test (1905), generally accepted as the first intelligence test.
• In 1910, Terman at Stanford University began adapting the Simon-Binet test for use in the USA. The test became known as the Stanford-Binet test. It has been revised and modified numerous times since.
• Wechsler developed the most widely used test of adult intelligence, the Wechsler Adult Intelligence Scale (WAIS) in 1944. This has also been revised numerous times since it was first used.
• The Stanford-Binet and Wechsler tests are individual tests, given to one person at a time; whereas group tests are administered to several people at once. A major impetus to the development of group testing was America’s involvement in WW1. A quick and easy method of selecting over one million recruits was needed, and the result was the Army Alpha and Beta tests.
• Yerkes was a psychologist at Harvard University. At this time (early 1900s) psychology was perceived as a ‘soft’ science, so Yerkes wanted to improve its status by demonstrating that it could be as objective and quantifiable as the other scientific disciplines. Yerkes also believed that intelligence was inherited and therefore could not be changed (due to nature). He saw an opportunity to give psychology the status it deserved by incorporating his ideas of inherited intelligence and the development of mental testing, which at the time was in its earliest stages. He believed that if he could show that intelligence tests were reliable and valid, then this quantifiable measure would prove his point. With the outbreak of WW1, the now Colonel Yerkes, developed the idea that it might be possible to use recruits for the American army as a source of sufficient data to show that intelligence testing was scientific. Previous efforts to do this had been insufficiently co-ordinated or were simply inadequate. Colonel Yerkes managed to persuade the American government to go along with his idea.
• This Core Study aimed to examine the early history of intelligence testing as conducted by Yerkes on army recruits in the USA during WW1. Gould aimed to identify the following issues in psychology:
- The problematic nature of psychometric testing in general and the measurement of intelligence in particular.
- The problem of theoretical bias influencing research in psychology, in particular how psychological theories on the inherited nature of intelligence and the prejudice of a society can dramatically distort the objectivity of intelligence testing.
- The problem of the political and ethical implications of research, in this case the use of biased data to discriminate between people in suitability for occupation and even admission to a country.
GOULD, S. J. (1982) A nation of morons. New Scientist, Volume 6, pages 349-352.
Psychology of Individual Differences Measuring differences

52
3. Research method
• The Gould study is not a piece of empirical research. It is important to be aware that the article is an edited extract from Gould’s (1981) book, ‘The Mismeasure of Man’ in which he traces the history of the measurement of human intelligence from nineteenth century craniology (the measurement of skulls) to today’s highly technical and sophisticated methods of IQ testing.
• The study is therefore a review article that looks at the history of Robert M. Yerkes’ intelligence testing of recruits for the US army in WW1, and his attempt to establish psychology as a scientific discipline.
4. Sample
• 1.75 million army recruits in the USA during WW1. The recruits included White Americans, ‘Negroes’ and European immigrants.
GOULD, S. J. (1982) A nation of morons. New Scientist, Volume 6, pages 349-352.
Psychology of Individual Differences Measuring differences
5. Outline of the procedure/study• From May to July 1917, Yerkes, together with a number of colleagues who shared his views on the hereditary nature of intelligence, wrote the
army mental tests. Together they developed three types of test, the first two of which could be given to large groups and took less than an hour to complete.
THE ARMY ALPHA TEST• This was designed for literate recruits. It consisted of eight parts. It included items with which we are totally familiar as part of intelligence
testing: analogies, filling in the next number in a sequence etc. It required a good basic understanding of English language skills and literacy. Although the tests were considered by Yerkes to measure ‘native intellectual ability’ (intelligence that is not influenced by education and/or culture), they were in fact extremely biased. After all, how could someone who was unfamiliar with American culture achieve a decent score? The following examples give some idea of the type of questions asked:
• Washington is to Adams as first is to …….
• Crisco is a: patient medicine, disinfectant, toothpaste, food product?
• The number of kaffir’s legs is 2, 4, 6, 8?
• Christy Matthewson is famous as a: writer, artist, baseball player, comedian?

53
5. Outline of the procedure/studyTHE ARMY BETA TEST• This was a test designed for people who were illiterate or failed the Army Alpha Test. It had seven parts and consisted of picture completion
tasks e.g.
• The pictures were again culturally specific and would have been extremely difficult to complete if participants had no knowledge of some of the items. There were also maze tests, counting the number of cubes, finding the next in a series of symbols and translating numerals into symbols using a code to work from.
• The instructions were written (in English), in three of the seven parts the answers had to be given in writing, yet this was a test for illiterates who may never have held a pencil beforehand!
GOULD, S. J. (1982) A nation of morons. New Scientist, Volume 6, pages 349-352.
Psychology of Individual Differences Measuring differences
Item 18 A B C
D E F
?
54
5. Outline of the procedure/studyTHE INDIVIDUAL SPOKEN EXAMINATION:If recruits failed on the other two tests, they were supposed to be given an individual spoken examination, this however rarely happened.
• Every individual was given a Grade from A to E, with plus and minus signs e.g. C- indicated a low average intelligence, suitable for the position of ordinary private in the army; D indicated a person rarely suited for tasks requiring special skill, forethought, resourcefulness or sustained alertness.
• Administration of the tests caused numerous problems:
• Recruits who were illiterate should immediately have been assigned to the Beta Test, or given it if they failed the Alpha test, but this only happened in some camps. Therefore illiterate or immigrant recruits often sat the Alpha Test and came out scoring next to nothing.
• In fact the levels of literacy amongst Americans, especially black Americans, were much lower than Yerkes anticipated and this confounded the problems further.
• Queues for the Beta Test began to build up and this led to an artificial lowering of standards by the administrators in order to reallocate more men to the Alpha Test. In some camps, the minimum level of schooling was sufficient to warrant sitting the Alpha test, whereas in others the recruits had to achieve a certain grade.
• Besides these inconsistencies in administration, further problems arose with men, especially black men, who failed the Alpha Test not being allowed to re-sit the Beta Test.
• Only one fifth of those who failed the Beta Test were allowed to take the individual examinations.
GOULD, S. J. (1982) A nation of morons. New Scientist, Volume 6, pages 349-352.
Psychology of Individual Differences Measuring differences

55
6. Key findings
• The data was analysed by E.G. Boring, Yerkes’ lieutenant, who manipulated the results. Selected data was converted to a common standard to look for racial and national averages.
• The following ‘FACTS’ emerged:
• The average mental age of white, American, adult, males stood just above the edge of moronity at a shocking and meagre 13. (Terman had previously set the standard at 16.) This indicated that the country was ‘a nation of morons’ and as such was taken by the eugenicists to show that the poor, Negroes and feeble-minded had been interbreeding and lowering the overall intelligence of the population.
• The data also showed that European immigrants could be graded by their country of origin with the darker people of Southern Europe and the Slavs of Eastern Europe being less intelligent than the fair people of Western and Northern Europe.
• The black man had an average mental age of 10.41. However the lighter the skin colour. The higher the score.
ANALYSIS AND SUBSEQUENT DEVELOPMENTS• The tests had a large impact on officer screening. By the end of the war, two thirds of the men who had promoted were those who had taken
the tests and achieved good test results. According to Yerkes there was also a ‘steady stream of requests from commercial concerns, educational establishments and individuals for the use of army methods of psychological examining or for the adaptation of such methods for special needs’.
• The ‘fact’ that the average mental age of American was 13 was concerning but the most important implication theses tests had was the differences in racial and national groups. Bearing in mind that these tests were now accepted measures of innate intelligence, here was evidence that there really was a difference between racial and national groups in their levels of intelligence. Interestingly enough, Nordic people from northern Europe had been shown to be the most intelligent.
• This ‘evidence’ was used by Carl Brigham, Assistant professor at Princeton University, in a book which was ideal propaganda for any racists. The book dispelled any possible concerns that might be raised about the accuracy of the findings by some very strange reasoning. Although some Jews were extremely accomplished scholars, statesmen and performing artists, there were only noticeable because they were unusual exceptions to the rule. The majority had been assessed as having low levels of intelligence.
• Although the tests were supposed to be accurate irrespective of country of origin or first language, even Yerkes admitted the results showed that there was a problem for people who weren’t familiar with English. The most recent immigrants had been Latins and Slavs who spoke little English, so, naturally, they had scored the lowest scores of all.
. . . continues
GOULD, S. J. (1982) A nation of morons. New Scientist, Volume 6, pages 349-352.
Psychology of Individual Differences Measuring differences

56
7. Possible conclusions
• IQ tests are culturally and historically biased.
• IQ tests do not measure innate intelligence.
• IQ testing is often unreliable.
• IQ tests may not produce valid results.
• Inappropriate, poorly administered IQ tests can lead to tragic consequences.
• Nations can be graded by their intelligence.
• America is a nation of morons!
GOULD, S. J. (1982) A nation of morons. New Scientist, Volume 6, pages 349-352.
Psychology of Individual Differences Measuring differences
6. Key findings
. . . continued • THE IMMIGRATION RESTRICTION ACT was passed in 1924 by the US Congress and was shaped by Yerkes’ findings. People from southern and
eastern Europe and from the Alpine and Mediterranean nations who had scored very poorly on the army tests were no longer welcome in the USA. The way this was controlled was by looking at data from a census of immigrants, which had been conducted in 1890 when immigration from southern and eastern Europe was very low. It was decided that the quota of immigrants allowed into America would be 2% of each recorded nation taken from the 1890 figures. This obviously meant that the numbers of ‘the unwanted’ would be very low. Gould, in his book, makes it clear why more recent data from another census (1920) was not used as the basis – because the proportions of immigrants in 1920 was very different i.e. there had been more southern and eastern European immigrants so working on the 2% immigration quota would have meant more would have been allowed into America!
• These immigration restrictions were to have horrendous consequences as the immigration from southern and eastern Europe was all but ceased. The persecution of the Jews which started well before the actual beginning of the Second World War, meant that many Jews tried to escape from their homeland, but there was ‘no admittance’ to America. Calculations suggest that as many as 6 million people from southern, central and eastern Europe were denied entry into America between 1924 and the start of WW2, in 1939. The fate of many of them as a result of the Nazi regime is well known.
57
1. Theory/ies on which the study is based
• Language communicates directly an individual’s thoughts to another person.
• The relationship between language and thought has been the subject of much debate among philosophers and psychologists. Views fall into four main categories:
(i) Thought is dependent on, or caused by, language e.g. Watson’s ‘peripheralist’ approach, the Sapir-Whorf linguistic relativity hypothesis (LRH).
(ii) Language is dependent on, and reflects, thoughts e.g. Piaget (1959), Pinker (2010), Everett (2009).
(iii) Thought and language are initially quite separate activities e.g. Vygotsky (1962).
(iv) Language and thoughts are one and the same.
• Words can reveal significant insights about psychological functioning e.g. Pennebaker, Mehl & Niederhoffer (2003) “Psychological aspects of natural language use: Our words, our selves.” Annual review of psychology 54.1 (2003): 547-577.
• Underlying cognitive and emotional processes can be revealed through subtle patterns in word choice.
• Quantitative word counts can be used as a tool in the identification and examination of abnormal psychological processes (Oxman, Rosenberg, Schnurr & Tucker, 1988). Psychopathy may therefore be reflected in idiosyncratic linguistic styles.
• Psychopaths have specific combinations of cognitive, social and emotional characteristics that differentiate them from the general population (Hare, 2003, 2006).
2. Background to the study
• A computerised analysis by Junghaenel, Smyth & Santner (2008) of language produced by psychiatric patients revealed fewer words pertaining to optimism, basic cognitive functions, references to the future, and communication with others compared to a sample of community volunteers.
• There has been little examination of the speech associated with psychopaths (Hare, 1993) who comprise about 1% of the general population (Hare, 2006).
• Hare (2003) found that studies of psychophysiology, neurology, and behaviour have shown psychopaths to exhibit a wholly selfish orientation and profound emotional deficit.
• Researchers such as Raine et al (2003, 2004) and Oliveria-Souza et al (2008), have found that the psychopath’s diminished capability for neural sensibility appears to have biological underpinnings.
HANCOCK, J., WOODWORTH, M.T. & PORTER, S. (2011) Hungry like the wolf: a word-pattern analysis of the language of psychopaths. Legal and Criminal Psychology, Volume 18, No. 1, pages 102-114
Psychology of Individual Differences Measuring differences

58
2. Background to the study
• Patrick (2006) found psychopaths exhibit no apparent deficits in intellect.• Previous studies have revealed that psychopaths’ language appears to be less cohesive than non-psychopaths:
- Cleckley (1976) observed, through case studies, that the discourse of psychopaths was more likely to include a tangential and incoherent quality than non-psychopaths.
- Williamson (1993) analysed the narratives of psychopaths and non-psychopaths and found that the former used more contradictory, logically inconsistent statements.
- Similarly, Brinkley, Newman, Harper& Johnson (1999) found that narratives of psychopaths contained fewer cohesive ties and more integrated details than non-psychopaths.
• This study was the first to uniquely examine the specific qualities of psychopathic language using sophisticated statistical text analysis tools. The researchers examined the language characteristics of psychopaths (in describing their violent crimes) on three major characteristics:(i) Their instrumental nature.(ii) Their unique material and socioemotional needs.(iii)Their emotional deficit.(The expectations of Hancock et al in relation to these three characteristics can be found in the original study.)
• Their aim was to examine whether the language of psychopaths reflected, as predicted, an instrumental/predatory world view, unique socioemotional needs and a poverty of effect.
HANCOCK, J., WOODWORTH, M.T. & PORTER, S. (2011) Hungry like the wolf: a word-pattern analysis of the language of psychopaths. Legal and Criminal Psychology, Volume 18, No. 1, pages 102-114
Psychology of Individual Differences Measuring differences

59
3. Research method
• Psychopathy was measured using Pschopathy Checklist Revised (PCL-R; Hare, 1991, 2003).• This study used semi-structured/open-ended interviews (a self-report method) which employed the Step-Wise Interview technique to gather
data in relation to the language of psychopaths and non-psychopaths who had committed murder.• The narratives were subsequently transcribed and analysed through content analysis using the Wmatrix and the DAL.
4. Sample
• 52 male murders (14 psychopathic, 38 non-psychopathic) incarcerated in Canadian correctional facilities who admitted their crime and volunteered for the study.
• 8 convictions (16%) were for first-degree murder, 32 (64%) of convictions were for second-degree murder and 10 (20%) of convictions were for manslaughter.
• There were no differences between the type of crime (manslaughter, second-degree murder, first-degree murder) and psychopathy versus control (non-psychopathy).
• Mean age at the time of their current homicide was 28.9 years (SD = 9.2, range of 14-50 years).• The two groups did not differ on age (psychopaths: M = 39.71 years, SD = 7.53; controls: M = 39.91 years, SD = 9.76, t(50) = .06, ns.• The two groups did not differ in the amount of time since the homicide was committed (psychopaths: M = 11.87 years, SD = 7.78; controls: M =
9.82, SD = 6.78, t(50) = .93, ns.
Psychology of Individual Differences Measuring differences
HANCOCK, J., WOODWORTH, M.T. & PORTER, S. (2011) Hungry like the wolf: a word-pattern analysis of the language of psychopaths. Legal and Criminal Psychology, Volume 18, No. 1, pages 102-114
60
5. Outline of the procedure
• Firstly, potential participants were asked whether they would be interested in taking part in a research study.• Interested individuals underwent a psychopathy assessment:
- Psychopathy was measured using the Psychology Checklist-Revised (PCL-R). Psychopathy, as measured by the PCL-R is characterised by 20 criteria scored from 0 – 2 for a maximum score of 40. The clinical diagnostic cut-off for psychopathy is scores of 30 or above. (Further details of this can be found in the original study.)
- The PCL–R assessments were either conducted by extensively trained prison psychologists or a researcher who was well trained in the coding of the PCL–R (an inter-rater reliability check showed a significant positive correlation with p ≤ .001).
- Using a cut-off score of 25 (which had previously been justified for research purposes e.g. Jackson, Rogers, Neumann & Lambert, 2002), 14 offenders were classified as psychopathic and 38 as non-psychopathic.
• Participants were then interviewed. At the beginning of the interview, the purpose of the study (to examine the manner in which homicide offenders recall their homicide offence) and the procedure were verbally explained.
• While being audio-taped, participants were asked to describe their homicide offences in as much detail as possible. In this open-ended interviewing procedure, each participant was encouraged to provide as much information about the crime as possible from the beginning to the end, omitting no details. Participants were prompted to provide to do this using a standardised procedure known as the Step-Wise Interview (see Yuille, Marxson & Cooper, 1999).
• The interviewers were two senior psychology graduate students and one research assistant, all of whom were blind to the psychopathy scores of the offenders.
• Interviews lasted about 25 minutes.• The narratives were subsequently transcribed, as close to verbatim as possible and then checked to ensure spelling errors were corrected, all
interviewer comments were deleted and proper nouns and abbreviations were spelled out.• Two text analysis tools were then used to analyse the transcripts:
(i) The corpus analysis programme Wmatrix (Rayson, 2003, 2008), which was used to compare parts of speech and to analyse semantic concepts contained in the psychopath and control corpora.
(ii) The Dictionary of Affect in Language (DAL) software programme (Whissell & Dewson, 1986) was used to examine the affective tone of the words.
(Details of these text analysis tools can be found in the original study.)
HANCOCK, J., WOODWORTH, M.T. & PORTER, S. (2011) Hungry like the wolf: a word-pattern analysis of the language of psychopaths. Legal and Criminal Psychology, Volume 18, No. 1, pages 102-114
Psychology of Individual Differences Measuring differences

61
6. Key findings
• The interviews of the psychopaths and controls produced a total of 1,27,376 words. The 14 psychopath narratives contained 29,562 words and averaged 2,201.5 (SE = 408.1) per participant. The 38 control narratives contained 97,814 words and averaged 2,554.3 (SE = 367.0) per participants. There was no significant difference in the average number of words produced by psychopaths and controls, t(50) = .59, ns.
Instrumental language analysis- Psychopaths produced more subordinating conjunctions than controls e.g. because, since, as, so that.
Hierarchy of needs analysis- Psychopaths used approximately twice as many words related to basic physiological needs, including eating, drinking and monetary
resources when describing their murders than controls.- Controls used significantly more language related to social needs, including family, religion and spirituality than psychopaths.
Semantic content of homicide descriptions, related to Maslow’s hierarchy of needs across psychopathic and non-psychopathic offenders
Psychopaths Controls
Frequency % Frequency %
Physiological & safety needs
Food 89 .30 117 .12
Drink 196 .66 370 .38
Clothing 120 .41 266 .27
Money 78 .26 160 .16
Social needs
Family 84 .28 555 .57
Religion 36 .12 201 .21
HANCOCK, J., WOODWORTH, M.T. & PORTER, S. (2011) Hungry like the wolf: a word-pattern analysis of the language of psychopaths. Legal and Criminal Psychology, Volume 18, No. 1, pages 102-114
Psychology of Individual Differences Measuring differences

62
6. Key findings
Emotional expression of language - The degree to which the psychopaths had physiologically distanced themselves/were simply detached from their homicide was examined
through the use of the past and present form of verbs and the rate of articles:
Temporal representations of psychopathic and non-psychopathic offenders.
- Psychopaths used more past tense verbs than controls e.g. stabbed.- Psychopaths used fewer present tense verbs than controls e.g. stab.- Psychopaths produced a higher rate of articles than controls, revealing that their language involved more concrete nouns.
• Psychopathic language was significantly less fluent than controls.• Initially, no significant differences in the emotional content of language between the two groups in terms of pleasantness, intensity or imagery
were found. However further analysis showed psychopathy to be associated with less positively valenced and less emotionally intense language.
HANCOCK, J., WOODWORTH, M.T. & PORTER, S. (2011) Hungry like the wolf: a word-pattern analysis of the language of psychopaths. Legal and Criminal Psychology, Volume 18, No. 1, pages 102-114
Psychology of Individual Differences Measuring differences
Psychopaths Controls
Frequency % Frequency %
Temporal construal
Lexical verbs - past tense e.g. gave 1,798 6.08 5,466 5.59
Lexical verbs – present tense e.g. work 727 2.46 2,853 2.92
Articles e.g. a, the 1,281 4.33 3,877 3.96

63
7. Possible conclusions
• Psychopaths are more likely than non-psychopaths to describe cause and effect relationships when describing their murder.
• Psychopaths are more likely to view their crime as a logical outcome of a plan than non-psychopaths.
• Psychopaths focus more on physiological needs than higher level social needs than non-psychopaths.
• Psychopaths are focused on a lower level of necessities in Maslow’s hierarchy of needs than non-psychopaths.
• Psychopaths will linguistically frame their homicide as more in the past and in more psychologically distant terms than non-psychopaths.
• Psychopaths give less emotionally intense descriptions of their crimes and use less emotionally pleasant language than non-psychopaths.
• Psychopathic language is substantially more disfluent than that of non-psychopaths.
• Psychopaths describe powerful emotional events (their crimes) in an idiosyncratic manner.
• Psychopaths operate on a primitive but rational level.
HANCOCK, J., WOODWORTH, M.T. & PORTER, S. (2011) Hungry like the wolf: a word-pattern analysis of the language of psychopaths. Legal and Criminal Psychology, Volume 18, No. 1, pages 102-114
Psychology of Individual Differences Measuring differences
The
smal
l pri
nt
We’d like to know your view on the resources we produce. By clicking on the ‘Like’ or ‘Dislike’ button you can help us to ensure that our resources work for you. When the email template pops up please add additional comments if you wish and then just click ‘Send’. Thank you.
Whether you already offer OCR qualifications, are new to OCR, or are considering switching from your current provider/awarding organisation, you can request more information by completing the Expression of Interest form which can be found here: www.ocr.org.uk/expression-of-interest
OCR Resources: the small printOCR’s resources are provided to support the delivery of OCR qualifications, but in no way constitute an endorsed teaching method that is required by OCR. Whilst every effort is made to ensure the accuracy of the content, OCR cannot be held responsible for any errors or omissions within these resources. We update our resources on a regular basis, so please check the OCR website to ensure you have the most up to date version.
This resource may be freely copied and distributed, as long as the OCR logo and this small print remain intact and OCR is acknowledged as the originator of this work.
OCR acknowledges the use of the following content:Square down and Square up: alexwhite/Shutterstock.com
Please get in touch if you want to discuss the accessibility of resources we offer to support delivery of our qualifications: [email protected]
Looking for a resource?There is now a quick and easy search tool to help find free resources for your qualification:
www.ocr.org.uk/i-want-to/find-resources/
OCR is part of Cambridge Assessment, a department of the University of Cambridge. For staff training purposes and as part of our quality assurance programme your call may be recorded or monitored.
© OCR 2016 Oxford Cambridge and RSA Examinations is a Company Limited by Guarantee. Registered in England. Registered office 1 Hills Road, Cambridge CB1 2EU. Registered company number 3484466. OCR is an exempt charity.
General qualificationsTelephone 01223 553998Facsimile 01223 552627Email [email protected]
www.ocr.org.uk/alevelreform
OCR Customer Contact Centre