
OCONEE UNIT 3, CYCLE 10OCONEE UNIT 3, CYCLE 10 -Reload Report DPC -RD - 2008 Revision 1 January 1987...
32
OCONEE UNIT 3, CYCLE 10 - Reload Report DPC - RD - 2008 Revision 1 January 1987 Duke Power Company Design Engineering Department P. 0. Box 33189 Charlotte, North Carolina 28242 8702110046 870129 PDR ADOCK 05000287 P PDR
Transcript of OCONEE UNIT 3, CYCLE 10OCONEE UNIT 3, CYCLE 10 -Reload Report DPC -RD - 2008 Revision 1 January 1987...

OCONEE UNIT 3, CYCLE 10
- Reload Report
DPC - RD - 2008
Revision 1
January 1987
Duke Power Company
Design Engineering Department
P. 0. Box 33189
Charlotte, North Carolina 28242
8702110046 870129 PDR ADOCK 05000287 P PDR
CONTENTS
Page
1. INTRODUCTION AND SUMMARY . . . . . . 1-1
2. OPERATING HISTORY............. ... . . . . 2-1
3. GENERAL DESCRIPTION.......... ...... . . 3-1
4. FUEL SYSTEM DESIGN. . ........... . . . . .. 4-1
4.1. Fuel Assembly Mechanical Design . . . . . . . . . 4-1 4.2. Fuel Rod Design . . . . . . . . . . . . . . . . . 4-1
4.2.1. Cladding Collapse . . . . . . . . . . . . 4-1 4.2.2. Cladding Stress . . . . . . . . . . . . . 4-2 4.2.3. Cladding Strain . . . . . . . . . . . . . 4-2
4.3. Thermal Design . . . . . . . . . . . . . . . . . . 4-2 4.4. Material Design . . . . . . . . . . . . . . . . . 4-3
5. NUCLEAR DESIGN. . ............ . . . . ..5-1
5.1. Physics Characteristics. ......... . . ..5-1 5.2. Analytical Input. . ......... . . . . .. 5-2 5.3. Changes in Nuclear Design....... . . . . .. 5-2
6. THERMAL-HYDRAULIC DESIGN........ . . . . . . . .. 6-1
7. ACCIDENT AND TRANSIENT ANALYSIS. ........ . . ..7-1
7.1 General Safety Analysis.......... . . . ..7-1 7.2 Accident Evaluation.......... . . . . . .. 7-1
8. PROPOSED MODIFICATIONS TO TECHNICAL SPECIFICATIONS . . . 8-1
REFERENCES................. . . . . . ..A-1
- 11 -

40
List of Tables
Table Page
4-1. Fuel Design Parameters and Dimensions ......... 4-4 4-2. Linear Heat Rate to Melt Analysis. .......... 4-5 5-1. Oconee 3 Physics Parameters . . ............ 5-3 5-2. Shutdown Margin Calculation for Oconee 3, Cycle 10 . 5-5 6-1. Thermal-Hydraulic Design Conditions . ..... ..... 6-3 7-1. Comparison of Key Parameters for Accident
Analysis ...................... 7-3 7-2. LOCA Limits, Oconee 3, Cycle 10, After 2600 MWd/mtU . . 7-4 7-3. LOCA Limits, Oconee 3, Cycle 10, 0-2600 MWd/mtU . . . 7-4
List of Figures
Figure
3-1. Core Loading Diagram for Oconee 3, Cycle 10 . . . . . . 3-2 3-2. Enrichment and Burnup Distribution for
Oconee 3, Cycle 10. . ............ . ... . 3-3 3-3. Control Rod Locations for Oconee 3, Cycle 10 . . . . . 3-4 3-4. BPRA Enrichment and Distribution for'
Oconee 3, Cycle 10. . ........... . . . ..3-5 5-1. BOC Cycle 10 Two-Dimensional Relative Power Distribution
Full Power, Equilibrium Xenon, Nominal Rod Positions. . 5-6 8-1. Operational Power-Imbalance Limits 0 EFPD to EOC . . . 8-1
- 111 -

1. INTRODUCTION AND SUMMARY
This report justifies the operation of the tenth cycle of Oconee Nuclear
Station, Unit 3, at the rated core power of 2568 MWt. Included are the
required analyses as outlined in the USNRC document "Guidance for Proposed
License Amendments Relating to Refueling," June 1975.
To support Cycle 10 operation of Oconee Unit 3, this report employs analytical
techniques and design bases established in reports that were previously sub
mitted and accepted by the USNRC and its predecessor (see references).
A brief summary of Cycle 9 and 10 reactor parameters related to power capabi
lity is included in Section 5 of this report. All of the accidents analyzed
in the FSARI have been reviewed for Cycle 10 operation. In those cases where
Cycle 10 characteristics were conservative compared to those analyzed for pre
vious cycles, no new accident analyses were performed.
The Technical Specifications have been reviewed, and the modifications
required for Cycle 10 operation are justified in this report.
Based on the analyses performed, which take into account the postulated
effects of fuel densification and the Final Acceptance Criteria for Emergency
Core Cooling Systems, it has been concluded that Oconee Unit 3 can be operated
safely for Cycle 10 at the rated power level of 2568 NWt.
1-1

2. OPERATING HISTORY
The referenced fuel cycle for the nuclear and thermal-hydraulic analyses of
Oconee Unit 3, Cycle 10, is the currently operating Cycle 9. Cycle 9 achieved
initial criticality on October 6, 1985 and power escalation commenced on
October 7, 1985. The fuel cycle design length for Cycle 10 - 440 EFPD - is
based on a Cycle 9 length of 349 EFPD.
Cycle 10 will operate in a feed-and-bleed mode for its entire design length, as
did Cycle 9.
2-1 (Rev. 1)

3. GENERAL DESCRIPTION
The Oconee Unit 3 reactor core and fuel design basis are described in detail
in Chapter 4, of the FSAR.1 The Cycle 10 core consists of 177 fuel assemblies,
each of which is a 15 by 15 array containing 208 fuel rods, 16 control rod
guide tubes, and one incore instrument guide tube. The fuel consists of
dished-end, cylindrical pellets of uranium dioxide clad in cold-worked
Zircaloy-4. The fuel assemblies in all batches have an average nominal fuel
loading of 463.6 kg uranium. The undensified nominal active fuel lengths,
theoretical densities, fuel and fuel rod dimensions, and other related fuel
parameters are given in Table 4-1.
Figure 3-1 is the core loading diagram for Oconee 3, Cycle 10. Nineteen of
the Batch 10 assemblies will be discharged at the end of Cycle 9 along with
Batch 9B. The remaining 49 Batch 10 assemblies, designated "10B," and
the fresh Batch 12 FAs - with initial enrichments of 3.28 and 3.22 wt % 235U, respectively - will be loaded into the central portion of the core. Batch 11,
with an initial enrichment of 3.22 wt % 2 35U, will occupy primarily the core
periphery. Figure 3-2 is a quarter-core map showing the assembly burnup and
enrichment distribution at the beginning of Cycle 10.
Cycle 10 will operate in a rods-out, feed-and-bleed mode. Core reactivity
control is supplied mainly by soluble boron and supplemented by 61 full-length
Ag-In-Cd control rods and 60 burnable poison rod assemblies (BPRAs). In
addition to the full-length control rods, eight Inconel gray axial power
shaping rods (APSRs) are provided for additional control of axial power
distribution. The Cycle 10 locations of the 69 control rods and the group
designations are indicated in Figure 3-3. The Cycle 10 locations and
enrichments of the BPRAs are shown in Figure 3-4.
3-1
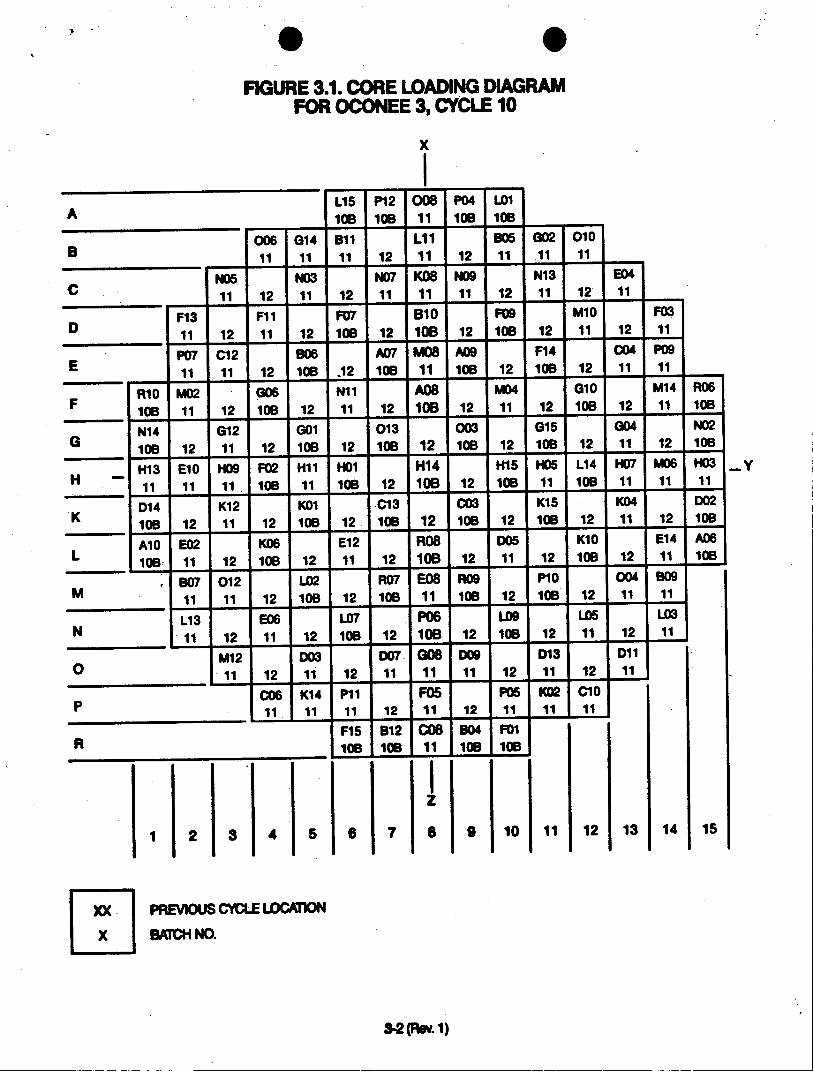
FIGURE 3.1. CORE LOADING DIAGRAM FOR OCONEE 3, CYCLE 10
x
L15 P12 008 P04 LO1 A S10B 1OB 11 10B 10B
006 G14 Il Li 805 002 010 1 11 11 12 11 12 11 11 11
NOS N03 N07 KO8 N09 N13 E04 C 11 12 11 12 11 11 1111 12 11 12 11
F13 FIl F07 810 F09 M1O F03
D 11 12 11 12 108 12 108 12 10B 12 11 12 11
P07 C12 806 A07 MOB A0B F14 C04 P09 E 11 11 12 108 .12 108 11 10B 12 10B 12 11 11
RIO M02 G6 N11 A08 M04 010 M14 RoB
10B 11 12 108 12 11 12 10B 12 11 12 10B 12 11 10B
N14 G12 001 013 003 015 004 N02
10B 12 11 12 108 12 18 2 10B 12 10 12 11B
H13 E10 H09 F02 H11 H01 H14 H15 H05 L14 H07 M06 H03 y 11 11 11 108 11 108 12 106 12 108 11 108 11 11 11
014 K12 KO1 C13 CO3 K15 K04 002
K 10812 11 12 10B 12 108121081212 11 12 10B
A1O E02 K06 E12 RO8 DO5 KI E14 A06
L 10811 12 101B 11 12 1 111
807 012 L02 R07E08RO9 Pl0 004809 M 11 11 1210 1210 1110 12 10B 12 11 11
L13 E16 10 7 P06 OB 106 1 3 N 11 12 11 12 108 12 10B 12 10B 12 11 12 11
M12 003 007 G OB 013 DI1
01 211 12 117 11 11 12 1 1 11
006 K14 P11 F05 P05 K02 C10 11 11 11 12 1 12 1 11 11o
F15 812 COB 04 F01 10B 10B 11 108 10B
z
1 2 3 4 5 6 7 8 9 10 11 12 13 14 15
XX. PREVOUS CYCLE LOCON
X BATCH NO.
3.2 (Re. 1)

FIGURE 3.2 ENRICHMENT & BURNUP FOR OCONEE 3, CYCLE 10
8 9 10 11 12 13 14 15
H 3.28 3.22 3.28 3.22 3.28 3.22 3.22 3.22 26823 0 21269 13426 24049 11694 13427 13649
K 3.22 3.28 322 3.28 3.22 3.22 3.22 3.28 0 22055 0 21556 0 13866 0 16637
3.28 3.22 3.22 3.22 3.28 3.22 3.22 3.28 21288 0 13776 0 24107 0 9553 20295
3.22 3.28 3.22 3.28 3.22 3.22 3.22 13423 21557 0 24056 0 11241 11838
N 3.28 3.22 3.28 3.22 3.22 3.22 3.22 24049 0 24090 0 13427 0 13352
S 322 3.22 3.22 3.22 3.22 3.22 11690 13886 0 11250 0 13761
3.22 3.22 3.22 3.22 3.22 13427 0 9548 11839 13347
R 3.22 3.28 3.2 R 13653 16640 20272
XXX INITAL ENRICHMENT, wt% U x x BOC BURNUP, MWd/mtU
3-3 (Rev. 1)

FIGU IM.3 CONTROL ROD LOCATIO% R OCONEE 3, CYCLE 10
x
A
B 4 6 4
o 2 5 5 2
D 7 8 7 8 7
E 2 5 1 1 5 2
F 4 8 6 3 6 8 4
G 5 1 3 3 1 5
HW - 6 7 3 4 3 7 6
K 5 1 3 3 1 5
L 4 8 6 3 6 8 4
M2 5 1 1 5 2
N 7 8 7 8
0 2 5 5 2
p 4 6 4
R
z.
1 2 3 4 5 6 7 8 9 10 11 12 13 14 15
GROUP NO. OF RODS FUNCTION
GROUP NO. 1 8 SAFETY 2 8 SAFETY 3 8 SAFETY 4 9 SAFETY 5 12 CONTROL 6 8 CONTROL 7 8 CONTROL 8 8 APSRs
TOTAL 69
3-4
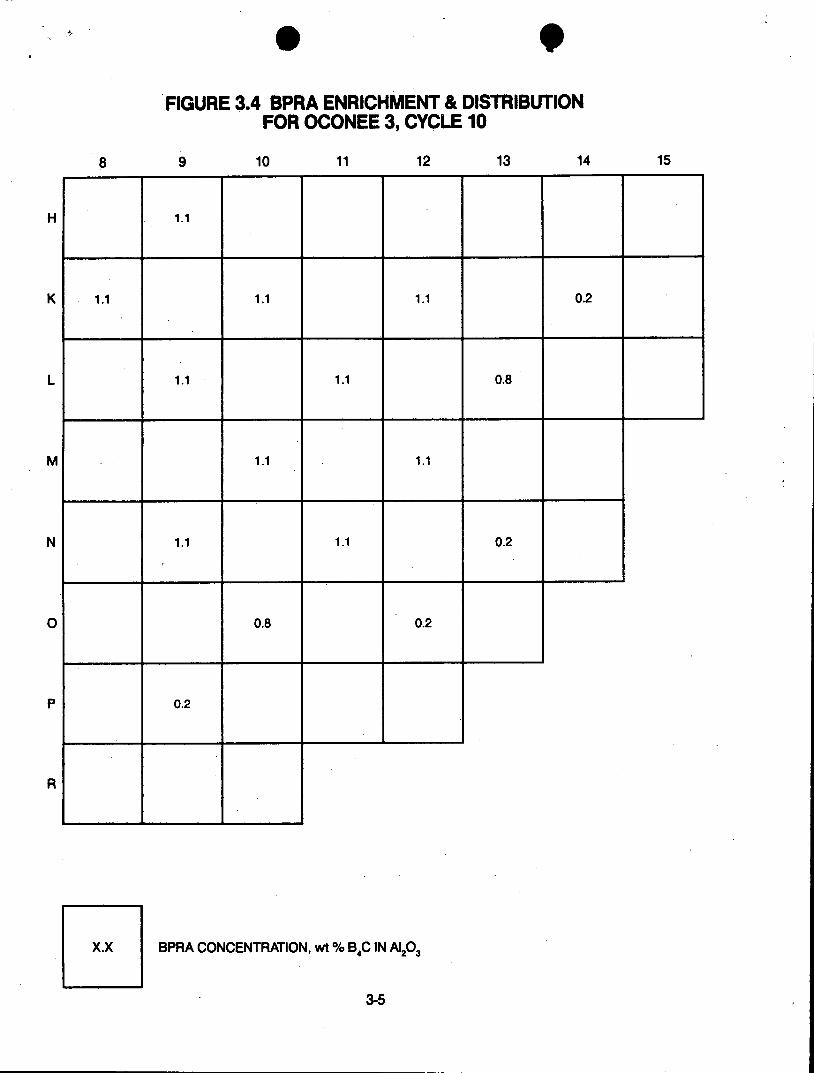
FIGURE 3.4 BPRA ENRICHMENT & DISTRIBUTION FOR OCONEE 3, CYCLE 10
8 9 10 11 12 13 14 15
H 1.1
K 1.1 1.1 1.1 0.2
L 1.1 1.1 0.8
M 1.1 1.1
N 1.1 1.1 0.2
0 0.8 0.2
P 0.2
R
XX BPRA CONCENTRATION, wt % B C IN AI203
3-5
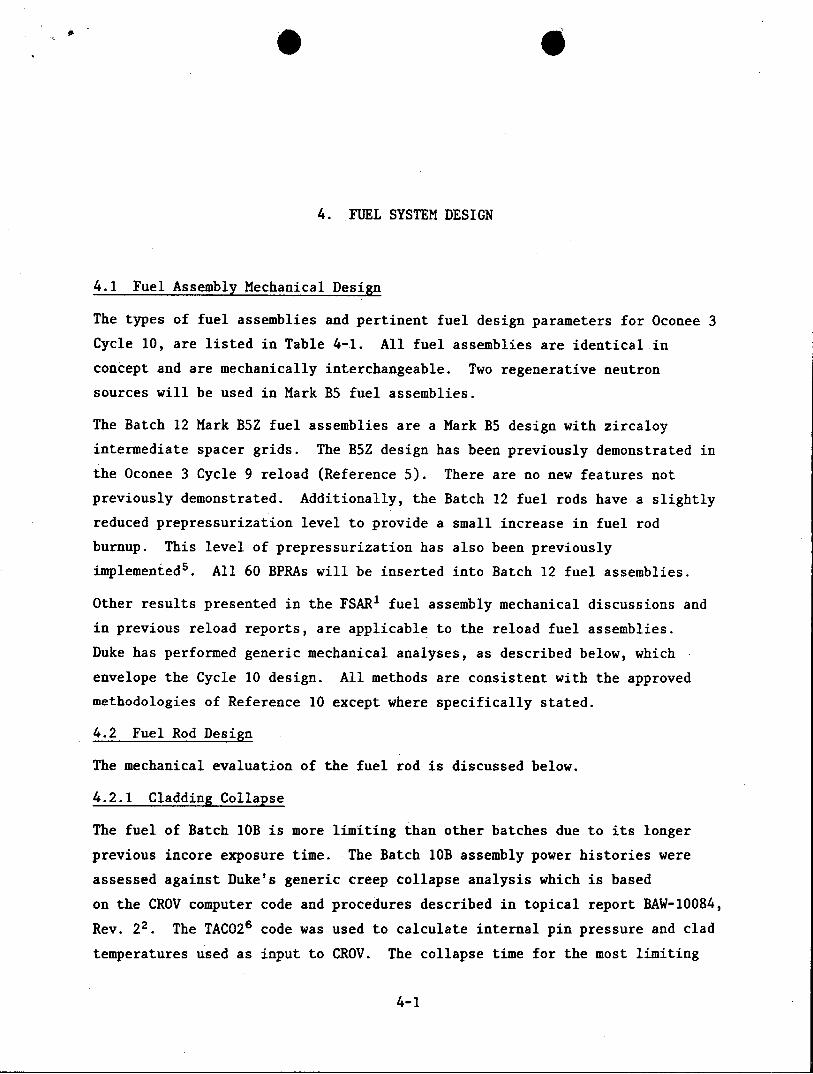
4. FUEL SYSTEM DESIGN
4.1 Fuel Assembly Mechanical Design
The types of fuel assemblies and pertinent fuel design parameters for Oconee 3
Cycle 10, are listed in Table 4-1. All fuel assemblies are identical in
concept and are mechanically interchangeable. Two regenerative neutron
sources will be used in Mark B5 fuel assemblies.
The Batch 12 Mark B5Z fuel assemblies are a Mark B5 design with zircaloy
intermediate spacer grids. The B5Z design has been previously demonstrated in
the Oconee 3 Cycle 9 reload (Reference 5). There are no new features not
previously demonstrated. Additionally, the Batch 12 fuel rods have a slightly
reduced prepressurization level to provide a small increase in fuel rod
burnup. This level of prepressurization has also been previously
implemented5 . All 60 BPRAs will be inserted into Batch 12 fuel assemblies.
Other results presented in the FSAR' fuel assembly mechanical discussions and
in previous reload reports, are applicable to the reload fuel assemblies.
Duke has performed generic mechanical analyses, as described below, which
envelope the Cycle 10 design. All methods are consistent with the approved
methodologies of Reference 10 except where specifically stated.
4.2 Fuel Rod Design
The mechanical evaluation of the fuel rod is discussed below.
4.2.1 Cladding Collapse
The fuel of Batch 10B is more limiting than other batches due to its longer
previous incore exposure time. The Batch 10B assembly power histories were
assessed against Duke's generic creep collapse analysis which is based
on the CROV computer code and procedures described in topical report BAW-10084,
Rev. 22. The TACO2 6 code was used to calculate internal pin pressure and clad
temperatures used as input to CROV. The collapse time for the most limiting
4-1
assembly was conservatively determined to be 32,900 EFPH, which is greater than
the maximum projected residence time of Cycle 10 fuel (Table 4-1).
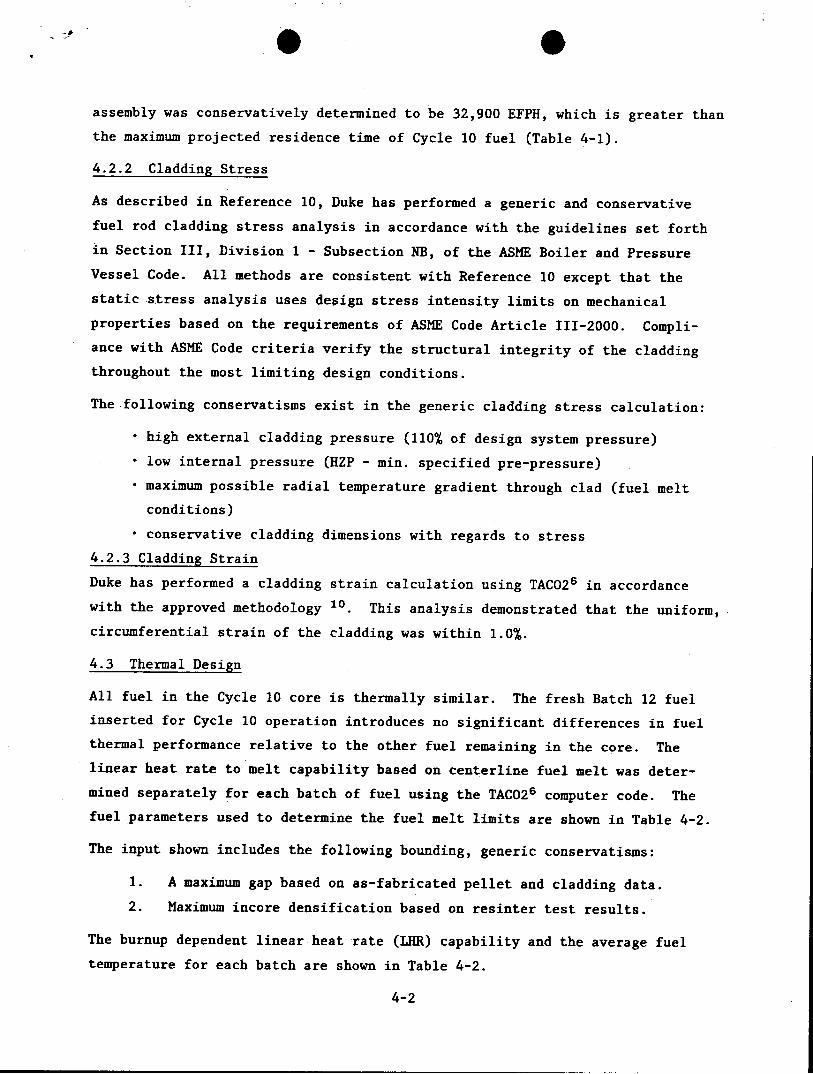
4.2.2 Cladding Stress
As described in Reference 10, Duke has performed a generic and conservative
fuel rod cladding stress analysis in accordance with the guidelines set forth
in Section III, Division 1 - Subsection NB, of the ASNE Boiler and Pressure
Vessel Code. All methods are consistent with Reference 10 except that the
static stress analysis uses design stress intensity limits on mechanical
properties based on the requirements of ASME Code Article 111-2000. Compli
ance with ASME Code criteria verify the structural integrity of the cladding
throughout the most limiting design conditions.
The following conservatisms exist in the generic cladding stress calculation:
* high external cladding pressure (110% of design system pressure)
* low internal pressure (HZP - min. specified pre-pressure)
* maximum possible radial temperature gradient through clad (fuel melt
conditions)
* conservative cladding dimensions with regards to stress
4.2.3 Cladding Strain
Duke has performed a cladding strain calculation using TACO26 in accordance
with the approved methodology 10. This analysis demonstrated that the uniform,
circumferential strain of the cladding was within 1.0%.
4.3 Thermal Design
All fuel in the Cycle 10 core is thermally similar. The fresh Batch 12 fuel
inserted for Cycle 10 operation introduces no significant differences in fuel
thermal performance relative to the other fuel remaining in the core. The
linear heat rate to melt capability based on centerline fuel melt was deter
mined separately for each batch of fuel using the TACO26 computer code. The
fuel parameters used to determine the fuel melt limits are shown in Table 4-2.
The input shown includes the following bounding, generic conservatisms:
1. A maximum gap based on as-fabricated pellet and cladding data.
2. Maximum incore densification based on resinter test results.
The burnup dependent linear heat rate (LHR) capability and the average fuel
temperature for each batch are shown in Table 4-2.
4-2
The maximum assembly average burnup is predicted to be 41,158 MWd/MtU and the
maximum fuel rod burnup is predicted to be 42,802 MWd/mtU. Fuel rod internal
pressure has been evaluated using TACO26 with a conservative pin power
history, and the maximum pressure is less than the nominal reactor coolant
(RC) system pressure of 2200 psia.
4.4 Material Design
The Batch 12 fuel assemblies are not unique in concept, nor do they utilize
different component materials. Therefore, the chemical compatibility of all
possible fuel-cladding-coolant-assembly interactions for the Batch 12 fuel
assemblies is identical to those of the present fuel.
4-3(Rev. 1)

Table 4-1.
Fuel Design Parameters and Dimensions
Batch No.
10B 11 12
FA type Mark B5 Mark B5Z Mark B5Z
No. of FAs 49 68 60
Fuel rod OD, in. 0.430 0.430 0.430
Fuel rod ID, in. 0.377 0.377 0.377
Flex spacers, type Spring Spring Spring
Rigid spacers, type Zr-4 Zr-4 Zr-4
Undensified active 141.8 141.8 141.8 fuel length, in.
Fuel pellet OD (mean 0.3686 0.3686 0.3686
spec), in.
Fuel pellet initial 95.0 95.0 95.0 density (mean spec), %TD
Initial fuel enrich- 3.28 3.22 3.22 ment, wt % 23 5U
Est. residence time, 28,776 19,176 10,800 EOC 10, EFPH
Cladding collapse >32,900 >27,400 >27,400 time, EFPH
4-4 (Rev. 1)

Table 4-2. Linear Heat Rate to Melt Analysis
Batch No.
1OB 11 12
Nominal initial density, 95.0 95.0 95.0 % TD
Nominal initial pellet 0.3686 0.3686 0.3686 diameter, in.
Nominal initial clad ID, in. 0.377 0.377 0.377 Nominal initial clad OD, in. 0.430 0.430 0.430
Average linear heat rate @ 5.74 5.74 5.74 100% of 2568 MW, kW/ft
Linear heat rate capability(b) 20.15 20.15 20.15 from 0-1000 MWD/MTU, kW/ft
Linear heat rate capability(b) 21.20 21.20 21.20 >1000 MWD/MTU, kW/ft
Average fuel temp. @ nominal 1240(a) 1240(a) 1240(a) linear heat rate, oF
(a) Basis: TACO2, 96.5% TD @ 4000 MWD/MTU, nominal pellet and cladding dimensions
(b) These values are utilized as fuel design limits for Cycle 10.
4-5

5. NUCLEAR DESIGN
5.1 Physics Characteristics
Table 5-1 compares the core physics parameters of design Cycles 9 and 10; the
values for Cycles 9 and 10 were generated by Duke Power Company using methods
described in Reference 10. Since the core has not yet reached an equilibrium
cycle, differences in core physics parameters are to be expected between the
cycles. Figure 5-1 illustrates a representative relative power distribution
for the beginning of the tenth cycle at full power with equilibrium xenon and
normal rod positions.
The primary reasons for the differences in the physics parameters between Cycles
9 and 10 are the number of feed assemblies and the different shuffle patterns.
Differences in ejected and stuck rod worths between cycles are due to changes
in the radial flux and burnup distributions. Calculated ejected rod worths
and their adherence to criteria are considered at all times in life and at all
power levels in the development of the rod position limits presented in
Section 8. All safety criteria associated with these rod worths are met. The
adequacy of the shutdown margin with Cycle 10 stuck rod worths is demonstrated
in Table 5-2. The following conservatisms were applied for the shutdown
calculations:
1. Poison material depletion allowance.
2. 10% uncertainty on net rod worth.
Flux redistribution was explicitly accounted for since the shutdown analysis
was calculated using a three-dimensional model. The reference fuel cycle
shutdown margin is presented in the Oconee 3, Cycle 9 Reload Report.5
5-1

9
5.2 Analytical Input
The Cycle 10 incore measurement calculation constants to be used to compute core power distributions were obtained in a similar manner for Cycle 10 as for the reference cycle.
5.3 Changes in Nuclear Design
There are no changes in design methodology between Oconee 3 Cycle 10 and Oconee 3 Cycle 9.
5-2
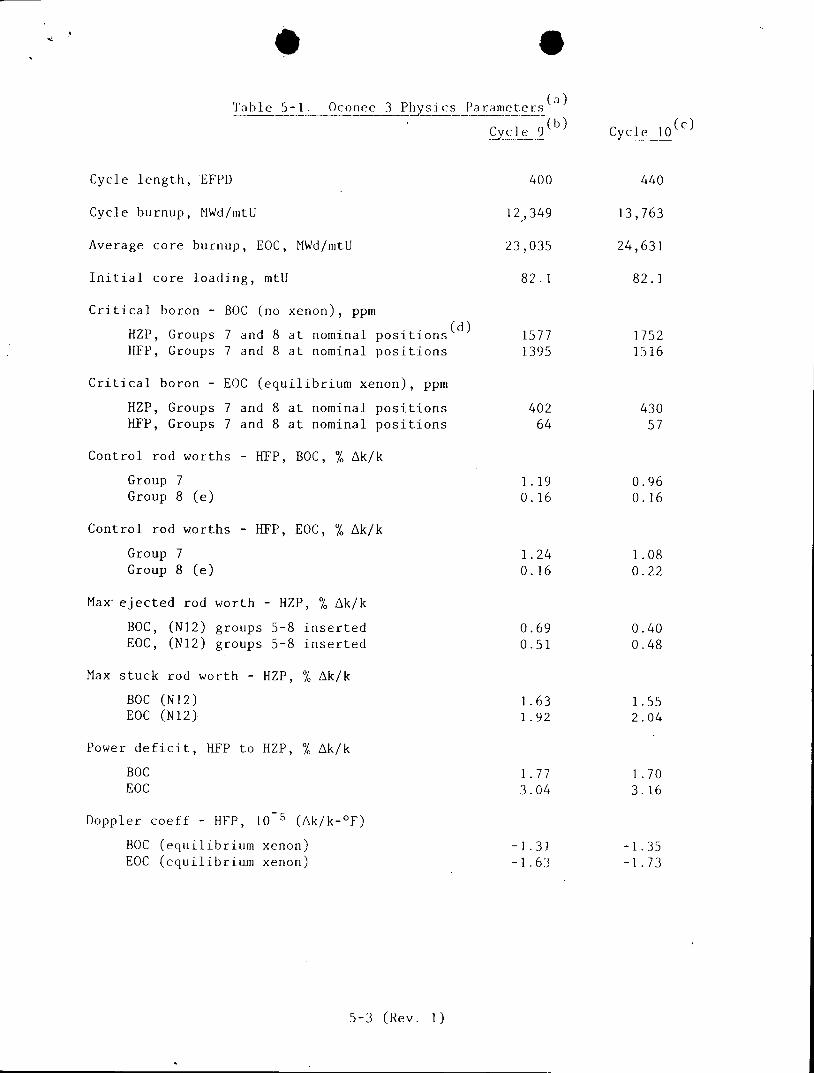
Table 5-1. Oconee 3 Physics 1Parameters a
Cycle 9(b) Cc 0(c)
Cycle length, EFPD 400 440
Cycle burnup, MWd/mtU 12,349 13,763
Average core burnup, EOC, MWd/mtU 23,035 24,631
Initial core loading, mtU 82.1 82.1
Critical boron - BOC (no xenon), ppm
HZP, Groups 7 and 8 at nominal positions(d) 1577 1752 IFP, Groups 7 and 8 at nominal positions 1395 1516
Critical boron - EOC (equilibrium xenon), ppm
HZP, Groups 7 and 8 at nominal positions 402 430 FP, Groups 7 and 8 at nominal positions 64 57
Control rod worths - HFP, BOC, % Ak/k
Group 7 1.19 0.96 Group 8 (e) 0.16 0.16
Control rod worths - HFP, EOC, % Ak/k
Group 7 1.24 1.08 Group 8 (e) 0.16 0.22
Max-ejected rod worth - HZP, % Ak/k BOC, (N12) groups 5-8 inserted 0.69 0.40 EOC, (N12) groups 5-8 inserted 0.51 0.48
Max stuck rod worth - HZP, % Ak/k
BOC (N12) 1.63 1.55 EOC (N12) 1.92 2.04
Power deficit, HFP to HZP, % Ak/k
BOC 1.77 1.70 EOC 3.04 3.16
Doppler coeff - HFP, 10-5 (Ak/k-oF)
BOC (equilibrium xenon) -1.31 -1.35 EOC (equilibrium xenon) -1.63 -1.73
5-3 (Rev. 1)

Table 5-1. (Cont'd)
Cycle 9(b) Cycle 10
Moderator coeff - HFP, 104 (Ak/k-oF)
BOC (equilibrium xenon) -0.58 -0.47 EOC (equilibrium xenon) -2.91 -3.30
Boron worth - HFP, ppm/% Ak/k
BOC 123 124 EOC 110 110
Xenon worth - HFP, % Ak/k
BOC (4 days) 2.43 2.43 EOC (equilibrium) 2.65 2.58
Effective delayed neutron fraction - HFP
BOC 0.00618 0.00617 EOC 0.00523 0.00518
(a)Cycle 10 data are for the conditions stated in this report. The
Cycle 9 core conditions are identified in Reference 5. (b)Based on a 400-EFPD Cycle 8. (Actual Cycle 8 length 396.59 EFPD). (cBased on a Cycle 9 length of 349-EFPD.
Nominal positions are as follows:
Cycle 9 Cycle 10
HZP (BOC) Group 7 at 100% WD, 8 at 25.5% WD Group 7 at 100% WD, 8 at 25.0% WD HFP (BOC) Group 7 at 92% WD, 8 at 15% WD Group 7 at 92% WD, 8 at 35% WD HZP (EOC) Group 7 at 100% WD, 8 at 25.5% WD Group 7 at 100% WD, 8 at 25.0% WD HFP (EOC) Group 7 at 100% WD, 8 at 15% WD Group 7 at 100% WD, 8 at 35% WD
(e) (15% to 100% WD for Cycle 9, 35% to 100% WD for Cycle 10)
5-4 (Rev. 1)

Table 5-2. Shutdown Margin Calculation for Oconee 3, Cycle 10
BOC, EOC, % Ak/k % Ak/k
Available Rod Worth
Total rod worth, HZP 8.80 9.47 Worth reduction due to poison burnup -0.42 -0.42 Maximum stuck rod, RZP -1.55 -2.04
Net worth 6.83 7.01 Less 10% uncertainty -0.68 -0.70
Total available worth 6.15 6.31
Required Rod Worth
Power deficit, HFP to HZP 1.70 3.16 Max inserted rod worth, HFP 0.35 0.53
Total required worth 2.05 3.69
Shutdown Margin
Total available worth minus total 4.10 2.62 required worth
Note: Required shutdown margin is 1.00% Ak/k.
5-5 (Rev. 1)
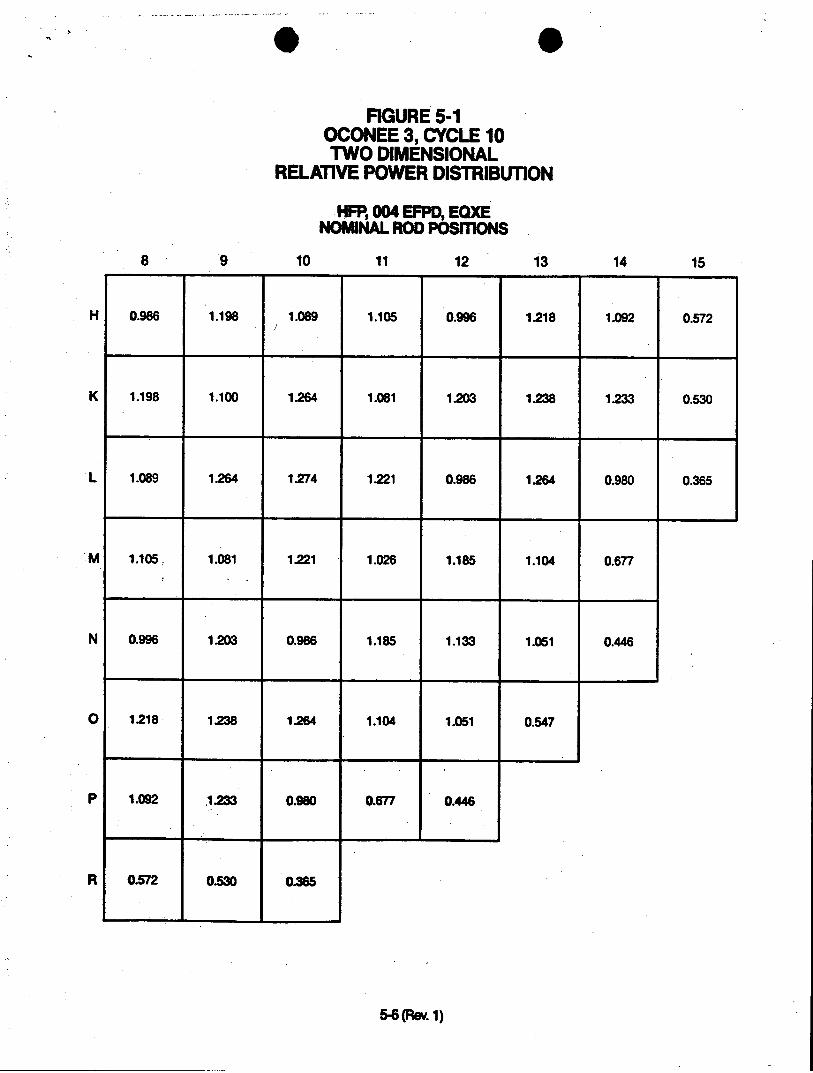
FIGURE 5-1 OCONEE 3, CYCLE 10 TWO DIMENSIONAL
RELATIVE POWER DISTRIBUTION
HFP, 004 EFPD, EQXE NOML ROD POSIONS
8 9 10 11 12 13 14 15
H 0.986 1.198 1.089 1.105 0.996 1.218 1.092 0.572
K 1.198 1.100 1.264 1.081 1.203 1.238 1.233 0.530
L 1.089 1.264 1.274 1.221 0.986 1.264 0.980 0.365
M 1.105 1.081 1.221 1.026 1.185 1.104 0.677
N 0.996 1.203 0.986 1.185 1.133 1.051 0.446
0 1218 1.238 1.264 1.104 1.051 0.547
P 1.092 1.233 0.980 0.677 0.446
R 0.572 0.530 0.365
5-6 (Rev. 1)

6. THERMAL-HYDRAULIC DESIGN
The generic Mark-B and Mark-BZ thermal-hydraulic design analyses supporting
Cycle 10 operation were performed by Duke Power Company using the methods
described in References 1, 5, 8, and 10. The Cycle 9 and Cycle 10 maximum
design conditions are summarized in Table 6-1.
The Cycle 10 transition core will include 60 fresh Mark-BZ Batch 12 fuel
assemblies, all of which will contain BPRAs. Two assemblies will contain
regenerative neutron sources, leaving 46 fuel assemblies with open guide
tubes. This results in a core bypass flow of 7.9% of the total system flow.
This bypass flow is less than that assumed in the generic thermal-hydraulic
analyses and the consequent increase in core flow establishes the generic
analyses as conservative for Cycle 10 operation.
The Mark-BZ fuel assembly has a slightly higher pressure drop than the Mark-B
assembly as a result of the increased flow resistance of the Zircaloy spacer
grids. The presence of Mark-BZ and Mark-B assemblies in a core results in
less coolant flow in the Mark-BZ fuel then would occur in an all Mark-BZ
core. The generic Mark-BZ analyses conservatively account for this transition
core effect.
In a Mark-BZ transition core the limiting Mark-B hot channel will receive more
coolant and yield better DNB performance than would be predicted for a full
Mark-B core. Thus, the generic Mark-B analyses, based on the B&W-2 CHF
correlation, are bounding and are applicable to the Cycle 10 transition core.
No fuel rod bow penalty was included in the DNBR limit used in the generic
Mark-BZ analyses, as justified in Reference 9. The rod bow topical report
concludes that a DNBR penalty is no longer required for thermal-hydraulic
analyses. Nevertheless, to account for fuel rod bow, the generic Mark-B
analyses used for determining plant operating limits (except the flux to flow
setpoint analysis) were based on a DNBR criteria including 10.2% margin from
6-1
the 1.30 design limit. Primarily due to this conservatism, the current
pressure-temperature envelope and design radial x local peaking have been
shown to be conservative for a full and transition Mark-BZ core.
A flux to flow setpoint of 1.07 will be used for Cycle 10 operation. A con
servative transition core pump coastdown analysis was performed based on a
1.08 flux to flow setpoint and the reference design radial-local peaking
factor, FAH = 1.714. The minimum DNBR determined in the Mark-BZ transition
core flux to flow analysis is greater than the BWC CHF correlation limit of
1.18, Reference 11. The minimum DNBR determined in the generic Mark-B flux
to flow analysis, also based on a 1.08 flux to flow setpoint, is greater than
the BAW-2 CHF correlation limit of 1.30.
6-2

Table 6-1. Thermal Hydraulic Design Conditions
Cycle 9 Cycle 10
Design power level, MWt 2568 2568
System pressure, psia 2200 2200
Reactor coolant flow, % design flow 106.5 106.5
Core bypass flow, % total flow(a) 79 79
Vessel inlet/outlet coolant temp at 555.6/602.4 555.6/602.4 100% power, oF
Ref design radial-local power 1.71 1.71 peaking factor
Ref design axial flux shape 1.5 cosine 1.5 cosine
Active fuel length, in. 141.8 141.8
Avg heat flux at 100% power, 10 176(b) Btu/h-ft2
CHF correlation BAW-2/BWC BAW-2/BWC
Min DNBR with densification penalty 2.05/>1.74 >2.05/>1.74
Hot channel factors: Enthalpy rise 1.011/1.011 1.011/1.011 Heat flux 1.014/1.014 1.014/1.014 Flow area 0.98/0.97 0.98/0.97
G1neric analyses based on >8.0% core bypass flow.
(b)Heat flux based on a conservative minimum densified length of 140.3 in.
6-3
7. ACCIDENT AND TRANSIENT ANALYSIS
7.1 General Safety Analysis
Each FSAR1 accident analysis has been examined with respect to changes in
Cycle 9 parameters to determine the effect of the Cycle 10 reload and to ensure
that thermal performance during hypothetical transients is not degraded. The
effects of fuel densification on the FSAR accident results have been evaluated
and are reported in Reference 8. Since Batch 12 reload fuel assemblies contain
fuel rods with a theoretical density higher than those considered in Reference
8, the conclusions in that reference are still valid.
No new dose calculations were performed for the reload report. The dose con
siderations in Reference 13 are characteristic for Oconee 3 Cycle 10 based upon
comparisons of key parameters which determine radionuclide inventories.
7.2 Accident Evaluations
The key parameters that have the greatest effect on determining the outcome of
a transient can typically be classified in three major areas: core thermal
parameters, thermal-hydraulic parameters, and kinetics parameters, including
the reactivity feedback coefficients and control rod worths.
Fuel thermal analysis parameters for each batch in Cycle 10 are given in Table
4-2. Table 6-1 compares the Cycle 9 and 10 thermal-hydraulic maximum design
conditions. Table 7-1 compares the key kinetics parameters from the FSAR and
Cycle 10. The effect of a more negative hot full power end-of-cycle moderator
temperature coefficient on the FSAR accident analyses has been analyzed for
Oconee Nuclear Station.16 Table 7-1 has been revised to include the new
values for end-of-cycle moderator temperature coefficient and dropped rod
worth assumed in these analyses.
A generic LOCA analysis for the B&W 177-FA, lowered-loop NSSS has been per
formed using the Final Acceptance Criteria ECCS Evaluation Model. This study
is reported in BAW-10103, Rev. 3.12 The analysis in BAW-10103 is generic
since the limiting values of key parameters for all plants in this category
7-1
were used. Furthermore, the combination of average fuel temperature as a
function of LHR and the lifetime pin pressure data used in the BAW-10103 LOCA
limits analysis7"1 2 is conservative compared to those calculated for this re
load. In addition, it has been determined that the slightly lower prepres
surization of the Batch 12 fuel rods has a negligible impact on the LOCA
analyses'4 . Thus, the analysis and the LOCA limits reported in BAW-10103
provide conservative results for the operation of Oconee 3, Cycle 10 fuel.
The LOCA kW/ft limits have been reduced for the first 65 EFPDs. This
reduction will ensure conservative limits based upon an interim bounding
analytical assessment of NUREG 0630 on LOCA and operating kW/ft limits
performed by Babcock and Wilcox4 't5 . The LOCA kw/ft limits for the first
65 EFPD are shown in Table 7-2. Table 7-3 shows the bounding values for
allowable LHRs for Oconee 3 Cycle 10 fuel after 65 EFPD.
From the examination of Cycle 10 core thermal properties and kinetics proper
ties with respect to acceptable previous cycle values, it is concluded that
this core reload will not adversely affect the safe operation of Oconee 3
during Cycle 10. Considering the previously accepted design basis used in the
FSAR and subsequent cycles, the transient evaluation of Cycle 10 is considered
to be bounded by previously accepted analyses. The initial conditions of the
transients in Cycle 10 are bounded by the FSAR and/or the fuel densification
report.8
7-2

Table 7.1. Comparison of Key Parameters for Accident Analysis
FSAR1 Predicted Parameter value Cycle 10 value
BOC Doppler coeff, 10-s, Ak/k/oF -1.17 -1.35
EOC Doppler coeff, 10-s Ak/k/oF -1.33 (a) -1.73
BOC moderator coeff, 10 4, Ak/koF +0.5(b) -0.47
EOC moderator coeff, HZP, 10-, Ak/k/oF -3.0 (c) -2.73
HFP, 10-, Ak/k/oF -3.5 (c) -3.30
All rod bank worth, HZP, % Ak/k 10.0 9.47
Boron reactivity worth, 700F ppm/1% Ak/k 75 88
Max. ejected rod worth, HFP, % Ak/k 0.65 0.25
Dropped rod worth, HFP, % Ak/k 0.40 0.13
Initial boron conc, HFP, ppm 1400 1516(d)
(a)_1.2 x 10-s Ak/k/F was used for steam line break analysis.
-1.3 x 10⁵ Ak/k/F was used for cold water accident (pump start-up). +0.94 x 10 Ak/k/F was used for the moderator dilution accident.
(c) The HZP moderator temperature coefficient is one of the key
parameters assumed in the steam line break analysis. The HFP
moderator temperature coefficient is included since it is one of
the parameters assumed in the cold water, rod ejection, and control
rod misalignment accident analyses, although none of these accidents
are very sensitive to changes in the coefficient.
(d) The combined effect of boron concentration and boron worth is
conservative for Cycle 10.
7-3 (Rev. 1)

Table 7-2. LOCA Limits, Oconee 3, Cycle 10
Elevation, ft LHR Limits, kW/ft
0-1000 MWd/mtU (a) 1000-2600 MWd/mtU(b)
2 13.5 15.0
4 16.1 16.6
6 16.5 18.0
8 17.0 17.0
10 16.0 16.0
Table 7-3. LOCA Limits, Oconee 3, Cycle 10, After 2600 MWD/mtU(b)
Elevation, LHR limits, ft kW/ft
2 15.5
4 16.6
6 18.0
8 17.0
10 16.0
(a) 1000 MWd/mtU corresponds to approximately 25 EFPD for the most limiting
assembly
(b) 2600 NWd/mtU corresponds to approximately 65 EFPD for the most limiting
assembly
7-4
8. PROPOSED MODIFICATIONS TO TECHNICAL
SPECIFICATIONS
The Technical Specifications have been revised for Cycle 10 operation in
accordance with the methods of Reference 10 to account for minor changes in
power peaking and control rod worths.
In addition:
1. The operating limits on rod index and axial power imbalance were
developed in accordance with the LOCA linear heat rate limits
discussed in Chapter 7.
2. Due to the lower worth of the gray APSRs, operational limits for the
Group 8 control rods are not required for Cycle 10. Administrative
position and maneuvering limits for the APSRs, however, will be
utilized to ensure adequate fuel performance during Cycle 10 opera
tion.
3. The minimum required boron concentration in the BWST has been raised
from 1835 ppm to 2010 pppm in order to ensure that the core is at
least 1% Ak/k subcritical at 700F without any control rods in the
core.
Based on the Technical Specifications derived from the analyses presented in
this report, The Final Acceptance Criteria ECCS limits will not be exceeded,
nor will the thermal design criteria be violated. Figure 8-1 is a revision to
a previous Technical Specification limit.
8-1 (Rev. 1)

Figure 8-1
Operational Power-Imbalance Limits, 0 EFPD to EOC
REACTOR POWER,%FP
(-17.0, 102.0) (27.0,102.0) -100
ACCEP ABLE (-27.0, 90.0) OPERATION
80
60
RESTRICTED OPERATION RESTRICTED OPERATION
40
20
-100 -80 -60 -40 -20 0 20 40 60 80 100
IMBALANCE,%
8-2

REFERENCES
1. Oconee Nuclear Station, Units 1, 2, and 3 Final Safety Analysis Report,
Docket Nos. 50-269, 50-270, and 50-287.
2. Program to Determine In-reactor Performance of B&W Fuels - Cladding Creep
Collapse, BAW-10084A, Rev. 2, Babcock & Wilcox Co., Lynchburg, Virginia,
October 1978.
3. Oconee Unit 2, Cycle 8 - Reload Report, DPC-RD-2004, Duke Power Company,
December 1984.
4. Bounding Analytical Assessment of NUREG 0630 on LOCA and Operating kw/ft
Limits, B&W Document No. 77-1141256-00, Babcock & Wilcox.
5. Oconee Unit 3, Cycle 9 - Reload Report, DPC-RD-2005, Duke Power Company,
May 1985.
6. TACO2 - Fuel Performance Analysis, BAW-10141P-A, Rev. 1, Babcock & Wilcox,
June 1983.
7. J. H. Taylor (B&W) to S. A. Varga (NRC), Letter, July 18, 1978.
8. Oconee 3 Fuel Densification Report, BAW-1399, Babcock & Wilcox, November 1973.
9. Fuel Rod Bowing in Babcock & Wilcox Fuel Designs, BAW-10147P-A, Rev. 1,
Babcock & Wilcox, May 1983.
10. Oconee Nuclear Station Reload Design Methodology Technical Report
NFS-1001A, Duke Power Company, Charlotte, North Carolina, April 1984.
11. Correlation of 15x15 Geometry Zircaloy Grid Rod Bundle CHF Data with the
BWC Correlation, BAW-10143, Part 2, Babcock & Wilcox, Lynchburg, Virginia,
March 1980.
12. ECCS Analysis of B&W's 177-FA Lowered-Loop NSS, BAW-10103, Rev. 3, Babcock
& Wilcox, July, 1977.
13. Oconee Unit 1, Cycle 9 - Reload Report, BAW-1841, Babcock & Wilcox, August
1984.
14. R. J. Walker (B&W) to K. S. Canady (Duke Power Company), Letter, February
18, 1985.
A-1

15. BOL LOCA Limits, B & W Document No. 86-1153360-00, Babcock & Wilcox, April 1985.
16. H. B. Tucker, (Duke Power Company) to J. F. Stolz (NRC), Letter, April 23, 1986.
A-2