Ocean renewable energy: Tidal power in the Yellow Sea€¦ · Ocean renewable energy sources are...
16
Abstract Ocean renewable energy sources are briefly introduced in this review article. Special focus on tidal energy from ocean renewable energy in the Yellow Sea and its practical utilization in South Korea are illustrated with several examples. Among them, the Sihwa Lake tidal power plant, the Garolim Bay tidal power project, the Incheon tidal power project, and the Uldolmok tidal current power station were introduced with more details. A numerical modelling system, Regional Ocean Tide Simulator, is introduced for now- and forecast of tidal regime to evaluate the potential tidal power, to provide operational information for practical purpose of tidal power, and to assess the environmental impacts caused by a change of tidal regime due to large-scale development of tidal barrage. 1. Introduction Global warming in climate change has been the key issue everywhere. CO 2 emission due to fossil fuel usage and its reduction using advanced technology is leading issues in many science and engineering subjects. In order to ensure healthy air and a stable climate for our children and grandchildren, we must make responsible decisions about our energy sources. Existing technologies and forward-thinking policies offer practical and affordable solutions to reduce our dependence on the fossil fuels that currently dominate America’s electricity system. This system threatens the health of our communities by polluting the air and contributing to global warming. If left unchecked, heat-trapping emissions, such as carbon dioxide (CO 2 ), are expected to cause irreversible damage to communities throughout the United States and around the world. This damage will likely include increased urban air pollution and emerging infectious diseases such as West Nile Virus (Epstein and Rodgers, 2004); sea-level rise causing flooding and erosion in coastal communities; extreme weather including more intense droughts and hurricanes; reduced productivity of some agricultural regions; and loss of many treasured landscapes and species from coral reefs to polar bears (IPCC, 2001). Practical solutions do exist. For example, more than half of U.S. states have adopted a renewable electricity standard-a policy that requires electricity suppliers to gradually increase their use of renewable energy such as wind, solar, geothermal, and bioenergy (Scientists, 2010). These states are demonstrating that renewable standards are an affordable solution to reduce CO 2 and other unhealthy air emissions, while alleviating the harmful impact 29 【Report】 Journal of International Development and Cooperation, Vol.17, No.3, 2011, pp. 29-44 Ocean renewable energy: Tidal power in the Yellow Sea Han Soo LEE Assistant Professor Graduate School for International Development and Cooperation Hiroshima University 1-5-1, Kagamiyama, Higashi-Hiroshima, 739-8529, Japan. E-mail: [email protected]
Transcript of Ocean renewable energy: Tidal power in the Yellow Sea€¦ · Ocean renewable energy sources are...

Abstract
Ocean renewable energy sources are briefly introduced in this review article. Special focus on tidal energyfrom ocean renewable energy in the Yellow Sea and its practical utilization in South Korea are illustrated withseveral examples. Among them, the Sihwa Lake tidal power plant, the Garolim Bay tidal power project, the Incheontidal power project, and the Uldolmok tidal current power station were introduced with more details. A numericalmodelling system, Regional Ocean Tide Simulator, is introduced for now- and forecast of tidal regime to evaluatethe potential tidal power, to provide operational information for practical purpose of tidal power, and to assess theenvironmental impacts caused by a change of tidal regime due to large-scale development of tidal barrage.
1. Introduction
Global warming in climate change has been the key issue everywhere. CO2 emission due to fossil fuel usageand its reduction using advanced technology is leading issues in many science and engineering subjects.
In order to ensure healthy air and a stable climate for our children and grandchildren, we must makeresponsible decisions about our energy sources. Existing technologies and forward-thinking policies offer practicaland affordable solutions to reduce our dependence on the fossil fuels that currently dominate America’s electricitysystem. This system threatens the health of our communities by polluting the air and contributing to globalwarming. If left unchecked, heat-trapping emissions, such as carbon dioxide (CO2), are expected to causeirreversible damage to communities throughout the United States and around the world. This damage will likelyinclude increased urban air pollution and emerging infectious diseases such as West Nile Virus (Epstein andRodgers, 2004); sea-level rise causing flooding and erosion in coastal communities; extreme weather includingmore intense droughts and hurricanes; reduced productivity of some agricultural regions; and loss of many treasuredlandscapes and species from coral reefs to polar bears (IPCC, 2001).
Practical solutions do exist. For example, more than half of U.S. states have adopted a renewable electricitystandard-a policy that requires electricity suppliers to gradually increase their use of renewable energy such aswind, solar, geothermal, and bioenergy (Scientists, 2010). These states are demonstrating that renewable standardsare an affordable solution to reduce CO2 and other unhealthy air emissions, while alleviating the harmful impact
29
【Report】
Journal of International Development and Cooperation, Vol.17, No.3, 2011, pp. 29-44
Ocean renewable energy: Tidal power in the Yellow Sea
Han Soo LEEAssistant Professor
Graduate School for International Development and Cooperation
Hiroshima University
1-5-1, Kagamiyama, Higashi-Hiroshima, 739-8529, Japan.
E-mail: [email protected]
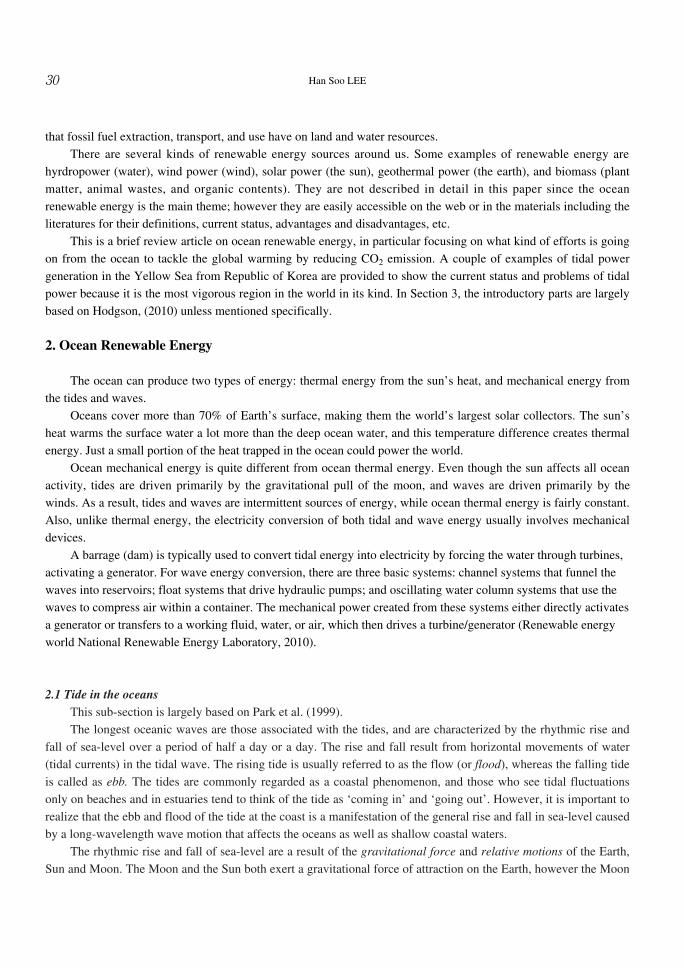
30 Han Soo LEE
that fossil fuel extraction, transport, and use have on land and water resources.There are several kinds of renewable energy sources around us. Some examples of renewable energy are
hyrdropower (water), wind power (wind), solar power (the sun), geothermal power (the earth), and biomass (plantmatter, animal wastes, and organic contents). They are not described in detail in this paper since the oceanrenewable energy is the main theme; however they are easily accessible on the web or in the materials including theliteratures for their definitions, current status, advantages and disadvantages, etc.
This is a brief review article on ocean renewable energy, in particular focusing on what kind of efforts is goingon from the ocean to tackle the global warming by reducing CO2 emission. A couple of examples of tidal powergeneration in the Yellow Sea from Republic of Korea are provided to show the current status and problems of tidalpower because it is the most vigorous region in the world in its kind. In Section 3, the introductory parts are largelybased on Hodgson, (2010) unless mentioned specifically.
2. Ocean Renewable Energy
The ocean can produce two types of energy: thermal energy from the sun’s heat, and mechanical energy fromthe tides and waves.
Oceans cover more than 70% of Earth’s surface, making them the world’s largest solar collectors. The sun’sheat warms the surface water a lot more than the deep ocean water, and this temperature difference creates thermalenergy. Just a small portion of the heat trapped in the ocean could power the world.
Ocean mechanical energy is quite different from ocean thermal energy. Even though the sun affects all oceanactivity, tides are driven primarily by the gravitational pull of the moon, and waves are driven primarily by thewinds. As a result, tides and waves are intermittent sources of energy, while ocean thermal energy is fairly constant.Also, unlike thermal energy, the electricity conversion of both tidal and wave energy usually involves mechanicaldevices.
A barrage (dam) is typically used to convert tidal energy into electricity by forcing the water through turbines,activating a generator. For wave energy conversion, there are three basic systems: channel systems that funnel thewaves into reservoirs; float systems that drive hydraulic pumps; and oscillating water column systems that use thewaves to compress air within a container. The mechanical power created from these systems either directly activatesa generator or transfers to a working fluid, water, or air, which then drives a turbine/generator (Renewable energyworld National Renewable Energy Laboratory, 2010).
2.1 Tide in the oceansThis sub-section is largely based on Park et al. (1999).The longest oceanic waves are those associated with the tides, and are characterized by the rhythmic rise and
fall of sea-level over a period of half a day or a day. The rise and fall result from horizontal movements of water(tidal currents) in the tidal wave. The rising tide is usually referred to as the flow (or flood), whereas the falling tideis called as ebb. The tides are commonly regarded as a coastal phenomenon, and those who see tidal fluctuationsonly on beaches and in estuaries tend to think of the tide as ‘coming in’ and ‘going out’. However, it is important torealize that the ebb and flood of the tide at the coast is a manifestation of the general rise and fall in sea-level causedby a long-wavelength wave motion that affects the oceans as well as shallow coastal waters.
The rhythmic rise and fall of sea-level are a result of the gravitational force and relative motions of the Earth,Sun and Moon. The Moon and the Sun both exert a gravitational force of attraction on the Earth, however the Moon

31Ocean renewable energy: Tidal power in the Yellow Sea
exerts a larger gravitational force on the Earth because, although it is much smaller in mass, it is a great deal closerthan the Sun. Actually, the tidal-generating force is proportional to 1/R3, where the R is the distance between theobjects, the Earth and the Moon/Sun. This force of attraction causes the oceans, which make up 71% of the Earth’ssurface, to bulge along an axis pointing towards the Moon (lunar tide). Tides are produced by the rotation of theearth beneath this bulge in its watery coating, resulting in the rhythmic rise and fall of sea-level.
The Earth and the Moon behave as a single system, rotating about a common center of mass, with a period of27.3 days. In this single system, the period of Earth’s rotation, which is 24 hours in the Earth system, with respect tothe Moon is 24 hours 50 minutes. This is the lunar day. The orbits of the Moon around the common center are infact elliptical and the consequent variation in distance from Earth to Moon results in corresponding variations in thetide-generating forces. When the Moon is closest to the Earth, it is said to be in perigee, and the Moon’s tide-generating force is increased by up to 20% above the average value. When the Moon is furthest from Earth, it is inapogee, and the tide-generating force is reduced to about 20% below the average. The difference in the Earth-Moondistance between apogee and perigee is about 13%, and tidal ranges are greater when the Moon is at perigee. TheMoon’s elliptical orbit takes 18.6 years to complete a full precessional cycle. One more factor, which has significanteffect on the lunar tide, among a number of interacting cycles due to the relative motions of the Earth and Moon isthe declination of the Moon’s orbit relative to the equatorial plane of the Earth with 28.5º. The result of thedeclination is that the Moon appears rise and fall over the 27.3-day period to the observer on the Earth, producingthe inequalities of the lunar tide at same latitude of the Earth with the time interval of 12 hours 25 minutes.
The gravitational force and relative motion of the Earth and the Sun affects the tides in a similar manner as theMoon, but to a lesser degree. The oceans also bulge towards the Sun causing the sola’r tide. When the Earth, Moonand Sun are positioned in a straight line (a full or new Moon), the gravitational attractions are combined, resultingin very large spring tides. At half Moon, the Sun and Moon are at right angles, resulting in lower tides called neap
tides.However, the real tides observed in the coasts and oceans are not following the astronomical tides, which can
be determined and predicted by the abovementioned gravitational force and relative motions of the Earth, Sun andMoon. The reasons why actual tides do not behave as astronomical tides are 1) the wavelength of tidal waves islong relative to depth in the oceans. The propagation speed is slow relative to the rotating Earth and governed by thedepth of oceans since they are shallow-water waves due to long wavelength. 2) The Earth’s rotation is too rapid foreither inertia of the water masses or the frictional forces at the sea-bed to be overcome fast enough for astronomicaltides to occur. Therefore, there is a tidal lag, such that high tide commonly arrives some hours after the passage ofthe Moon overhead. 3) The presence of the land mass interrupts the tidal bulge’s directing circulation of the globe.The shape of ocean basins constrains the direction of tidal flows. 4) The Coriolis force affects the water movementsto the right or clockwise in Northern Hemisphere and to the left or counter-clockwise in Southern Hemisphereexcept at equator.
The dynamic theory of tides was developed to understand the actual tides by considering that the factors suchas the depths and configurations of the ocean basins, the Coriolis force, friction forces and inertia might influencethe behavior of water mass subjected to rhythmic forces resulting from the orbital relationships of the Earth, Moonand Sun. Even though the dynamic theory of tides is complex, it computes theoretical tides, which are very close tothe actual observed tides. In real tide system, the combined constraint of ocean basin geometry and the influence ofthe Coriolis force results in the development of amphidromic systems. In an amphidromic system the crest of tidalwave at high water circulates around an amphidromic point once during each tidal period. The tidal range is zero atan amphidromic point, and increases outwards away from it. Co-tidal (co-phase) lines in an amphidromic system isthe link of all the points where the tide is at the same stage (or phase) of its cycle. The successive co-tidal lines

32 Han Soo LEE
radiating outwards from the amphidromic point thus indicate the passage of the tidal wave crest around it. Co-range(co-amplitude) lines, approximately at right angles to them, are the link of all places that have the same tidal range(amplitude). Co-range lines are more-or-less concentric circles about the amphidromic point, representing larger andlarger tidal ranges the further away they are from it. (See Figure 1 for an amphidromic system)
The harmonic method is the practical application of the dynamic theory of tides and is the most usual andsatisfactory method for the prediction of real tidal heights. It makes use of the knowledge that the observed tide isthe sum of a number of harmonic constituents or partial tides, each of whose periods precisely corresponds with theperiod of some component of the relative astronomical motions between the Earth, Moon and Sun. For any coastallocation, each partial tide has a particular amplitude and phase. The actual observed tide at a particular place is theresultant or sum of all of the partial tide at that place. Therefore, in order to make accurate tidal predictions for alocation such as a seaport, the amplitude and phase for each partial tide that contributes to the actual tide must firstbe determined from analysis of the observed tides. This requires a record of measured tidal heights obtained over atime that is long compared with the periods of the partial tide concerned. There are 390 harmonic constituents orpartial tides identified so far. Table 1 shows the most important nine harmonic constituents among the 390 with theirsymbols, periods, and coefficients: four are semi-diurnal, three are diurnal and the other two are longer-period constituents.
� �
Figure 1. The movement of tidal crest creates a sloshing in the basin, and the Coriolis effect spins the water aboutthe basin. This creates an amphidromic point at its center, where the tidal range is zero. (Copyright 2005
Brooks/Cole Thomson)
Table 1. Some principal tidal constituents. The coefficient ratio is the ratio of the amplitude of the tidal componentto that of M2
Name of tidal component Symbol Period in solar hours Coefficient ratio (M2=100)
Semi-diurnal:Principal lunarPrincipal solarLarger lunar ellipticLuni-solar
M2S2N2K2
12.4212.0012.6611.97
10046.619.212.7
Dinrnal:Luni-solarPrincipal lunarPrincipal solar
K1O1P1
23.93 25.8224.07
58.441.519.4
Longer period:Lunar fortnightlyLunar monthly
MfMm
327.86661.30
17.29.1
33Ocean renewable energy: Tidal power in the Yellow Sea
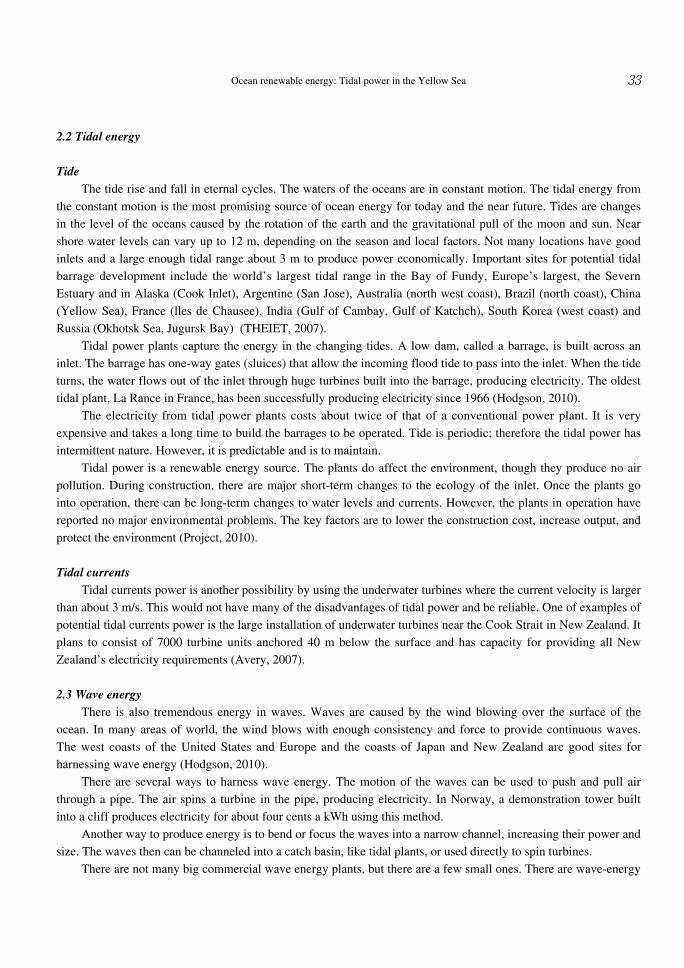
2.2 Tidal energy
TideThe tide rise and fall in eternal cycles. The waters of the oceans are in constant motion. The tidal energy from
the constant motion is the most promising source of ocean energy for today and the near future. Tides are changesin the level of the oceans caused by the rotation of the earth and the gravitational pull of the moon and sun. Nearshore water levels can vary up to 12 m, depending on the season and local factors. Not many locations have goodinlets and a large enough tidal range about 3 m to produce power economically. Important sites for potential tidalbarrage development include the world’s largest tidal range in the Bay of Fundy, Europe’s largest, the SevernEstuary and in Alaska (Cook Inlet), Argentine (San Jose), Australia (north west coast), Brazil (north coast), China(Yellow Sea), France (lles de Chausee), India (Gulf of Cambay, Gulf of Katchch), South Korea (west coast) andRussia (Okhotsk Sea, Jugursk Bay) (THEIET, 2007).
Tidal power plants capture the energy in the changing tides. A low dam, called a barrage, is built across aninlet. The barrage has one-way gates (sluices) that allow the incoming flood tide to pass into the inlet. When the tideturns, the water flows out of the inlet through huge turbines built into the barrage, producing electricity. The oldesttidal plant, La Rance in France, has been successfully producing electricity since 1966 (Hodgson, 2010).
The electricity from tidal power plants costs about twice of that of a conventional power plant. It is veryexpensive and takes a long time to build the barrages to be operated. Tide is periodic; therefore the tidal power hasintermittent nature. However, it is predictable and is to maintain.
Tidal power is a renewable energy source. The plants do affect the environment, though they produce no airpollution. During construction, there are major short-term changes to the ecology of the inlet. Once the plants gointo operation, there can be long-term changes to water levels and currents. However, the plants in operation havereported no major environmental problems. The key factors are to lower the construction cost, increase output, andprotect the environment (Project, 2010).
Tidal currentsTidal currents power is another possibility by using the underwater turbines where the current velocity is larger
than about 3 m/s. This would not have many of the disadvantages of tidal power and be reliable. One of examples ofpotential tidal currents power is the large installation of underwater turbines near the Cook Strait in New Zealand. Itplans to consist of 7000 turbine units anchored 40 m below the surface and has capacity for providing all NewZealand’s electricity requirements (Avery, 2007).
2.3 Wave energyThere is also tremendous energy in waves. Waves are caused by the wind blowing over the surface of the
ocean. In many areas of world, the wind blows with enough consistency and force to provide continuous waves.The west coasts of the United States and Europe and the coasts of Japan and New Zealand are good sites forharnessing wave energy (Hodgson, 2010).
There are several ways to harness wave energy. The motion of the waves can be used to push and pull airthrough a pipe. The air spins a turbine in the pipe, producing electricity. In Norway, a demonstration tower builtinto a cliff produces electricity for about four cents a kWh using this method.
Another way to produce energy is to bend or focus the waves into a narrow channel, increasing their power andsize. The waves then can be channeled into a catch basin, like tidal plants, or used directly to spin turbines.
There are not many big commercial wave energy plants, but there are a few small ones. There are wave-energy

34 Han Soo LEE
devices that power the lights and whistles on buoys. Small, on-shore sites have the best potential for the immediatefuture, especially if they can also be used to protect beaches and harbors. They could produce enough energy topower local communities.
Many devices, however, have to be very large and therefore costly, and they are subject to corrosion by seawater and buffeting by the waves. Also the price of wave-generated power is about six times the current price, forexample Portuguese government pays subsidy six times the current price. Therefore, the keys are again the low costfor production and increased output (Project, 2010).
2.4 Ocean thermal energyThe energy from the sun heats the surface water of the ocean. In tropical regions, the surface water can be 40
or more degrees warmer than the deep water. This difference can be used to produce electricity. Ocean ThermalEnergy Conversion (OTEC) has the potential to produce more energy than tide, wave, and wind combined, but it isa technology for the future. There are no large-scale OTEC power plants in use today (Hodgson, 2010).
There are three types of OTEC technologies: closed-cycle, open-cycle, and hybrid. Closed-cycle systems usethe ocean’s warm surface water to vaporize a working fluid, which has a low-boiling point, such as ammonia. Thevapor expands and turns a turbine. The turbine then activates a generator to produce electricity. Open-cycle systemsactually boil the seawater by operating at low pressures. This produces steam that passes through aturbine/generator. In an open system design, the steam is turned into fresh water, and new surface water is added tothe system. The hybrid systems combine both closed-cycle and open-cycle systems. In Hawaii, the OTEC plantwith 50MW has been constructed since the 1970s (Renewable energy world National Renewable EnergyLaboratory, 2010).
An OTEC system is only 2.5% efficient. The difficulties lays on the corrosiveness of the sea water, theproblem of anchoring the device, and the transmitting the power generated to where it needed (Project, 2010).
3. Tidal power extraction in the Yellow Sea
The Yellow Sea is a shallow inland sea lying between northeastern China and the Korean Peninsula, withdepths in its central north-south trough in excess of 60 to 80 m (Figure 2). It serves as the oceanic outlet for theHan, Yellow, Yalu, and Yangtze Rivers from the surrounding Korea and China, which drain much of the north-central China landscape, carrying large amounts of sediments into the sea-thus its name. Placing in a range oflatitudes between roughly 33ºN to 40ºN, its dynamics are those expected of a large, shallow, mid-latitude estuary onthe eastern boundary of a continent. The tides are dominantly semidiurnal. Tidal forcing is variable in space andtime, but is very significant. Peak tidal currents among the shores of western Korea are often 1 to 1.5 m/s and reacha maximum in the passage off the southwest tip of Korean peninsula near Uldolmok of 4.4 m/s. In the central basin,the speeds are of order 0.5 m/s. Tidal ranges along the Korean coast are 4 to 8 m, while those along the China coastare 1 to 2 m (Jackson, 2004).
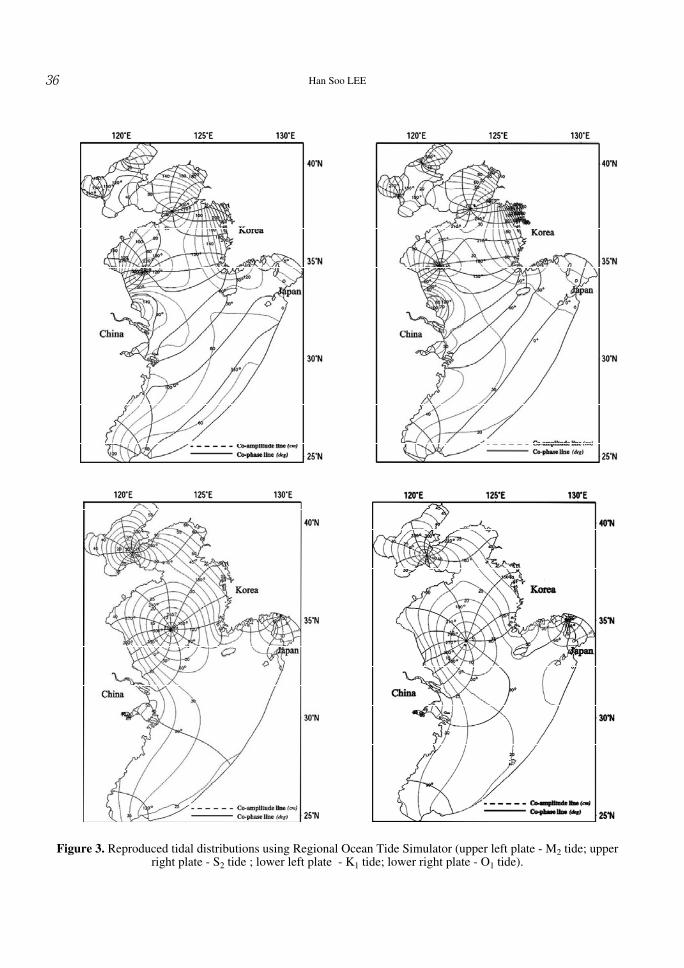
Figure 3 shows a map of co-phase (constant phase relative to the passage of the Moon overhead) and co-amplitude (constant range in meters) lines of the semidiurnal lunar M2, S2, K1 and O1. The currents circulatecounterclockwise around the amphidromes (Choi and Lee, 2003a).
In the winter, northerly winds from the Asian mainland are strong and the resultant convection and wavemixing render the water column isothermal and isohaline to the bottom, with essentially no density gradients. In thelate spring, summer, and early autumn, the southwesterly monsoon brings warm, wet air to the region with attendantrainfall and riverine runoff of fresh water. Solar heating combines with the fresh water outflow from the rivers to

35Ocean renewable energy: Tidal power in the Yellow Sea
strongly stratify the upper layers of the water column. This results in strong temperature, salinity, and densitygradients near depths of approximately 25 to 30 meters depending on wind mixing.
Figure 2. The Yellow Sea and locations of tidal power plant and on-going projects such as Sihwa Lake, GarolimBay, Incheon, and Uldolmok along the west and south coast of Korea.
36 Han Soo LEE
Figure 3. Reproduced tidal distributions using Regional Ocean Tide Simulator (upper left plate - M2 tide; upperright plate - S2 tide ; lower left plate - K1 tide; lower right plate - O1 tide).

37Ocean renewable energy: Tidal power in the Yellow Sea
3.1. Sihwa Tidal Power PlantSihwa Lake Tidal Power Station (Figure 4) is a large tidal power station currently under construction. Due to
be completed in August 2010 (Bae et al., 2010), it will operate with a total power output capacity of 254 MW,surpassing the 240 MW Rance Tidal Power Station in France to become the world’s largest tidal power installation.
The tidal barrage makes use of a seawall constructed in 1994 for flood mitigation and agricultural purposes.The 25.4 MW submerged bulb turbines are driven in an unpumped flood generation scheme; power is generated ontidal inflows only and the outflow is sluiced away. This slightly unconventional and relatively inefficient approachhas been chosen to balance a complex mix of existing land use, water use, conservation, environmental and powergeneration considerations (Park, 2007; Construction, 2009).
The tidal power station should provide indirect environmental benefits as well as renewable energy generation.After the seawall was built, pollution built up in the newly created Sihwa Lake reservoir, making its water uselessfor agriculture. In 2004, seawater was reintroduced in the hope of flushing out contamination; future inflows fromthe tidal barrage are envisaged as a complementary permanent solution (Park, 2007).
Cost of the project is being met by the South Korean Government and at present totals 313.5 billion won (Baeet al., 2010). Mean operating tidal range is 5.6 m, with a mean spring tidal range of 7.8 m. The working basin area is43 km2 (Lee, 2006). The test operation was scheduled from Dec. 2010 while gradually opening the shield protectionfor construction works.
Figure 4. The location of Sihwa Lake and the tidal power plant.

38 Han Soo LEE
3.2. Garolim Bay Tidal Power ProjectGarolim Bay Tidal Power Station (Figure 5) is a planned tidal power plant in Garolim Bay, on the west coast
of South Korea. The project is developed by Korea Western Power Company Limited and was in the process ofreceiving government approval as of November 2008 (Station, 2010a).
Garolim Bay is located between Seosan City and Taean County of Chungnam Province, South Korea, at thewestern seashore of South Korea with the mean tidal range of 4.7 m and the spring tidal range of 6.6 m. The lengthof planed tidal barrage is 2.0 km and the basin area is 45.5 km2. The electric power generation capacity of the plantwill be 520 MWh per day (26 MWh×20 sets) using one-way during ebb tide (Station, 2010a). Estimated annualoutput is 880 GWh. This is more than twice the capacity of the Rance Power Plant in France, which is the biggesttidal power plant in the world as of 2007. According to an announcement made by the power company, constructioncost was estimated to be 1 trillion Korean won (1 billion US dollars) as of 2005 (Lee, August 29 2008).
Garolim Bay Tidal Power Plant Project is now being included in the South Korean government’s renewableenergy strategy. The Korean government classifies tidal power as renewable, and the Garolim Bay Project isincluded in the renewable energy plan which the government announced in September 2008 (Station, 2010a).
On the other hands, the concerns on environmental impacts are rising at Garolim Bay. Garolim Bay is regarded
Figure 5. The location of Garolim Bay and a tidal barrage for tidal power plant.

39Ocean renewable energy: Tidal power in the Yellow Sea
as one of the important tidal flats in South Korea. The Korean government included this bay in the NationalWetland Inventory (Korea, 2008). The Yellow Sea Large Marine Ecosystem (YSLME) Project, managed by theUnited Nations Development Programme and the Global Environment Facility, also surveyed the ecology of thisbay (Park et al., 2008).
The Korean Federation for Environmental Movement (Friends of the Earth Korea) has criticized the project,arguing that the power plant is contrary to the purpose of renewable energy, because it would destroy the valuabletidal flats in the area, thus accelerating global warming (Station, 2010a).
According to a survey on fishery resources in 1981, supported by the Korean Ocean Research andDevelopment Institute, this bay is an important spawning ground for many species of fish. The study predicted thatthe plant’s construction would cause critical damage to the bay’s ecology (Hur, 1984). The bay is one of the mostimportant fish farming sites in Korea, composed of about 2000 fishery households (Station, 2010a).
3.3 Incheon Tidal Power ProjectThe Incheon Tidal Power Station (Figure 6) is a large tidal power station currently proposed to be built at the
Incheon Bay, South Korea. The mean tidal range at Incheon Bay is 5.3 m and the spring tidal range is 7.3 m. Thelength of planed tidal barrage is 20 km and the basin area is 106 km2. The facility is expected to top 1,320 MW ingenerating capacity with the help of 44 water turbines rated at 30 MW each using one-way generation schemeduring ebb tide, making this facility one of the largest of its kind in the world. The construction and developmentscosts are expected to reach KRW 3.9 trillion (USD 3.4 billion), of which would be entirely covered by privatefunding. The station is expected to generate up to 2.41 TWh of energy annually upon its completion in June 2017(Joongangdaily, 14 Jan. 2009; Koreatimes, 20 Jan. 2010).
3.4. Uldolmok Tidal Current Power ProjectUldolmok Tidal Power Station (Figure 7) is a tidal power station in Uldolmok, Jindo County, South Korea.
The Uldolmok Strait experiences tidal water speeds that exceed 6.5 m/s with the width of the strait beingapproximately 300 m due to the average tidal range of 3 m over the entire channel and the tidal phase difference of100 min between both ends. The water level difference through the Uldolmok Strait is 2 m (Lee, 2006).
The plant was commissioned in May 14, 2009 by the South Korean government. The plant cost US$10 millionand has an installed capacity of 1,000 KW (1 MW), generating 2.4 GWh annually, sufficient to meet the demand of
Figure 6. The location of Incheon tidal power plant.

40 Han Soo LEE
430 households (News, 1 Jun. 2009; Station, 2010b).The South Korean government plans to increase this capacity of 1 MW to 90 MW by the end of the year 2013,
increasing the demand cover to 46,000 households, while simultaneously working on the 254 MW Sihwa LakeTidal Power Station as a part of the goal of generating 5,260 GWh through tidal power by 2020 (News, 1 Jun. 2009;Station, 2010b).
Figure 7. The location of Uldolmok tidal current power test plant and its plan.

41Ocean renewable energy: Tidal power in the Yellow Sea
4. Now- and Forecast of Tidal Regime: Regional Ocean Tide Simulator
The necessity of predicting changes in tidal regime caused by large coastal engineering developments has ledto increased numerical modeling of ocean tides on the continental shelf since the 1970s (Flather, 1976; Choi, 1978;Greenberg, 1979). In view of practical concerns related to pollutants, oil spill dispersal, and search and rescueoperations at sea, and navigation, demands for accurate tidal predictions with respect to both time and space areincreasing. Tidal power plant usually requires large scale tidal barrage construction to utilize the exchange of thesea water and water level differences in river mouth or estuary. Therefore it is very important to know the presentand future states of tidal regime not only for the construction and operation of tidal power plant but also for theenvironmental impact assessment. The only practical way of obtaining effective solutions is to construct amathematical model that simulates the behavior of the tidal system, which plays a central role in the shelf sea,involving a set of equations of motion for the sea that are solved numerically to yield the tidal variation. An oceantide simulation system, Regional Ocean Tide Simulator (ROTS) for accurate modeling of the ocean tides in theregional seas of bordering the Korean Peninsula and Japan including the Yellow Sea was introduced (Choi and Lee,2003b) and brief explanations are in the following sub-section.
4.1. Regional Ocean Tide SimulatorThe main part of the ROTS is a modeling technique that converts the model equations to a discrete form and
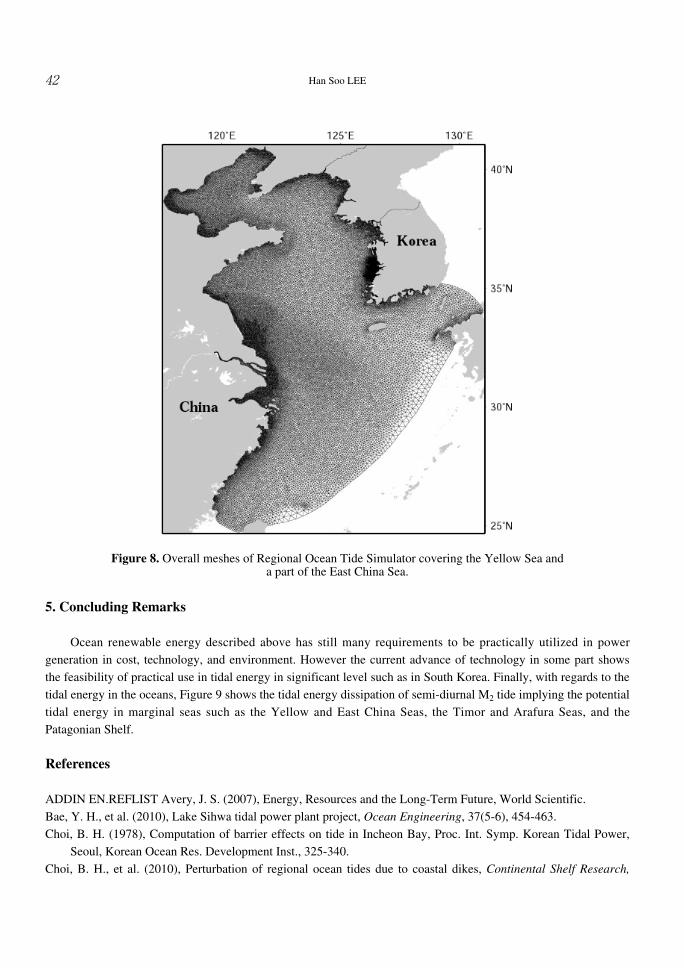
allows computation over spatially unstructured meshes, allowing more accurate representations of the coastlines,man-made dikes, coastal structures, and topographic features (ADCIRC, http://www.nd.edu/~adcirc/ manual.htm).Rather than refining dynamic grid nesting technique retaining the finite difference scheme, ROTS adopts the finiteelement technique. This method permits more flexibility in fitting irregular coastlines and allows bathymetry to befitted with elements of an arbitrary size, shape and orientation (in particular, tidal barrier positioning). GUI basedcode for partitioning of unstructured meshes in semi-automatic manner was also developed to resolve the detailedvariation of bottom topography and coastline topography. It permits easy editing of the unstructured meshes andmerging them into larger domain of base models, of which the open boundary conditions were prescribedpreviously with a series of adjustment runs. Considering the importance of setting up an appropriate model area,two versions of base models were created: one covering the Yellow Sea and the East China Sea (YS/ECS)continental shelf; and the YS/ES/WNP (the Yellow Sea, the East/Japan Sea and the western North Pacific)extending to the outer eastern Japanese coast. These models were helpful for focusing on different coastal regions ofinterest, as seen in Figure 8 for the YS version. With this simulator design, detailed meshes in the coastal andestuarine regions can be resolved and computations can be managed with parallel structures, demonstrating the easeof relocatablity within the base model regions. Applications of this system for the simulation of barrier effectsperturbing the tidal regime due to the construction of tidal dikes in the eastern Yellow Sea and Isahaya Bay in theAriake Sea can be found (Choi et al., 2010).
This technique can also be extended to three-dimensional flow computations and can be used for such now-and forecast of tidal regime of interests for the construction and operation of a tidal power plant.
42 Han Soo LEE
5. Concluding Remarks
Ocean renewable energy described above has still many requirements to be practically utilized in powergeneration in cost, technology, and environment. However the current advance of technology in some part showsthe feasibility of practical use in tidal energy in significant level such as in South Korea. Finally, with regards to thetidal energy in the oceans, Figure 9 shows the tidal energy dissipation of semi-diurnal M2 tide implying the potentialtidal energy in marginal seas such as the Yellow and East China Seas, the Timor and Arafura Seas, and thePatagonian Shelf.
References
ADDIN EN.REFLIST Avery, J. S. (2007), Energy, Resources and the Long-Term Future, World Scientific.Bae, Y. H., et al. (2010), Lake Sihwa tidal power plant project, Ocean Engineering, 37(5-6), 454-463.Choi, B. H. (1978), Computation of barrier effects on tide in Incheon Bay, Proc. Int. Symp. Korean Tidal Power,
Seoul, Korean Ocean Res. Development Inst., 325-340.Choi, B. H., et al. (2010), Perturbation of regional ocean tides due to coastal dikes, Continental Shelf Research,
Figure 8. Overall meshes of Regional Ocean Tide Simulator covering the Yellow Sea anda part of the East China Sea.

43Ocean renewable energy: Tidal power in the Yellow Sea
30(6), 553-563.Choi, B. H. and Lee, H. S. (2003a), Preoperational simulation of dike closure for Saemanguem tidal barriers, Proc.
of Workshop on Hydro-environmental Impacts of Large Coastal Developments, Seoul, Korea, HanrimwonPublishing Co., 91-118.
Choi, B. H. and Lee, H. S. (2003b), Regional Ocean Tide Simulator; Simulation of Barrier Effects, Asian andPacific Coasts 2003, APAC.
Construction, I. w. p. a. d. (2009). Tidal Power for breakthrough. fromhttp://www.waterpower- magazine.com/story.asp?sc=2052179.
Epstein, P. R. and Rodgers, C. (2004). Inside the Greenhouse: The Impacts of CO2 and Climate Change on PublicHealth in the Inner City, the Center for Health and the Global Environment Harvard Medical School.
Flather, R. A. (1976), A tidal model of the North-West European continental shelf, Mémoires de la Société Royale
des Sciences de Liège, ser. 6(10), 141-164.Greenberg, D. A. (1979), A numerical model investigation of tidal phenomena in the Bay of Fundy and Gulf of
Marine, Marine Geodesy, 2, 161-187.Hodgson, P. E. (2010), Energy, the Environment and Climate Change, London, Imperial College Press.Hur, S. B. (1984), Fisheries Resources in Garolim Bay, Bull. Korean Fish Soc., 17(1), 63-80.IPCC (2001), Third Assessment Report. Climate Change 2001: Impacts, Adaptation, and Vulnerability, Cambridge,
United Kingdom and New York, NY, USA, Cambridge University PressJackson, C. R. (2004), An Atlas of Internal Solitary-like Waves and their Properties, Alexandria, VA 22310, Global
Ocean Associates.Joongangdaily (14 Jan. 2009), Tidal plant to power Incheon, Joongangdaily.
Figure 9. Tidal energy dissipation map of semi-diurnal M2 tide in the oceans. (from NASA’s Goddard Space FlightCenter) Empirically drawn tidal dissipation map from six-year altimeter data from the TOPEX/Poseidon satellite. About 1 terawatt, or 25 to 30% of the total tidal energy dissipation, occurs in the deep ocean.The remainder occurs in shallow seas, such as on the Yellow and East China Seas. Red areas indicate tidal energydissipation areas implying that the dark-red areas have high potential for tidal energy.

44 Han Soo LEE
Korea, R. o. (2008), National Reports to be submitted to the 10th Meeting of the Conference of the ContractingParties, Republic of Korea, 28 October-4 November 2008, 11.
Koreatimes (20 Jan. 2010). Incheon to house largest tidal power station. Koreatimes.Lee, K.-S. (2006). Tidal and Tidal Current Power Study in Korea, Coastal Engineering Research Department,
KORDI.Lee, W. J. (August 29 2008). Problem with Garolim Bay (in Korean). Chosunilbo.News, W. a. T. E. (1 Jun. 2009). Korea’s Uldolmok tidal power project completed. from http://www.wave- tidal-
energy.com/home/news-archive/34-tidal-projects/197-koreas-uldolmok-tidal-power-project-completed.Park, D., et al. (1999). Waves, Tides and Shallow-water Processes, The Open University, Oxford, Butterworth-
Heinemann.Park, G. S., et al. (2008). Identification of Critical Habitats UNDP/GEF Yellow Sea Large Marine Ecosystem
Project.Park, N. (2007). Sihwa Tidal Power Plant: a success of environemnt and energy policy in Korea, Korea University.Project, T. N. (2010), Secondary Energy Infobook, National Energy Education Development Project.Renewable energy world National Renewable Energy Laboratory.(2010). Ocean energy. from
http://www.renewableenergyworld.com/rea/tech/ocean-energy.Scientists, U. o. c. (2010). Renewable energy standard - Mitigating global warming. from
http://www. ucsusa.org/clean_energy/technology_and_impacts/impacts/renewable-energy.html.Station, G. B. T. P. (2010a). Garolim Bay Tidal Power Station. from
http://en.wikipedia.org/w/index.php? oldid=383030607.Station, U. T. P. (2010b). Uldolmok Tidal Power Station. from http://en.wikipedia.org/w/index.php?oldid=
383030850.THEIET (2007). A factfile by the Institute of Engineering and Technology : Tidal power.