Ocean Biogeochemistry and Global Change - IGBP · Ocean Biogeochemistry and Global Change...
36
Ocean Biogeochemistry and Global Change IGBP Science No. 2 International Geosphere-Biosphere Programme Joint Global Ocean Flux Study
-
Upload
nguyendien -
Category
Documents
-
view
235 -
download
0
Transcript of Ocean Biogeochemistry and Global Change - IGBP · Ocean Biogeochemistry and Global Change...
OceanBiogeochemistry and
Global Change
IGBP Science No. 2International Geosphere-Biosphere Programme
Joint Global Ocean Flux Study
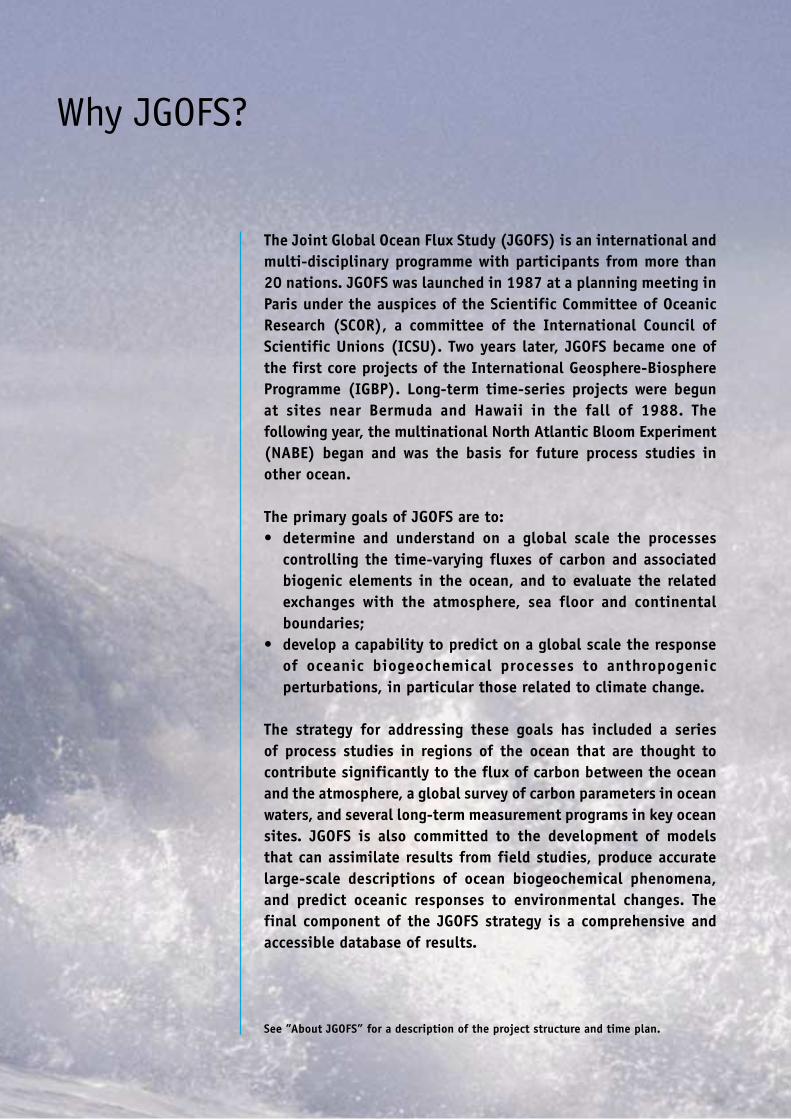
The Joint Global Ocean Flux Study (JGOFS) is an international andmulti-disciplinary programme with participants from more than20 nations. JGOFS was launched in 1987 at a planning meeting inParis under the auspices of the Scientific Committee of OceanicResearch (SCOR), a committee of the International Council ofScientific Unions (ICSU). Two years later, JGOFS became one ofthe first core projects of the International Geosphere-BiosphereProgramme (IGBP). Long-term time-series projects were begunat sites near Bermuda and Hawaii in the fall of 1988. Thefollowing year, the multinational North Atlantic Bloom Experiment(NABE) began and was the basis for future process studies inother ocean.
The primary goals of JGOFS are to:• determine and understand on a global scale the processes
controlling the time-varying fluxes of carbon and associatedbiogenic elements in the ocean, and to evaluate the relatedexchanges with the atmosphere, sea floor and continentalboundaries;
• develop a capability to predict on a global scale the responseof oceanic biogeochemical processes to anthropogenicperturbations, in particular those related to climate change.
The strategy for addressing these goals has included a seriesof process studies in regions of the ocean that are thought tocontribute significantly to the flux of carbon between the oceanand the atmosphere, a global survey of carbon parameters in oceanwaters, and several long-term measurement programs in key oceansites. JGOFS is also committed to the development of modelsthat can assimilate results from field studies, produce accuratelarge-scale descriptions of ocean biogeochemical phenomena,and predict oceanic responses to environmental changes. Thefinal component of the JGOFS strategy is a comprehensive andaccessible database of results.
See ”About JGOFS” for a description of the project structure and time plan.
Why JGOFS?
JGOFS IGBP SCIENCE No. 2 1
JGOFS Research Highlights 1988-2000Edited by Beatriz M. Baliño, Michael J.R. Fasham and Margaret C. Bowles
with contributions fromRobert Anderson, David Archer, Ulrich Bathmann, Philip Boyd, Ken Buesseler, Peter Burkill, Alexander Bychkov, Craig Carlson, Chen-Tung Arthur Chen, Scott Doney, Hugh Ducklow, Steven Emerson, Richard Feely, Gene Feldman, Veronique Garçon, Dennis Hansell, Roger Hanson, Paul Harrison, Susumu Honjo, Catherine Jeandel, David Karl, Robert Le Borgne, Kon-Kee Liu, Karin Lochte, Ferial Louanchi, Roy Lowry, Anthony Michaels, Patrick Monfray, James Murray, Andreas Oschlies, Trevor Platt, Julian Priddle, Renato Quiñones, Diana Ruiz-Pino, Toshiro Saino, Egil Sakshaug, Graham Shimmield, Sharon Smith, Walker Smith, Taro Takahashi, Paul Tréguer, Douglas Wallace, Rik Wanninkhof, Andrew Watson, Jürgen Willebrand, and Chi Shing Wong
Ocean Biogeochemistry and Global Change:
The International Geosphere-Biosphere Programme:
A Study of Global Change of the International Council for Science (ICSU)
Stockholm, Sweden

JGOFS IGBP SCIENCE No. 2 3
4 • Foreword
5 • Science Highlights
7 • Why Study the Oceans?
8 • The Role of the Ocean in the Global Carbon CycleThe physical and biological pumpsThe “breathing of the oceans”Human perturbations to ocean CO2 uptakeDetecting the human signal in the oceanWill the oceans continue to absorb anthropogenic CO2?
14 • The Components of the Ocean Carbon CycleMeasuring global primary productionFactors that affect the strength of the biological pumpQuantifying the magnitude of the biological pumpFluxes reaching the deep sea
20 • Assessing Changes Over TimeIncreasing CO2 content in the upper oceanChanges in community structure
22 • Models and PredictionsModelling chlorophyll and nitrate in the water columnModels of the global carbon cycleThe way forward
25 • Challenges For the Future
27 • About JGOFS
32 • Further Reading
IGBP SCIENCE No. 2 Con t en t s
4 IGBP SCIENCE No. 2 JGOFS
IN THIS ISSUE OF the IGBP Science Series, we report the achievements and scientifi c highlights of The Joint Global Ocean Flux Study (JGOFS). JGOFS began its active research phase in 1988 and has grown to include the work of many 100’s of scientists and students in over 20 seagoing nations on the seven continents and all the principal oceans of our planet.
JGOFS began around 1984 with the realization by oceanographers that the deployment of remote sensors on satellites, reliable deep-sea sediment traps and new conceptual models of marine foodwebs had made a true global biological and chemical study of the oceans not only possible, but necessary. Few of us realized at the time that JGOFS would become one of the principal thrusts of a large and growing body of global change research.
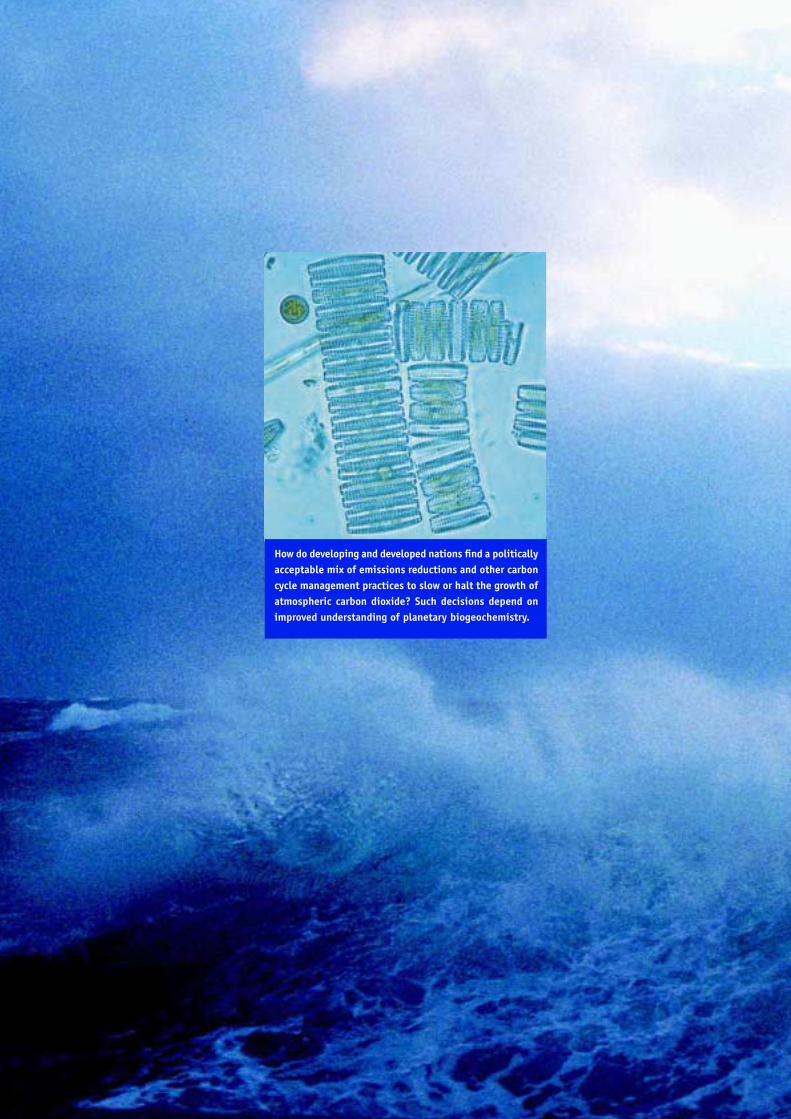
Now scientists, governments, policymakers, economists and industry leaders are engaged in the sometimes tortuous process of trying to design a broad international program to understand, predict, cope with and even perhaps manage climate change. How do developing and developed nations fi nd a politically acceptable mix of emissions reductions and other carbon cycle management practices to slow or halt the growth of atmospheric carbon dioxide (CO
2)? Such decisions depend on improved understanding of planetary
biogeochemistry. We know that the oceans and land biospheres together take up approximately
40% of the carbon added annually to the atmosphere by fossil fuels. We also know, from models and studies of ice cores and past climates, that the ocean has the potential to absorb even more CO
2 from the atmosphere. As a result
of JGOFS and WOCE research in the past decade, we know much about the physical and biogeochemical processes responsible for carbon uptake, and we know in general the regions and times of the year where the ocean absorbs CO
2 or releases it to the atmosphere. What we do not know in any detail is how the fi nely balanced ocean system
of CO2 exchange has been altered by rising levels of CO
2 in the atmosphere.
For example, has ocean biology changed in the past few decades? Further, we cannot yet predict with any certainty how the ocean carbon cycle will change as climate warms over the next century. How will ocean biology respond to changes in ocean mixing and winds? We are just beginning to design and deploy a global carbon observing system which will allow us to monitor the pulse of the planet in the years ahead.
It is fi tting that JGOFS follows the Global Change-Terrestrial Ecosystems (GCTE) program of the IGBP in this Science Series. As we begin to study the Earth as a system, and develop a new Earth System Science, we are learning how ocean and land observations mutually constrain estimates of carbon uptake. The future of our sciences and the key to responsible management of the planetary well-being lie in new, integrated programs of oceanographic, terrestrial and atmospheric research. In the following pages we see where we have been and try to look ahead.
Hugh Ducklow
Chair, JGOFS Scientifi c Steering CommitteeWilliamsburg, VA. December, 2000.
IGBP SCIENCE No. 2F o r ewo r d
JGOFS IGBP SCIENCE No. 2 5
JGOFS HAS IMPROVED ESTIMATES of the global air-sea fl ux of CO2 thanks to a massive
contribution of sea-surface measurements. This made it possible to get a picture of how the oceans “breathe”, i.e. where, and how much the oceans absorb or release CO
2 from and to the atmosphere. For instance, the equatorial Pacifi c
is the largest continuous natural source of CO2 to the atmosphere, while the
North Atlantic is the most intense region of CO2 uptake.
JGOFS has also established links between large-scale climate patterns such as the El Niño-Southern Oscillation (ENSO) or the North Atlantic Oscillation (NAO) and the inter-annual variability in the exchange of CO
2 in the Equatorial Pacifi c and
the subtropical gyres of the North Atlantic and Pacifi c oceans.
The exchange of CO2 between the ocean and the atmosphere, which is regulated
by the interplay of physical and biological processes, is not evenly distributed in space and time. In this regard, JGOFS has done much to quantify the strength of the ‘biological carbon pump’ in key areas of the ocean. We know now that, on average, less than 3% of the carbon fi xed in the upper ocean by microscopic algae is removed from exchange with the atmosphere for periods longer than 1,000 years. JGOFS has also detected changes in plankton species on decadal time scales. This has an impact on ecosystem structure and function which in turn can signifi cantly modify the ability of the oceans to take up atmospheric CO
2.
The oceans currently absorb approximately one-third to one-half of the anthropogenic CO
2 emitted from fossil fuels and industrial processes. However,
preliminary results from ocean-atmosphere models suggest that we will not be able to rely on the oceans to mop up excess CO
2 in the future if current global
warming trends continue. If the surface ocean becomes warmer, it may alter the nature and intensity of the ocean circulation or the availability of nutrients. Any such changes will have an impact on the oceans’ ability to absorb and retain the excess CO
2 in the future.
IGBP SCIENCE No. 2 S c i e n c e H i gh l i g h t s
6 IGBP SCIENCE No. 2 JGOFS
How do developing and developed nations fi nd a politically acceptable mix of emissions reductions and other carbon cycle management practices to slow or halt the growth of atmospheric carbon dioxide? Such decisions depend on improved understanding of planetary biogeochemistry.
JGOFS – Why Study the Oceans? IGBP SCIENCE No. 2 7
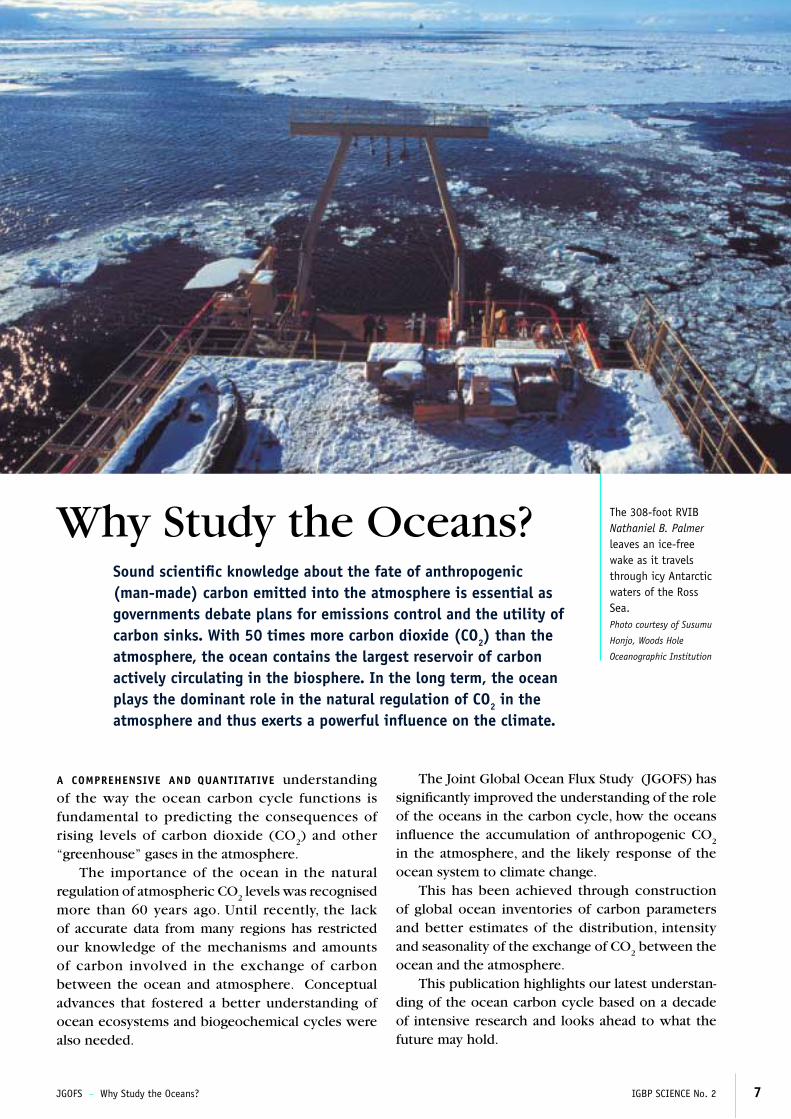
Sound scientifi c knowledge about the fate of anthropogenic (man-made) carbon emitted into the atmosphere is essential as governments debate plans for emissions control and the utility of carbon sinks. With 50 times more carbon dioxide (CO2) than the atmosphere, the ocean contains the largest reservoir of carbon actively circulating in the biosphere. In the long term, the ocean plays the dominant role in the natural regulation of CO2 in the atmosphere and thus exerts a powerful infl uence on the climate.
Why Study the Oceans? The 308-foot RVIB Nathaniel B. Palmer leaves an ice-free wake as it travels through icy Antarctic waters of the Ross Sea.Photo courtesy of Susumu
Honjo, Woods Hole
Oceanographic Institution
A COMPREHENSIVE AND QUANTITATIVE understanding of the way the ocean carbon cycle functions is fundamental to predicting the consequences of rising levels of carbon dioxide (CO
2) and other
“greenhouse” gases in the atmosphere. The importance of the ocean in the natural
regulation of atmospheric CO2 levels was recognised
more than 60 years ago. Until recently, the lack of accurate data from many regions has restricted our knowledge of the mechanisms and amounts of carbon involved in the exchange of carbon between the ocean and atmosphere. Conceptual advances that fostered a better understanding of ocean ecosystems and biogeochemical cycles were also needed.
The Joint Global Ocean Flux Study (JGOFS) has signifi cantly improved the understanding of the role of the oceans in the carbon cycle, how the oceans infl uence the accumulation of anthropogenic CO
2
in the atmosphere, and the likely response of the ocean system to climate change.
This has been achieved through construction of global ocean inventories of carbon parameters and better estimates of the distribution, intensity and seasonality of the exchange of CO
2 between the
ocean and the atmosphere.This publication highlights our latest understan-
ding of the ocean carbon cycle based on a decade of intensive research and looks ahead to what the future may hold.
8 IGBP SCIENCE No. 2 JGOFS – The Role Of the Ocean in the Global Carbon Cycle
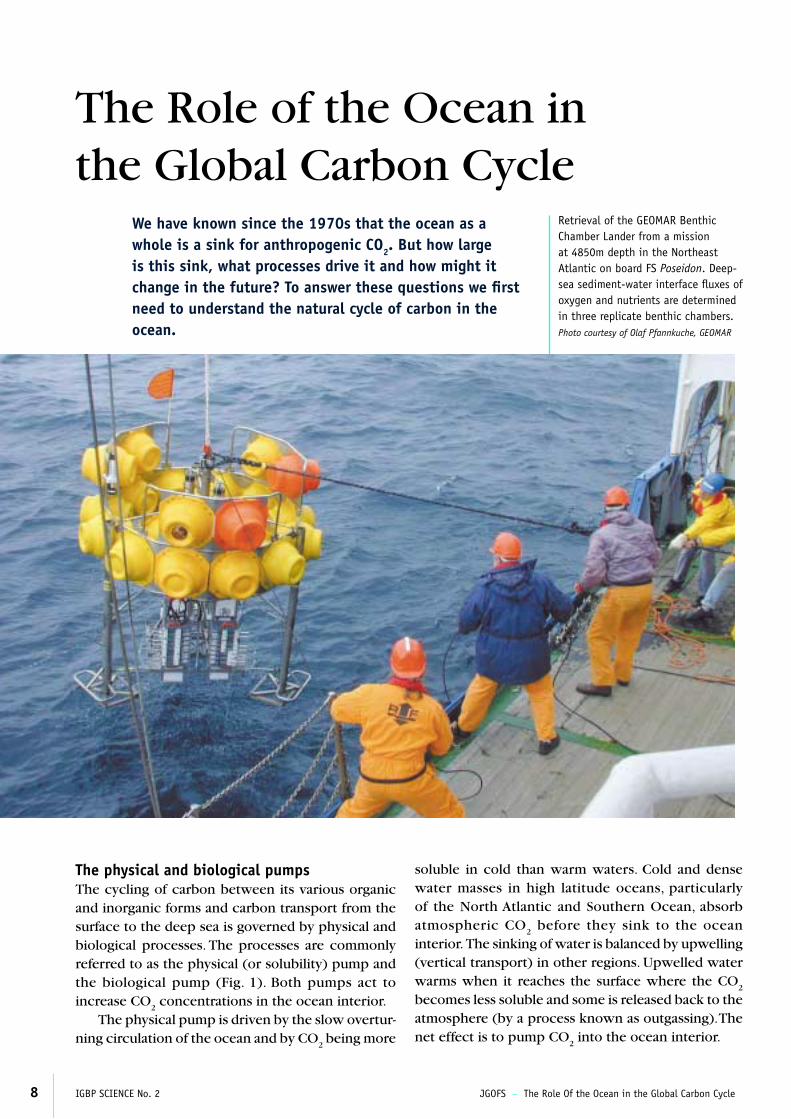
We have known since the 1970s that the ocean as a whole is a sink for anthropogenic CO2. But how large is this sink, what processes drive it and how might it change in the future? To answer these questions we fi rst need to understand the natural cycle of carbon in the ocean.
The Role of the Ocean in the Global Carbon Cycle
Retrieval of the GEOMAR Benthic Chamber Lander from a mission at 4850m depth in the Northeast Atlantic on board FS Poseidon. Deep-sea sediment-water interface fl uxes of oxygen and nutrients are determined in three replicate benthic chambers. Photo courtesy of Olaf Pfannkuche, GEOMAR
The physical and biological pumpsThe cycling of carbon between its various organic and inorganic forms and carbon transport from the surface to the deep sea is governed by physical and biological processes. The processes are commonly referred to as the physical (or solubility) pump and the biological pump (Fig. 1). Both pumps act to increase CO
2 concentrations in the ocean interior.
The physical pump is driven by the slow overtur-ning circulation of the ocean and by CO
2 being more
soluble in cold than warm waters. Cold and dense water masses in high latitude oceans, particularly of the North Atlantic and Southern Ocean, absorb atmospheric CO
2 before they sink to the ocean
interior. The sinking of water is balanced by upwelling (vertical transport) in other regions. Upwelled water warms when it reaches the surface where the CO
2
becomes less soluble and some is released back to the atmosphere (by a process known as outgassing). The net effect is to pump CO
2 into the ocean interior.
JGOFS – The Role Of the Ocean in the Global Carbon Cycle IGBP SCIENCE No. 2 9
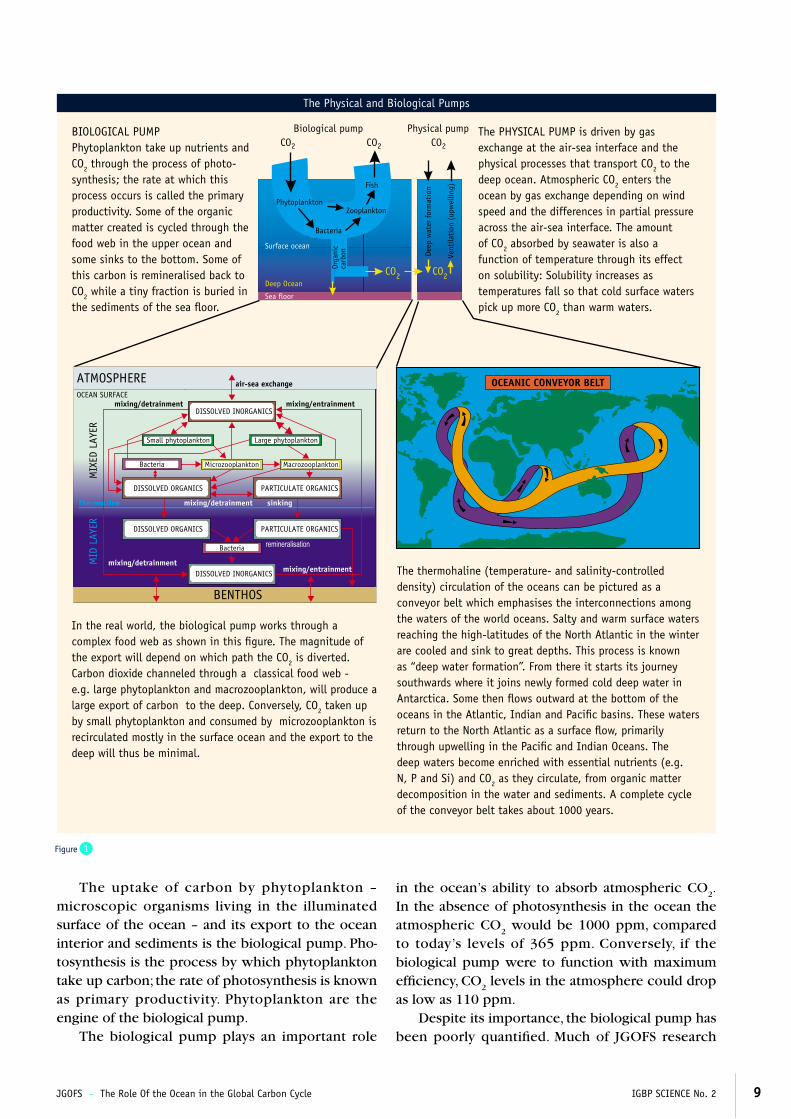
BIOLOGICAL PUMPPhytoplankton take up nutrients and CO2 through the process of photo-synthesis; the rate at which this process occurs is called the primary productivity. Some of the organic matter created is cycled through the food web in the upper ocean and some sinks to the bottom. Some of this carbon is remineralised back to CO2 while a tiny fraction is buried in the sediments of the sea fl oor.
In the real world, the biological pump works through a complex food web as shown in this fi gure. The magnitude of the export will depend on which path the CO2 is diverted. Carbon dioxide channeled through a classical food web - e.g. large phytoplankton and macrozooplankton, will produce a large export of carbon to the deep. Conversely, CO2 taken up by small phytoplankton and consumed by microzooplankton is recirculated mostly in the surface ocean and the export to the deep will thus be minimal.
The PHYSICAL PUMP is driven by gas exchange at the air-sea interface and the physical processes that transport CO2 to the deep ocean. Atmospheric CO2 enters the ocean by gas exchange depending on wind speed and the differences in partial pressure across the air-sea interface. The amount of CO2 absorbed by seawater is also a function of temperature through its effect on solubility: Solubility increases as temperatures fall so that cold surface waters pick up more CO2 than warm waters.
The thermohaline (temperature- and salinity-controlled density) circulation of the oceans can be pictured as a conveyor belt which emphasises the interconnections among the waters of the world oceans. Salty and warm surface waters reaching the high-latitudes of the North Atlantic in the winter are cooled and sink to great depths. This process is known as “deep water formation”. From there it starts its journey southwards where it joins newly formed cold deep water in Antarctica. Some then fl ows outward at the bottom of the oceans in the Atlantic, Indian and Pacifi c basins. These waters return to the North Atlantic as a surface fl ow, primarily through upwelling in the Pacifi c and Indian Oceans. The deep waters become enriched with essential nutrients (e.g. N, P and Si) and CO2 as they circulate, from organic matter decomposition in the water and sediments. A complete cycle of the conveyor belt takes about 1000 years.
The uptake of carbon by phytoplankton – microscopic organisms living in the illuminated surface of the ocean – and its export to the ocean interior and sediments is the biological pump. Pho-tosynthesis is the process by which phytoplankton take up carbon; the rate of photosynthesis is known as primary productivity. Phytoplankton are the engine of the biological pump.
The biological pump plays an important role
in the ocean’s ability to absorb atmospheric CO2.
In the absence of photosynthesis in the ocean the atmospheric CO
2 would be 1000 ppm, compared
to today’s levels of 365 ppm. Conversely, if the biological pump were to function with maximum effi ciency, CO
2 levels in the atmosphere could drop
as low as 110 ppm. Despite its importance, the biological pump has
been poorly quantifi ed. Much of JGOFS research
mixing/detrainment
mixing/detrainment sinking
DISSOLVED INORGANICS
DISSOLVED INORGANICS
DISSOLVED ORGANICS PARTICULATE ORGANICS
DISSOLVED ORGANICS PARTICULATE ORGANICS
Bacteria
Bacteria Microzooplankton Macrozooplankton
Large phytoplanktonSmall phytoplankton
BENTHOS
MID
LAY
ER
mixing/entrainmentmixing/detrainment
air-sea exchange
MIX
ED L
AYER
Thermocline
ATMOSPHEREOCEAN SURFACE
mixing/entrainment
Figure 1 The Physical and Biological Pumps
The Physical and Biological Pumps
PhytoplanktonZooplankton
Fish
Bacteria
CO2
Deep
wat
er f
orm
atio
n
Vent
ilati
on (
upw
ellin
g)
Deep Ocean
Surface ocean
Sea floor
Orga
nic
carb
on
Biological pump Physical pump
CO2
CO2 CO2
CO2
OCEANIC CONVEYOR BELT
10 IGBP SCIENCE No. 2 JGOFS – The Role Of the Ocean in the Global Carbon Cycle
Figure 2 The Physical and Biological Pumps
The Breathing of the Oceans
Net Flux (1012 grams C y-1 in each 4o x 5o area)
0° 20° 40° 60° 80° 100° 120° 140° 160° 180° 160° 140° 120° 100° 80° 60° 40° 20° 0°
0 °20° 40° 60° 80° 100° 120° 140° 160° 180° 160° 140° 120° 100° 80° 60° 40° 20° 0°
-10 -8 -7 -6 -5 -4 -3 -2 -1 0 1 2 3 4 5 6 10
80°
60°
70°
40°
50°
20°
30°
0°
10°
60°70°
40°
50°
20°
30°
10°
80°
60°
70°
40°
50°
20°
30°
0°
10°
60°70°
40°
50°
20°
30°
10°
has focussed on extending our knowledge of the biological processes, their variation through the seasons, and large-scale climatic and episodic events that infl uence the functioning of the pump.
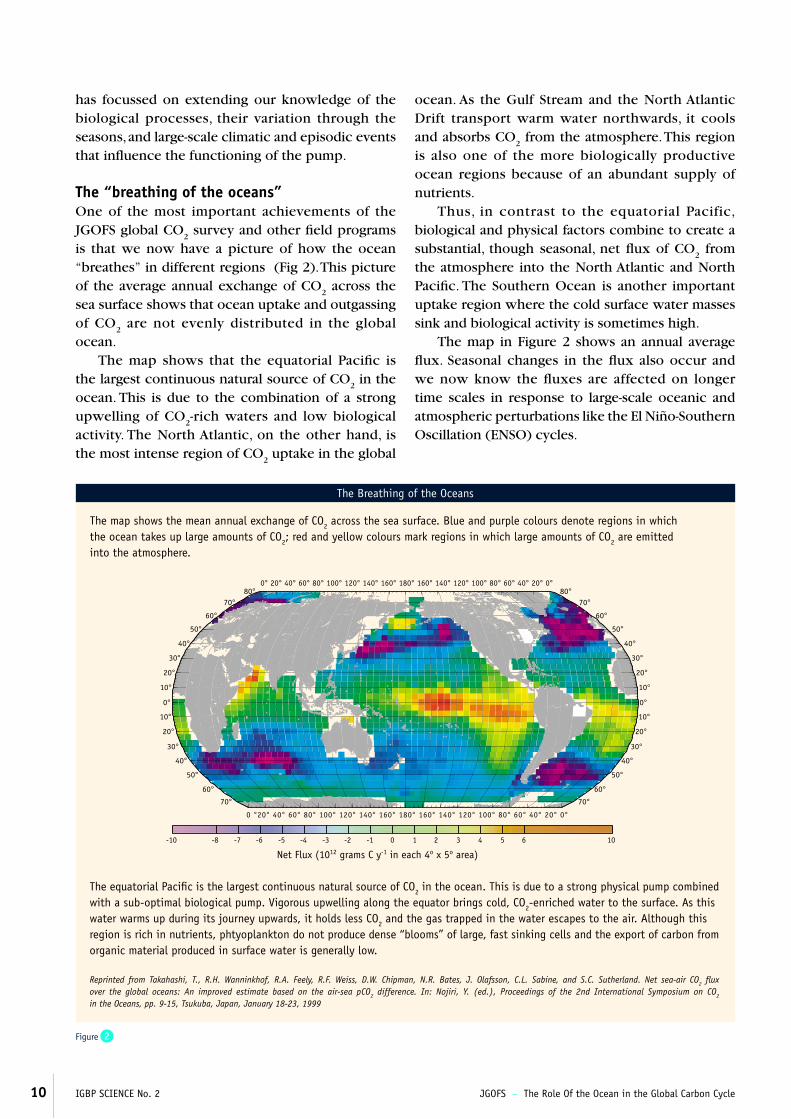
The “breathing of the oceans”One of the most important achievements of the JGOFS global CO
2 survey and other fi eld programs
is that we now have a picture of how the ocean “breathes” in different regions (Fig 2). This picture of the average annual exchange of CO
2 across the
sea surface shows that ocean uptake and outgassing of CO
2 are not evenly distributed in the global
ocean.The map shows that the equatorial Pacifi c is
the largest continuous natural source of CO2 in the
ocean. This is due to the combination of a strong upwelling of CO
2-rich waters and low biological
activity. The North Atlantic, on the other hand, is the most intense region of CO
2 uptake in the global
ocean. As the Gulf Stream and the North Atlantic Drift transport warm water northwards, it cools and absorbs CO
2 from the atmosphere. This region
is also one of the more biologically productive ocean regions because of an abundant supply of nutrients.
Thus, in contrast to the equatorial Pacific, biological and physical factors combine to create a substantial, though seasonal, net fl ux of CO
2 from
the atmosphere into the North Atlantic and North Pacifi c. The Southern Ocean is another important uptake region where the cold surface water masses sink and biological activity is sometimes high.
The map in Figure 2 shows an annual average fl ux. Seasonal changes in the fl ux also occur and we now know the fl uxes are affected on longer time scales in response to large-scale oceanic and atmospheric perturbations like the El Niño-Southern Oscillation (ENSO) cycles.
The map shows the mean annual exchange of CO2 across the sea surface. Blue and purple colours denote regions in which the ocean takes up large amounts of CO2; red and yellow colours mark regions in which large amounts of CO2 are emitted into the atmosphere.
The equatorial Pacifi c is the largest continuous natural source of CO2 in the ocean. This is due to a strong physical pump combined with a sub-optimal biological pump. Vigorous upwelling along the equator brings cold, CO2-enriched water to the surface. As this water warms up during its journey upwards, it holds less CO2 and the gas trapped in the water escapes to the air. Although this region is rich in nutrients, phtyoplankton do not produce dense “blooms” of large, fast sinking cells and the export of carbon from organic material produced in surface water is generally low.
Reprinted from Takahashi, T., R.H. Wanninkhof, R.A. Feely, R.F. Weiss, D.W. Chipman, N.R. Bates, J. Olafsson, C.L. Sabine, and S.C. Sutherland. Net sea-air CO2 fl ux over the global oceans: An improved estimate based on the air-sea pCO2 difference. In: Nojiri, Y. (ed.), Proceedings of the 2nd International Symposium on CO2 in the Oceans, pp. 9-15, Tsukuba, Japan, January 18-23, 1999
JGOFS – The Role Of the Ocean in the Global Carbon Cycle IGBP SCIENCE No. 2 11
Figure 3
The Global Carbon Cycle
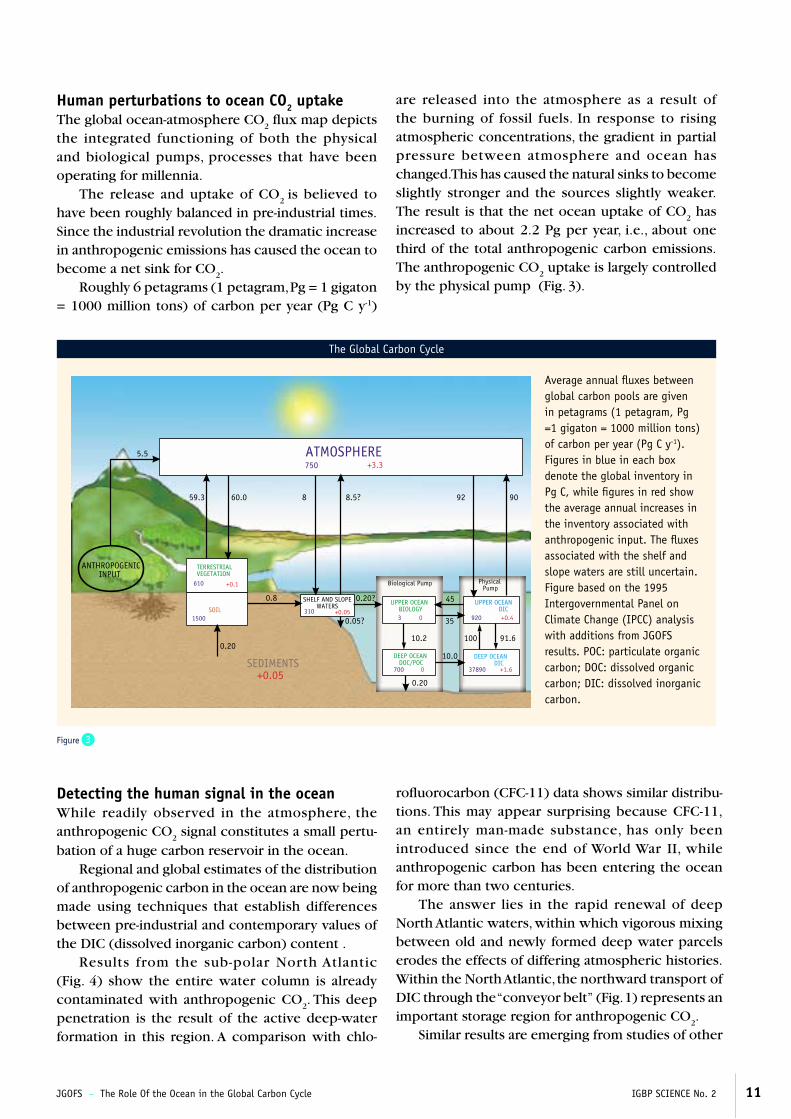
Human perturbations to ocean CO2 uptake The global ocean-atmosphere CO
2 fl ux map depicts
the integrated functioning of both the physical and biological pumps, processes that have been operating for millennia.
The release and uptake of CO2
is believed to have been roughly balanced in pre-industrial times. Since the industrial revolution the dramatic increase in anthropogenic emissions has caused the ocean to become a net sink for CO
2.
Roughly 6 petagrams (1 petagram, Pg = 1 gigaton = 1000 million tons) of carbon per year (Pg C y-1)
TERRESTRIAL VEGETATION
SOIL
SHELF AND SLOPEWATERS UPPER OCEAN
BIOLOGYUPPER OCEAN
DIC
DEEP OCEAN DOC/POC
DEEP OCEAN DICSEDIMENTS
5.5 ATMOSPHERE750
59.3 60.0
610
0.8
+0.05
+3.3
0.20?
0.20
0.20
0.05? 3 0
700 0
45
35
10.2
10.0
100 91.6
37890 +1.6
920 +0.4
92 90
Biological Pump Physical Pump
8 8.5?
1500
+0.1
+0.05
ANTHROPOGENICINPUT
310
are released into the atmosphere as a result of the burning of fossil fuels. In response to rising atmospheric concentrations, the gradient in partial pressure between atmosphere and ocean has changed. This has caused the natural sinks to become slightly stronger and the sources slightly weaker. The result is that the net ocean uptake of CO
2 has
increased to about 2.2 Pg per year, i.e., about one third of the total anthropogenic carbon emissions. The anthropogenic CO
2 uptake is largely controlled
by the physical pump (Fig. 3).
Detecting the human signal in the oceanWhile readily observed in the atmosphere, the anthropogenic CO
2 signal constitutes a small pertu-
bation of a huge carbon reservoir in the ocean. Regional and global estimates of the distribution
of anthropogenic carbon in the ocean are now being made using techniques that establish differences between pre-industrial and contemporary values of the DIC (dissolved inorganic carbon) content .
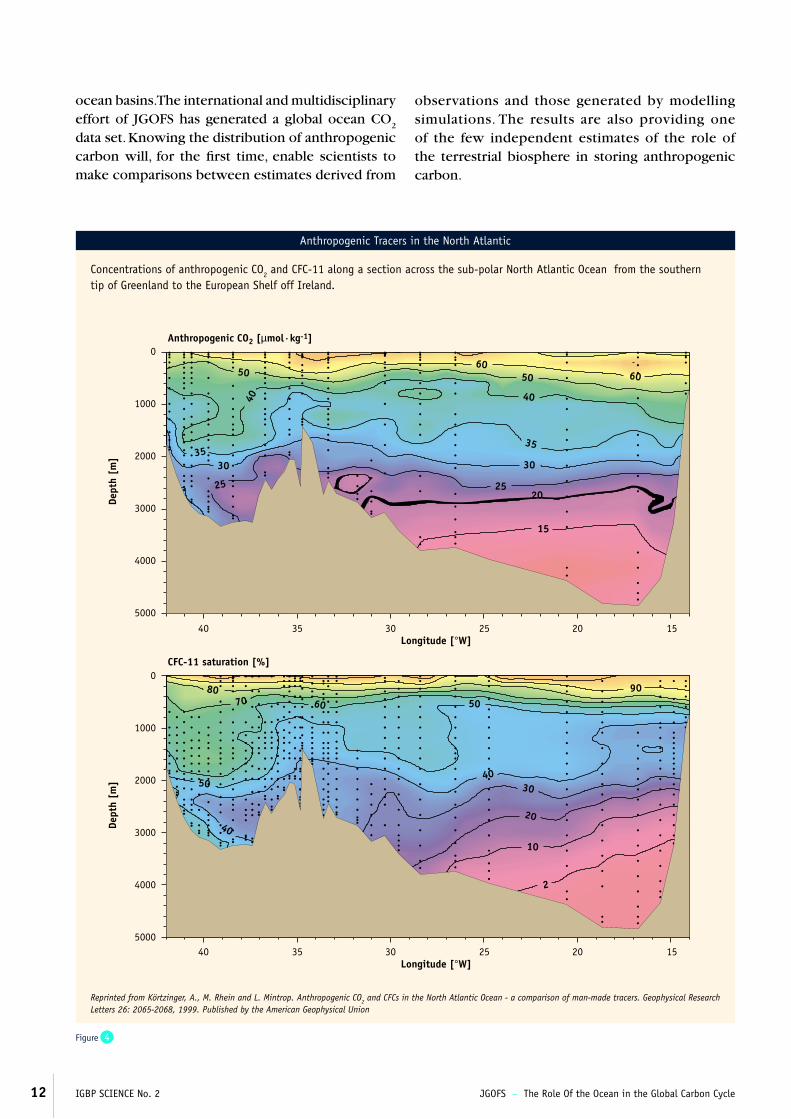
Results from the sub-polar North Atlantic (Fig. 4) show the entire water column is already contaminated with anthropogenic CO
2. This deep
penetration is the result of the active deep-water formation in this region. A comparison with chlo-
rofl uorocarbon (CFC-11) data shows similar distribu-tions. This may appear surprising because CFC-11, an entirely man-made substance, has only been introduced since the end of World War II, while anthropogenic carbon has been entering the ocean for more than two centuries.
The answer lies in the rapid renewal of deep North Atlantic waters, within which vigorous mixing between old and newly formed deep water parcels erodes the effects of differing atmospheric histories. Within the North Atlantic, the northward transport of DIC through the “conveyor belt” (Fig. 1) represents an important storage region for anthropogenic CO
2.
Similar results are emerging from studies of other
Average annual fl uxes between global carbon pools are given in petagrams (1 petagram, Pg =1 gigaton = 1000 million tons) of carbon per year (Pg C y-1). Figures in blue in each box denote the global inventory in Pg C, while fi gures in red show the average annual increases in the inventory associated with anthropogenic input. The fl uxes associated with the shelf and slope waters are still uncertain. Figure based on the 1995 Intergovernmental Panel on Climate Change (IPCC) analysis with additions from JGOFS results. POC: particulate organic carbon; DOC: dissolved organic carbon; DIC: dissolved inorganic carbon.
12 IGBP SCIENCE No. 2 JGOFS – The Role Of the Ocean in the Global Carbon Cycle
Figure 4
Anthropogenic Tracers in the North Atlantic
ocean basins. The international and multidisciplinary effort of JGOFS has generated a global ocean CO
2
data set. Knowing the distribution of anthropogenic carbon will, for the fi rst time, enable scientists to make comparisons between estimates derived from
Longitude [°W]40 35 30 25 20 15
40 35 30 25 20 15
5000
4000
3000
2000
1000
0
5000
4000
3000
2000
1000
0
Longitude [°W]
CFC-11 saturation [%]
Dept
h [m
]
Anthropogenic CO2 [µmol·kg-1]
Dept
h [m
]
40
40
7080 90
60 50
50 30
20
10
40
50
40
2
3535
25
30
605060
20
30
15
25
observations and those generated by modelling simulations. The results are also providing one of the few independent estimates of the role of the terrestrial biosphere in storing anthropogenic carbon.
Concentrations of anthropogenic CO2 and CFC-11 along a section across the sub-polar North Atlantic Ocean from the southern tip of Greenland to the European Shelf off Ireland.
Reprinted from Körtzinger, A., M. Rhein and L. Mintrop. Anthropogenic CO2 and CFCs in the North Atlantic Ocean - a comparison of man-made tracers. Geophysical Research Letters 26: 2065-2068, 1999. Published by the American Geophysical Union
JGOFS – The Role Of the Ocean in the Global Carbon Cycle IGBP SCIENCE No. 2 13
Figure 5
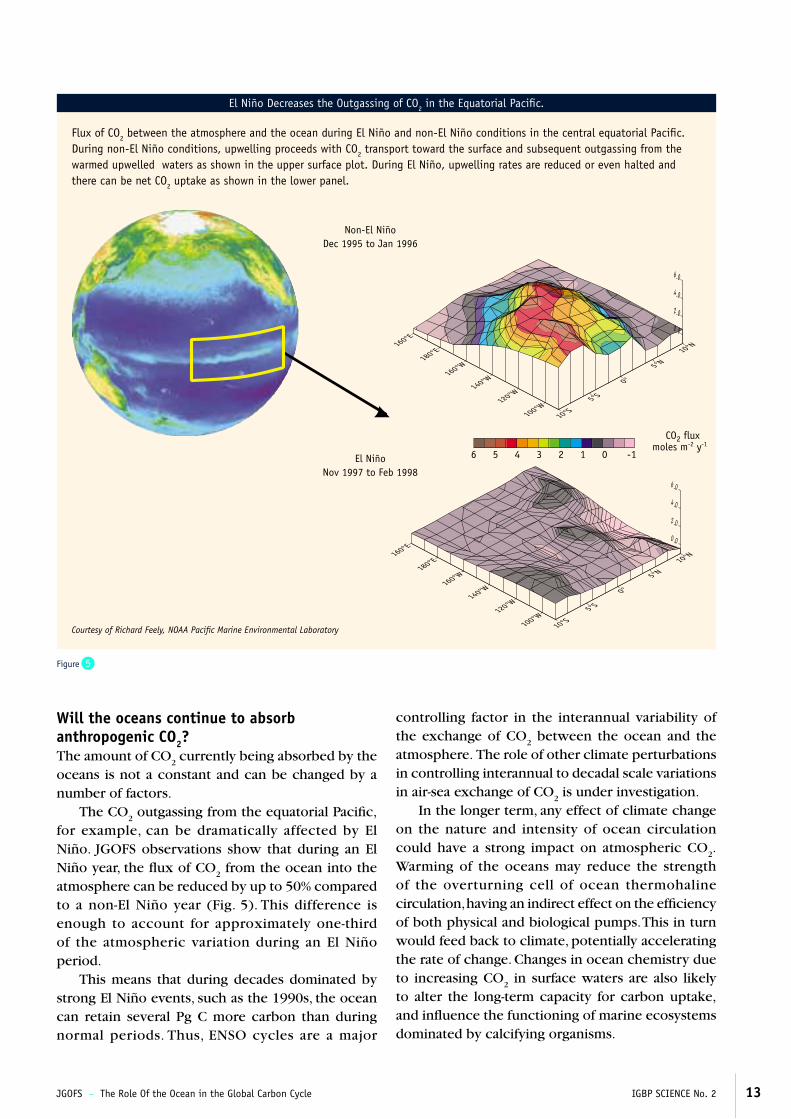
El Niño Decreases the Outgassing of CO2 in the Equatorial Pacifi c.
Will the oceans continue to absorb anthropogenic CO2? The amount of CO
2 currently being absorbed by the
oceans is not a constant and can be changed by a number of factors.
The CO2 outgassing from the equatorial Pacifi c,
for example, can be dramatically affected by El Niño. JGOFS observations show that during an El Niño year, the fl ux of CO
2 from the ocean into the
atmosphere can be reduced by up to 50% compared to a non-El Niño year (Fig. 5). This difference is enough to account for approximately one-third of the atmospheric variation during an El Niño period.
This means that during decades dominated by strong El Niño events, such as the 1990s, the ocean can retain several Pg C more carbon than during normal periods. Thus, ENSO cycles are a major
6 5 4 3 2 1 0 -1
CO2 fluxmoles m-2 y-1
El NiñoNov 1997 to Feb 1998
Non-El NiñoDec 1995 to Jan 1996
160°E
160°W
180°E
140°W
100°W
120°W
10°S5°S
5°N10°N
0°
6.0
4.0
2.0
0.0
160°E
160°W
180°E
140°W
100°W
120°W
10°S5°S
5°N10°N
0°
6.0
4.0
2.0
0.0
controlling factor in the interannual variability of the exchange of CO
2 between the ocean and the
atmosphere. The role of other climate perturbations in controlling interannual to decadal scale variations in air-sea exchange of CO
2 is under investigation.
In the longer term, any effect of climate change on the nature and intensity of ocean circulation could have a strong impact on atmospheric CO
2.
Warming of the oceans may reduce the strength of the overturning cell of ocean thermohaline circulation, having an indirect effect on the effi ciency of both physical and biological pumps. This in turn would feed back to climate, potentially accelerating the rate of change. Changes in ocean chemistry due to increasing CO
2 in surface waters are also likely
to alter the long-term capacity for carbon uptake, and infl uence the functioning of marine ecosystems dominated by calcifying organisms.
Flux of CO2 between the atmosphere and the ocean during El Niño and non-El Niño conditions in the central equatorial Pacifi c. During non-El Niño conditions, upwelling proceeds with CO2 transport toward the surface and subsequent outgassing from the warmed upwelled waters as shown in the upper surface plot. During El Niño, upwelling rates are reduced or even halted and there can be net CO2 uptake as shown in the lower panel.
Courtesy of Richard Feely, NOAA Pacifi c Marine Environmental Laboratory
14 IGBP SCIENCE No. 2 JGOFS – The Components Of the Ocean Carbon Cycle
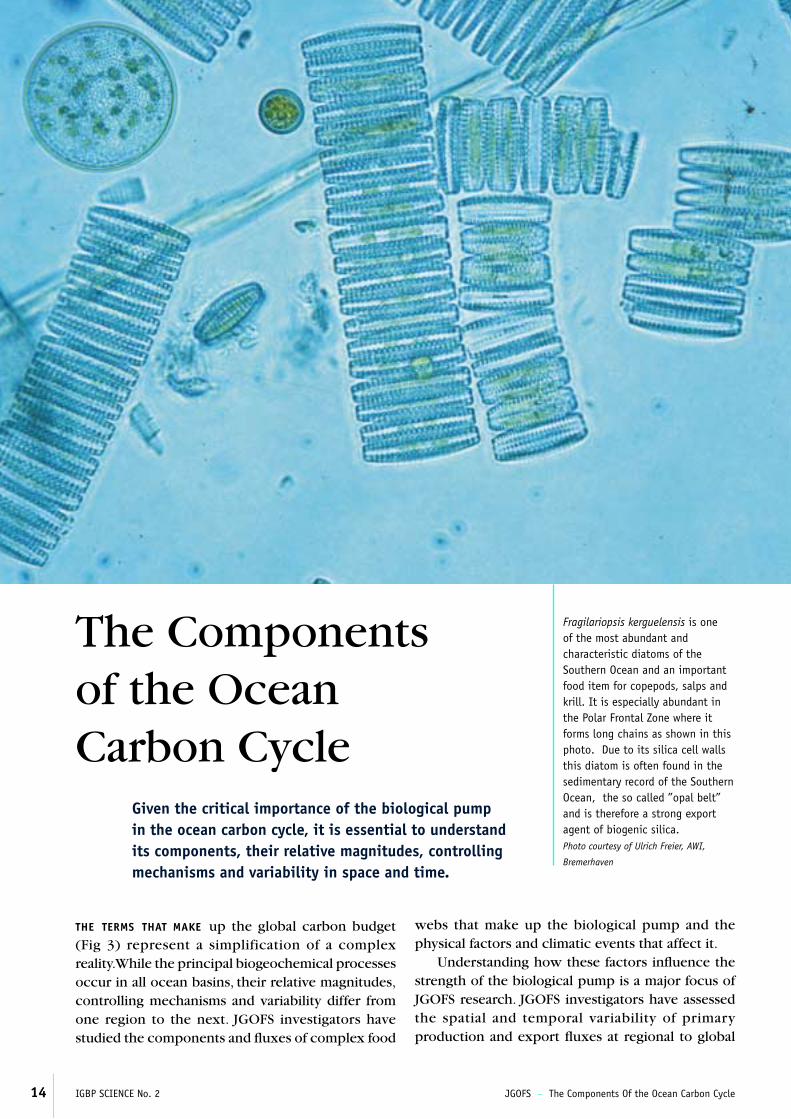
Given the critical importance of the biological pump in the ocean carbon cycle, it is essential to understand its components, their relative magnitudes, controlling mechanisms and variability in space and time.
The Components of the Ocean Carbon Cycle
Fragilariopsis kerguelensis is one of the most abundant and characteristic diatoms of the Southern Ocean and an important food item for copepods, salps and krill. It is especially abundant in the Polar Frontal Zone where it forms long chains as shown in this photo. Due to its silica cell walls this diatom is often found in the sedimentary record of the Southern Ocean, the so called ”opal belt” and is therefore a strong export agent of biogenic silica. Photo courtesy of Ulrich Freier, AWI,
Bremerhaven
THE TERMS THAT MAKE up the global carbon budget (Fig 3) represent a simplification of a complex reality. While the principal biogeochemical processes occur in all ocean basins, their relative magnitudes, controlling mechanisms and variability differ from one region to the next. JGOFS investigators have studied the components and fl uxes of complex food
webs that make up the biological pump and the physical factors and climatic events that affect it.
Understanding how these factors infl uence the strength of the biological pump is a major focus of JGOFS research. JGOFS investigators have assessed the spatial and temporal variability of primary production and export fl uxes at regional to global
JGOFS – The Components Of the Ocean Carbon Cycle IGBP SCIENCE No. 2 15
Figure 6
Oceanography From Space
scales by dividing the ocean into “provinces,” within which biogeochemical cycles are considered to be relatively homogeneous.
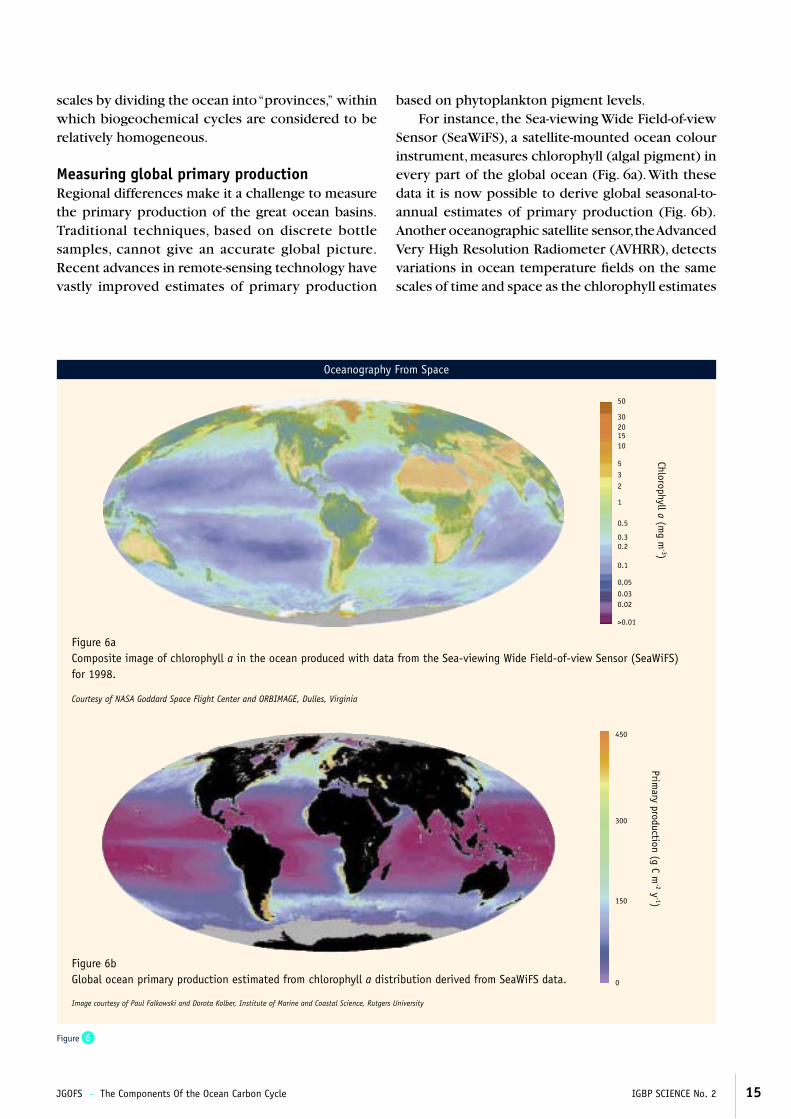
Measuring global primary productionRegional differences make it a challenge to measure the primary production of the great ocean basins. Traditional techniques, based on discrete bottle samples, cannot give an accurate global picture. Recent advances in remote-sensing technology have vastly improved estimates of primary production
Figure 6aComposite image of chlorophyll a in the ocean produced with data from the Sea-viewing Wide Field-of-view Sensor (SeaWiFS) for 1998.
Courtesy of NASA Goddard Space Flight Center and ORBIMAGE, Dulles, Virginia
Chlorophyll a (mg m
-3)
50
3020
10
5
15
32
1
0.1
0.30.2
0.5
0.05
0.02
>0.01
0.03
Primary production (g C m
-2 y-1)
450
300
150
0
Figure 6bGlobal ocean primary production estimated from chlorophyll a distribution derived from SeaWiFS data.
Image courtesy of Paul Falkowski and Dorota Kolber, Institute of Marine and Coastal Science, Rutgers University
based on phytoplankton pigment levels. For instance, the Sea-viewing Wide Field-of-view
Sensor (SeaWiFS), a satellite-mounted ocean colour instrument, measures chlorophyll (algal pigment) in every part of the global ocean (Fig. 6a). With these data it is now possible to derive global seasonal-to-annual estimates of primary production (Fig. 6b). Another oceanographic satellite sensor, the Advanced Very High Resolution Radiometer (AVHRR), detects variations in ocean temperature fi elds on the same scales of time and space as the chlorophyll estimates
16 IGBP SCIENCE No. 2 JGOFS – The Components Of the Ocean Carbon Cycle
Figure 8
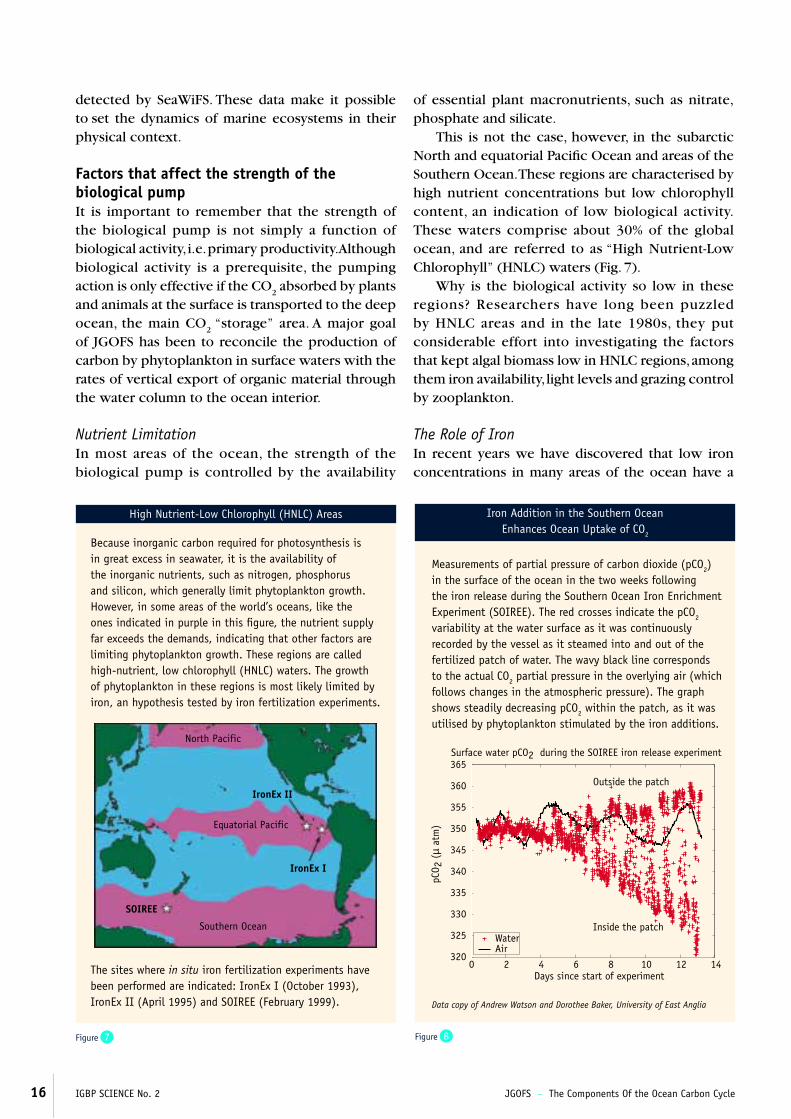
Iron Addition in the Southern Ocean Enhances Ocean Uptake of CO2
Figure 7
High Nutrient-Low Chlorophyll (HNLC) Areas
0 2 4 6 8 10 12 14320
325
330
335
340
345
350
355
360
365
Days since start of experiment
pCO 2
(µ
atm
)
Surface water pCO2 during the SOIREE iron release experiment
Outside the patch
Inside the patchWaterAir
of essential plant macronutrients, such as nitrate, phosphate and silicate.
This is not the case, however, in the subarctic North and equatorial Pacifi c Ocean and areas of the Southern Ocean. These regions are characterised by high nutrient concentrations but low chlorophyll content, an indication of low biological activity. These waters comprise about 30% of the global ocean, and are referred to as “High Nutrient-Low Chlorophyll” (HNLC) waters (Fig. 7).
Why is the biological activity so low in these regions? Researchers have long been puzzled by HNLC areas and in the late 1980s, they put considerable effort into investigating the factors that kept algal biomass low in HNLC regions, among them iron availability, light levels and grazing control by zooplankton.
The Role of IronIn recent years we have discovered that low iron concentrations in many areas of the ocean have a
Data copy of Andrew Watson and Dorothee Baker, University of East Anglia
Measurements of partial pressure of carbon dioxide (pCO2) in the surface of the ocean in the two weeks following the iron release during the Southern Ocean Iron Enrichment Experiment (SOIREE). The red crosses indicate the pCO2 variability at the water surface as it was continuously recorded by the vessel as it steamed into and out of the fertilized patch of water. The wavy black line corresponds to the actual CO2 partial pressure in the overlying air (which follows changes in the atmospheric pressure). The graph shows steadily decreasing pCO2 within the patch, as it was utilised by phytoplankton stimulated by the iron additions.
detected by SeaWiFS. These data make it possible to
set the dynamics of marine ecosystems in their
physical context.
Factors that affect the strength of the biological pumpIt is important to remember that the strength of the biological pump is not simply a function of biological activity, i.e. primary productivity. Although biological activity is a prerequisite, the pumping action is only effective if the CO
2 absorbed by plants
and animals at the surface is transported to the deep ocean, the main CO
2 “storage” area. A major goal
of JGOFS has been to reconcile the production of carbon by phytoplankton in surface waters with the rates of vertical export of organic material through the water column to the ocean interior.
Nutrient LimitationIn most areas of the ocean, the strength of the biological pump is controlled by the availability
IronEx I
IronEx II
SOIREE
Equatorial Pacific
Southern Ocean
North Pacific
Because inorganic carbon required for photosynthesis is in great excess in seawater, it is the availability of the inorganic nutrients, such as nitrogen, phosphorus and silicon, which generally limit phytoplankton growth. However, in some areas of the world’s oceans, like the ones indicated in purple in this fi gure, the nutrient supply far exceeds the demands, indicating that other factors are limiting phytoplankton growth. These regions are called high-nutrient, low chlorophyll (HNLC) waters. The growth of phytoplankton in these regions is most likely limited by iron, an hypothesis tested by iron fertilization experiments.
The sites where in situ iron fertilization experiments have been performed are indicated: IronEx I (October 1993), IronEx II (April 1995) and SOIREE (February 1999).
JGOFS – The Components Of the Ocean Carbon Cycle IGBP SCIENCE No. 2 17
Figure 9
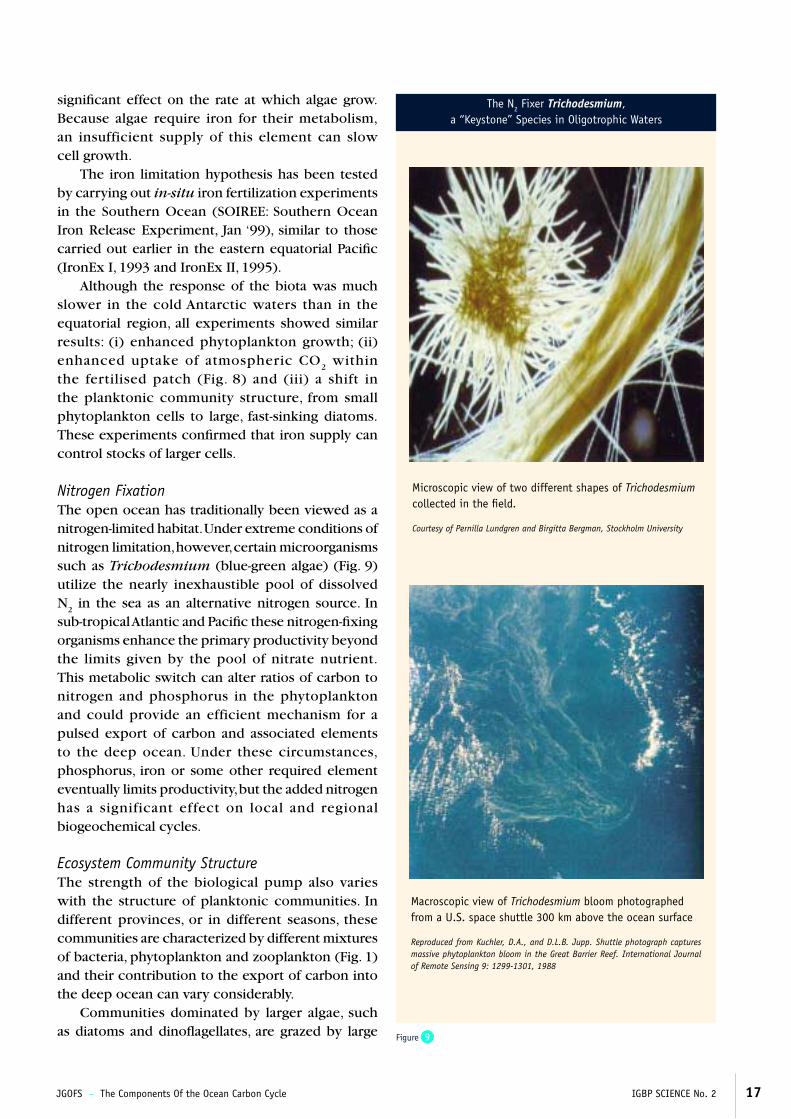
The N2 Fixer Trichodesmium, a “Keystone” Species in Oligotrophic Waters
signifi cant effect on the rate at which algae grow. Because algae require iron for their metabolism, an insufficient supply of this element can slow cell growth.
The iron limitation hypothesis has been tested by carrying out in-situ iron fertilization experiments in the Southern Ocean (SOIREE: Southern Ocean Iron Release Experiment, Jan ‘99), similar to those carried out earlier in the eastern equatorial Pacifi c (IronEx I, 1993 and IronEx II, 1995).
Although the response of the biota was much slower in the cold Antarctic waters than in the equatorial region, all experiments showed similar results: (i) enhanced phytoplankton growth; (ii) enhanced uptake of atmospheric CO
2 within
the fertilised patch (Fig. 8) and (iii) a shift in the planktonic community structure, from small phytoplankton cells to large, fast-sinking diatoms. These experiments confi rmed that iron supply can control stocks of larger cells.
Nitrogen FixationThe open ocean has traditionally been viewed as a nitrogen-limited habitat. Under extreme conditions of nitrogen limitation, however, certain microorganisms such as Trichodesmium (blue-green algae) (Fig. 9) utilize the nearly inexhaustible pool of dissolved N
2 in the sea as an alternative nitrogen source. In
sub-tropical Atlantic and Pacifi c these nitrogen-fi xing organisms enhance the primary productivity beyond the limits given by the pool of nitrate nutrient. This metabolic switch can alter ratios of carbon to nitrogen and phosphorus in the phytoplankton and could provide an efficient mechanism for a pulsed export of carbon and associated elements to the deep ocean. Under these circumstances, phosphorus, iron or some other required element eventually limits productivity, but the added nitrogen has a significant effect on local and regional biogeochemical cycles.
Ecosystem Community StructureThe strength of the biological pump also varies with the structure of planktonic communities. In different provinces, or in different seasons, these communities are characterized by different mixtures of bacteria, phytoplankton and zooplankton (Fig. 1) and their contribution to the export of carbon into the deep ocean can vary considerably.
Communities dominated by larger algae, such as diatoms and dinofl agellates, are grazed by large
Microscopic view of two different shapes of Trichodesmium collected in the fi eld.
Courtesy of Pernilla Lundgren and Birgitta Bergman, Stockholm University
Macroscopic view of Trichodesmium bloom photographed from a U.S. space shuttle 300 km above the ocean surface
Reproduced from Kuchler, D.A., and D.L.B. Jupp. Shuttle photograph captures massive phytoplankton bloom in the Great Barrier Reef. International Journal of Remote Sensing 9: 1299-1301, 1988
18 IGBP SCIENCE No. 2 JGOFS – The Components Of the Ocean Carbon Cycle
Figure 10
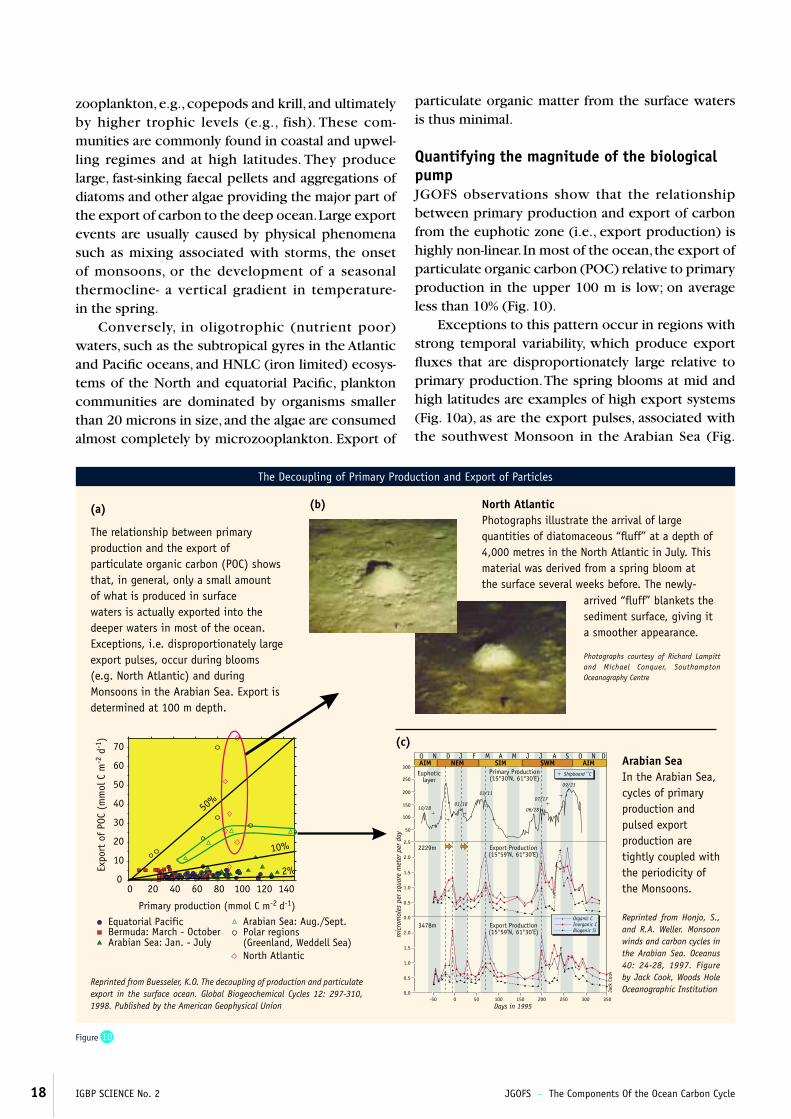
The Decoupling of Primary Production and Export of Particles
North AtlanticPhotographs illustrate the arrival of large quantities of diatomaceous “fl uff” at a depth of 4,000 metres in the North Atlantic in July. This material was derived from a spring bloom at the surface several weeks before. The newly-
Arabian SeaIn the Arabian Sea, cycles of primary production and pulsed export production are tightly coupled with the periodicity of the Monsoons.
Reprinted from Honjo, S., and R.A. Weller. Monsoon winds and carbon cycles in the Arabian Sea. Oceanus 40: 24-28, 1997. Figure by Jack Cook, Woods Hole Oceanographic Institution
The relationship between primary production and the export of particulate organic carbon (POC) shows that, in general, only a small amount of what is produced in surface waters is actually exported into the deeper waters in most of the ocean. Exceptions, i.e. disproportionately large export pulses, occur during blooms (e.g. North Atlantic) and during Monsoons in the Arabian Sea. Export is determined at 100 m depth.
O N D O N DJ M JM JF AA SAIM NEM SIM SWM AIM
300
250
200
100
50
2.5
2.0
1.5
1.0
0.5
0.0
2.0
1.5
1.0
0.5
0.0
150
-50 500 100 200150 250 300 350
Jack
Coo
k
mic
rom
oles
per
squ
are
met
er p
er d
ay
Euphoticlayer
Primary Production(15°30'N, 61°30'E)
2229m Export Production(15°59'N, 61°30'E)
3478m Export Production(15°59'N, 61°30'E)
Days in 1995
10/2801/18
03/1107/17
06/28
09/23
Organic CInorganic CBiogenic Si
Shipboard 14C
arrived “fl uff” blankets the sediment surface, giving it a smoother appearance.
Photographs courtesy of Richard Lampitt and Michael Conquer, Southampton Oceanography Centre
zooplankton, e.g., copepods and krill, and ultimately by higher trophic levels (e.g., fish). These com-munities are commonly found in coastal and upwel-ling regimes and at high latitudes. They produce large, fast-sinking faecal pellets and aggregations of diatoms and other algae providing the major part of the export of carbon to the deep ocean. Large export events are usually caused by physical phenomena such as mixing associated with storms, the onset of monsoons, or the development of a seasonal thermocline- a vertical gradient in temperature- in the spring.
Conversely, in oligotrophic (nutrient poor) waters, such as the subtropical gyres in the Atlantic and Pacifi c oceans, and HNLC (iron limited) ecosys-tems of the North and equatorial Pacifi c, plankton communities are dominated by organisms smaller than 20 microns in size, and the algae are consumed almost completely by microzooplankton. Export of
particulate organic matter from the surface waters is thus minimal.
Quantifying the magnitude of the biological pumpJGOFS observations show that the relationship between primary production and export of carbon from the euphotic zone (i.e., export production) is highly non-linear. In most of the ocean, the export of particulate organic carbon (POC) relative to primary production in the upper 100 m is low; on average less than 10% (Fig. 10).
Exceptions to this pattern occur in regions with strong temporal variability, which produce export fl uxes that are disproportionately large relative to primary production. The spring blooms at mid and high latitudes are examples of high export systems (Fig. 10a), as are the export pulses, associated with the southwest Monsoon in the Arabian Sea (Fig.
Reprinted from Buesseler, K.O. The decoupling of production and particulate export in the surface ocean. Global Biogeochemical Cycles 12: 297-310, 1998. Published by the American Geophysical Union
(a) (b)
(c)
0 20 40 60 80 100 120 140 0
10
20
30
40
50
60
70
50%
10%
2%
Arabian Sea: Aug./Sept.
North Atlantic
Polar regions (Greenland, Weddell Sea)
Equatorial PacificBermuda: March - October Arabian Sea: Jan. - July
Primary production (mmol C m-2 d-1)
Expo
rt o
f PO
C (m
mol
C m
-2 d
-1)
JGOFS – The Components Of the Ocean Carbon Cycle IGBP SCIENCE No. 2 19
Figure 12
Figure 11
The Biological Pump in the Oligotrophic North Atlantic Exports Dissolved Organic Carbon
Ocean basin export at 100 m export at >= 1000 mEquatorial 2–7% 1%Pacifi c Arabian Sea 20% during 1.7% monsoons, otherwise 5–10% Southern Ocean 30% 3%
Export Relationships
J
J
J
J
J
J
J
J JJJJ
0
0.2
0.4
0.6
0.8
1
1.2
1.4
160 180 200 220 240 260 280 300
Maximum Mixed Layer Depth (m)
Total DOC export
Resident DOC export
Win
ter
Expo
rt (
mol
C m
-2 y
-1)
Dissolved organic carbon (DOC) export and mixed-layer depth. Red symbols represent total DOC export during convective overturn of the water column in the fall.Blue symbols represent resident DOC, which has escaped remineralisation in the upper water column. The blue area between two lines represents the export of fresh DOC, the amount of which depends on the depth of the winter mixed layer.
Redrawn from Hansell, D.A., and C.A. Carlson. Biogeochemistry of total organic carbon and nitrogen in the Sargasso Sea: control by convective overturn. Interpretations of open ocean biogeochemical processes at the U.S. JGOFS Bermuda and Hawaii Time-Series Sites, Deep-Sea Research II (in press)
Sea Floor Oxygen flux (moles O2 m-2 y-1)
longitude
lati
tude
120 180 120 60 0 60 120
60
30
0
30
60
0.80.70.60.50.40.30.20.1
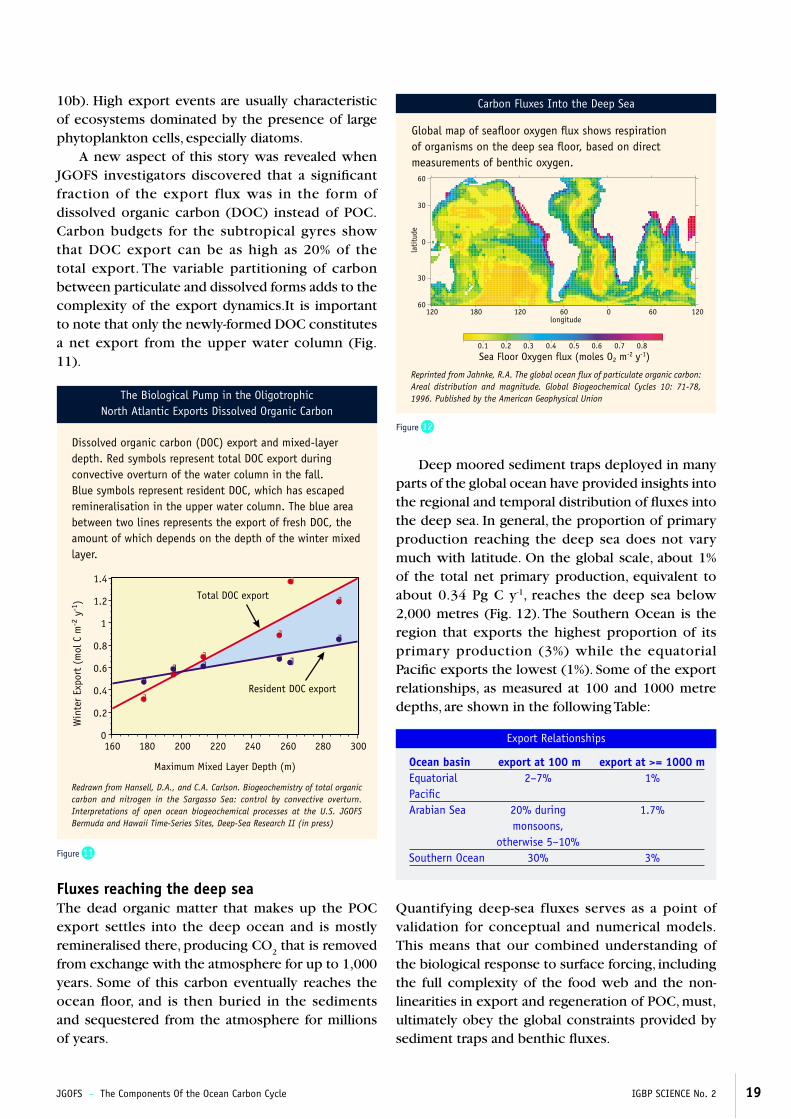
Global map of seafl oor oxygen fl ux shows respiration of organisms on the deep sea fl oor, based on direct measurements of benthic oxygen.
Reprinted from Jahnke, R.A. The global ocean fl ux of particulate organic carbon: Areal distribution and magnitude. Global Biogeochemical Cycles 10: 71-78, 1996. Published by the American Geophysical Union
10b). High export events are usually characteristic of ecosystems dominated by the presence of large phytoplankton cells, especially diatoms.
A new aspect of this story was revealed when JGOFS investigators discovered that a signifi cant fraction of the export flux was in the form of dissolved organic carbon (DOC) instead of POC. Carbon budgets for the subtropical gyres show that DOC export can be as high as 20% of the total export. The variable partitioning of carbon between particulate and dissolved forms adds to the complexity of the export dynamics.It is important to note that only the newly-formed DOC constitutes a net export from the upper water column (Fig. 11).
Fluxes reaching the deep seaThe dead organic matter that makes up the POC export settles into the deep ocean and is mostly remineralised there, producing CO
2 that is removed
from exchange with the atmosphere for up to 1,000 years. Some of this carbon eventually reaches the ocean fl oor, and is then buried in the sediments and sequestered from the atmosphere for millions of years.
Deep moored sediment traps deployed in many parts of the global ocean have provided insights into the regional and temporal distribution of fl uxes into the deep sea. In general, the proportion of primary production reaching the deep sea does not vary much with latitude. On the global scale, about 1% of the total net primary production, equivalent to about 0.34 Pg C y-1, reaches the deep sea below 2,000 metres (Fig. 12). The Southern Ocean is the region that exports the highest proportion of its primary production (3%) while the equatorial Pacifi c exports the lowest (1%). Some of the export relationships, as measured at 100 and 1000 metre depths, are shown in the following Table:
Quantifying deep-sea fluxes serves as a point of validation for conceptual and numerical models. This means that our combined understanding of the biological response to surface forcing, including the full complexity of the food web and the non-linearities in export and regeneration of POC, must, ultimately obey the global constraints provided by sediment traps and benthic fl uxes.
Carbon Fluxes Into the Deep Sea
20 IGBP SCIENCE No. 2 JGOFS – Assessing Changes Over Time
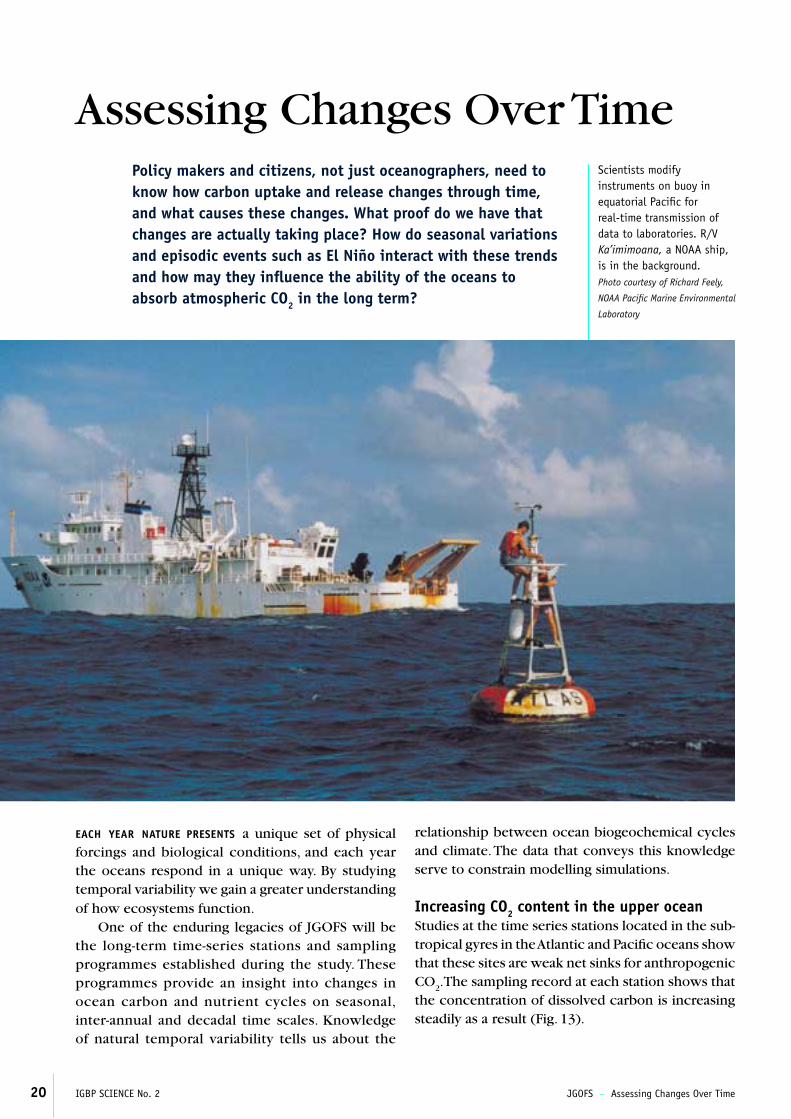
Policy makers and citizens, not just oceanographers, need to know how carbon uptake and release changes through time, and what causes these changes. What proof do we have that changes are actually taking place? How do seasonal variations and episodic events such as El Niño interact with these trends and how may they infl uence the ability of the oceans to absorb atmospheric CO2 in the long term?
Assessing Changes Over TimeScientists modify instruments on buoy in equatorial Pacifi c for real-time transmission of data to laboratories. R/V Ka’imimoana, a NOAA ship, is in the background. Photo courtesy of Richard Feely,
NOAA Pacifi c Marine Environmental
Laboratory
EACH YEAR NATURE PRESENTS a unique set of physical forcings and biological conditions, and each year the oceans respond in a unique way. By studying temporal variability we gain a greater understanding of how ecosystems function.
One of the enduring legacies of JGOFS will be the long-term time-series stations and sampling programmes established during the study. These programmes provide an insight into changes in ocean carbon and nutrient cycles on seasonal, inter-annual and decadal time scales. Knowledge of natural temporal variability tells us about the
relationship between ocean biogeochemical cycles and climate. The data that conveys this knowledge serve to constrain modelling simulations.
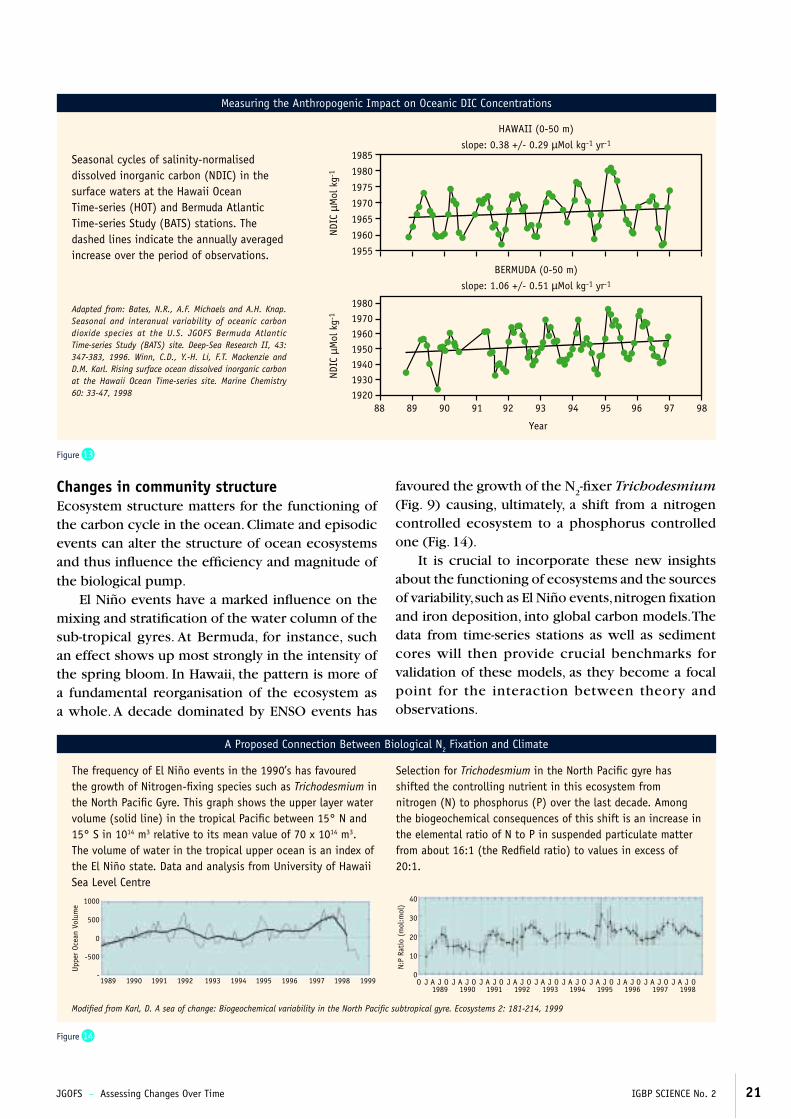
Increasing CO2 content in the upper ocean Studies at the time series stations located in the sub-tropical gyres in the Atlantic and Pacifi c oceans show that these sites are weak net sinks for anthropogenic CO
2. The sampling record at each station shows that
the concentration of dissolved carbon is increasing steadily as a result (Fig. 13).
JGOFS – Assessing Changes Over Time IGBP SCIENCE No. 2 21
Figure 13
Measuring the Anthropogenic Impact on Oceanic DIC Concentrations
88 89 90 91 92 93 94 95 96 97 98
Year
HAWAII (0-50 m)
slope: 0.38 +/- 0.29 µMol kg-1 yr-1
BERMUDA (0-50 m)
slope: 1.06 +/- 0.51 µMol kg-1 yr-1
1985
1980
1975
1970
1965
1960
1955
1980 1970 1960 1950 1940 1930 1920
NDIC
µM
ol k
g-1
NDIC
µM
ol k
g-1
Changes in community structureEcosystem structure matters for the functioning of the carbon cycle in the ocean. Climate and episodic events can alter the structure of ocean ecosystems and thus infl uence the effi ciency and magnitude of the biological pump.
El Niño events have a marked infl uence on the mixing and stratifi cation of the water column of the sub-tropical gyres. At Bermuda, for instance, such an effect shows up most strongly in the intensity of the spring bloom. In Hawaii, the pattern is more of a fundamental reorganisation of the ecosystem as a whole. A decade dominated by ENSO events has
Adapted from: Bates, N.R., A.F. Michaels and A.H. Knap. Seasonal and interanual variability of oceanic carbon dioxide species at the U.S. JGOFS Bermuda Atlantic Time-series Study (BATS) site. Deep-Sea Research II, 43: 347-383, 1996. Winn, C.D., Y.-H. Li, F.T. Mackenzie and D.M. Karl. Rising surface ocean dissolved inorganic carbon at the Hawaii Ocean Time-series site. Marine Chemistry 60: 33-47, 1998
Seasonal cycles of salinity-normalised dissolved inorganic carbon (NDIC) in the surface waters at the Hawaii Ocean Time-series (HOT) and Bermuda Atlantic Time-series Study (BATS) stations. The dashed lines indicate the annually averaged increase over the period of observations.
1989 1990 1991 1992 1993 1994 1995 1996 1997 1998 1999
1000
500
-500
0
-
Upp
er O
cean
Vol
ume
The frequency of El Niño events in the 1990’s has favoured the growth of Nitrogen-fi xing species such as Trichodesmium in the North Pacifi c Gyre. This graph shows the upper layer water volume (solid line) in the tropical Pacifi c between 15° N and 15° S in 1014 m3 relative to its mean value of 70 x 1014 m3. The volume of water in the tropical upper ocean is an index of the El Niño state. Data and analysis from University of Hawaii Sea Level Centre
Selection for Trichodesmium in the North Pacifi c gyre has shifted the controlling nutrient in this ecosystem from nitrogen (N) to phosphorus (P) over the last decade. Among the biogeochemical consequences of this shift is an increase in the elemental ratio of N to P in suspended particulate matter from about 16:1 (the Redfi eld ratio) to values in excess of 20:1.
O J A J O J A J O J A J O J A J O J A J O J A J O J A J O J A J O J A J O J A J O 1989 1990 1991 1992 1993 1994 1995 1996 1997 1998
40
30
10
20
0
N:P
Rati
o (m
ol:m
ol)
Modifi ed from Karl, D. A sea of change: Biogeochemical variability in the North Pacifi c subtropical gyre. Ecosystems 2: 181-214, 1999
favoured the growth of the N2-fi xer Trichodesmium
(Fig. 9) causing, ultimately, a shift from a nitrogen controlled ecosystem to a phosphorus controlled one (Fig. 14).
It is crucial to incorporate these new insights about the functioning of ecosystems and the sources of variability, such as El Niño events, nitrogen fi xation and iron deposition, into global carbon models. The data from time-series stations as well as sediment cores will then provide crucial benchmarks for validation of these models, as they become a focal point for the interaction between theory and observations.
Figure 14
A Proposed Connection Between Biological N2 Fixation and Climate
22 IGBP SCIENCE No. 2 JGOFS – Models and Predictions
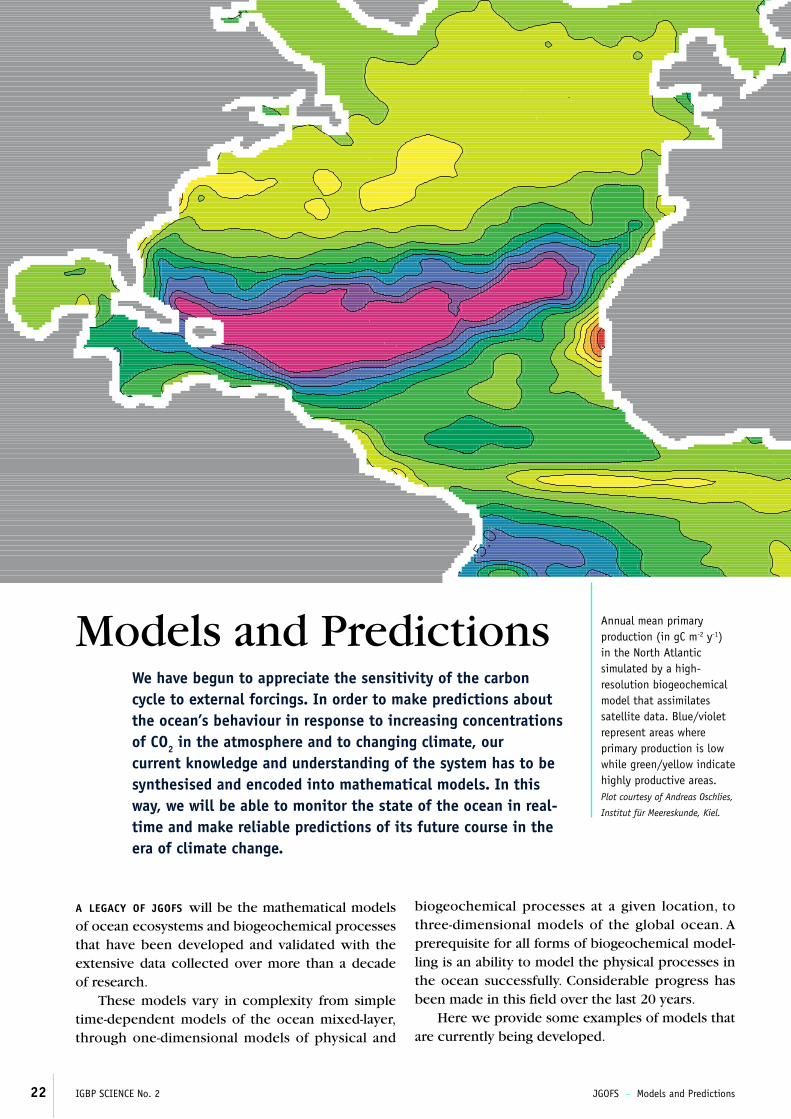
We have begun to appreciate the sensitivity of the carbon cycle to external forcings. In order to make predictions about the ocean’s behaviour in response to increasing concentrations of CO2 in the atmosphere and to changing climate, our current knowledge and understanding of the system has to be synthesised and encoded into mathematical models. In this way, we will be able to monitor the state of the ocean in real-time and make reliable predictions of its future course in the era of climate change.
Models and Predictions Annual mean primary production (in gC m-2 y-1) in the North Atlantic simulated by a high-resolution biogeochemical model that assimilates satellite data. Blue/violet represent areas where primary production is low while green/yellow indicate highly productive areas. Plot courtesy of Andreas Oschlies,
Institut für Meereskunde, Kiel.
A LEGACY OF JGOFS will be the mathematical models of ocean ecosystems and biogeochemical processes that have been developed and validated with the extensive data collected over more than a decade of research.
These models vary in complexity from simple time-dependent models of the ocean mixed-layer, through one-dimensional models of physical and
biogeochemical processes at a given location, to three-dimensional models of the global ocean. A prerequisite for all forms of biogeochemical model-ling is an ability to model the physical processes in the ocean successfully. Considerable progress has been made in this fi eld over the last 20 years.
Here we provide some examples of models that are currently being developed.
JGOFS – Models and Predictions IGBP SCIENCE No. 2 23
Figure 15
Comparing Observations and Modelling Simulations
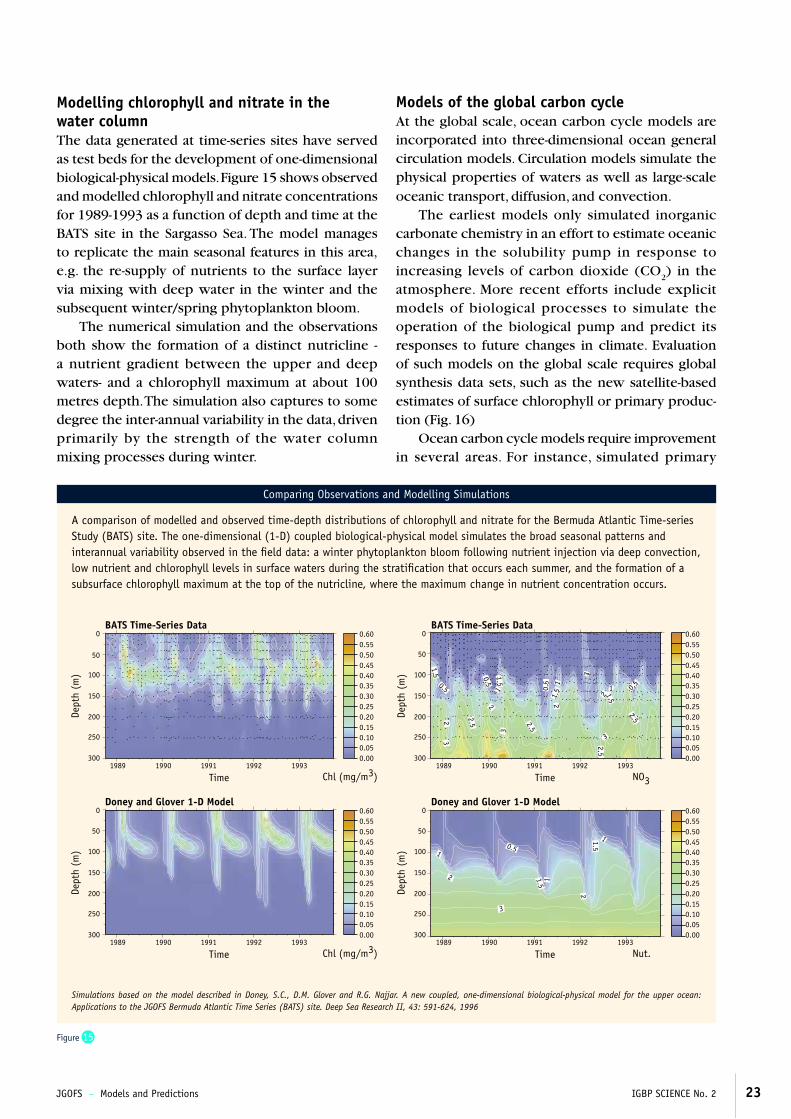
Modelling chlorophyll and nitrate in the water column The data generated at time-series sites have served as test beds for the development of one-dimensional biological-physical models. Figure 15 shows observed and modelled chlorophyll and nitrate concentrations for 1989-1993 as a function of depth and time at the BATS site in the Sargasso Sea. The model manages to replicate the main seasonal features in this area, e.g. the re-supply of nutrients to the surface layer via mixing with deep water in the winter and the subsequent winter/spring phytoplankton bloom.
The numerical simulation and the observations both show the formation of a distinct nutricline - a nutrient gradient between the upper and deep waters- and a chlorophyll maximum at about 100 metres depth. The simulation also captures to some degree the inter-annual variability in the data, driven primarily by the strength of the water column mixing processes during winter.
Models of the global carbon cycleAt the global scale, ocean carbon cycle models are incorporated into three-dimensional ocean general circulation models. Circulation models simulate the physical properties of waters as well as large-scale oceanic transport, diffusion, and convection.
The earliest models only simulated inorganic carbonate chemistry in an effort to estimate oceanic changes in the solubility pump in response to increasing levels of carbon dioxide (CO
2) in the
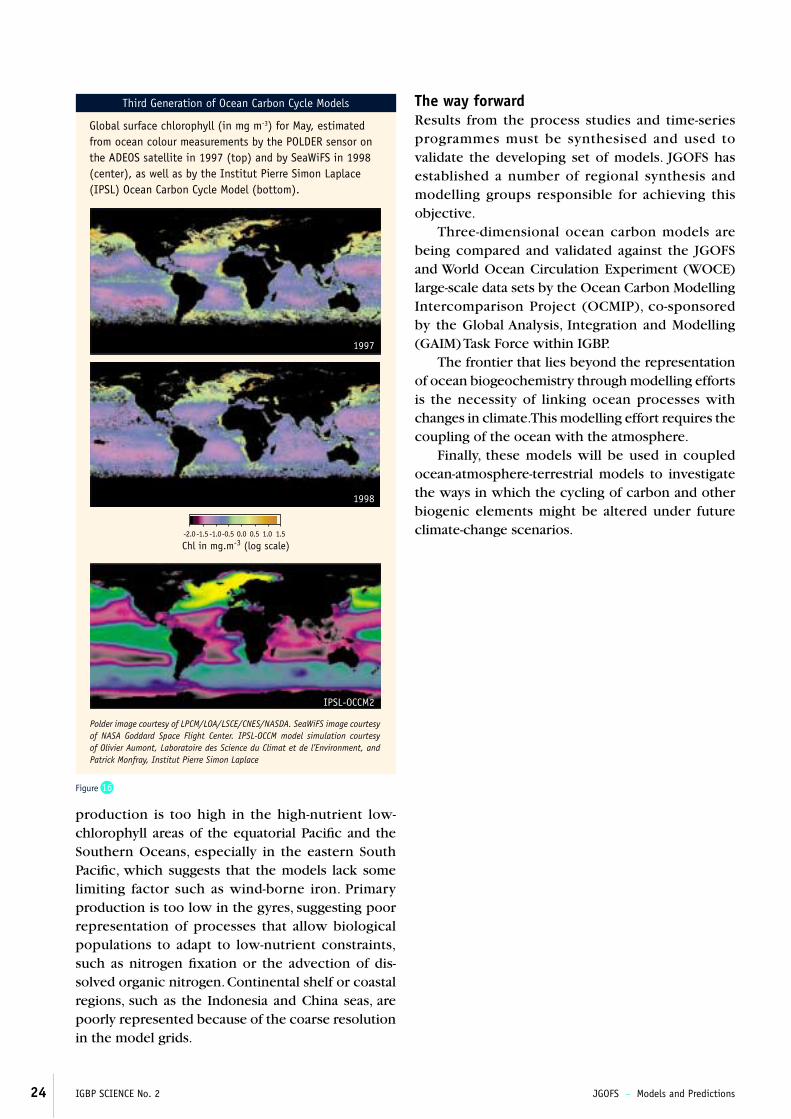
atmosphere. More recent efforts include explicit models of biological processes to simulate the operation of the biological pump and predict its responses to future changes in climate. Evaluation of such models on the global scale requires global synthesis data sets, such as the new satellite-based estimates of surface chlorophyll or primary produc-tion (Fig. 16)
Ocean carbon cycle models require improvement in several areas. For instance, simulated primary
Simulations based on the model described in Doney, S.C., D.M. Glover and R.G. Najjar. A new coupled, one-dimensional biological-physical model for the upper ocean: Applications to the JGOFS Bermuda Atlantic Time Series (BATS) site. Deep Sea Research II, 43: 591-624, 1996
50
50
50
50
BATS Time-Series Data
Chl (mg/m3)Time
Dept
h (m
)
1989 1990 1991 1992 1993300
250
200
150
100
0
0.00
0.30
0.05
0.35
0.10
0.40
0.15
0.45
0.20
0.50
0.25
0.550.60
Doney and Glover 1-D Model
Chl (mg/m3)Time
Dept
h (m
)
1989 1990 1991 1992 1993300
250
200
150
100
0
0.00
0.30
0.05
0.35
0.10
0.40
0.15
0.45
0.20
0.50
0.25
0.550.60
BATS Time-Series Data
NO3 Time
Dept
h (m
)
1989 1990 1991 1992 1993300
250
200
150
100
0
0.00
0.30
0.05
0.35
0.10
0.40
0.15
0.45
0.20
0.50
0.25
0.550.60
Doney and Glover 1-D Model
Nut. Time
Dept
h (m
)
1989 1990 1991 1992 1993300
250
200
150
100
0
0.00
0.30
0.05
0.35
0.10
0.40
0.15
0.45
0.20
0.50
0.25
0.550.60
1.5
1.5
0.5
3
2
12
1
1
1.5
0.5
2.5
1
2
3
3
3
2
2
21
1
1
2.5
2.51.5
1.5
1.5 0.5
0.5
2.5
0.5
A comparison of modelled and observed time-depth distributions of chlorophyll and nitrate for the Bermuda Atlantic Time-series Study (BATS) site. The one-dimensional (1-D) coupled biological-physical model simulates the broad seasonal patterns and interannual variability observed in the fi eld data: a winter phytoplankton bloom following nutrient injection via deep convection, low nutrient and chlorophyll levels in surface waters during the stratifi cation that occurs each summer, and the formation of a subsurface chlorophyll maximum at the top of the nutricline, where the maximum change in nutrient concentration occurs.
24 IGBP SCIENCE No. 2 JGOFS – Models and Predictions
IPSL-OCCM2
1997
1998
Chl in mg.m-3 (log scale)-2.0 -1.0-1.5 -0.5 0.0 1.00.5 1.5
The way forwardResults from the process studies and time-series programmes must be synthesised and used to validate the developing set of models. JGOFS has established a number of regional synthesis and modelling groups responsible for achieving this objective.
Three-dimensional ocean carbon models are being compared and validated against the JGOFS and World Ocean Circulation Experiment (WOCE) large-scale data sets by the Ocean Carbon Modelling Intercomparison Project (OCMIP), co-sponsored by the Global Analysis, Integration and Modelling (GAIM) Task Force within IGBP.
The frontier that lies beyond the representation of ocean biogeochemistry through modelling efforts is the necessity of linking ocean processes with changes in climate. This modelling effort requires the coupling of the ocean with the atmosphere.
Finally, these models will be used in coupled ocean-atmosphere-terrestrial models to investigate the ways in which the cycling of carbon and other biogenic elements might be altered under future climate-change scenarios.
Polder image courtesy of LPCM/LOA/LSCE/CNES/NASDA. SeaWiFS image courtesy of NASA Goddard Space Flight Center. IPSL-OCCM model simulation courtesy of Olivier Aumont, Laboratoire des Science du Climat et de l’Environment, and Patrick Monfray, Institut Pierre Simon Laplace
production is too high in the high-nutrient low-chlorophyll areas of the equatorial Pacifi c and the Southern Oceans, especially in the eastern South Pacifi c, which suggests that the models lack some limiting factor such as wind-borne iron. Primary production is too low in the gyres, suggesting poor representation of processes that allow biological populations to adapt to low-nutrient constraints, such as nitrogen fi xation or the advection of dis-solved organic nitrogen. Continental shelf or coastal regions, such as the Indonesia and China seas, are poorly represented because of the coarse resolution in the model grids.
Global surface chlorophyll (in mg m-3) for May, estimated from ocean colour measurements by the POLDER sensor on the ADEOS satellite in 1997 (top) and by SeaWiFS in 1998 (center), as well as by the Institut Pierre Simon Laplace (IPSL) Ocean Carbon Cycle Model (bottom).
Figure 16
Third Generation of Ocean Carbon Cycle Models
JGOFS – Challenges For the Future IGBP SCIENCE No. 2 25
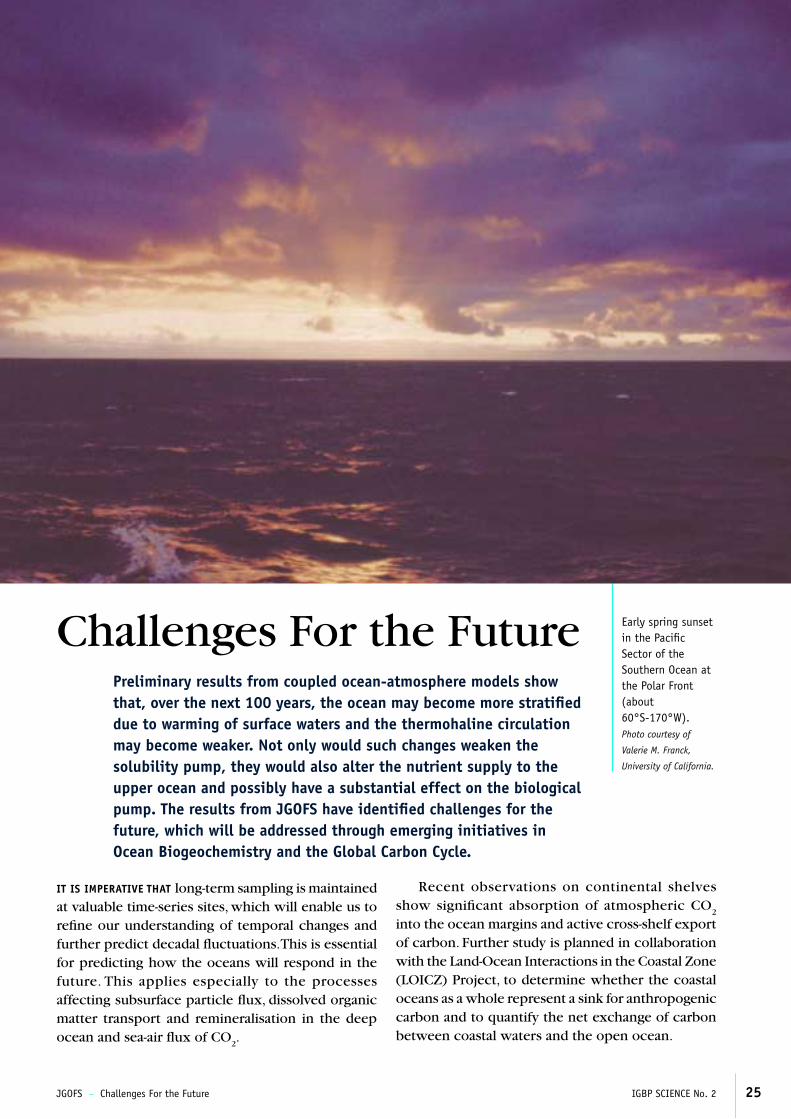
Preliminary results from coupled ocean-atmosphere models show that, over the next 100 years, the ocean may become more stratifi ed due to warming of surface waters and the thermohaline circulation may become weaker. Not only would such changes weaken the solubility pump, they would also alter the nutrient supply to the upper ocean and possibly have a substantial effect on the biological pump. The results from JGOFS have identifi ed challenges for the future, which will be addressed through emerging initiatives in Ocean Biogeochemistry and the Global Carbon Cycle.
Challenges For the Future
IT IS IMPERATIVE THAT long-term sampling is maintained at valuable time-series sites, which will enable us to refi ne our understanding of temporal changes and further predict decadal fl uctuations. This is essential for predicting how the oceans will respond in the future. This applies especially to the processes affecting subsurface particle fl ux, dissolved organic matter transport and remineralisation in the deep ocean and sea-air fl ux of CO
2.
Recent observations on continental shelves show signifi cant absorption of atmospheric CO
2
into the ocean margins and active cross-shelf export of carbon. Further study is planned in collaboration with the Land-Ocean Interactions in the Coastal Zone (LOICZ) Project, to determine whether the coastal oceans as a whole represent a sink for anthropogenic carbon and to quantify the net exchange of carbon between coastal waters and the open ocean.
Early spring sunset in the Pacifi c Sector of the Southern Ocean at the Polar Front (about 60°S-170°W).Photo courtesy of
Valerie M. Franck,
University of California.
26 IGBP SCIENCE No. 2 JGOFS – Challenges For the Future
As discussed earlier, iron availability also infl uen-ces the planktonic community structure. Iron is transported to the oceans from land as atmospheric dust. The amount thus supplied might change if the global warming were to strengthen winds or alter their patterns or if land-use or vegetation change were to alter the sources of dust. Increased iron deposition would change the strength of the biological pump in some HNLC areas and could thus signifi cantly affect the ocean’s capacity to take up CO
2. Also, availability of nitrate or silicate can be
altered if climate changes affect patterns of ocean circulation, i.e. changes in the upwelling of these macronutrients that are essential for the growth of the phytoplankton, the engine of the biological pump.
JGOFS investigations have concentrated on the productive layer in the upper 100-200 metres and on deep ocean sediment fl ux near the sea fl oor. We recognize that most of the decomposition of exported organic matter in the biological pump takes place directly below the illuminated upper layer of the oceans, which extends some 500-1,000 metres in depth. This will be an area of future focus.
Particle export and decomposition are critical processes in the carbon cycle. In order to achieve a predictive understanding of the carbon cycle, mechanistic formulations for particle and dissolved organic matter turnover and transformation will be included in future biogeochemical models.
Changes in the structure and function of marine ecosystems in response to natural and anthropogenic changes in the physical and chemical environment continue to be important issues in the global carbon cycle. These and other issues are being considered for future study by a joint International Geosphere-Biosphere Programme – Scientifi c Committee on Oceanic Research (IGBP-SCOR) planning group, The Future of Ocean Biogeochemistry. Physical processes that operate on the meso-scale affect phytoplankton productivity. Whole ecosystem dynamics is being addressed in collaboration with scientists in the ongoing project, Global Ocean Ecosystem Dynamics (GLOBEC).
It is important that we continue to refi ne our global map of CO
2 fl ux from the oceans. In addition
we need improved models of ocean mixing and circulation, and better predictions of how the physical pump will evolve as climate changes. This will be achieved through better use of autonomous instruments such as floats and buoys and ships
of opportunity. Investigations of the physical and biogeochemical controls on the exchange processes will be addressed in the new Surface Ocean Lower Atmosphere Study (SOLAS).
Paleoclimatological records obtained from the Vostok ice core in Antarctica provide tantalising evidence of an inverse relationship between iron supply to the ocean and atmospheric CO
2 levels
in the past. Cooperative work with the IGBP Core Project PAGES will extend these connections.
The above issues will be addressed by new initiatives in (i) Ocean Biogeochemistry (ii) Surface Ocean Lower Atmosphere Study (SOLAS) and (iii) the Global Carbon Cycle. These initiatives are being developed in an integrative fashion with biogeochemical experts from the International Geosphere-Biosphere Programme (IGBP) working in close collaboration with physical sciences colleagues in the World Climate Research Programme (WCRP) and socio-economic scientists in the International Human Dimensions Programme (IHDP) and the Scientifi c Committee for Ocean Research (SCOR).
JGOFS – About JGOFS IGBP SCIENCE No. 2 27
About JGOFS
Research StrategyThe strategy to achieve JGOFS goals includes observations; synthesis and modelling, and data management (Fig. 17).
ObservationsUp to 20 countries have contributed to a compre-hensive 12-year fi eld program which accomplished over 1,000 cruises in all major ocean basins.
Extensive studies aimed at building global data sets to improve descriptions of biogeochemical variability and inventories of critical elements, elucidate links between physical, geochemical and biological processes, and provide the means for evaluating global-scale modelling results. In cooperation with the World Ocean Circulation Experiment (WOCE), JGOFS completed a global survey of dissolved inorganic carbon (pCO
2, TCO
2,
alkalinity and pH) which has provided an invaluable data set on the distribution of these properties throughout the oceans. Several national programs have already planned future repeat surveys along a subset of the same sections. Repeated sampling along these sections provides valuable information on anthropogenic CO
2 invasion and supports the
development of sophisticated carbon models for the upper ocean. Monitoring surface ocean CO
2
exchange is essential for linking atmosphere-ocean processes and for constraining biogeochemical models of the ocean carbon cycle.
Intensive studies focussed both on a number of large process studies in selected regions and on an array of time series (> 10 years) stations at key sites. These studies help elucidate the mechanisms controlling the carbon cycle in different parts of the world ocean, under different external forcing
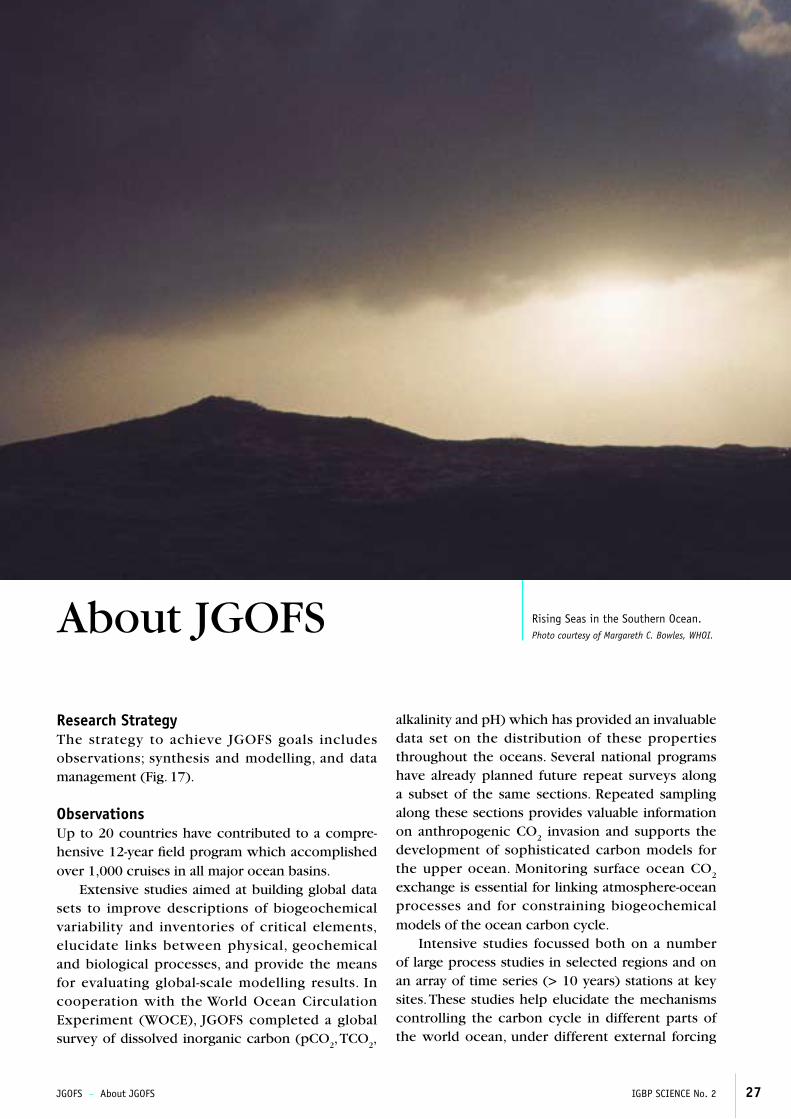
Rising Seas in the Southern Ocean. Photo courtesy of Margareth C. Bowles, WHOI.
28 IGBP SCIENCE No. 2 JGOFS – About JGOFS
Figure 17
Research Strategy
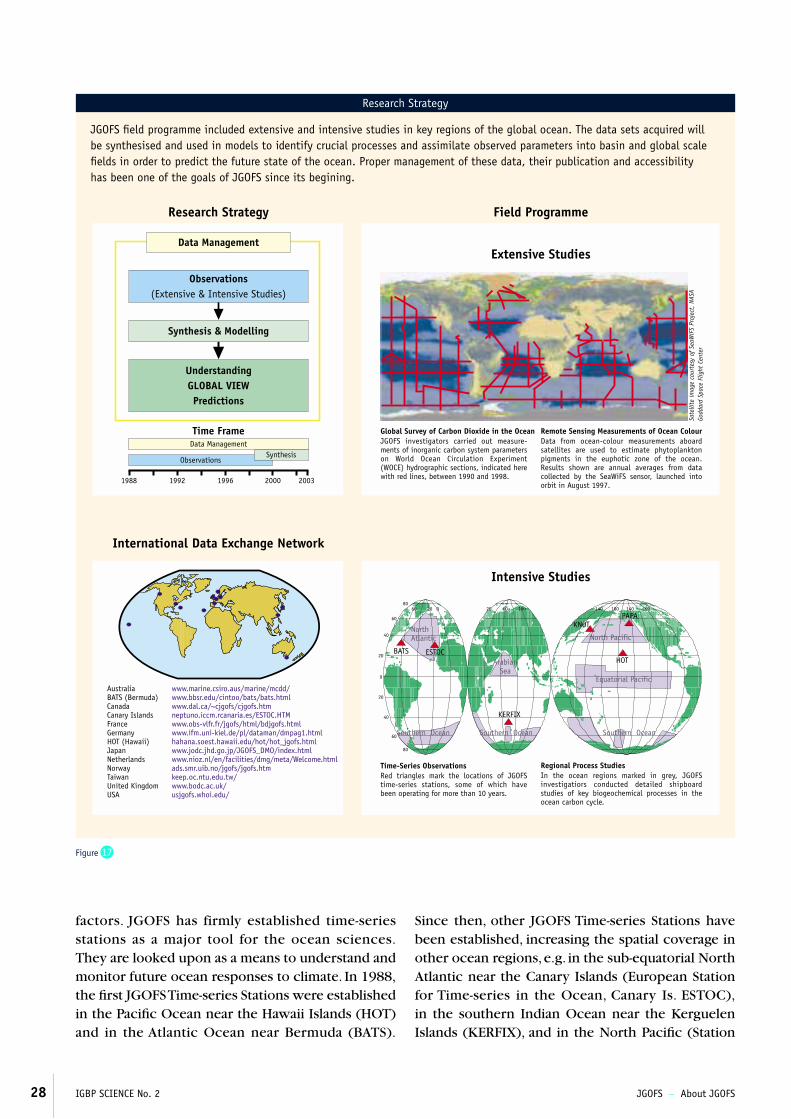
JGOFS fi eld programme included extensive and intensive studies in key regions of the global ocean. The data sets acquired will be synthesised and used in models to identify crucial processes and assimilate observed parameters into basin and global scale fi elds in order to predict the future state of the ocean. Proper management of these data, their publication and accessibility has been one of the goals of JGOFS since its begining.
AustraliaBATS (Bermuda)CanadaCanary IslandsFranceGermanyHOT (Hawaii)JapanNetherlandsNorwayTaiwanUnited KingdomUSA
www.marine.csiro.aus/marine/mcdd/www.bbsr.edu/cintoo/bats/bats.htmlwww.dal.ca/~cjgofs/cjgofs.htmneptuno.iccm.rcanaria.es/ESTOC.HTMwww.obs-vlfr.fr/jgofs/html/bdjgofs.htmlwww.ifm.uni-kiel.de/pl/dataman/dmpag1.htmlhahana.soest.hawaii.edu/hot/hot_jgofs.htmlwww.jodc.jhd.go.jp/JGOFS_DMO/index.htmlwww.nioz.nl/en/facilities/dmg/meta/Welcome.htmlads.smr.uib.no/jgofs/jgofs.htmkeep.oc.ntu.edu.tw/www.bodc.ac.uk/usjgofs.whoi.edu/
International Data Exchange Network
Field ProgrammeResearch Strategy
Time Frame
Data Management
Data Management
UnderstandingGLOBAL VIEWPredictions
ObservationsSynthesis
Observations(Extensive & Intensive Studies)
1988 1992 1996 2000 2003
Extensive Studies
Global Survey of Carbon Dioxide in the OceanJGOFS investigators carried out measure-ments of inorganic carbon system parameters on World Ocean Circulation Experiment (WOCE) hydrographic sections, indicated here with red lines, between 1990 and 1998.
Remote Sensing Measurements of Ocean ColourData from ocean-colour measurements aboard satellites are used to estimate phytoplankton pigments in the euphotic zone of the ocean. Results shown are annual averages from data collected by the SeaWiFS sensor, launched into orbit in August 1997.
Sate
llite
imag
e co
urte
sy o
f Se
aWiF
S Pr
ojec
t, N
ASA
Godd
ard
Spac
e Fl
ight
Cen
ter
Intensive Studies
Time-Series ObservationsRed triangles mark the locations of JGOFS time-series stations, some of which have been operating for more than 10 years.
Regional Process StudiesIn the ocean regions marked in grey, JGOFS investigatiors conducted detailed shipboard studies of key biogeochemical processes in the ocean carbon cycle.
BATS ESTOC
KERFIX
KNOTPAPA
HOT
Equatorial Pacific
Southern OceanSouthern OceanSouthern Ocean
North PacificNorthAtlantic
ArabianSea
80
60
40
20
80
60
40
20
0
60 20 0 6020 100 180140 140 100
Synthesis & Modelling
factors. JGOFS has firmly established time-series stations as a major tool for the ocean sciences. They are looked upon as a means to understand and monitor future ocean responses to climate. In 1988, the fi rst JGOFS Time-series Stations were established in the Pacifi c Ocean near the Hawaii Islands (HOT) and in the Atlantic Ocean near Bermuda (BATS).
Since then, other JGOFS Time-series Stations have been established, increasing the spatial coverage in other ocean regions, e.g. in the sub-equatorial North Atlantic near the Canary Islands (European Station for Time-series in the Ocean, Canary Is. ESTOC), in the southern Indian Ocean near the Kerguelen Islands (KERFIX), and in the North Pacifi c (Station
JGOFS – About JGOFS IGBP SCIENCE No. 2 29
includes Australia, Canada, France, Germany, India, Japan, the United Kingdom and the United States, with links to the Netherlands and Norway.
With support from the JGOFS International Project Office, DMTT members are working to make JGOFS data even more readily available. Their activities include the development of World Wide Web sites which provide electronic access to JGOFS data, the creation of a JGOFS metadata catalogue that facilitates the location of particular data sets, and the electronic publication of data sets in CD-ROMs. The JGOFS DMTT works in conjunction with IGBP-DIS to integrate global change and climate data and make it available to both scientifi c and policy users.
Internationally coordinated activitiesThe JGOFS Scientifi c Steering Committee (SSC) has overall responsibility for the design, implementation, execution and synthesis of each internationally coordinated activity. The SSC, supported by the International Project Office (IPO), define the questions, forms planning and coordinating commit-tees, coordinates observational elements and sets the timetables for each study (Fig. 18). Most studies, however, are supported from internal national sources.
The JGOFS SSC is supported by a number of Planning/Synthesis Groups and Task Teams to consider scientifi c and logistic questions and make recommendations to the SSC. These groups identify the most important processes and variables to study, the regions in which such studies will provide the greatest insight and most useful data, and the best experimental design for the studies. They identify the sequence of events necessary to complete specifi c tasks, the resources required for the tasks and the level of international co-ordination that is required. Some task teams disband after delivering their reports; others are expected to last throughout JGOFS. A new Global Synthesis Working Group will guide the completion of JGOFS synthesis and modelling activities.
National activitiesMuch of JGOFS takes place at the national level, with national committees planning and funding their own programmes, which contribute to JGOFS. Coordination between national and international studies is achieved through the interaction of the SSC with the chairs of national JGOFS groups (Fig. 18).
Papa and the Kyodo North Pacific Ocean Time Series- KNOT- station). Many national programs have recognised the importance of these stations to future global ocean and climate observing systems, and plan to continue operations beyond JGOFS’ lifetime. The continuation of these stations insures the vital acquisition of ocean data on monthly to annual scales for the validation of JGOFS biogeochemical models and global ocean observing systems.
Synthesis & ModellingWith the major field work nearly completed, JGOFS launched the synthesis and modelling phase to identify crucial processes and variables, and assimilate observed parameters into basin and global scale fi elds in order to predict the future state of the ocean. JGOFS has committed to the development of models that can assimilate results from fi eld studies, produce accurate large-scale descriptions of ocean biogeochemical phenomena, and predict oceanic responses to environmental changes. Modelling of ocean ecology and biogeochemistry is in its infancy, yet there are now over a dozen major, 3-dimensional coupled ocean circulation and carbon cycle models. Although their results tend to agree on global, annual totals, they differ widely in details of regional distributions, seasonality, etc. A major effort, the Ocean Carbon Model Intercomparison Project (OCMIP) has been conducted in cooperation with IGBP-GAIM, and aims at understanding the theoretical and numerical as well as scientifi c bases by which global, coupled ocean carbon models differ in their results.
Data ManagementJGOFS research has amassed a biogeochemical data set of unprecedented scope and detail that is yielding new insights into old questions about the role of the ocean in the global cycling of carbon. The development of high-quality, comprehensive data sets that are readily accessible to interested investigators has been among the goals of JGOFS since the programme was first conceived. These data will also be a resource for oceanographers and modellers for decades to come.
Various project centres undertake data manage-ment for national JGOFS programmes; some are national oceanographic data centres, and some are not. The ties that bind the national efforts together come from the JGOFS Data Management Task Team (DMTT). The JGOFS data-exchange network currently
30 IGBP SCIENCE No. 2 JGOFS – About JGOFS
Figure 18
Organisation
and unique resource for teaching ocean science. In addition, JGOFS research is made available for a variety of audiences in the JGOFS Report Series, national reports, invited presentations and posters in conferences and symposia, theses and dissertations and newsletters.
JGOFS Core Measurement ProtocolsData collection and data management are closely linked because part of the task of managing the data set is determining how reliable its elements are. At an early stage of the programme, even though only a few nations and relatively small number of laboratories participated, it soon became clear that experience, capability and personal preferences about measurement protocols varied signifi cantly among participants. Therefore, to enhance data quality, a set of standard, high-quality methods for 20 core measurements was developed, and published in the JGOFS Report Series (Fig. 19). These protocols were developed in consultation with
International Activities
Planning/Synthesis Groups&
Task Teams
Scientific Steering Committee&
International Project Office
National Programmes
Australia, Canada, Chile, China-Beijing, China-Tapei, France, Germany, India, Italy, Japan,
Netherlands, New Zealand, Norway, Pakistan, Russia, South Africa, Spain, Sweden,
United Kingdom, USA
International liaisonsWOCECO2-
Survey
IGBPLOICZ/GAIM/
PAGES/GLOBEC
CLIVAROcean
Observations
IOCCGSeaWiFSOcean Color
GOOS
PICESSCOR/IOCCO2
Advisory Panel
LiaisonsThe boundary exchanges of interest to JGOFS, and global-scale responses to climate change, are affected by non-oceanic systems that are beyond the programme’s scope to study in any detail. Therefore, JGOFS scientists are involved in relevant collaborative studies, e.g. with other IGBP core projects and other international programmes. A joint task team with LOICZ is studying exchanges between the coastal ocean and ocean interior. A new task team works with PAGES to study ocean paleodata. JGOFS also advises the Global Ocean Observing System (GOOS) (Fig. 18).
Scientifi c literatureJGOFS researchers have published over 2,000 research articles in peer reviewed international journals. A substantial part of this literature has appeared in special issues of the journal Deep-Sea Research series entitled “Topical Studies in Oceano-graphy” (Fig. 19). This series forms an invaluable
The Scientifi c Steering Committee and the International Project Offi cecoordinate JGOFS international and national activities as well as thecollaborative work with other international programmes.
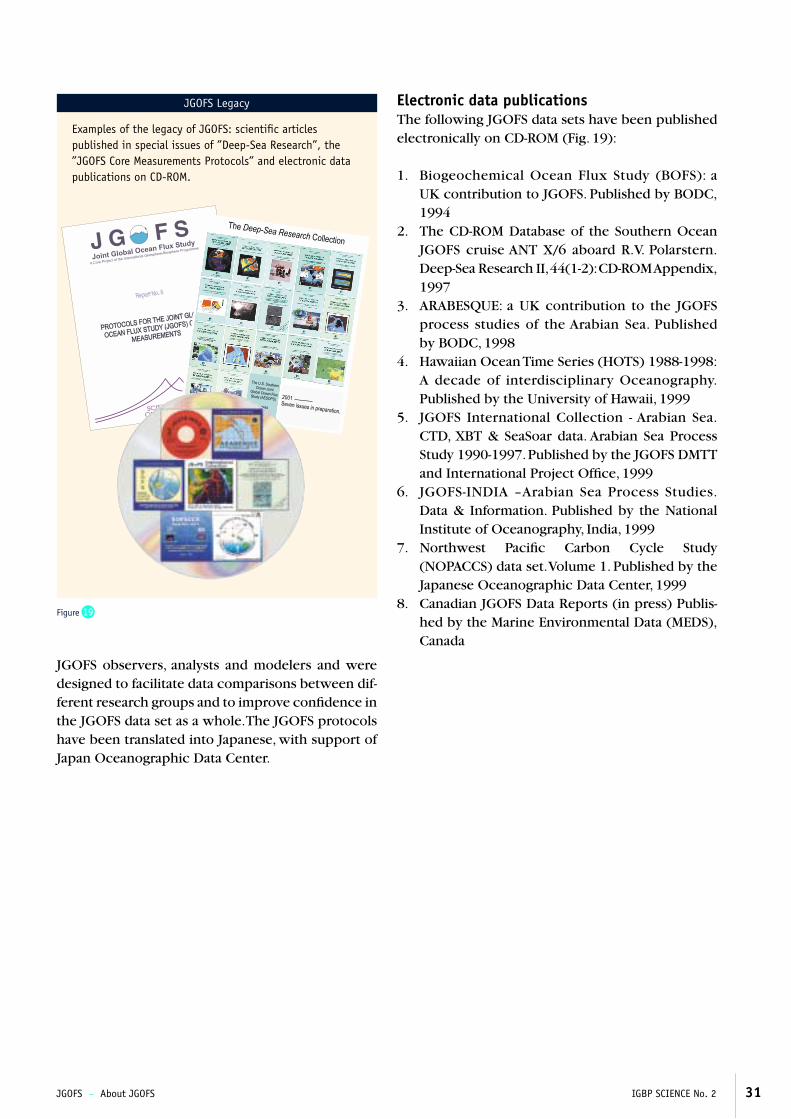
JGOFS – About JGOFS IGBP SCIENCE No. 2 31
Figure 19
Electronic data publicationsThe following JGOFS data sets have been published electronically on CD-ROM (Fig. 19):
1. Biogeochemical Ocean Flux Study (BOFS): a UK contribution to JGOFS. Published by BODC, 1994
2. The CD-ROM Database of the Southern Ocean JGOFS cruise ANT X/6 aboard R.V. Polarstern. Deep-Sea Research II, 44(1-2): CD-ROM Appendix, 1997
3. ARABESQUE: a UK contribution to the JGOFS process studies of the Arabian Sea. Published by BODC, 1998
4. Hawaiian Ocean Time Series (HOTS) 1988-1998: A decade of interdisciplinary Oceanography. Published by the University of Hawaii, 1999
5. JGOFS International Collection - Arabian Sea. CTD, XBT & SeaSoar data. Arabian Sea Process Study 1990-1997. Published by the JGOFS DMTT and International Project Offi ce, 1999
6. JGOFS-INDIA –Arabian Sea Process Studies. Data & Information. Published by the National Institute of Oceanography, India, 1999
7. Northwest Pacifi c Carbon Cycle Study (NOPACCS) data set. Volume 1. Published by the Japanese Oceanographic Data Center, 1999
8. Canadian JGOFS Data Reports (in press) Publis-hed by the Marine Environmental Data (MEDS), Canada
Examples of the legacy of JGOFS: scientifi c articles published in special issues of ”Deep-Sea Research”, the ”JGOFS Core Measurements Protocols” and electronic data publications on CD-ROM.
JGOFS observers, analysts and modelers and were designed to facilitate data comparisons between dif-ferent research groups and to improve confi dence in the JGOFS data set as a whole. The JGOFS protocols have been translated into Japanese, with support of Japan Oceanographic Data Center.
JGOFS Legacy
32 IGBP SCIENCE No. 2 JGOFS – References
Boyd, P.W. and P.J. Harrison (eds). 1999. Canadian JGOFS in the NE Subarctic Pacifi c. Deep Sea Research II, Volume 46, Number 11–12
Burkill, P.H. (ed). 1999. ARABESQUE: UK JGOFS Process Studies in the Arabian Sea. Volume 46, Number 3–4
Burkill, P.H., R.F.C. Mantoura and N.J.P. Owens (eds). 1993. Biogeochemical Cycling in the Northwestern Indian Ocean, Deep Sea Research II, Volume 40, Number 3
Ducklow, H.W. and R.P. Harris (eds). 1993. JGOFS: The North Atlantic Bloom Experiment, Deep Sea Research II, Volume 40, Number 1–2
Fasham, M.J., B.M. Baliño and C.M. Bowles (eds). 2001. A new vision of ocean biogeochemistry after a decade of the Joint Global Ocean Flux Study (JGOFS). Ambio special report, No 10, May 2001, 30pp
Gaillard, J.-F. and T. Tréguer (eds). 1997. Antares I: France JGOFS in the Indian Sector of the Southern Ocean; Benthic and Water Column Processes. Deep Sea Research II, Volume 44, Number 5
Hanson, R.B., H.W. Ducklow and J. G. Field (eds). 2000. The changing ocean carbon cycle. IGBP Books Series, Cambridge University Press, UK, 514 pp.
Karl, D.M. and A.F. Michaels (eds). 1995. Ocean Time Series: Results from the Hawaii and Bermuda Research Programs. Deep Sea Research II, Volume 43, Number 2–3
Monaco, A., P.E. Biscaye and P. Laborde (eds). 1999. France-JGOFS/ECOMARGE: The ECOFER (ECOsystem du canyon du cap FERret) Experiment on the Northeast Atlantic Continental Margin. Deep Sea Research II, Volume 46, Number 10
Murray, J.W. (ed). 1995. A U.S. JGOFS Process Study in the Equatorial Pacific, Deep Sea Research II, Volume 42, Number 2–3
Murray, J.W. (ed). 1996. A U.S. JGOFS Process Study in the Equatorial Pacifi c. Part 2. Deep Sea Research II, Volume 43, Number 4–6
Murray, J.W., R. Le Borgne, Y. Dandonneau (eds). 1997. A JGOFS Process Study in the Equatorial Pacifi c. Deep Sea Research II, Volume 44, Number 9–10
Pfannkuche, O. and K. Lochte (eds). 2000). Biogeochemistry of the Deep Arabian Sea. Deep Sea Research II, Volume 47, Number 14
Roy, S. and B. Sundby (eds). 2000. A Canadian JGOFS Process Study in the Gulf of St Lawrence (Canada): Carbon Transformations from Production to Burial. Deep Sea Research II, Volume 47, Number 3–4
Smetacek, V., H.J.W. de Baar, U.V. Bathmann, K. Lochte, M.M. Rutgers van der Loeff (eds). 1996. Ecology and Biogeochemistry of the Antarctic Circumpolar Current during Austral Spring: Southern Ocean JGOFS Cruise Ant X/6 of R.V. Polarstern. Deep Sea Research II, Volume 44, Number 1–2
Smith, S.L. (ed). 1998. The 1994-1996 Arabian Sea Expedition: Oceanic Response to Monsoonal Forcing, Part I. Deep Sea Research II, Volume 45, Number 10–11
Smith, S.L. (ed). 1999. The 1994-1996 Arabian Sea Expedition: Oceanic Response to Monsoonal Forcing, Part 2. Deep Sea Research II, Volume 46, Number 8–9
Smith, S.L. (ed). 2000. The 1994-1996 Arabian Sea Expedition: Oceanic Response to Monsoonal Forcing, Part 3. Deep Sea Research II, Volume 47, Number 7–8
Smith, W. O. Jr and R. F. Anderson (eds). 2001. The US Southern Ocean Joint Global Ocean Flux Study: An Introduction to AESOPS. Deep-Sea Research II. Volume 47, Number 15–16
Turner, D., N. Owens and J. Priddle (eds). 1995. Southern Ocean JGOFS: The U.K. “Sterna” Study in the Bellingshausen Sea. Deep Sea Research II, Volume 42, Number 4–5
Weering, T.C.E. van, W. Helder and P. Schalk (eds). 1997. Netherlands Indian Ocean Program 1992-1993: First Results. Deep Sea Research II, Volume 44, Number 6–7
Wong, G.T.F, Y-H Li, S-Y Chao and Y-C Chung (eds). 2000. Kuroshio Edge Exchange Processes (KEEP) – Interactions between the East China Sea and the Kuroshio. Continental Shelf Research, volume 20, Numbers 4–5.
IGBP SCIENCE No. 2 F u r t he r R e ad i ng
Editors: Beatriz M. Baliño, Michael J.R. Fasham and Margaret C.Bowles
Series Editor: Susannah Eliott (IGBP Secretariat)
Layout: IdéoLuck AB, Stockholm. Cover design by John Bellamy.
Scientific Contributors: David Archer, Robert Anderson, Ulrich Bathmann, PhilipBoyd, Peter Burkill, Alexander Bychkov, Craig Carlson,Chen-Tung Arthur Chen, Scott Doney, Hugh Ducklow,Steven Emerson, Richard Feely, Gene Feldman, VeroniqueGarçon, Roger Hanson, Paul Harrison, Dennis Hansell,Susumu Honjo, David Karl, Catherine Jeandel, Robert LeBorgne, Kon-Kee Liu, Ferial Louanchi, Karin Lochte, RoyLowry, Anthony Michaels, Patrick Monfray, James Murray,Andreas Oschlies, Trevor Platt, Julian Priddle, RenatoQuiñones, Diana Ruiz-Pino, Toshiro Saino, Egil Sakshaug,Graham Shimmield, Sharon Smith, Walker Smith, PaulTréguer, Taro Takahashi, Douglas Wallace, Rik Wanninkhof,Andrew Watson, Jürgen Willebrand, Chi Shing Wong.
JGOFS Sponsors: SCOR, IGBP, National Science Foundation, Research Councilof Norway, University of Bergen
Cover Photos: “The wave” - Rough seas in the Southern Ocean. Photocourtesy of M.C. Bowles, WHOI.
Ship: The research vessel, Polarstern, has participated innumerous JGOFS cruises in the Atlantic and SouthernOceans. Photo courtesy of M. Klages, Alfred Wegener Insti-tute for Polar and Marine Research.
Scientist with children: A JGOFS scientist recruiting futureresearchers. Photo courtesy of D. Karl, University of Hawaii.
People at sea: Deploying sediment traps in the NorthPacific. Photo courtesy of T. Saino, University of Nagoya.
Earth from Space: Photo courtesy of NASA
IGBP Science Series: ISSN 1650-7770Copyright © IGBP 2001
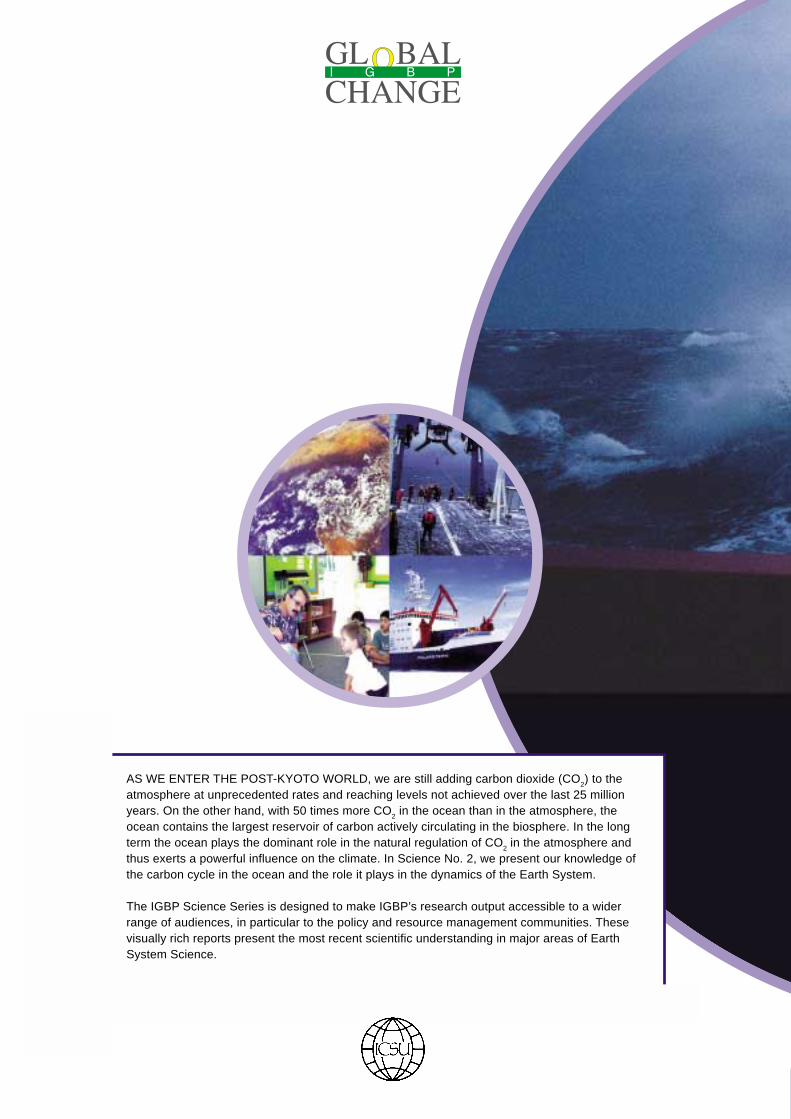
AS WE ENTER THE POST-KYOTO WORLD, we are still adding carbon dioxide (CO2) to theatmosphere at unprecedented rates and reaching levels not achieved over the last 25 millionyears. On the other hand, with 50 times more CO2 in the ocean than in the atmosphere, theocean contains the largest reservoir of carbon actively circulating in the biosphere. In the longterm the ocean plays the dominant role in the natural regulation of CO2 in the atmosphere andthus exerts a powerful influence on the climate. In Science No. 2, we present our knowledge ofthe carbon cycle in the ocean and the role it plays in the dynamics of the Earth System.
The IGBP Science Series is designed to make IGBP’s research output accessible to a widerrange of audiences, in particular to the policy and resource management communities. Thesevisually rich reports present the most recent scientific understanding in major areas of EarthSystem Science.