
Occupational Demands on Fatigue and Driving Safety in ... · Occupational Demands on Fatigue and...
27
Occupational Demands on Fatigue and Driving Safety in Surgical Residents Benjamin McManus, MA Karen Heaton, PhD, FNP-BC, FAAN John R. Porterfield, MD Despina Stavrinos, PhD
Transcript of Occupational Demands on Fatigue and Driving Safety in ... · Occupational Demands on Fatigue and...

Occupational Demands on Fatigue
and Driving Safety in Surgical
ResidentsBenjamin McManus, MA
Karen Heaton, PhD, FNP-BC, FAAN
John R. Porterfield, MD
Despina Stavrinos, PhD


Medical Residents
• Sleep and fatigue commonly reported (Parshuram et al 2015;
Veasey et al, 2002)
• May work duty periods as long as 28 hours (ACGME,
2011)
• Short sleep durations and night shift hours
common (Lockley et al., 2007)

Flexible hours vs. ACGME standard – New
England Journal of Medicine
• No difference in rate of death or serious
complications in patients
• No difference in self-reported frequency at which
resident fatigue affected patient or personal
safety
Bilimoria et al., 2016
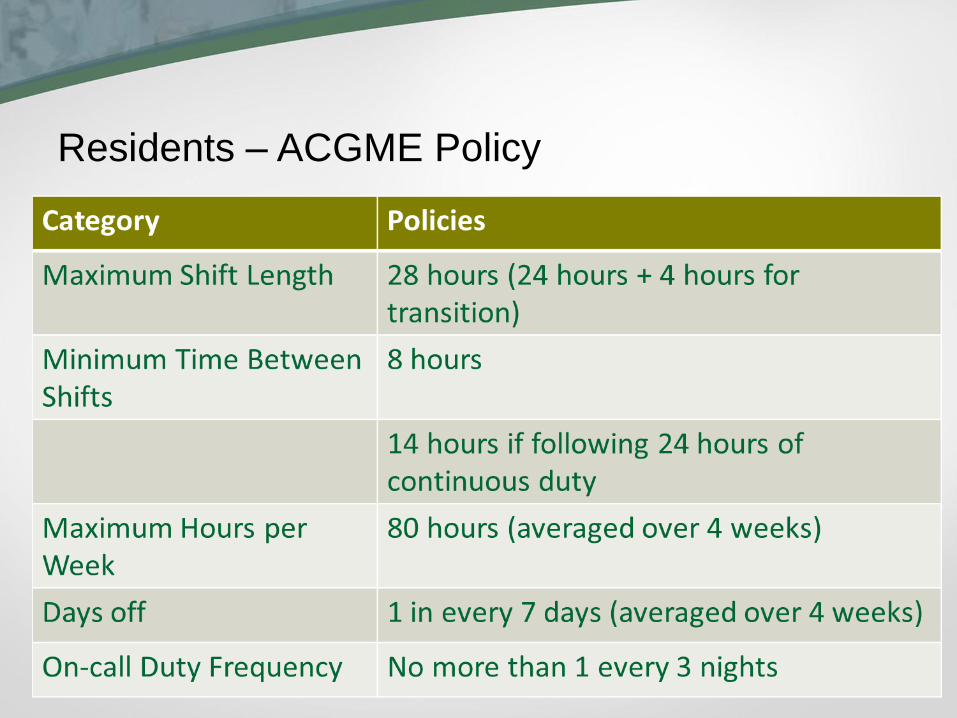
Residents – ACGME Policy

Medical Residents
• Fatigued during nearly half of their time awake
– Post-shift task effectiveness and error risk on
cognitive tasks comparable to functioning with BAC of
0.08 (McCormick et al., 2012)
• Surgical residents’ response times to simple
reaction time task significantly slower post-duty (Talusan et al., 2014)
• Risk of falling asleep while driving or stopped in
traffic significantly higher in 1st year residents
(PGY-1) working 5 extended shifts in a month (Barger et al., 2005)

Sleep and Crash Rates
• Crash Rates (compared to 7 hours of sleep)
– 6-7 hrs = 30% crash rate increase
– 5-6 hrs = 90% crash rate increase
– 4-5 hrs = 130% crash rate increase
– < 4 hrs = 11.5 times crash rate increase
AAA Foundation for Traffic Safety, 2016

Sleepiness and Fatigue
• Reduces activation states and availability of
attentional resources (Recarte & Nunes, 2009)
• Lowered endogenous attention (Trick & Enns, 2009)
– Selective attention
• Deteriorated performance (Gharagozlou et al., 2015)

Method
• 42 residents from surgical programs
– Data collection in progress
• 3 visits
– Off Day
– On Day
• Before Shift
• After Shift

Measures
• Epworth Sleepiness Scale
• Actigraphy watch
• Driving History Questionnaire
• Driver Behavior Questionnaire (DBQ)
• Occupational Fatigue Exhaustion Recovery
• Workplace Stress Scale
• Holmes-Rae Life Stress Inventory
• Cortisol (via saliva)
• Heartrate Variability (HRV)


Simulated Drive
• 3 sections
– Urban
– Residential
– Freeway
• ~ 16 minute drive
• Night
• Ambient traffic

Provisional Results (n = 9)
Variable Mean (SD) n (%) Range
Age (years) 29.72 (2.82) 27 - 34
Gender (male) 7 (78%)
Year in Residency 2.67 (1.27) 1 - 5
Total Sleep Time (hours) 6.42 (1.41) 4.50 – 8.44
Sleep Efficiency (%) 92.39 (5.13) 81.30 – 97.42
Wake After Sleep Onset (minutes) 24.95 (13.25) 9.80 – 51.85

08Feb 09Feb 10Feb 11Feb 12Feb 13Feb 14Feb 15Feb
2017
Day of Week
4
6
8
10
12
Tota
lHours
Avg
Off Day

20Feb 21Feb 22Feb 23Feb 24Feb 25Feb 26Feb 27Feb 28Feb 01Mar 02Mar 03Mar 04Mar
2017
Day of Week
5
10
15
Tota
lHours
Avg
Off Day

5.6
7.67 7.78
0
1
2
3
4
5
6
7
8
9
Off Pre Post
ESS
Tota
l Sco
re
Shift
Sleep Propensity

Sleep Propensity
0
5
10
15
ES
S
PostPreOff

52.9652.67
56.79
50
51
52
53
54
55
56
57
58
Off Pre Post
MP
H
Shift
Velocity

44.38
45.75
51.25
40
42
44
46
48
50
52
Off Pre Post
MP
H
Shift
Residential Velocity

0.366
0.379
0.406
0.34
0.35
0.36
0.37
0.38
0.39
0.4
0.41
Off Pre Post
SD o
f La
ne
Po
siti
on
Shift
Lane Deviations

Work Activity
Variable Mean (SD) Range
Surgeries Performed 1.67 (1.22) 0 - 4
Hours in Surgery 5.33 (2.66) 2 - 8
kcals 883.26 (423.15) 263.01 – 1695.95
Step Counts 7983.06 (2520.14) 2818.50 – 11992.00

Intercorrelations
Surgery Time kcals Steps WASO Efficiency
Total Sleep 0.89** -0.85** -0.67 -0.48 -.45
Efficiency 0.42 -0.12 -0.60 -0.99**
WASO -0.46 0.13 0.59
Steps -0.38 0.75*
kcals -0.59
Surgery Time -
** p < .05* p < .10

Discussion
• Surgical residents are getting less sleep (~ 6
hours) than the amount associated with safe
driving
– 7+ hours (Neri et al., 1997)
– At nearly 30% increased risk (AAA, 2016)
• Inconsistent sleep, inconsistent schedules

08Feb 09Feb 10Feb 11Feb 12Feb 13Feb 14Feb 15Feb
2017
Day of Week
4
6
8
10
12
Tota
lHours
Avg
Off Day

“Fast and Sloppy”
• Sleep deprived individuals often increase speed
in decision making at the expense of committing
more errors (Horowitz et al., 2003; Killgore et al., 2012; McKenna et al., 2007)
– Greater risk taking
• Residents may display “fast and sloppy”
approach to driving post-shift
– Greater velocity, poorer lane maintanence
• Performance high post-shift ?

Limitations
• Data collection in progress – small sample size
• Driving simulation
– Relatively valid replication of real world driving
behaviors (Morgan et al., 2011; Underwood et al., 2011)
• Actigraphy estimates
– Good agreement with polysomnography (Morgenthaler et al., 2007;
Signal et al., 2005)

Acknowledgments
Despina Stavrinos, PhD
Karen Heaton, PhD, FNP-BC, FAAN
John R. Porterfield, MD
Mark Schall, PhD
Brent Ponce, MD
This presentation was supported by Grant# 2T420H008436 from NIOSH. Its contents are solely the
responsibility of the authors and do not necessarily represent the official views of NIOSH


