
OccasiOnal PaPer series - ecb. · PDF fileby an IRC expert group of the ESCB ... in the ECB...
86
OCCASIONAL PAPER SERIES NO 115 / JULY 2010 FINANCIAL STABILITY CHALLENGES IN EU CANDIDATE COUNTRIES FINANCIAL SYSTEMS IN THE AFTERMATH OF THE GLOBAL CRISIS by an IRC expert group of the ESCB
Transcript of OccasiOnal PaPer series - ecb. · PDF fileby an IRC expert group of the ESCB ... in the ECB...

Occas iOnal PaPer ser i e snO 115 / j uly 2010
Financial stability
challenges
in eu candidate
cOuntries
Financial systems
in the aFtermath
OF the glObal
crisis
by an IRC expert group of the ESCB

OCCAS IONAL PAPER SER IESNO 115 / JULY 2010
by an IRC expert
group of the ESCB
FINANCIAL STABILITY CHALLENGES
IN EU CANDIDATE COUNTRIES
FINANCIAL SYSTEMS IN
THE AFTERMATH OF
THE GLOBAL CRISIS 1
1 This paper has been prepared by a group of experts established by the International Relations Committee of the European System of
Central Banks (ESCB). The authors would like to thank the Croatian National Bank, the National Bank of the Republic of Macedonia
and the Central Bank of the Republic of Turkey for their forthright responses to numerous data and information requests,
as well as their readiness to participate in a direct exchange of views on the assessment. Comments from
Dejan Krusec and Ivan Alves, as well as data assistance by Livia Chitu are gratefully acknowledged. The report also
benefited from comments and suggestions by the members of the International Relations Committee.
In 2010 all ECB publications
feature a motif taken from the
€500 banknote.
This paper can be downloaded without charge from http://www.ecb.europa.eu or from the Social Science
Research Network electronic library at http://ssrn.com/abstract_id=1629757.
NOTE: This Occasional Paper should not be reported as representing
the views of the European Central Bank (ECB).
The views expressed are those of the authors
and do not necessarily reflect those of the ECB.

© European Central Bank, 2010
AddressKaiserstrasse 29
60311 Frankfurt am Main, Germany
Postal addressPostfach 16 03 19
60066 Frankfurt am Main, Germany
Telephone+49 69 1344 0
Internethttp://www.ecb.europa.eu
Fax+49 69 1344 6000
All rights reserved.
Any reproduction, publication and reprint in the form of a different publication, whether printed or produced electronically, in whole or in part, is permitted only with the explicit written authorisation of the ECB or the authors.
Information on all of the papers published in the ECB Occasional Paper Series can be found on the ECB’s website, http://www.ecb.europa.eu/pub/scientifi c/ops/date/html/index.en.html
ISSN 1607-1484 (print)
ISSN 1725-6534 (online)

3ECB
Occasional Paper No 115
July 2010
CONTENTS
ABBREVIATION 4
LIST OF AUTHORS 5
ABSTRACT 6
SUMMARY 7
INTRODUCTION 9
1 CROATIA 10
1.1 The macroeconomic environment 10
1.2 The fi nancial system:
structure and developments 13
1.3 Risks and shock-absorbing
capacities 19
1.4 Concluding assessment
and policy implications 25
2 THE FORMER YUGOSLAV REPUBLIC OF
MACEDONIA 28
2.1 The macroeconomic environment 28
2.2 The fi nancial system:
structure and developments 29
2.3 Risks and shock-absorbing
capacities 33
2.4 Concluding assessment
and policy implications 38
3 TURKEY 39
3.1 The macroeconomic environment 39
3.2 The fi nancial system:
structure and developments 40
3.3 Risks and shock-absorbing
capacities 43
3.4 Concluding assessment
and policy implications 49
4 SPECIAL FEATURES 51
4.1 Distribution of major banking
stability indicators across
individual banks in the
candidate countries 51
4.2 Results of macro stress tests
in the candidate countries 53
4.3 Credit quality in candidate
countries 56
4.4 Funding structures of banking
systems 60
4.5 The role of parent banks
in candidate countries 64
4.6 Trends in foreign exchange
loans and deposits 68
4.7 Measures taken to tackle the
implications of the crisis 74
5 CONCLUSIONS 80
REFERENCES 81
EUROPEAN CENTRAL BANK OCCASIONAL
PAPER SERIES SINCE 2009 84
CONTENTS

4ECB
Occasional Paper No 115
July 2010
ATM automated teller machine
BIS Bank for International Settlements
BRSA Banking Regulation and Supervision Agency (Turkey)
CBRT Central Bank of the Republic of Turkey
CEBS Committee of European Banking Supervisors
CNB Croatian National Bank
EBRD European Bank for Reconstruction and Development
EC European Commission
EIB European Investment Bank
ESCB European System of Central Banks
FDI foreign direct investment
FSB Financial Stability Board
GDP gross domestic product
HANFA Croatian Financial Services Supervisory Agency
HBOR Croatian Bank for Reconstruction and Development
IFRS International Financial Reporting Standards
IMF International Monetary Fund
IRC International Relations Committee
MFI monetary fi nancial institution
MoU memorandum of understanding
NBRM National Bank of the Republic of Macedonia
NPL non-performing loan
SAA Stabilisation and Association Agreement
SDIF Savings Deposit Insurance Fund (Turkey)
SME small and medium-sized enterprise
TOKİ Housing Development Administration (Turkey)
ABBREVIATIONS

5ECB
Occasional Paper No 115
July 2010
L IST OF AUTHORS
LIST OF AUTHORS
European Central Bank Mr Thierry Bracke (Chairman); Ms Éva Katalin Polgár
(Secretary); Ms Kristel Buysse; Ms Desislava Rusinova
Nationale Bank van België / Banque Nationale de Belgique Mr Alexandre Francart
Danmarks Nationalbank Mr Jakob Ekholdt Christensen
Deutsche Bundesbank Ms Corinna Knobloch
Bank of Greece Mr Nikolaos Stavrianou
Banque de France Mr Pavel Diev
Banca d’Italia Mr Emidio Cocozza
De Nederlandsche Bank Mr Jon Frost
Oesterreichische Nationalbank Mr Sándor Gardó
Sveriges Riksbank Mr David Farelius

6ECB
Occasional Paper No 115
July 2010
ABSTRACT
This paper reviews fi nancial stability challenges
in the EU candidate countries: Croatia, the
former Yugoslav Republic of Macedonia and
Turkey. It follows a macro-prudential approach,
emphasising systemic risks and the stability of
fi nancial systems as a whole.
The paper recalls that the economies of all three
countries experienced a recession in 2008-09
and shows how this slowed the rapid process
of fi nancial deepening that had been taking
place since the beginning of the last decade.
The deteriorating economic and fi nancial
conditions manifested themselves, fi rst and
foremost, through a marked deterioration in
asset quality. These direct credit risks were
compounded by the transformation of exchange
and interest rate risks through a widespread use
of foreign exchange-denominated or indexed
loans and variable or adjustable interest rate
loans. Moreover, funding and liquidity risks
also materialised to some extent, although fully
fl edged bank runs were avoided, and none of
the countries experienced a sharp reversal in
external fi nancing.
Overall, the deterioration in asset quality
has so far been managed well by the
banking systems of the candidate countries,
facilitated by large capital buffers, pro-active
macro-prudential policies pursued by the
authorities both before and during the crisis and
the relative stability of exchange rates. Looking
ahead, although uncertainties remain high
regarding credit quality, the shock-absorbing
capacities of the banking systems are fairly
robust, as also evidenced by their relative
resilience so far. Nevertheless, as the economic
recovery sets in, the central banks should return
to and possibly reinforce the implementation of
measures to avoid a pro-cyclical build-up of credit
(asset) boom-bust cycles. Furthermore, given
the relevance of foreign-owned banks in two of
the three countries, a continued strengthening of
home-host cooperation in the supervisory area
will be crucial to avoid any kind of regulatory
arbitrage, to enhance the effi ciency of
macro-prudential measures and to provide
authorities with comprehensive information for
planning their actions.
Key words: Europe, banking sector, vulnerability
indicators, macro-prudential approach, emerging
markets
JEL Classifi cation: F32, F41, G21, G28

7ECB
Occasional Paper No 115
July 2010
SUMMARY
SUMMARY
This paper provides an assessment of fi nancial
stability issues in the EU candidate countries:
Croatia, the former Yugoslav Republic of
Macedonia and Turkey. It examines potential
sources of vulnerability from a macroeconomic
perspective as well as fi nancial sector challenges,
highlighting risks pertaining to each country
individually or to the group as a whole.
Over the past two years, the largely
bank-based fi nancial systems of Croatia, the
former Yugoslav Republic of Macedonia and
Turkey have been operating in an increasingly
challenging fi nancial and economic environment.
The candidate countries were barely affected
by the initial global fi nancial turmoil given
their limited exposure to fi nancial assets that
turned “toxic”, but they were severely hit as the
global crisis intensifi ed through a combination
of real, fi nancial and confi dence channels.
The abrupt deterioration in the external
environment, coupled with an unwinding of
some domestic overheating pressures, tipped all
three economies into recession in 2008-09. This
crisis also slowed the rapid process of fi nancial
deepening that had been taking place since the
beginning of the last decade – notwithstanding
considerable differences in the level of economic
development across the countries.
Turning to specifi c risks in the fi nancial sector,
the deteriorating economic and fi nancial
conditions manifested themselves, fi rst and
foremost, through a marked deterioration in
asset quality. These direct credit risks were
compounded by the transformation of exchange
and interest rate risks through a widespread use
of foreign exchange-denominated or indexed
loans and variable or adjustable interest rate
loans. In particular, while credit institutions
have managed to limit currency mismatches,
partly through the successful use of prudential
policies, currency mismatches on the balance
sheets of borrowers represent a risk from a
systemic stability perspective. Nevertheless,
the deterioration in asset quality has so far
been managed well, facilitated by large capital
buffers, pro-active macro-prudential policies
pursued by the authorities both before and after
the crisis and the relative stability of exchange
rates. Moreover, loan loss provisions are high,
particularly in the former Yugoslav Republic
of Macedonia and in Turkey. Looking ahead,
further developments in asset quality will require
close monitoring. Given that asset quality tends
to lag behind the business cycle and that debt
servicing problems may become aggravated as
new loan portfolios start maturing, some further
gradual deterioration in asset quality cannot be
excluded (even though the trend in terms of
non-performing loans in Turkey had started to
revert back to moderate declines already towards
the end of 2009).
A second main risk to fi nancial stability relates
to funding or liquidity risks. Domestic funding
dominates the banking systems of candidate
countries, the bulk of it stemming from deposits
and capital.1 This limits vulnerability to external
liquidity shocks, even though the widespread
deposit-based funding does leave banking
systems exposed to the classical risks of deposit
withdrawals. Such risks partially materialised in
the last quarter of 2008, when deposits declined
in Croatia and in the former Yugoslav Republic
of Macedonia. Confi dence-building measures
by the national authorities, including an increase
in deposit insurance limits in Croatia, and
intensifi ed communication by all central banks,
helped to stem deposit withdrawals and avoid
fully fl edged bank runs, although deposit growth
remains subdued in all three countries to date.
Despite the candidate countries’ heavy reliance
on domestic funding, risks on the external side
are also non-negligible as the external liabilities
of the countries’ banking sectors range between
13% and 20% of total liabilities. These external
funding risks only partially materialised during
the crisis, as none of the countries experienced
a sharp reversal in external fi nancing. In Croatia
Other sources of domestic funding, such as domestic debt 1
securities, are negligible, refl ecting the limited scope for
institutional investors owing to a low level of development
of corporate debt markets, as well as the absence of legal
frameworks for the issuance of covered bonds.

8ECB
Occasional Paper No 115
July 2010
and the former Yugoslav Republic of
Macedonia, external funding is mainly
channelled through foreign-owned banks –
generally headquartered in the European
Union – that hold over 90% of the total assets.
The presence of EU banks was generally
considered to be a stabilising factor for the
banking systems of the western Balkan
economies given that their lending is less
constrained by local shocks, but the crisis
highlighted the potential for bi-directional
spillovers, namely when shocks originating in
the home countries of parent banks might
also adversely affect subsidiaries. However,
the experience so far has confi rmed the strategic
and long-term interest of parent banks in the
region.2 In particular, the share of external
liabilities in total liabilities increased steadily
in Croatia and the former Yugoslav Republic of
Macedonia during the crisis, suggesting that
subsidiaries did not experience severe
funding strains.
Overall, banking systems in the three countries
have weathered the strains in domestic and
international funding sources well. Relatively
high levels of capital contributed to this
resilience. Liquidity risks were also contained
through abundant liquidity provision by central
banks, but a further deterioration in international
liquidity conditions and possible further
balance sheet restructuring in some western
European parent banks could lead to a sudden
deterioration in liquidity conditions for banking
systems in candidate countries. Looking ahead,
if the reduced availability or higher cost of
external fi nancing prevail and domestic savings
remain subdued, increased competition for retail
deposits may raise funding costs and erode
net interest margins in the future, which could
aggravate pressures caused by still fairly robust
but recently deteriorating profi tability.
Prior to the crisis, the central banks in
the candidate countries used pro-active
macro-prudential policies to stem systemic risks
in the fi nancial systems, particularly risks from
high credit growth resulting from the economic
convergence process and the concomitant
large capital infl ows. Central banks in the
candidate countries had limited possibilities
to address these risks by means of traditional
monetary policy instruments. Accordingly,
the three countries resorted to several less
conventional measures to stem credit growth and
to infl uence the structure of loans towards those
denominated in domestic currency. All in all,
the various measures helped limit credit growth
and avert a pro-cyclical emergence of banking
crises in the candidate countries. At the same
time, the measures to some extent displaced
problems out of the banking system into other
segments of the economy (e.g. increased
external indebtedness as companies were
induced to borrow directly from abroad).
As the crisis unfolded, central banks were
able to unwind some of their earlier measures,
thereby contributing to an easing of liquidity
constraints and avoiding signifi cant spillovers
from deteriorating economic conditions into the
fi nancial sector.
Candidate countries benefi ted not only directly from the 2
presence of foreign banks, but also indirectly as a result of
positive spillovers from parent bank commitments made to other
countries in the region within the framework of the European
Bank Coordination Initiative.

9ECB
Occasional Paper No 115
July 2010
INTRODUCTION
INTRODUCTION
This paper reviews fi nancial stability challenges
in Croatia, the former Yugoslav Republic of
Macedonia and Turkey. All three countries enjoy
EU candidate country status, albeit with varying
degrees of progress towards EU membership.
Croatia, an EU candidate country since
June 2004, opened accession negotiations on
3 October 2005. These are now well-advanced.
Accession by 2012 seems to be within reach but
remains crucially dependent on further reforms
to the judicial system and progress in the area
of competition policy, particularly with regard
to the privatisation of the country’s loss-making
shipyards. The former Yugoslav Republic of
Macedonia became a candidate country in
December 2005. In October 2009 the European
Commission recommended starting accession
negotiations with the country, but no start date
has been set thus far. Turkey started EU accession
negotiations on 3 October 2005, having been
recognised as a candidate for EU membership
since 1999. The European Commission started
negotiations on the individual chapters of the
acquis communautaire in June 2006, and one
chapter was provisionally closed in the same
month. In December 2006 the European Council,
owing to the lack of progress in the extension of
the customs union to the EU Member States,
decided to suspend talks on eight out of the
35 chapters as well as against provisionally
closing any other chapters for the time being.
This paper provides an update of ECB (2008)
and complements this earlier paper with a clear
macro-prudential focus, insofar as the emphasis
is on the analysis of fi nancial systems as a
whole. It provides an overview of the structure
of the fi nancial systems in each of the countries
and examines potential sources of vulnerability
from a macroeconomic and fi nancial system
perspective, highlighting common and country-
specifi c risks.3
Given the increasingly challenging fi nancial and
economic environment in which the banking
systems of the candidate countries had to operate
in 2008 and 2009, the rapid process of fi nancial
deepening that had been taking place since
the beginning of the last decade has slowed
considerably in all countries. The paper starts by
examining specifi c risks in the fi nancial sector.
In particular, the deteriorating economic and
fi nancial conditions manifested themselves fi rst
and foremost through a marked deterioration
in asset quality. These direct credit risks were
compounded by the transformation of exchange
and interest rate risks through a widespread use of
foreign exchange-denominated or indexed loans
and variable or adjustable interest rate loans. A
second main risk investigated relates to funding
or liquidity risks. The paper looks into funding
structures and the resulting vulnerabilities thereof.
It also touches on the question of whether the
presence of EU banks via their subsidiaries has
proved to be benefi cial in practice for the banking
systems of the candidate countries. It tries to
assess how the banking systems coped with these
risks as well as the main vulnerabilities to be
monitored in this regard in the future. In addition,
the paper takes a look at macro-prudential policies
used in the candidate countries to stem systemic
risks in fi nancial systems prior to the crisis, as
well as policies and measures taken to alleviate
the impact of the crisis.
The paper has two main parts. The fi rst focuses
on developments in the three individual countries,
where each country section discusses the
macroeconomic environment, reviews structural
developments in the fi nancial system, assesses the
risks and shock-absorbing capacity of the banking
system and provides a concluding assessment.
These country sections are complemented
with special features that cover a number of
overarching themes: (i) the distribution of major
banking stability indicators across individual
banks; (ii) the results of macro stress tests for the
candidate countries; (iii) the quality of assets at
the sectoral level at the turn of the credit cycle;
(iv) the funding structures of banking systems;
(v) the role of parent banks in the candidate
countries; (vi) the trends in terms of foreign
exchange-denominated loans and deposits; and
(vii) measures taken to tackle the crisis.
The cut-off date for this paper is mid-May 2010.3

10ECB
Occasional Paper No 115
July 2010
1 CROATIA
1.1 THE MACROECONOMIC ENVIRONMENT
After the boom years between 2002 and 2007,
which were characterised by buoyant growth in
domestic demand, the Croatian economy saw a
gradual slowdown in economic growth during
2008 on the back of the unfolding global fi nancial
turmoil. The downward trend reached its peak in
the fi rst half of 2009, when the spillovers from
the global crisis fully hit the Croatian economy
and led to the deepest recession since early
transition. The severe economic downturn also
entailed notable changes in the growth pattern:
while domestic demand plummeted as a result of
waning consumer confi dence, tightening credit
conditions, fi scal adjustments and deteriorating
labour market conditions, the contribution of
net exports to GDP growth became markedly
positive, despite the collapse in world trade,
with imports contracting even more strongly
than exports.
Against this backdrop, Croatia’s external
imbalances narrowed considerably in 2009,
with the current account defi cit falling to 5.3%
of GDP, down from 9.3% in 2008 (the highest
level since the mid-1990s). Nevertheless,
fi nancing needs were high, especially in the
fi rst quarter of 2009, when the limited access
to foreign funds, portfolio investment outfl ows
and more moderate foreign direct investment
(FDI) infl ows translated into declining foreign
exchange reserves. However, given the gradually
softening global liquidity conditions, fi nancing
pressures started to ease from the second
quarter of 2009. As a result of falling GDP and
continued (though more moderate) increases
in debt fi nancing, Croatia’s gross foreign debt
increased further and stood at 98.2% of GDP
at the end of 2009 (see Table 1). The increase
refl ected a revival of foreign borrowing by the
corporate sector in the latter part of the year
(which had largely come to a halt at the turn of
2008-09) and two government bond issues on
international fi nancial markets in 2009. At the
same time, reserve accumulation resumed and
by the end of 2009 foreign exchange reserves
had returned to the levels recorded before
the collapse of Lehman Brothers at around
€10 billion (or some 22% of GDP).
The conduct of monetary policy remained
challenging in 2008 and 2009. In the fi rst half
of 2008 the Croatian National Bank’s (CNB)
focus was on containing infl ationary pressures
related to adverse global food and energy price
developments (which drove average infl ation to a
near 15-year high in 2008), as well as on reining in
credit growth driven by banks’ foreign liabilities.
However, the CNB’s priorities quickly changed to
safeguarding exchange rate and fi nancial stability
when the global fi nancial market turmoil gained
Table 1 Croatia: Main macroeconomic indicators
Description 2003 2004 2005 2006 2007 2008 2009 2010 1) 2011 1)
Real GDP growth Percentage period average 5.0 4.2 4.2 4.7 5.5 2.4 -5.8 -0.5 2.0
Infl ation Percentage, period average,
harmonised defi nition 2.4 2.1 3.0 3.3 2.7 5.8 2.2 1.5 3.0
Repo rate Percentage, end of period … … 3.5 3.5 4.1 6.0 … … …
Money market overnight rate Percentage, period average 3.1 5.0 3.0 2.4 5.0 5.9 7.2 … …
Nominal effective exchange rate Index (2001 = 100), period average 102.8 105.0 106.2 107.4 108.1 110.3 108.5 … …
Current account balance Percentage of GDP -6.4 -4.5 -5.6 -7.0 -7.6 -9.3 -5.3 -5.5 -5.9
FDI Percentage of GDP 5.6 1.8 3.5 6.5 8.0 6.8 2.1 3.8 4.1
Gross external debt Percentage of GDP 66.3 70.0 72.1 74.9 76.9 85.1 98.2 … …
General government balance Percentage of GDP -5.1 -3.8 -3.2 -2.2 -1.7 -1.4 -3.5 -3.0 -3.2
General government gross debt 2) Percentage of GDP 35.8 37.8 38.3 35.7 33.1 29.1 33.5 35.9 37.3
Central government balance Percentage of GDP -4.0 -3.2 -2.8 -1.9 -1.3 -1.0 -2.3 -3.0 -3.2
Unemployment rate Percentage, period average 14.2 13.7 12.7 11.2 9.6 8.4 9.1 11.5 11.0
Sources: Eurostat (AMECO), Haver Analytics, IMF, national sources and ECB calculations.1) Forecasts.2) Excluding public guarantees and HBOR debt.

11ECB
Occasional Paper No 115
July 2010
I CROATIA
considerably in depth and intensity following
the demise of Lehman Brothers, and infl ationary
pressures subsided in tandem with the deepening
economic downturn and sharp corrections in
global commodity prices.
In fact, given falling investor and depositor
confi dence in particular (resulting in heavy
stock market losses, increasing risk premia
and temporary deposit withdrawals) and, to a
lesser extent, increased demand for foreign
exchange by the government and corporations
(to repay foreign liabilities), the kuna came
under downward pressure in the last quarter of
2008 and the fi rst quarter of 2009.4 During this
turbulent period, the CNB allowed a moderate
depreciation of the kuna. However, in order to
prevent a more marked weakening, it not only
changed reserve requirement allocation rules,
but also undertook outright market interventions
in favour of the currency.5 Furthermore, to boost
banking sector (foreign currency) liquidity
the CNB also reduced mandatory reserve
requirements, eased foreign currency liquidity
regulations and raised banks’ maximum
permitted open foreign exchange positions
(see Table 2). With a view to moderating
interest rate fl uctuations in interbank markets
and stabilising liquidity supply, at the end
of 2008 the CNB started to hold its regular repo
auctions at a fi xed interest rate of 6% and kept
doing so until mid-October 2009. Driven by
improving global investor sentiment, increased
foreign currency infl ows following Eurobond
issues by the public sector and seasonal factors
(tourism), the kuna began to strengthen again
from the second quarter of 2009 onwards. In the
fi nal quarter of 2009, the CNB even intervened
in foreign exchange markets to prevent a more
marked appreciation of the kuna. With a view
to supporting economic recovery (and in the
absence of infl ationary pressures), the CNB
reduced mandatory reserve requirements further
from 14% to 13% in early 2010.
Headline fi scal balances continued to improve
overall in 2008, but public fi nances increasingly
came under pressure towards the end of 2008 as
economic activity slowed. In order to cope with
the spillovers from the global crisis, in
early 2009 the government adopted a set of ten
anti-recession measures 6 and, in order to
maintain public confi dence in banks, also
quadrupled the level of guaranteed bank deposits
(of natural persons) to HRK 400,000
(approximately €55,000).7 The severity of the
economic downturn and the related revenue
shortfalls also induced a series of budget
revisions in 2009, including expenditure cuts
and revenue-boosting measures, such as the
introduction of a temporary “crisis tax” and an
increase in the main VAT rate. Given the
severity of the economic downturn the general
government budget defi cit still climbed to 3.5%
of GDP in 2009 instead of the originally targeted
0.9% of GDP. Nevertheless, cyclically adjusted
primary budget fi gures from Croatia’s 2009
Pre-accession Economic Programme suggest a
fairly neutral fi scal stance in 2009. To fi nance
the budget defi cit and refi nance maturing public
debt, the government took out a €1 billion loan
from domestic banks in early 2009 and tapped
international fi nancial markets with two
Eurobond issues in May and November 2009,
worth €750 million and USD 1.5 billion
(€1 billion) respectively. Consequently, public
debt levels picked up substantially in 2009, but
still remained relatively low at around 35% of
GDP. During 2008 and 2009 all major rating
agencies revised downward their sovereign
rating outlook for Croatia, but confi rmed the
country’s long-term foreign currency ratings at
pre-crisis levels.8
For an empirical analysis of the determinants of downward 4
exchange pressures, see Box 2 in issue 4 of CNB (2009b).
The fi rst intervention in favour of the kuna took place on 5
27 October 2008 (worth €270.6 million), followed by two
other interventions on 23 January 2009 (€328.3 million) and
18 February 2009 (€184.7 million).
The measures include, inter alia, the revision of the state 6
budget, the fi nancial strengthening of the Croatian Bank for
Reconstruction and Development (HBOR) and support for the
tourism and real estate sectors.
Starting from 1 January 2010 the deposits of legal persons are also 7
guaranteed up to HRK 400,000 (approximately €55,000).
Standard & Poor’s and Fitch revised Croatia’s rating outlook 8
down from stable to negative in October 2008 and May 2009,
respectively, while Moody’s reduced its outlook from positive
to stable in November 2008. All rating agencies have, however,
maintained their sovereign ratings for Croatia at investment
grade levels of BBB, BBB- and Baa3 respectively.

12ECB
Occasional Paper No 115
July 2010
Table 2 CNB measures in the context of the global financial crisis (2008-10) 1)
Monetary policy instrument Date Measure
Interest rates January 2008 Increasing the discount rate by 450 bp to 9.0%.
December 2008As of December 2008 the CNB started to hold regular repo auctions at a fi xed
6% interest rate.
Reserve
requirements
General reserve
requirement
October 2008 Starting from the reserve requirement calculation date of 9 October 2008,
banks’ vault cash will no longer be included in the liquid kuna claims that may
be used to maintain the kuna component of the reserve requirement. With this
move the CNB withdrew some €365 millions from the market.
November 2008 The CNB reduced the banks’ reserve requirement rate from 17% to 14% to
provide additional liquidity to the banking system totalling HRK 8.4 billions
(5.9 billions in kuna and 2.5 billions in foreign exchange). The decision
was applicable as of the reserve requirement calculation period starting on
10 December 2008.
January 2009 To maintain exchange rate stability, i.e. to ease depreciation pressures on the
kuna against the euro, the CNB increased the foreign exchange component
of the reserve requirement to be allocated in kuna from 50% to 75%.
The decision was applicable as of the reserve requirement period starting on
14 January 2009.
February 2010 Reduction of the reserve requirement from 14% to 13% with the aim of
speeding up economic recovery. This move released HRK 2.9 billions of
additional liquidity (2.4 billions in kuna and 0.5 billions in foreign exchange).
Marginal reserve
requirement
October 2008 The CNB suspended the 55% marginal reserve requirement on all commercial
bank borrowing from abroad as of 10 October 2008. Removal of the MRR was
designed to release HRK 3.2 billions in liquidity.
Special reserve
requirement
February 2009 Abolishment of the 55% special reserve requirement on banks’ liabilities
arising from issued securities, releasing additional liquidity of approximately
HRK 10 millions.
Administrative
measures
January 2008 While retaining the annual 12% credit growth ceiling, the rate of purchase of
compulsory CNB bills was increased from 50% to 75% of the loans granted
in excess of the credit ceiling. At the same time, the remuneration rate was
lowered from 0.75% p.a. to 0.25% p.a.
November 2009 Removal of the obligation on banks to subscribe CNB bills at 0.25% interest
rate where credit growth exceeded 12% annually, thereby releasing liquidity
of around HRK 137 millions.
Loan classifi cation
and provisioning
and capital
requirements
January 2008 Introduction of higher capital requirements on banks whose growth rate for
placements exceeded the maximum permissible growth rate for placements
and the introduction of increased risk weights (100%) to placements with
a currency clause extended to clients with no own foreign currency income.
March 2008 A 100% risk weight (instead of 75%) has to be applied on foreign currency
loans and loans with a currency clause fully and completely secured
by mortgages on residential property occupied or let by the borrower now
or in the future (with an unhedged currency position). At the same time,
a 150% risk weight (instead of 125%) was applied to foreign currency claims
and claims with a currency clause not covered by bank deposits or adequate
pledged property (referring to clients with an unhedged currency position).
Bank liquidity March 2008 In the period from 10 March 2008 to 31 May 2008, the banks included in
their foreign currency claims the amount they contributed to the short-term
foreign currency loan granted in March 2008 to the Ministry of Finance of the
Republic of Croatia, totalling €200 millions.
May 2008 Cut in the ratio of banks’ liquid foreign currency claims to foreign currency
liabilities from 32% to 28.5%.
February 2009 On 4 February 2009 the CNB cut the ratio of banks’ liquid foreign currency
claims to foreign currency liabilities from 28.5% to 25% to boost liquidity
and make it easier for the state to borrow at home. This freed up around
€840 millions.
February 2009 On 18 February 2009 the CNB released €1.25 billions to banks by cutting the
ratio of banks’ liquid foreign currency claims to foreign currency liabilities
from 25% to 20%.

13ECB
Occasional Paper No 115
July 2010
I CROATIA
1.2 THE FINANCIAL SYSTEM: STRUCTURE
AND DEVELOPMENTS
THE STRUCTURE OF THE BANKING SYSTEM
No major structural changes took place in the
Croatian banking sector in 2008 or 2009. Over
the two-year period, the total number of banks
increased by one, to 34, following the market
entry of two savings banks 9 and the merger
between Slavonska banka and Hypo
Alpe-Adria-Bank in February 2009 (see Table 3).
The Croatian banking industry continues to be
dominated by foreign ownership. The asset
share of foreign banks remained fairly stable at
around 91% in 2008 and 2009, but the number
of foreign banks decreased by one due to the
aforementioned merger. Austria is the largest
foreign investor, accounting for slightly over
60% of total banking sector assets, followed by
Italy (19.1%), France (7.4%) and Hungary (3.4%).
Despite the large number of banks, the banking
sector is fairly concentrated. The market
share of the four largest banks even increased
slightly further in 2008 and 2009, amounting
to some 65% of total assets by the end of 2009.
Similarly, the Herfi ndahl-Hirschman index
reached 1,367 points in 2009, up from 1,279
in 2007. The large number of small banks
(25 in total), each with a strong regional focus
and a tiny market share, suggests potential for
further market consolidation.
Market penetration of banking services
continued to increase in 2008-09. The number
of operating units rose from 1,191 in 2007
To comply with the 9 acquis communautaire, savings and loan
co-operatives were obliged to convert either into savings banks in
accordance with the Banking Act or into credit unions pursuant
to the new Credit Unions Act adopted in December 2006.
Table 2 CNB measures in the context of the global financial crisis (2008-10) 1) (cont’d)
Monetary policy instrument Date Measure
Open foreign
exchange
positions
February 2009 On 20 February 2009 the CNB increased the maximum permitted open foreign
exchange position for banks from 20% to 30% of own funds, a move designed
to make it easier for banks to dispose of the foreign exchange funds freed up
by reducing the rate of minimum required foreign currency claims for banks
from 25% to 20%.
Source: CNB.1) For an overview of CNB measures in 2000-07 (mainly with a view to reining in lending growth), see ECB (2008).
Table 3 Croatia: structure of the banking sector
2002 2003 2004 2005 2006 2007 2008 2009
EBRD index of banking sector reform 1) 3.7 3.7 4.0 4.0 4.0 4.0 4.0 4.0
Number of banks (foreign-owned) 46 (23) 41 (19) 37 (15) 34 (14) 33 (15) 33 (16) 34 (16) 34 (15)
Number of banks per 100,000 inhabitants 1.04 0.92 0.83 0.77 0.74 0.74 0.77 0.77
Assets of private banks Percentage of total assets 96.0 96.6 96.9 96.6 95.8 95.3 95.5 95.8
Assets of foreign banks Percentage of total assets 90.2 91.0 91.3 91.3 90.8 90.4 90.7 90.9
Assets of the four largest banks Percentage of total assets 58.6 61.6 64.9 64.9 64.0 63.9 64.87 65.15
Herfi ndahl-Hirschmann index 2) 1,237 1,270 1,363 1,359 1,299 1,279 1,311 1,367
Sources: CNB and EBRD.1) Reform progress ranges from 1 (little progress beyond the establishment of a two-tier system) to 4+ (standards and performance norms of advanced industrial economies). 2) Sum of the squared asset shares of individual banks. The index ranges between 0 and 10,000. Below 1,000 it suggests a non-concentrated sector; above 1,800 it is highly concentrated.

14ECB
Occasional Paper No 115
July 2010
to 1,299 by the end of 2009, and the number of
ATMs grew by some 600 to 3,601 over the same
period. Network expansion went hand in hand
with a continued rise in staff levels until the end
of 2008, when employment in the sector reached
22,027. However, a less conducive economic
environment and the unfolding lower demand
for banking services seem to have initiated staff
reductions in the second half of 2009, with the
number of employees falling to 21,673 by the
end of 2009.
According to the EBRD’s banking reform index,
the Croatian banking sector exhibits
well-developed institutional standards and
performance norms. In contrast to some other
transition economies, Croatia was able to
maintain its EBRD ranking during the crisis
years 2008 and 2009, at a level above even those
of many central, eastern and south-eastern
European EU Member States. In 2009 only
Hungary and Estonia had a similarly high
ranking among the EU10.10
THE ASSET AND LIABILITY STRUCTURE
OF THE BANKING SYSTEM
Financial deepening slowed considerably
between 2008 and 2009. Initially, this was
attributable to measures taken by the CNB to
rein in credit growth, while later on deteriorating
economic conditions, the process of global
deleveraging, increasing risk aversion on the
part of banks and lower credit demand from
bank clients played a more prominent role.
Expansion of banking sector assets decelerated
sharply from 13% in 2007 to 2.5% in 2009.
Consequently, increasing fi nancial penetration,
from 109.8% of GDP in 2007 to 114.2% of
GDP by the end of 2009 (see Table 4), should
be seen mainly in the context of sharply falling
GDP levels. Croatia’s fi nancial intermediation
levels continue to rank among the highest in
central, eastern and south-eastern Europe but are
The Czech Republic, which had the same ranking at the end of 10
2007, is no longer given a ranking since the country has ceased
to be an EBRD country of operation.
Table 4 Croatia: asset structure of the banking sector
2002 2003 2004 2005 2006 2007 2008 2009
Commercial bank assets Percentage of GDP 83.6 89.9 93.4 98.5 106.4 109.8 108.1 114.2
Total domestic claims Percentage of total assets 80.6 79.1 77.2 82.7 84.5 84.2 84.3 84.4
Claims on domestic MFIs Percentage of total assets 18.2 18.8 17.6 18.7 18.4 17.9 13.8 14.9
Claims on domestic non-banks Percentage of total assets 62.4 60.4 59.6 64.0 66.1 66.3 70.4 69.6
of which:claims on general government Percentage of total assets 13.2 11.2 9.9 11.6 9.7 9.0 10.6 12.2
claims on domestic households
and enterprises Percentage of total assets 49.2 49.2 49.8 52.4 56.4 57.3 59.9 57.4
of which:claims on domestic enterprises Percentage of total assets 25.4 23.2 22.3 23.1 25.8 25.4 26.6 26.1
claims on domestic households Percentage of total assets 23.8 25.9 27.5 29.3 30.6 31.9 33.3 31.3
Money market fund shares Percentage of total assets 0.0 0.0 0.0 0.0 0.0 0.0 0.0 0.0
External assets Percentage of total assets 14.1 16.5 18.3 13.2 12.6 13.1 12.9 12.6
Claims on domestic households Percentage of total claims
on household and enterprises 48.3 52.7 55.2 55.9 54.3 55.7 55.6 54.5
Loans-to-claims ratio for domestic
nonbanks 82.5 86.5 89.0 88.6 90.8 90.8 91.6 92.9
of which:Loans-to-claims ratio for general
government 29.0 37.4 40.0 42.3 49.0 46.1 55.0 68.2
Loans-to-claims ratio for domestic
households and enterprises 97.1 97.8 98.6 98.9 98.3 98.3 98.7 98.6
Source: CNB.

15ECB
Occasional Paper No 115
July 2010
I CROATIA
still well below the euro area average of almost
340% of GDP (based on the aggregated balance
sheet of other MFIs).
With a share of 57.4% of total assets in 2009,
banking sector assets continued to be dominated
by claims on domestic households and
enterprises. This fi gure was as high as in 2007,
despite the strong slowdown in lending to
both corporations and households in 2008 and
2009. In contrast to most other central, eastern
and south-eastern European economies, the
slowdown in lending was more pronounced in
the retail segment, seemingly the result, inter
alia, of a slump in general-purpose cash loans
and car loans.
The banking sector’s claims on general
government increased during the crisis years
of 2008 and 2009 owing to greater government
borrowing from banks. In particular, given
budgetary fi nancing needs, in early 2009 the
government took out a €1 billion syndicated
loan from a group of six domestic banks,
for which the CNB relaxed liquidity
provisions so that the banks were able to
extend the loan without recourse to additional
external funding. Emerging crowding-out
concerns were, however, alleviated by the
decreasing risk aversion in global fi nancial
markets starting in March 2009 and the two
subsequent Eurobond issues by the government
in 2009, a €200 million World Bank loan in
January 2010, as well as two bond issues on
domestic markets (totalling some €830 million)
in spring 2010.
Banks’ claims on domestic monetary fi nancial
institutions, which mostly consist of deposits
with the CNB, decreased in 2008 and 2009,
largely refl ecting CNB measures to ease reserve
requirements during the most critical periods
of the global fi nancial crisis. These measures
included abolishing the marginal reserve
requirement in October 2008, reducing the
mandatory reserve requirement rate from 17% to
14% in December 2008, suspending the special
reserve requirement in February 2009 and
removing, in November 2009, the obligation for
banks to subscribe to CNB bills in the event of
credit growth exceeding 12% annually, thereby
releasing a total liquidity of some HRK 12 billion
(approximately €1.6 billion).
The share of foreign assets in total bank assets
remained fairly stable over the review period.
Thus, despite high global and local liquidity
pressures, banks did not need to run down
foreign assets on a large scale in an annual
comparison.11 This was underpinned by the fact
that foreign parent banks were on hand to
support their subsidiaries during times of
heightened liquidity pressures. In fact, banks’
external liabilities, which continued to fall in the
context of CNB credit restrictions over the fi rst
three quarters of 2008, increased substantially in
the fi nal quarter of 2008 and helped to
compensate for the decrease in domestic funding
sources related to temporary deposit withdrawals.
Thus, the banks’ net foreign asset position,
which had improved strongly in 2007 on the
back of CNB measures to contain bank lending
based on foreign borrowing,12 again deteriorated
from -4.8% of total assets in 2007 to -7.9%
in 2009.
Banks’ liabilities continue to be dominated
by the deposits of domestic non-banks
(51% of liabilities at the end of 2009), especially
private sector deposits (i.e. households and
enterprises). The solid growth in private sector
deposits before the crisis came to a halt in the
fi nal quarter of 2008, when the population’s
waning confi dence in the banking sector caused
temporary deposit withdrawals. The situation
started to stabilise however in the fi rst quarter
of 2009, and household deposits (mainly in
foreign currency) rose again in particular in the
second half of 2009. In fact, household deposits
It is important to note, however, that the relaxation of the CNB’s 11
foreign currency liquidity regulations in February 2009 (with the
aim of facilitating the government’s fi nancing needs) led to a
temporary recourse to foreign assets in the fi rst quarter of 2009,
which were then gradually built up again during the remainder
of 2009.
IMF estimates of VAR impulse responses suggest that 12
CNB measures (especially the marginal and special reserve
requirements) achieved some success in temporarily reducing
the overall volume of capital infl ows to Croatia. See IMF (2010),
pp.146-148.

16ECB
Occasional Paper No 115
July 2010
in 2009 were up by some 4% on their 2008
levels, as households sharply cut spending in
the light of the negative economic environment,
deteriorating labour market conditions and the
related deterioration in their income position
towards the end of 2009. By contrast, corporate
deposits fell by some 6% on the back of declining
corporate profi tability in 2009, so that, by and
large, total private sector deposits stagnated
during 2009 while their share in total liabilities
fell to slightly below 50% (see Table 5).
The term structure of deposits also changed
during the crisis years, with the share of time
deposits climbing to around 73% of total deposits
by the end of 2009, up from 65% in 2007.
While this development might be partially
explained by the run-down of demand deposits
(mainly for confi dence reasons), it may also
refl ect the above mentioned changes in the
structure of deposits and customers’ attempts
to shift deposits over to longer maturities to
secure higher interest rates, particularly before
the onset of the global cycle of low interest rates
(including the fl attening of the yield curve).
Foreign currency-denominated positions, while
increasing in 2008 and 2009, continued to
dominate the liability side of the banking sector,
accounting for about three-quarters of total
deposits at the end of 2009. This might be
explained by the fact that workers’ remittances
and tourism revenues are largely earned in
foreign currency, but it is also due to confi dence
issues which may have triggered the conversion
of kuna deposits into foreign currency-
denominated deposits, leading to a higher
propensity within the population to save in
foreign currency.13 As bank claims continued to
grow faster than deposits, claim-to-deposit ratios
increased in 2008 and 2009 and remained well
in excess of 100%. The implication of this was a
continued need for fi nancing from abroad.
The Croatian banking sector’s liability structure
also exhibited a strong role for capital and
reserves as a fi nancing item. This role increased
further in 2008 and 2009. In particular, the
share of capital and reserves in total liabilities
was more than twice as high as in the euro area,
for example. The seemingly multiple reasons
for this ranged from higher capital adequacy
requirements in Croatia via presumably higher
risks faced by banks operating in a high growth
environment to widespread foreign ownership,
with foreign banks providing their subsidiaries
For further details see Dvorsky, Scheiber and Stix (2009).13
Table 5 Croatia: liability structure of the banking sector
2002 2003 2004 2005 2006 2007 2008 2009
Deposits of MFIs Percentage of total liabilities 3.2 2.6 2.1 2.9 3.6 5.6 4.3 4.6
Deposits of domestic non-banks Percentage of total liabilities 60.2 56.6 54.9 52.9 52.5 53.3 52.6 51.1
of which:deposits of general government Precentage of total liabilities 2.5 1.8 1.6 1.6 1.4 1.5 1.6 1.1
deposits of households
and enterprises
Precentage of total liabilities
57.7 54.8 53.0 51.1 51.0 51.7 50.9 49.9
Money market fund shares Precentage of total liabilities 0.0 0.0 0.0 0.0 0.0 0.0 0.0 0.0
Debt securities issued Precentage of total liabilities 1.7 1.6 2.7 2.0 1.7 1.4 1.9 1.0
Capital and reserves Precentage of total liabilities 9.5 8.9 8.6 9.0 10.3 12.5 13.5 13.9
External liabilities Precentage of total liabilities 18.5 23.0 24.1 23.9 23.5 17.8 18.9 20.5
Remaining liabilities Precentage of total liabilities 7.0 7.4 7.6 9.3 8.5 9.5 8.8 8.9
Memorandum items:
Domestic non-banks’ claim-to-deposit
ratio 103.7 106.7 108.6 121.1 125.8 124.5 133.9 136.2
General government’s claim-to-deposit
ratio 529.5 620.4 599.7 745.6 703.9 590.6 649.7 1,096.9
Households’ and enterprises’
claim-to-deposit ratio 85.2 89.7 93.8 102.5 110.6 110.9 117.6 114.9
Source: CNB.

17ECB
Occasional Paper No 115
July 2010
I CROATIA
with a portion of fi nancing in the form
of equity.14 The latter element has been especially
important in the case of Croatia, where the high
marginal and special reserve requirements on
banks’ foreign liabilities and issued securities
induced parent banks to fi nance strong credit
growth by boosting the capital positions of
subsidiaries.
BANKING SECTOR PROFITABILITY
Deteriorating economic conditions started to
take a toll on banking profi tability in the fi nal
quarter of 2008, but the full impact materialised
only in 2009. While banks remained profi table
throughout the review period, profi tability
levels declined on the back of less favourable
business conditions and higher provisioning
needs. Consequently, return on average assets
(pre-tax) dropped from 1.6% in 2007 and 2008
(see Table 6) to 1.2% by the end of 2009, while
the decline in return on average equity (after-tax)
to 6.7% was additionally underpinned by the
banks’ attempt to strengthen their capitalisation
(in particular via retained earnings).
Net interest income continued to constitute the
main source of revenue in the banking sector.
Despite increasing interest rate spreads in the
last two years, which were driven by a pick-up
in lending rates, interest income grew only
moderately in 2009 given tighter supply-side
credit conditions based on the increased risk
aversion of banks and more subdued credit
demand. Interest expenses grew more strongly,
however, most likely owing to the more
widespread use of longer-term, fi xed interest rate
deposit contracts. Therefore, in 2009 net interest
income decreased not only in absolute terms,
but also as a share of total operating income.
At the same time, net non-interest income
increased considerably in both absolute and
relative terms. In this context, net income from
fees and commissions remained fairly stable,
but strong increases in other less stable sources
of income, such as profi t from securities and
foreign exchange trading activities (including
related valuation effects), had pushed the share
of total net non-interest income to some 37.5%
of total operating income by the end of 2009.
In this context, it is important to note that
movements in net interest and non-interest
income seem closely correlated given certain
swap transactions by Croatian banks with parent
institutions.15
For more details on the refi nancing structure of banks in central, 14
eastern and south-eastern Europe, see Walko (2008).
See issue 4 of CNB (2009b), p. 44 onwards.15
Table 6 Croatia: profitability of the banking sector
2002 2003 2004 2005 2006 2007 2008 2009
Total operating income Percentage of total income 100.00 100.0 100.0 100.0 100.0 100.0 100.0 100.0
of which:Net interest income Percentage of operating income 70.80 75.3 69.2 70.2 70.5 67.5 69.3 62.5
Net non-interest income Percentage of operating income 29.20 24.7 30.8 29.8 29.5 32.5 30.7 37.5
General administrative expenses Percentage of operating income 59.30 57.4 54.3 54.4 54.9 52.1 52.4 49.4
Operating expenses
(excluding loan loss provisions) Percentage of operating income
Loan loss provision expenses Percentage of operating income 6.60 7.7 6.6 5.3 6.2 7.6 7.6 22.4
Income tax Percentage of operating income 6.30 6.0 6.4 7.8 7.7 8.2 7.8 5.7
After-tax profi t/loss Percentage of operating income 27.80 28.9 32.6 32.5 31.1 32.1 32.2 22.6
Net interest income Percentage of average assets 3.30 3.4 3.0 2.9 2.7 2.6 2.8 2.5
Net non-interest income Percentage of average assets 1.30 1.1 1.3 1.2 1.1 1.3 1.2 1.5
Interest rate spread
(total loans – total deposits) Percentage points 7.70 8.0 7.6 7.0 6.5 6.0 6.3 7.0
Return on average assets – before tax Percentage 1.58 1.6 1.7 1.6 1.5 1.6 1.6 1.2
Return on average equity – after tax Percentage 13.73 14.1 16.1 15.0 12.4 10.9 9.9 6.7
Net interest margin Percentage of average
interest-bearing assets 4.90 4.9 4.5 4.2 3.8 3.7 3.8 3.4
Source: CNB.
18ECB
Occasional Paper No 115
July 2010
Despite continued network expansion and
ongoing infrastructure deepening (e.g. ATMs),
bank effi ciency increased and operating expenses
fell below 50% of total operating income by
the end of 2009, partly on the basis of lower
personnel expenses owing to crisis-induced
cutbacks in staff. Finally, in order to provide
for increased risks related to the deteriorating
economic conditions and the pick-up in
non-performing loans, banks sharply stepped up
their provisioning efforts in 2009.
NON-BANK FINANCIAL INSTITUTIONS
Following several years of rapid expansion,
Croatia’s non-bank fi nancial sector took a turn
for the worse in the crisis years of 2008 and
2009 given the less favourable global fi nancial
market developments. Thus, the non-bank
fi nancial sector lost market share to the banking
sector in 2008 and 2009 in terms of total
fi nancial sector assets (see Table 7). Adverse
movements in global and local stock markets
in 2008 and during the fi rst quarter of 2009
entailed substantial asset losses, particularly
for open-end investment funds, which had a
fairly strong bias towards equity investments
before the crisis. In fact, in 2007 around 50% of
open-end investment funds’ total assets
consisted of equity funds and an additional 30%
of balanced funds (which contain a more or less
signifi cant proportion of equity). Consequently,
driven by the global stock market slump
following the demise of Lehman Brothers, their
share in total fi nancial sector assets has contracted
by more than two-thirds since 2007. In contrast,
growth in (compulsory) pension funds’ assets
remained buoyant as these funds invest large
proportions of their assets (some 75%) in less
risky domestic and foreign government bonds.
Similarly, insurance company assets increased
further, with the life segment outperforming the
non-life segment, where in line with the
economic downturn, demand in particular for the
insurance of land motor vehicles and of goods
in transit, as well as for credit insurance, fell
considerably. Leasing companies also gained
some ground in 2008 and 2009, driven mainly
by strong growth in fi nancial leasing (machines
and equipment, real estate).
Given the relatively limited size of the sector
(some 30% of GDP at the end of 2009) in
comparison with the banking system, the risks
related to the non-bank fi nancial sector seem
rather limited at present and are unlikely to erode
fi nancial system stability. However, the strong
dependence of some segments on stock market
developments (suggesting higher risks in the
case of further adverse shocks) and the potential
for regulatory arbitrage (parent banks very often
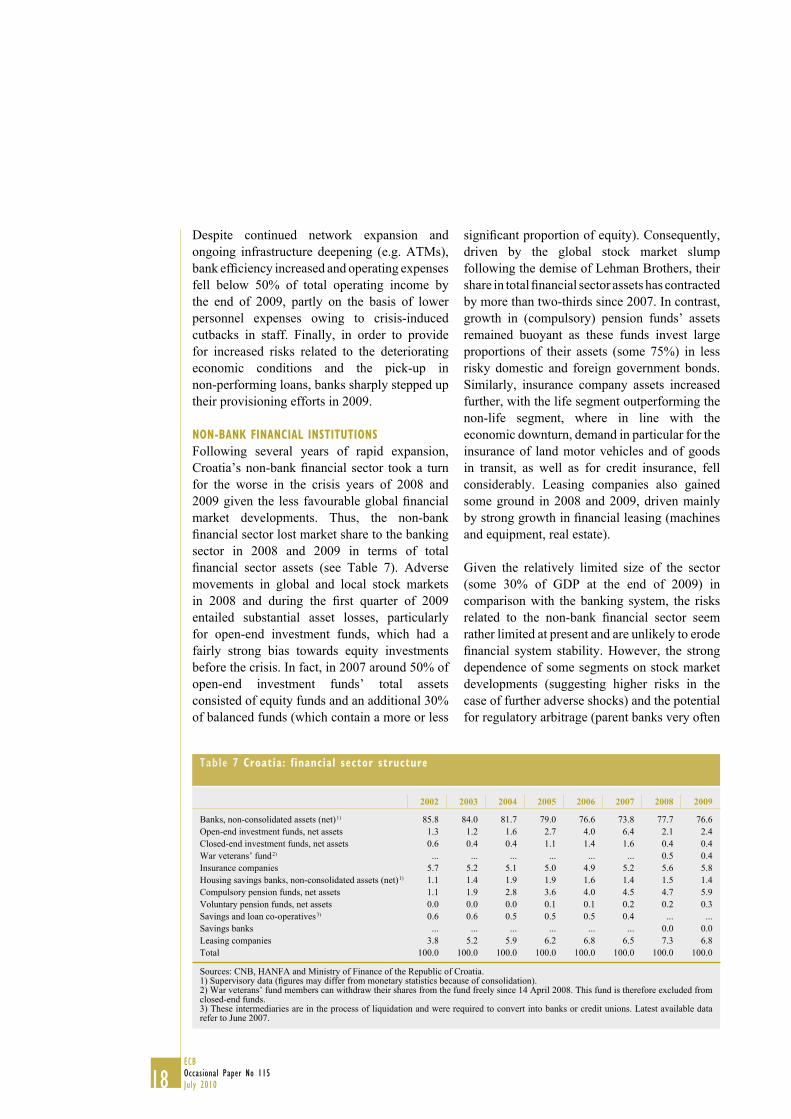
Table 7 Croatia: financial sector structure
2002 2003 2004 2005 2006 2007 2008 2009
Banks, non-consolidated assets (net) 1) 85.8 84.0 81.7 79.0 76.6 73.8 77.7 76.6
Open-end investment funds, net assets 1.3 1.2 1.6 2.7 4.0 6.4 2.1 2.4
Closed-end investment funds, net assets 0.6 0.4 0.4 1.1 1.4 1.6 0.4 0.4
War veterans’ fund 2) ... ... ... ... ... ... 0.5 0.4
Insurance companies 5.7 5.2 5.1 5.0 4.9 5.2 5.6 5.8
Housing savings banks, non-consolidated assets (net) 1) 1.1 1.4 1.9 1.9 1.6 1.4 1.5 1.4
Compulsory pension funds, net assets 1.1 1.9 2.8 3.6 4.0 4.5 4.7 5.9
Voluntary pension funds, net assets 0.0 0.0 0.0 0.1 0.1 0.2 0.2 0.3
Savings and loan co-operatives 3) 0.6 0.6 0.5 0.5 0.5 0.4 ... ...
Savings banks ... ... ... ... ... ... 0.0 0.0
Leasing companies 3.8 5.2 5.9 6.2 6.8 6.5 7.3 6.8
Total 100.0 100.0 100.0 100.0 100.0 100.0 100.0 100.0
Sources: CNB, HANFA and Ministry of Finance of the Republic of Croatia.1) Supervisory data (fi gures may differ from monetary statistics because of consolidation). 2) War veterans’ fund members can withdraw their shares from the fund freely since 14 April 2008. This fund is therefore excluded from closed-end funds.3) These intermediaries are in the process of liquidation and were required to convert into banks or credit unions. Latest available data refer to June 2007.

19ECB
Occasional Paper No 115
July 2010
I CROATIA
also own non-bank fi nancial intermediaries) call
for a cautious policy stance and close cooperation
between the CNB, which is in charge of bank
supervision, and the Croatian Financial Services
Supervisory Agency (HANFA), which oversees
non-bank fi nancial institutions.
1.3 RISKS AND SHOCK-ABSORBING CAPACITIES
CREDIT RISK
Credit risk continues to represent the main
source of risk to fi nancial stability in Croatia.
In fact, after years of strong credit growth, in the
second half of the last decade the ratio of private
sector credit to GDP had reached fairly elevated
levels relative to underlying fundamentals in
Croatia.16 Strong credit growth, albeit
decelerating on account of various CNB
measures aimed at reining in lending growth
based on banks’ foreign liabilities, continued
during 2007 and in the fi rst three quarters of
2008 (see Table 8). However, credit growth
moderated considerably thereafter, as the
downturn fully hit the Croatian economy in the
fi rst half of 2009. Both demand and supply-side
factors contributed to this development, with the
slowdown in household lending being more
pronounced than in corporate lending.
Croatia’s banking sector is highly prone to
indirect credit risk arising from the use of foreign
currency in domestic operations. The large share
of foreign currency-denominated and indexed
loans in total loans exposes households and
enterprises to exchange rate and foreign interest
rate fl uctuations, thereby implying credit risk for
banks. Given that households account for over
45% of total foreign currency-denominated (and
indexed) loans in Croatia, unhedged domestic
borrowers seem to bear the bulk of the currency
risk. According to CNB (2009c), about 96% of
total net placements and contingent liabilities
to households are considered as unhedged,
implying substantial currency-induced credit risk
in this sector. However, this risk is somewhat
mitigated by the fact that household deposits are
also largely denominated in foreign currencies,
as workers’ remittances and tourism revenues
represent a major source of household income.
Against the background of stricter capital
adequacy and liquidity requirements imposed by
the CNB, in particular the introduction of higher
risk weights on foreign currency-denominated
and indexed loans (mainly claims on unhedged
borrowers), the degree of currency substitution
in bank liabilities declined considerably during
2006 and 2007 and in the fi rst three quarters
of 2008. This trend reversed, however, after the
collapse of Lehman Brothers, which undermined
trust in the stability of global fi nancial markets.
In fact, the temporary waning of confi dence
among the Croatian population and corporations
in the local banking sector and in the
domestic currency led to an increased share of
foreign exchange-denominated bank liabilities
(especially as a result of currency conversions of
deposits, but also due to local currency deposit
withdrawals). This, in conjunction with the
release of foreign currency reserves by the CNB,
entailed stepped-up foreign currency lending by
banks to avoid currency mismatches. Driven
mainly by the strong growth in foreign currency
lending to the corporate sector, the share in
total loans of foreign currency-denominated
(including indexed) loans thus increased
strongly from 61% of total loans in 2007 to over
70% in 2009. Exchange rate valuation effects
(the depreciation of the kuna vis-à-vis the Swiss
franc) also played a part in this development.
Before the crisis, the Swiss franc played an
important role in domestic borrowing alongside
the euro. In fact, given low interest rates, Swiss
franc loans had quickly become popular in
Croatia during the boom years, with their share
of total foreign currency loans (total loans)
quintupling (quadrupling) from 5% (3.9%) at
the start of 2005 to 27% (16%) by the end of
2007. However, the global fi nancial crisis
brought about major changes regarding the
currency composition of foreign currency loans,
with the CHF share falling to 19% (13%) by the
end of 2009. The declining popularity of CHF
loans on account of the higher volatility of the
kuna vis-à-vis the Swiss franc (relative to that
against the euro), a more limited supply of CHF
For further details, see Zumer, Égert and Backé (2009).16

20ECB
Occasional Paper No 115
July 2010
loans by banks given diffi culties in obtaining
CHF liquidity and conversions of CHF loans
into euro loans presumably contributed to this
development.
Credit risk started to materialise through
deteriorating credit quality in the fi nal quarter
of 2008 and continued at an accelerated pace
in 2009 owing to borrowers’ diffi culties servicing
Table 8 Croatia: selected banking sector stability indicators
2002 2003 2004 2005 2006 2007 2008 2009
RisksCredit riskCredit growth Percentage, year on year 35.1 17.4 12.8 20.1 22.6 14.8 13.6 3.3
Credit growth to the private sector Percentage, year on year 32.9 16.2 13.3 18.7 23.7 14.2 12.1 -0.7
Real credit growth to the private sector Percentage, year on year 30.4 14.5 10.8 14.6 21.3 8.3 8.971 -2.6
Credit growth to households Percentage, year on year 45.4 27.4 18.0 20.5 21.9 18.1 12.0 -3.0
Mortgage credit (housing loans) growth Percentage, year on year 28.6 37.4 28.9 28.9 34.0 22.5 15.7 1.2
Non-performing loans Percentage of total loans 10.2 8.9 7.5 6.2 5.2 4.8 4.9 7.8
of which:
Non-performing loans of householdsPercentage of total
household loans 5.8 6.4 4.7 4.5 4.1 3.7 3.9 5.8
Non-performing loans of corporatesPercentage of total
corporate loans 15.5 12.9 11.9 9.7 7.6 7.3 7.2 12.8
Non-performing loans in domestic
currency
Percentage of total
domestic currency loans … … … … … … … …
Non-performing loans in foreign
currency
Percentage of total foreign
currency loans … … … … … … … …
Foreign currency credit Percentage of total credit 79.8 74.2 75.7 77.4 71.5 61.4 65.4 72.7
Foreign currency deposits 1) Percentage of total deposits 88.4 87.5 87.3 86.4 76.3 66.8 68.5 76.1
Market riskForex risk
Open foreign exchange position Percentage of total assets 1.0 1.2 1.0 0.6 0.2 0.7 0.5 0.9
Stock market riskRatio of shares and participations
to total assets (equity holdings) 1.8 1.4 0.9 0.8 0.7 0.7 0.2 0.1
Liquidity riskRatio of liquid assets 2) to total assets 29.4 32.8 31.2 28.0 27.5 27.6 23.9 23.7
Ratio of total loans to total deposits 74.2 76.7 80.7 88.5 92.5 92.8 99.5 98.3
Ratio of liquid assets 2) to short-term
liabilities 97.7 117.2 120.4 103.1 102.6 107.1 106.1 119.2
Shock-absorbing factors
Loan loss provisions
Percentage of
non-performing loans 67.9 60.9 62.5 60.0 57.0 54.7 49.5 42.5
of which:
Loan loss provisions for household
loans
Percentage of
non-performing loans
to the household sector 61.4 53.0 69.9 66.2 62.6 67.0 63.8 60.6
Loan loss provisions for corporate
loans
Percentage of
non-performing loans
to the corporate sector 68.4 62.0 57.4 56.4 52.2 45.3 38.1 33.0
Non-performing loans net of provisions Percentage of capital 19.6 22.6 19.0 16.7 14.0 11.3 12.8 22.2
Capital adequacy ratio 16.6 15.7 14.1 13.5 13.2 15.4 14.2 15.8
MemoNumber of banks (foreign-owned) 46 (23) 41 (19) 37 (15) 34 (14) 33(15) 33(16) 34 (16) 34 (15)
Asset share of foreign-owned banks Percentage of total assets 90.2 91.0 91.3 91.3 90.8 90.4 90.7 90.9
Source: CNB.1) Time deposits. 2) Liquid assets = cash in vaults + deposits with the CNB + deposits with other banks + treasury bills.

21ECB
Occasional Paper No 115
July 2010
I CROATIA
their loans in a less favourable economic
environment. Having decreased for years, largely
on the back of strong credit growth, the share of
non-performing loans 17 (NPLs) in total loans
picked up from 4.8% in 2007 to 7.8% by the end
of 2009. NPL ratios in the retail segment are half
as high as in the corporate sector, which is
associated with the relatively large share of
housing loans (some 43% at the end of 2009) in
total household loans, where delinquency rates
have been fairly low thus far (at around 2.7%).
Another possible explanation underpinning this
development could be the recourse of large
corporations with a solid fi nancial standing to
cross-border borrowing (IMF, 2008), which
could imply an adverse selection problem.
However, in their recent empirical analysis
Cerovac and Ivičic (2009) fi nd no evidence of a
negative impact of corporations’ direct
cross-border borrowing on the risk profi le of
domestic banks’ balance sheets. Quite the
reverse, in fact, since default rates seem
somewhat higher for corporations with direct
foreign fi nancing (often being related to the
construction sector). There are no data available
on non-performing loans by currency
composition, which makes it impossible to infer
whether banks applied stricter risk management
practices to foreign currency-denominated and
foreign currency-indexed loans than to domestic
loans so as to offset the higher risks associated
with those loans. Being a lagging indicator, NPLs
appear to be increasing further in 2010 owing,
inter alia, to declining corporate profi tability and
adverse labour market conditions.
Pursuant to the CNB Decision on the classifi cation of placements 17
and off-balance sheet liabilities of credit institutions, placements
have to be classifi ed as placements without impairment
(risk category “A”), partly recoverable placements (risk categories
“B-1”, “B-2” and “B-3”) and fully irrecoverable placements
(risk category “C”). In more detail, in order to be included in
NPLs, placements have to be classifi ed as: 1) B-1, if liabilities
are overdue by more than 90 but less than 180 days; 2) B-2,
if liabilities are overdue by more than 180 but less than 270 days;
3) B-3, if liabilities are overdue by more than 270 but less than
365 days; or 4) C, if liabilities are overdue by more than 365 days.
Table 9 Croatia: selected macroprudential indicators – total debt 1)
2002 2003 2004 2005 2006 2007 2008 2009
HouseholdsDebt Percentage of GDP 21.6 25.4 28.0 32.4 36.6 39.5 40.4 40.6
Debt Percentage of gross disposable income 43.3 52.1 58.3 69.5 78.0 85.1 88.6 84.4
Debt Percentage, year on year 42.6 28.2 19.4 24.4 22.4 18.5 11.4 -2.7
Implicit interest payments Percentage of gross disposable income 3.7 4.5 4.8 5.1 5.3 5.7 6.1 6.3
Non-fi nancial enterprisesDebt Percentage of GDP 42.2 43.7 45.8 50.8 58.9 66.3 72.0 78.5
Debt Percentage of corporate bank deposits 331.4 320.2 339.4 398.6 395.9 387.1 498.9 580.0
Debt Percentage, year on year 16.5 12.9 13.2 19.6 25.5 23.5 18.3 6.1
Implicit interest payments Percentage of GDP 3.4 3.2 3.1 3.1 3.5 4.2 4.4 …
Total non-fi nancial private sectorDebt Percentage of GDP 63.8 69.1 73.8 83.2 95.5 105.8 112.5 119.1
Debt Percentage, year on year 24.2 18.0 15.5 21.4 24.3 21.6 15.7 2.9
General government 2), 3)
Debt Percentage of GDP 34.9 35.7 37.9 38.5 36.0 33.4 29.3 35.4
Debt Percentage, year on year 7.3 11.7 14.8 9.2 1.3 2.0 9.1 17.3
Interest paid Percentage of GDP 1.8 1.8 1.8 1.9 1.9 1.8 1.5 1.7
Total non-fi nancial sectorDebt Percentage of GDP 98.7 104.9 111.7 121.7 131.5 139.3 141.8 154.4
Debt Percentage, year on year 24.2 18.0 15.5 21.4 24.3 21.6 10.9 6.0
Memorandum items:Total external debt 5) Percentage of GDP 53.9 66.3 70.0 72.1 74.9 76.9 82.6 95.0
Total private external debt 4), 5) Percentage of GDP 34.5 45.1 50.0 54.9 60.4 64.3 73.7 83.5
Source: CNB.1) All items refer to total (foreign and domestic) debt. 2) Effective from 2008, data exclude Croatian Highways. 3) Growth rate for 2008 adjusted for exclusion of Croatian Highways. 4) All domestic sectors except general government are considered to be private.5) Round-tripping transactions excluded (for further details, see issue 154, CNB (2009e), p.38).

22ECB
Occasional Paper No 115
July 2010
Household debt, predominantly consisting of
bank loans, fell in 2009 (see Table 9) after years
of double-digit growth rates. For this reason, as
well as on account of increases in disposable
income (averaging 2.8% in 2009),18 household
debt also fell relative to gross disposable income
(to 84.4%) in 2009. However, household debt
levels remained stable at about 40% of GDP
during the crisis years given last year’s fall in
nominal GDP. Implicit interest payments
relative to gross disposable income continued to
increase in 2008 and 2009, largely driven by a
pick-up in interest rates. Mortgage lending, the
most dynamic line of business in the household
segment during the boom years, lost considerable
momentum during the second half of 2009 on
the back of lower demand for property and
falling real estate prices (by around 4% on
average in 2009). In contrast to other segments
of household lending, growth in housing loans
remained in positive territory in 2008 and 2009,
so that their share in total household loans
increased slightly to 43% in those two years.
Despite a crisis-driven slump in investment
activity, robust growth in corporate sector debt
levels continued in 2008 and 2009. However,
to some extent this may also have been driven
by exchange rate valuation effects (e.g. the
depreciation of the kuna vis-à-vis the Swiss
franc by some 13% since the start of 2008),
even though – given the lack of data on the
currency breakdown of loans – the bulk of CHF
loans appears to relate more to the household
segment (mainly housing loans). In this context,
the domestic debt growth of the corporate sector
(mainly bank loans) decelerated signifi cantly in
2009 but remained positive, so that corporations’
domestic debt climbed to over 78% of GDP,
with interest payable also rising considerably in
conjunction with increased refi nancing costs.
MARKET AND LIQUIDITY RISKS
The banking sector’s exposure to interest rate
risk is limited. Most of the interest rate risk
(both domestic and foreign) has been shifted to
bank clients and appears to materialise through
the credit risk channel in the event of adverse
developments. This is because loan contracts
(including fi xed interest rate loans) often allow
for pertinent interest rate adjustments by carrying
safeguard clauses. In fact, some two-thirds
of total loans provide for interest rate adjustments
within three months (and 95% for within
one year). At the same time, on the liability side
deposits are predominantly short-term, with
about 85% (55%) of total deposits maturing
within less than one year (three months),
allowing a fairly broad degree of fl exibility
during times of high interest rate volatility.
In contrast to global interest rate developments,
average lending rates increased substantially in
Croatia more or less across the board in 2008
and 2009 (see Chart 1), especially in the case of
short-term local currency corporate loans and
long-term household loans indexed to foreign
currency, thereby increasing indirect domestic
and foreign interest rate risks. Average deposit
rates remained fairly stable throughout 2008
and 2009, albeit with major fl uctuations observed
in the case of local-currency time deposits.
To some extent, this can be attributed to the
banks’ attempts to stop deposit withdrawals at
the height of the crisis and to prevent large-scale
deposit conversions into foreign currencies,
but also – given the coincidence with the
concurrent spikes in money market rates –
to the fairly high bargaining power of corporate
treasurers, who demand short-term deposit interest
rates comparable with money market rates or
otherwise place their funds in the money market.
The share of equity participations in total assets
declined by more than two-thirds in 2008 and
2009 in the context of adverse global stock
market developments. These positions do
not represent a major risk to banking system
stability in Croatia, as the banking sector’s
exposure to stock market risk is negligible in the
light of equity positions of only 0.1% of total
assets in 2009.
It is important to note, however, that full-year 2009 data mask 18
strongly decelerating intra-year dynamics in disposable income
growth, from +8.9% in the fi rst quarter of 2009 to -3.8% in the
fi nal quarter of 2009, on the back of the introduction of a special
“crisis tax” in July, and the lagged impact of slowing wage
growth and worsening labour market conditions.
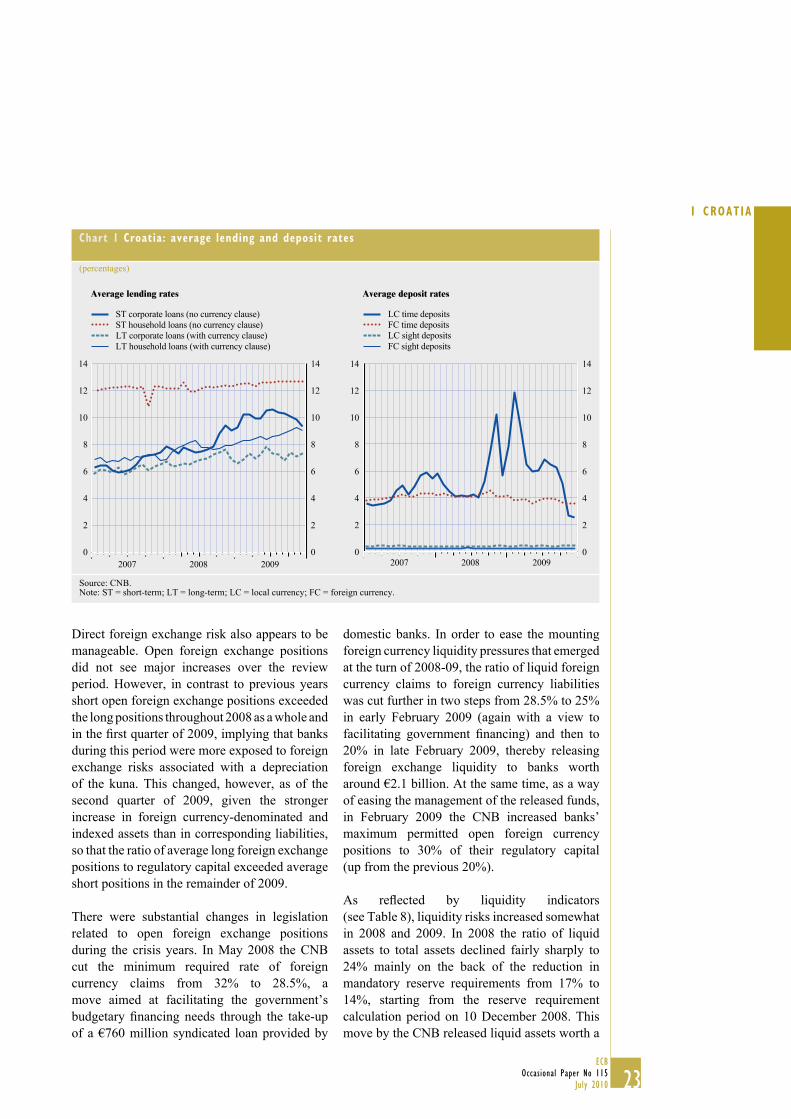
23ECB
Occasional Paper No 115
July 2010
I CROATIA
Direct foreign exchange risk also appears to be
manageable. Open foreign exchange positions
did not see major increases over the review
period. However, in contrast to previous years
short open foreign exchange positions exceeded
the long positions throughout 2008 as a whole and
in the fi rst quarter of 2009, implying that banks
during this period were more exposed to foreign
exchange risks associated with a depreciation
of the kuna. This changed, however, as of the
second quarter of 2009, given the stronger
increase in foreign currency-denominated and
indexed assets than in corresponding liabilities,
so that the ratio of average long foreign exchange
positions to regulatory capital exceeded average
short positions in the remainder of 2009.
There were substantial changes in legislation
related to open foreign exchange positions
during the crisis years. In May 2008 the CNB
cut the minimum required rate of foreign
currency claims from 32% to 28.5%, a
move aimed at facilitating the government’s
budgetary fi nancing needs through the take-up
of a €760 million syndicated loan provided by
domestic banks. In order to ease the mounting
foreign currency liquidity pressures that emerged
at the turn of 2008-09, the ratio of liquid foreign
currency claims to foreign currency liabilities
was cut further in two steps from 28.5% to 25%
in early February 2009 (again with a view to
facilitating government fi nancing) and then to
20% in late February 2009, thereby releasing
foreign exchange liquidity to banks worth
around €2.1 billion. At the same time, as a way
of easing the management of the released funds,
in February 2009 the CNB increased banks’
maximum permitted open foreign currency
positions to 30% of their regulatory capital
(up from the previous 20%).
As refl ected by liquidity indicators
(see Table 8), liquidity risks increased somewhat
in 2008 and 2009. In 2008 the ratio of liquid
assets to total assets declined fairly sharply to
24% mainly on the back of the reduction in
mandatory reserve requirements from 17% to
14%, starting from the reserve requirement
calculation period on 10 December 2008. This
move by the CNB released liquid assets worth a
Chart 1 Croatia: average lending and deposit rates
(percentages)
Average lending rates Average deposit rates
14
12
10
8
6
4
2
0
14
12
10
8
6
4
2
0
ST corporate loans (no currency clause)
ST household loans (no currency clause)
LT corporate loans (with currency clause)
LT household loans (with currency clause)
2007 2008 2009
14
12
10
8
6
4
2
0
14
12
10
8
6
4
2
02007 2008 2009
LC time deposits
FC time deposits
FC sight deposits
LC sight deposits
Source: CNB.Note: ST = short-term; LT = long-term; LC = local currency; FC = foreign currency.

24ECB
Occasional Paper No 115
July 2010
total of HRK 8.4 billion (5.9 billion in kuna and
2.5 billion in foreign exchange), corresponding
to some €1.2 billion (see Chart 2). In 2009 the
ratio of liquid to total assets stabilised. At the
same time, the loan-to-deposit ratio increased
further in 2008, reaching some 100%. However,
given strongly decelerating credit growth in the
context of the fi nancial crisis the loan-to-deposit
ratio stabilised in 2009 at 2008 levels. Despite
the above, liquidity levels can still be considered
high, inter alia given the large amounts of free
reserves held with the CNB. At the same time,
the liquidity risks associated with the high
share of liabilities towards non-residents in
total liabilities did not materialise during the
crisis given parent banks’ strong commitments
to Croatia.
SHOCK-ABSORBING FACTORS
Croatia’s banking sector is well-capitalised in
terms of standard capital ratios. Notwithstanding
substantial capital increases by banks, capital
adequacy fell slightly in 2008 on account of
the further tightening of capital adequacy
regulations, which required banks to apply
higher risk weights on foreign currency
(and indexed) claims vis-à-vis unhedged
borrowers. The capital adequacy ratio stood at
15.2% in late 2008 (see Table 8), well above
the 10% required by Croatian law. Bank
capitalisation improved again in 2009 owing
to stepped-up capital increases (mainly via
retained earnings) in the context of the global
crisis (see also Table 5) and slower growth in
risk-weighted assets as a result of the slowdown
in credit growth and stepped-up lending to the
public sector (which carries lower risk weights).
In order to strengthen bank capitalisation
further, in line with the section of the new
Credit Institutions Act that came into force on
1 January 2009 and additional CNB decisions
on the capital adequacy of credit institutions, the
CNB increased the banks’ minimum required
capital adequacy ratio from 10% to 12% as of
31 March 2010, when Basel II standards also
became operational in Croatia.
Substantial capital buffers allow the banking
sector to withstand shocks stemming from
operational and market risks and underpin its
shock-absorbing capacities. In fact, CNB stress
tests have concluded that even under a shock
Chart 2 Effects of CNB measures taken in response to spillovers from the global crisis
(euro millions)
Liquidity impact of monetary measures Liquidity impact of forex interventions
2,500
1,500
500
0
-500
2,000
1,000
2,500
1,500
500
0
-500
2,000
1,000
Jan. July Jan. July Jan.
Reduction in general RR from 17% to 14%
Reduction in generalRR from 14% to 13%
Cut in the liquidity ratio from 32% to 28.5% Cut in the liquidity ratio
from 28.5% to 25%
Cut in the liquidity ratiofrom 28.5% to 20%
Removal of vaultcash from RR
Removal of creditgrowth limits
Abolition in marginal RR
Abolition in special RR
2008 2009 2010
500
400
300
200
100
0
-100
-200
-300
-400
-500
500
400
300
200
100
0
-100
-200
-300
-400
-500
Forex purchases from market
Forex sales to market
Jan. July Jan. July Jan.2008 2009 2010
Source: CNB.
25ECB
Occasional Paper No 115
July 2010
I CROATIA
scenario, which assumes a GDP decline of 6%
and exchange rate depreciation of 10%,19 the
banking sector as a whole would remain
adequately capitalised. Moreover, stress tests
for individual banking groups suggest that under
the shock scenario corporate banks would be the
most exposed given their lower initial capital
adequacy ratio.
Moreover, despite the severity of the economic
downturn and rising non-performing loans, the
banking sector retained its profi tability in 2009,
even if at somewhat lower levels than during the
boom years. This should provide banks with an
additional buffer to weather the global economic
and fi nancial crisis, with retained earnings
helping to beef up banks’ capital positions.
Finally, as experience during the global crisis
has shown, widespread foreign ownership also
bolstered banking system stability. In fact,
foreign banks’ strategic, long-term goals in the
region and the related commitment of parent
banks to support their Croatian subsidiaries
during turbulent times in late 2008 and early
2009 helped to mitigate the impact of the crisis
on the Croatian banking sector, both directly
and indirectly. Specifi cally, parent banks were
instrumental in further strengthening their
subsidiaries’ capital base (predominantly via
retained earnings) and in providing suffi cient
funding and liquidity. Moreover, Croatian
subsidiaries indirectly benefi ted from the
positive spillovers from foreign banks’
commitments to and action in other central,
eastern and south-eastern European countries.
Last, but not least, they also benefi ted from
private-public coordination under the aegis
of international fi nancial institutions (e.g. the
European Bank Coordination Initiative), which
helped to restore public trust and to alleviate
confi dence concerns.
1.4 CONCLUDING ASSESSMENT
AND POLICY IMPLICATIONS
The previous issue of the fi nancial stability
assessment of the candidate countries
(ECB, 2008) identifi ed 1) the rapid pace of
fi nancial deepening based on strong credit
growth to the private sector, 2) the widespread
use of foreign currency-denominated or indexed
loans and the related indirect credit risk, 3) high
and rising external imbalances, and 4) upward
infl ationary pressures, as the main risk factors to
fi nancial stability in Croatia.
The international fi nancial and economic
environment has changed considerably since
then, as the deepest crisis for decades affected
the global economy in 2008 and 2009. Against
this background, the global crisis severely tested
Croatia, a test which the country has withstood
for the time being and which, to some extent,
also altered the country’s risk profi le. In fact,
the crisis itself and the adjustment measures
implemented by the authorities to cope with the
spillovers from the global crisis reduced some
of the existing risks, whereas other risks were
amplifi ed by the crisis or materialised during it.
In particular, Croatia was hit hard by the global
crisis especially in 2009, when the economy slid
into its deepest recession since early transition.
The current account improved considerably
in 2009 but the country’s external position
remains an important source of vulnerability,
given high (and in 2008 and 2009 further
increasing) external debt levels and substantial
rollover needs, with the spillovers from the
global fi nancial crisis also revealing temporary
fi nancing strains in early 2009. Yet, in contrast
to other countries in central, eastern and
south-eastern Europe, Croatia managed to
weather the global fi nancial turbulence without
recourse to international support. Still,
the country may have benefi ted indirectly from
the positive impact of international support
measures in other central, eastern and
south-eastern European countries and from the
stabilisation and recovery of global fi nancial
markets as of March 2009. Nevertheless,
Croatia’s major macro-fi nancial challenges
relate, fi rst and foremost, to alleviating the
country’s external vulnerabilities, in particular
For further details, see CNB (2009b). For a macro stress-testing 19
exercise, refer to section 4.2.

26ECB
Occasional Paper No 115
July 2010
on the fi nancing side. In this context, it is crucial
to prevent a further deterioration in Croatia’s
external debt position. This is a challenging task
given corporations’ increasing reliance on direct
foreign borrowing and Croatia’s obligation to
liberalise capital fl ows fully in accordance with
the acquis communautaire.20
As in other central, eastern and south-eastern
European countries, infl ationary concerns
quickly became a non-issue in Croatia in the
context of the global crisis, which gave the
CNB the leeway to focus on other emerging
priorities, some of them unprecedented. In fact,
the CNB successfully managed to preserve
fi nancial and exchange rate stability during the
period of turbulence by employing a wide set
of measures, ranging from verbal interventions
and standard monetary policy measures (mainly
related to regulations on reserve and liquidity
requirements) to outright foreign exchange
market operations. However, the CNB’s limited
room for manoeuvre – against the background
of the tightly managed fl oat and the still high
external imbalances – highlights the continued
need for fi scal prudence with a view to lasting
macro-fi nancial stabilisation. Deteriorating
public fi nances actually make fi scal reform
and consolidation imperative, all the more
so as public fi nances are still burdened with
subsidies for various industries (e.g. shipping),
high health and pension commitments, as
well as substantial quasi-fi scal expenditures.
Therefore, ensuring lasting fi scal consolidation,
mainly through spending restraints, remains an
important challenge.
Croatia’s predominantly bank-based fi nancial
system remained stable and profi table in 2008
and 2009, despite less favourable fi nancial and
economic conditions and temporary confi dence
problems (as was also the case in some other
central, eastern and south-eastern European
countries). Although fi nancial deepening has
largely come to a halt on account of the fi nancial
crisis, the Croatian banking system is relatively
advanced in a central, eastern and south-eastern
European context, both as regards the degree
of fi nancial intermediation and the institutional
setting. In the wake of the global fi nancial
crisis, credit growth decelerated sharply, driven
both by supply-side and demand-side factors.
Consequently, the CNB’s fi ght against overly
high credit growth based on banks’ foreign
borrowing paled in comparison with previous
years’ priorities. Still, the management of credit
risk remains the most important fi nancial stability
challenge for Croatia’s banking sector. Indeed,
as in other central, eastern and south-eastern
European countries and advanced economies, in
an adverse economic environment households
and corporations increasingly face problems with
servicing their debt burden, which ranks among
the highest in the region. Credit risk is further
compounded by the dominant role of foreign
currency positions, which – in a worst-case
scenario of a substantial depreciation of the
domestic currency – would imply substantial
foreign exchange risks for unhedged borrowers.
Banks’ exposure to market risks seems to be
subdued as, by shifting foreign exchange and
interest rate risk over to clients, they have
transformed much of the market risk into credit
risk. Again, this reinforces the need for a careful
monitoring of credit risk.
At the same time, it is also important to stress the
banking system’s shock-absorbing capacities.
Thus far the sector’s still-high profi tability,
its strong capitalisation and the strategically-
oriented presence of foreign banks have helped
to absorb losses stemming from credit risk.
Moreover, banks’ solid liquidity position before
the crisis, which gave the central bank enough
room for manoeuvre to carry out liquidity-easing
operations during turbulent times, also allowed
According to Croatia’s Stabilisation and Association Agreement 20
(SAA) with the European Union, from the fourth year of its
entry into force (i.e. by 1 February 2009) Croatia has to ensure
free movement of capital relating to portfolio investment and
fi nancial loans and credits with maturity of less than a year.
However, in line with the SAA provisions and owing to
exceptional circumstances (i.e. in order to cope with spillovers
from the global economic and fi nancial crisis), Croatia and
the European Commission have agreed on an extension to the
deadline. Accordingly, the liberalisation of short-term loans
to non-residents with maturities from three months to one year
was postponed until 1 January 2010, while short-term loans
with maturities of up to three months are to be liberalised as of
1 July 2010. Deposit transactions of residents abroad will be
liberalised as of 1 January 2011.

27ECB
Occasional Paper No 115
July 2010
I CROATIA
banks to weather global liquidity pressures.
Banks’ sizeable net foreign liabilities continue
to represent a potential vulnerability factor,
however, and require cautious monitoring,
even though parent banks are the main external
fi nancing source of the Croatian banking
sector. These same banks have shown a strong
commitment towards the region and proved
their readiness to support their subsidiaries in
times of crisis.
The main challenge for the CNB continues to
be safeguarding both fi nancial and monetary
stability in a still uncertain global economic and
fi nancial environment, while also contributing to
economic recovery. How successful this will be
hinges not only on external factors, such as the
short to medium-term global economic prospects
and the fi nancial position of parent banks,
but also on local determinants like the magnitude
and speed of debt restructuring by different
economic sectors, the pace at which banks can
digest the non-performing loan problem and
their willingness to reignite lending activity,
as well as the degree of support from other
policy spheres.

28ECB
Occasional Paper No 115
July 2010
2 THE FORMER YUGOSLAV REPUBLIC
OF MACEDONIA
2.1 THE MACROECONOMIC ENVIRONMENT
The deepening of the global fi nancial and economic
crisis after the collapse of Lehman Brothers led to
a deterioration in the macroeconomic conditions
in the former Yugoslav Republic of Macedonia.
Real GDP growth decelerated in the fourth quarter
of 2008 and turned negative in 2009 (-0.7%,
see Table 10). This was the result of a steep
fall in metal prices, a contraction of economic
activity in leading economic partners and
a decline in remittances and capital fl ows, which
was only partly offset by the increase in public
consumption. Regarding the outlook for 2010, the
recovery that started in the fourth quarter of 2009
is expected to gain pace, but real GDP growth
will probably remain below the long-term trend.
Structural unemployment remains signifi cant,
with the offi cial unemployment rate at 32.2% in
December 2009. It should be noted, however,
that unemployment has been persistently
high for the whole decade and increased only
marginally in 2009.21
Since the mid-1990s, the former Yugoslav
Republic of Macedonia has anchored its
exchange rate, initially to the Deutsche Mark
and then to the euro, in the form of a soft peg.22
This policy has been largely motivated by the
signifi cant degree of openness, close trade links
with the European Union and the widespread
private use of the euro. This exchange rate
regime infl uences the conduct of monetary
policy and its maintenance is pivotal in
safeguarding macroeconomic and fi nancial
stability. At the onset of the global fi nancial
crisis, the main vulnerability of the former
Yugoslav Republic of Macedonia was its large
current account defi cit in the context of the
exchange rate peg to the euro. Against this
backdrop, the National Bank of the Republic of
Macedonia (NBRM) in November 2007
embarked on a cycle of tightening monetary
policy to contain mounting infl ationary pressures
(on the back of rising energy and food prices)
and alleviate the pressures on the exchange rate.
Specifi cally, the NBRM made consecutive
increases in the central bank bill rate (i.e. the
main monetary policy instrument) from 4.7% in
November 2007 to 7% in June 2008.
The high unemployment rate can be partly attributed to 21
administrative factors (e.g. if not employed, an individual needs
to be registered as unemployed to enjoy health insurance) as well
as to hidden employment in the unoffi cial sector (i.e. the black
economy).
The de jure exchange rate regime is managed fl oating; the de 22
facto regime involves a stabilised arrangement with the euro.
Table 10 The former Yugoslav Republic of Macedonia: Main macroeconomic indicators
Description 2003 2004 2005 2006 2007 2008 2009 2010 1) 2011 1)
Real GDP growth Percentage, period average 2.8 4.1 4.1 4.0 5.9 4.8 -0.7 1.3 2.0
Infl ation Percentage, period average,
harmonised defi nition 1.2 -0.4 0.5 3.2 2.3 8.3 -0.8 1.3 2.0
Central Bank Bill Rate 2) Percentage, end of period 6.2 10.0 8.5 5.7 4.8 7.0 8.5 … …
Nominal effective exchange rate Index (2001 = 100), period average 106.8 109.6 110.9 111.1 112.6 114.4 116.7 … …
Current account balance Percentage of GDP -4.1 -8.4 -2.6 -0.9 -7.2 -13.1 -7.3 -7.8 -9.5
FDI Percentage of GDP 2.4 6.0 1.6 6.8 8.8 6.3 2.6 5.1 5.1
Gross external debt Percentage of GDP 50.0 51.9 51.5 51.8 52.2 47.0 59.3 57.8 58.4
General government balance Percentage of GDP -0.1 0.4 0.2 -0.5 0.6 -1.0 -2.8 -2.5 -2.0
General government gross debt Percentage of GDP 39.0 36.6 39.5 31.5 23.4 21.5 24.5 26.2 26.3
Unemployment rate Percentage 36.7 37.1 37.3 36.0 34.9 33.8 32.2 31.7 31.0
Sources: Eurostat (AMECO), Haver Analytics, IMF, national sources and ECB calculations.1) Forecasts. 2) Monetary policy rate; weighted average 28-day interest rate.

29ECB
Occasional Paper No 115
July 2010
2 THE FORMER
YUGOSLAV REPUBLIC
OF MACEDONIAThe escalation in the global fi nancial crisis in
September 2008 and growing risk aversion
among investors resulted in a collapse of export
demand and a loss of external fi nancing at the
end of 2008. These factors caused a sharp
slowdown in the economy and a decline in tax
revenues. They also forced a rapid sell-off of
central bank foreign exchange reserves and
raised uncertainties about the sustainability of
the exchange rate peg. Currency substitution
and cash outfl ows by residents added to
pressures on reserves, while elections in
spring 2009 created additional uncertainties.
By May 2009 central bank reserves had fallen
below €1.2 billion (75% of short-term debt),
30% down from the October 2008 peak. The
NBRM responded to reserve outfl ows by raising
its policy rate from 7% to 9% and tightening
bank reserve and liquidity requirements.23 These
actions helped to slow credit growth and contain
the loss of reserves. In response to the improved
trends in the external sector and the more
favourable outlook, the NBRM started a
loosening cycle in November 2009 and had
reduced its policy rate in six steps by 400 basis
points to 5% by the middle of June 2010.
Infl ation, which had been contained successfully
at low levels until 2007, spiked in 2008, reaching
8.3% (annual average) mainly on account of
the increase in global food and energy prices.
In 2009 the downward adjustment of import prices
was the key driver behind a remarkable reversal,
and negative infl ation was recorded (-0.8%).
The fi scal position of the former Yugoslav
Republic of Macedonia, underpinned by
prudent fi scal policy, had been improving for
the whole of this decade until the collapse of
Lehman Brothers. In the fourth quarter of 2008
the government adopted an expansionary fi scal
policy. Specifi cally, taxes on personal income
and profi ts were reduced (10% fl at rate, down
from 12%) while wages in public administration
were increased (4.1%), as was public expenditure
on goods and services (32.8%). These measures
were aimed at stimulating domestic economic
activity through an increase in household
disposable income and public consumption.
As a result, the government registered a small
fi scal defi cit (-1% of GDP) in 2008, which
widened somewhat in 2009 (-2.8% of GDP). In
July 2009 the government issued a €175 million
Eurobond (at 9.875%), which bolstered foreign
reserves and ensured suffi cient budget fi nancing.
Central government debt also increased
moderately in 2009 to reach 24.5% of GDP, but
still remained signifi cantly lower than the levels
recorded in the early part of the decade. Gross
external debt also increased in 2009, reaching
about 59% of GDP.
The current account balance deteriorated in 2008
to reach a multi-year high of 13.1% of GDP,
but improved considerably in 2009 (-7.3%).
The underlying trade defi cit remains structurally
signifi cant, peaking at 26.7% in 2008. In the
course of 2009 the trade defi cit improved, mainly
on account of a signifi cant reduction in imports,
while the current account also benefi ted from
increasing private transfers. FDI fl ows hovered
around 6-9% of GDP in 2006-08, but declined
to about 2.6% in 2009.
2.2 THE FINANCIAL SYSTEM: STRUCTURE
AND DEVELOPMENTS
THE STRUCTURE OF THE BANKING SYSTEM
The banking sector of the former Yugoslav
Republic of Macedonia is dominated by
foreign-owned private banks, which have gained
market share in the last couple of years. In 2009
foreign-owned banks represented 93% of total
banking sector assets, up from 86% in 2007, while
their number has also increased (see Table 11).
Concentration in the sector remains high with
the three largest banks controlling two-thirds
of total assets in 2009, a feature common in
many small open economies. The total number
of banks has remained stable since 2008.
In the last couple of years several institutional
reforms in the banking system have been
implemented, including the adoption of a new
In particular, it increased the reserve requirement for foreign 23
currency-denominated liabilities from 10% to 13% and for
foreign currency-indexed liabilities from 10% to 20%.

30ECB
Occasional Paper No 115
July 2010
banking law in June 2007. The EBRD index
of banking sector reform rose to 3.0 in 2009
(from 2.7 in 2007).24 In 2008 the following
laws strengthening the institutional framework
were enacted:
The Credit Bureau Law, enabling the •
establishment of private credit bureaus
covering liabilities based on loans,
payment cards, fi nancial leasing, insurance,
taxes, social insurance contributions,
telecommunication, energy and other
utilities fees, etc. Private credit bureaus are
intended to complement the information
provided by the NBRM’s Credit Registry,
which only covers liabilities to banks and
savings houses;
The Law on Financial Collateral, which •
consolidates the regulations of the former
Yugoslav Republic of Macedonia with EC
Directive 2020/47 on fi nancial collateral
agreements;
The Law on Voluntary Fully Funded Pension •
Insurances, which regulates the sector
establishing the so-called third pension pillar
for the fi rst time.
THE ASSET AND LIABILITY STRUCTURE
OF THE BANKING SYSTEM
Financial intermediation in the former Yugoslav
Republic of Macedonia showed an upward trend
in the period 2002-07, but has remained almost
fl at since. Measured by the share of total banking
system assets in GDP, fi nancial intermediation
stood at about 66% in 2009, only slightly higher
compared with 2007 (63.1%), while in 2002 it
had stood at 38% (see Table 12).25 Compared
with the EU countries, only Romania has a
lower level of fi nancial intermediation.
Banks in the former Yugoslav Republic of
Macedonia focus on traditional banking
activities, with credit to the private sector
playing a predominant role. The share in total
assets of claims on the non-bank corporate
sector and households increased steadily until
2008, reaching 66.7%, but declined in 2009
(to 59.3%). Claims on households increased at
a faster pace, representing 40% of total claims
to the private sector at the end of 2009. They
also proved to be more resilient in the recent
downturn. External assets represent only
10.2% of total assets and their share recorded
a moderate increase in 2009 compared with
2008. The share of claims on domestic MFIs
has experienced some volatility over recent
years, but remained low at 8.7% in 2009. Lastly,
claims on the general government sector have
declined in the last couple of years.
According to the EBRD a score of “3” means that a country 24
has achieved substantial progress in developing the capacity for
effective prudential supervision, including procedures for the
resolution of bank insolvencies, and in establishing hardened
budget constraints on banks by eliminating preferential access to
concessionary refi nancing from the central bank.
Since 2009 banks have disclosed their fi nancial statements in 25
accordance with International Financial Reporting Standards
(IFRS). This has prompted some changes to the composition and
structure of the positions in this table.
Table 11 The former Yugoslav Republic of Macedonia: structure of the banking sector
2002 2003 2004 2005 2006 2007 2008 2009
EBRD index of banking sector reform 1) 2.7 2.7 2.7 2.7 2.7 2.7 3.0 3.0
Number of banks (foreign-owned) 20 (7) 21 (8) 21 (8) 20 (8) 19 (8) 19 (11) 18 (14) 18 (14)
Number of banks per 100,000 inhabitants 1.04 0.92 0.83 0.77 0.83 0.94 0.89 0.89
Assets of private banks Percentage of total assets 98.0 98.2 98.1 98.4 98.4 98.6 98.8 98.6
Assets of foreign banks Percentage of total assets 44.0 47.0 47.3 51.3 53.2 85.9 93.1 93.3
Assets of the three largest banks Percentage of total assets 64.0 66.9 66.8 66.1 66.1 67.1 66.1 67.5
Herfi ndahl-Hirschmann index 2) 1,667 1,842 1,685 1,607 1,595 1,625 1,579 1,637
Sources: EBRD and NBRM.1) Reform progress ranges from 1 (little progress beyond the establishment of a two-tier system) to 4+ (standards and performance norms of advanced industrial economies). 2) Sum of the squared asset shares of individual banks. The index ranges between 0 and 10,000. Below 1,000 it suggests a non-concentrated sector; above 1,800 it is highly concentrated.

31ECB
Occasional Paper No 115
July 2010
2 THE FORMER
YUGOSLAV REPUBLIC
OF MACEDONIATable 12 The former Yugoslav Republic of Macedonia: asset structure of the banking sector
2002 2003 2004 2005 2006 2007 2008 2009
Commercial bank (net) assets Percentage of GDP 1) 38.2 41.7 44.5 49.4 56.4 63.1 62.9 66.0
Total domestic claims Percentage of total assets 56.4 57.1 59.1 63.2 67.5 73.7 80.8 72.6
Claims on domestic MFIs Percentage of total assets 6.3 9.0 7.6 11.1 10.7 13.9 10.0 8.7
Claims on domestic non-banks Percentage of total assets 50.1 48.1 51.4 52.1 56.8 59.9 70.8 63.9
of which: group impairment
(general provisions for credit risk) Percentage of total assets … … … … … … … -0.3
of which:Claims on general government Percentage of total assets 8.6 6.0 5.9 5.0 7.4 5.6 3.8 4.8
Claims on domestic households and enterprises Percentage of total assets 41.5 42.1 45.5 47.1 49.4 53.9 66.7 59.3
of which:Claims on domestic enterprises Percentage of total assets 35.6 33.7 33.5 32.7 32.6 33.4 40.6 35.4
Claims on domestic households Percentage of total assets 5.9 8.4 12.0 14.4 16.8 20.5 26.0 23.9
Money market fund shares Percentage of total assets
External assets Percentage of total assets 31.4 28.2 28.1 24.2 20.6 15.5 8.8 10.2
Claims on domestic households
Percentage of total claims
on households and enterprises 14.3 19.9 26.5 30.6 34.0 38.1 39.1 40.3
Loans-to-claims ratio for domestic nonbanks 79.8 81.8 86.1 86.8 85.1 88.2 92.6 91.6
of which:Loans-to-claims ratio for general government 18.6 0.7 7.9 2.6 3.0 3.1 4.6 1.0
Loans-to-claims ratio for domestic households
and enterprises 92.4 93.2 96.3 95.8 97.4 97.6 98.0 99.0
Sources: NBRM and State Statistical Offi ce.Note: Since 2009 banks have disclosed their fi nancial statements in accordance with IFRS, which has led to changes in the table’s composition and structure. 1) For 2009, estimated GDP has been used.
Table 13 The former Yugoslav Republic of Macedonia: liability structure of the banking sector
2002 2003 2004 2005 2006 2007 2008 2009
Deposits of MFIs Percentage of total liabilities 2.7 1.8 0.9 1.6 2.0 2.0 2.3 0.6
Deposits of domestic non-banks Percentage of total liabilities 57.8 64.0 67.1 66.8 68.2 70.0 70.4 71.5
of which:Deposits of general government Percentage of total liabilities 2.8 2.1 1.4 1.2 1.0 0.6 0.9 0.5
Deposits of households and enterprises Percentage of total liabilities 55.1 61.8 65.6 65.5 67.2 69.4 69.5 71.1
Money market fund shares Percentage of total liabilities 0.0 0.0 0.0 0.0 0.0 0.0 0.0 0.0
Debt securities issued Percentage of total liabilities 0.0 0.0 0.0 0.0 0.0 0.1 0.4 0.3
Capital and reserves Percentage of total liabilities 20.7 19.1 17.5 15.9 13.3 11.4 11.5 11.4
External liabilities Percentage of total liabilities 12.8 9.3 8.5 10.2 9.7 10.3 9.4 10.6
of which:Parent entities non capital instruments
(deposits, loans, subordinated and hybrid
capital instruments) … … … … 39.5 40.5 51.6 60.1
Remaining liabilities (provisions for off-balance
sheet liabilities, subordinated and hybrid capital
instruments and other liabilities) Percentage of total liabilities 3.4 2.6 3.6 3.1 4.0 3.3 3.4 2.6
Remaining liabilities
(short-term borowings up to one year) Percentage of total liabilities 1.0 1.8 0.2 0.1 0.1 0.1 0.3 0.3
Remaining liabilities
(long-term borrowings over one year) Percentage of total liabilities 1.6 1.4 2.2 2.3 2.7 2.7 2.3 2.7
Memorandum items:Domestic non-banks’ claim-to-deposit ratio 89.8 81.8 83.4 84.1 88.6 90.3 102.7 89.3
General government’s claim-to-deposit ratio 322.0 303.6 450.3 433.0 777.5 914.9 430.7 1,010.1
Households’ & Enterprises’ claim-to-deposit ratio 78.1 74.2 75.4 77.5 78.2 82.1 98.0 83.5
Source: NBRM.

32ECB
Occasional Paper No 115
July 2010
The banking sector has a solid funding structure.
Domestic non-bank deposits represented 71.1%
of total liabilities at the end of December 2009,
and capital and reserves 11.4% (see Table 13).
External liabilities stood at 10.6% of total
liabilities, almost unchanged since 2007. Non-
equity instruments (e.g. deposits, subordinated
and hybrid capital instruments, etc.)
extended by parent banks represented 60% of
external liabilities, up from 41% in 2007. Hence,
the degree of dependence on external and, in
particular, parent funding remains limited.
BANKING SECTOR PROFITABILITY
The adverse macroeconomic environment in
the aftermath of the Lehman Brothers episode
impacted negatively on the profi tability and
effi ciency of the banking sector. Already in 2008
a moderate decline in return on average assets
and return on average equity was recorded,
while in the course of 2009 profi tability
indicators halved to 0.7% and 5.6% respectively
(see Table 14). The main driver behind this
deterioration was the increase in loan loss
provisions, which represented 27% of total
operating income in 2009. Revenue generation
was also affected, as indicated by the moderate
increase in the cost-to-income ratio in the last
couple of years. Nevertheless the banking sector
in the former Yugoslav Republic of Macedonia
has signifi cantly improved its performance
compared with the period 2000-04.
Net interest income has traditionally been the
key driver of revenues, generating 65% of total
operating income in 2009. The net interest
margin (i.e. net interest income over average
total assets) increased somewhat in 2009 to reach
4.1%, providing a fi rst line of defence against
potential loan losses. It is noteworthy that the
interest rate spread (i.e. the spread between loans
and deposits) has widened in foreign exchange
and foreign exchange clause loans since 2006,
the difference increasing substantially in 2009.
Table 14 The former Yugoslav Republic of Macedonia: profitability of the banking sector
2002 2003 2004 2005 2006 2007 2008 2009
Total operating income 1) Percentage of total income 75.6 72.2 82.7 83.5 93.3 93.5 94.6 99.5
of which:Net interest income Percentage of operating income 47.0 48.7 52.0 56.3 59.6 59.7 61.9 65.5
Net non-interest income Percentage of operating income 53.0 51.3 48.0 43.7 40.4 40.3 38.1 34.5
General administrative expenses Percentage of operating income 90.9 87.0 74.5 66.6 62.0 58.4 62.1 62.8
Operating expenses
(excluding loan loss provisions) Percentage of operating income
Loan loss provision expenses Percentage of operating income 30.9 39.8 34.7 28.6 15.5 17.3 16.9 27.0
Income tax Percentage of operating income 1.3 1.4 2.5 2.8 2.8 2.2 3.2 0.3
After-tax profi t/loss Percentage of operating income 6.4 7.6 8.1 17.9 26.7 28.8 23.2 10.3
Net interest income Percentage of average assets 2.8 2.9 3.5 3.9 4.0 3.8 3.8 4.1
Net non-interest income Percentage of average assets 3.2 3.0 3.2 3.0 2.7 2.6 2.4 2.2
Interest rate spread
(total loans – total deposits) Percentage points
Denar spread 2) Percentage points ... ... ... 6.9 6.5 4.6 3.7 3.2
Foreign exchange spread 2) Percentage points ... ... ... 6.5 6.7 6.5 4.2 4.2
Denar with foreign exchange clause spread 2) Percentage points ... ... ... 6.8 7.0 5.6 4.0 5.7
Return on average assets 3) Percentage 0.4 0.5 0.6 1.2 1.8 1.8 1.4 0.7
Return on average equity 3) Percentage 2.0 2.3 3.1 7.5 12.3 15.2 12.5 5.6
Source: NBRM.1) Data revised to include extraordinary income in total income. 2) Figures for 1999-2004 are incompatible with data from 2005 onwards owing to a change in methodology for calculating banks’ weighted interest rates. 3) 2009 data calculated using pre-tax profi ts.

33ECB
Occasional Paper No 115
July 2010
2 THE FORMER
YUGOSLAV REPUBLIC
OF MACEDONIANON-BANK FINANCIAL INSTITUTIONS
The fi nancial sector of the former Yugoslav
Republic of Macedonia continues to be dominated
by the banking sector, which accounted for
89% of total fi nancial sector assets in 2008.26
Nonetheless, the non-bank fi nancial sector
experienced far-reaching structural changes in
2006-08. The share of insurance companies in
total fi nancial sector assets shrank considerably
to 4.2% (from 7.5% in 2006), mainly on account
of the reduction in the sector’s assets in 2007.
The share of leasing companies doubled (3.1%
in 2008 against 1.4% in 2006), while pension
funds, launched only in 2006, expanded to 1.8%
of total assets. The share of savings banks (1.2%)
remained fl at, while brokerage houses, pension
fund management companies and investment
funds together accounted for around 0.4% of
fi nancial sector assets.
Like the banking sector, the non-bank fi nancial
system is highly concentrated and largely foreign-
owned (except for brokerage houses). However,
concentration decreased in most segments in
2006-08, a trend which is expected to continue
in the near future (e.g. the number of leasing
companies doubled in 2008). Certain activities
remain underdeveloped (e.g. life insurance
represents only 4% of gross insurance premiums;
real estate leasing represents only 1.5% of
the total value of active leasing agreements).
Cross-sector ownership is at a relatively low
level. The business ties between banks and non-
bank fi nancial institutions consist of the deposits
of the non-bank fi nancial institutions placed with
banks, which in turn constitute only 3.4% of the
total deposits of the banking sector.
2.3 RISKS AND SHOCK-ABSORBING CAPACITIES
CREDIT RISK
Credit risk is the key risk that banks in the
former Yugoslav Republic of Macedonia
are facing – as already mentioned, the loan
book represents a very signifi cant part of their
balance sheet. In addition, since 2004 the
former Yugoslav Republic of Macedonia has
experienced a prolonged credit boom, with
private sector credit recording a year-on-year
growth of 24-39% (see Table 15). In 2009 a
deceleration in credit growth was recorded,
with private sector credit growth declining
to 8.9% year on year (from 34.6% in 2008).
This deceleration is not necessarily negative from
a fi nancial stability perspective. Previous growth
rates were not sustainable in the long term and
might have raised concerns over asset quality.
Moreover, there has been no credit crunch,
considering that credit growth remains positive;
more importantly, credit growth has only halved
in real terms (since infl ation turned negative
in 2009).
The deceleration in credit growth has been more
pronounced for household loans. Their annual
growth rate declined to 2.6%, while in the period
2004-08 it was in the range of 37-64%. This
development can be partly explained by the
introduction of prudential measures. Firstly, in
March 2008 the risk weights for calculating
banks’ capital requirements on credit cards and
current account overdraft exposures were
increased to 125% (from 100%). The share of
these types of claims in total household loans is
important: credit card balances represent around
one-third and overdrafts 11%. As a result of the
aforementioned measure, a signifi cant slowdown
in the growth of credit card balances has been
recorded, while the impact on overdraft balances
has been muted. Secondly, quantitative
restrictions on household credit growth were
applied – basically aiming at limiting the
cumulative growth rate of household credit at
18.1% between May and December 2008
and at 11.3% for the whole of 2009.27
This measure was abandoned in 2010, by which
time household credit growth had already
decelerated signifi cantly.
Overall indebtedness of households and
non-fi nancial enterprises increased in 2008 but
levelled off in 2009. Household debt (including
Data on the overall fi nancial sector were available only up to 26
2008 by the cut-off date.
In particular, if the household credit growth rate of a bank or 27
savings house exceeded the monthly growth rate set by the
NBRM at the end of a specifi ed month, the bank or savings house
then had to place a compulsory deposit with the central bank.

34ECB
Occasional Paper No 115
July 2010
Table 15 The former Yugoslav Republic of Macedonia: selected banking sector stabilityindicators
2002 2003 2004 2005 2006 2007 2008 2009
Credit riskCredit growth Percentage, year on year 9.0 8.4 23.7 20.1 30.9 38.7 34.3 4.4
Credit growth to the private sector Percentage, year on year 10.4 15.6 26.8 23.4 31.0 39.0 34.6 8.1
Real credit growth to the private sector Percentage, year on year 8.4 14.2 27.3 22.8 26.9 35.9 24.3 8.9
Credit growth to households Percentage, year on year 47.5 59.5 63.2 40.8 42.9 56.2 37.4 2.6
Mortgage credit (housing loans) Percentage, year on year ... ... 60.4 37.0 52.2 63.8 45.0 7.6
Non-performing loans Percentage of total loans 23.1 23.4 19.3 16.1 11.8 7.8 6.7 9.0
of which:Non-performing loans
of households
Percentage of total household
loans 10.7 7.2 6.8 6.5 5.1 4.2 5.3 8.2
Non-performing loans
of corporates
Percentage of total corporate
loans 25.9 26.0 20.4 18.8 14.3 9.3 7.5 9.6
Non-performing loans
in domestic currency
Percentage of total domestic
currency loans 23.8 24.0 19.8 17.7 13.4 8.6 7.6 8.5
Non-performing loans
in foreign currency 1)
Percentage of total foreign
currency loans 19.5 19.4 10.6 7.1 5.3 4.1 3.9 11.0
Foreign currency credit Percentage of total private
sector credit 16.8 19.7 20.0 25.4 26.3 24.6 22.9 22.6
Foreign currency deposits Percentage of total deposits 52.3 52.7 54.4 55.7 52.6 44.5 48.1 56.2
Market riskForex risk
Open foreign exchange position 1) Percentage of total assets 11.5 10.4 8.5 7.7 6.0 4.5 3.3 1.6
Stock market riskRatio of shares and participations
to total assets (equity holdings) 1.7 1.3 1.1 1.1 0.8 0.6 0.5 0.2
Liquidity riskRatio of liquid assets 2) to total assets 14.7 13.5 12.5 15.0 18.0 20.9 16.9 20.6
Ratio of total loans to total deposits 67.0 64.4 69.7 70.3 72.9 74.1 92.8 92.5
Ratio of liquid assets 2) to short-term
liabilities 23.2 20.5 18.5 21.7 25.2 28.2 24.0 30.1
Shock-absorbing factors
Loan loss provisions
Percentage of non-performing
loans 90.4 91.4 102.7 110.8 113.6 132.6 133.5 112.6
of which:Loan loss provisions
for household loans 3)
Percentage of non-performing
loans to the household sector … … 102.7 100.4 116.3 125.6 104.9 91.7
Loan loss provisions
for corporate loans 4)
Percentage of non-performing
loans to the corporate sector … … 112.7 108.4 108.9 127.9 140.0 117.6
Non-performing loans net
of provisions for the overall credit
exposure of the banking sector 5) Percentage of capital 4.6 0.0 -4.5 -5.7 -6.0 -11.3 -11.3 -5.7
Capital adequacy ratio 28.1 25.8 23.0 21.3 18.3 17.0 16.2 16.4
Memorandum items:Number of banks (foreign-owned) 20 (7) 21 (8) 21 (8) 20 (8) 19 (8) 19 (11) 18 (14) 18 (14)
Assets of foreign-owned banks Percentage of total assets 44.0 47.0 47.3 51.3 53.2 85.9 93.1 93.6
Source: NBRM.1) The data series has been revised. Before the revision the open foreign exchange position was calculated as an average open foreign exchange position of the banking sector in the last month of each year. In this series the open foreign exchange position for each year represents the open foreign exchange position of the banking sector on 31 December. 2) The data series has been revised. Liquid assets = cash in vaults + deposits with the NBRM + central bank bills + treasury bills (liquid assets exclude reserve requirements with the NBRM, deposits and correspondent accounts with domestic banks, but include correspondent accounts with foreign banks). Total assets exclude assets with domestic banks and short-term liabilities exclude short-term liabilities to domestic banks. 3) Refers to “loan loss provisions for credit exposure to households” (the credit exposure includes: performing and non-performing loans, regular interest, off-balance sheet items and other claims). 4) Refers to “loan loss provisions for credit exposure to corporates” (the credit exposure includes: performing and nonperforming loans, regular interest, off-balance sheet items and other claims). 5) Refers to “own funds” according to the Decision on the methodology for determining capital adequacy (“Offi cial Gazette of the Republic of Macedonia” 159/2007, 32/2008, 31/2009, 96/2009).

35ECB
Occasional Paper No 115
July 2010
2 THE FORMER
YUGOSLAV REPUBLIC
OF MACEDONIAloans extended by leasing companies) reached
17.7% of GDP and 30.7% of gross disposable
income in 2008 28 (see Table 16). The bulk of
this debt (around 80%) has been accrued for
consumption purposes. Non-fi nancial enterprises
debt reached 26.8% of GDP and 173% of
corporate bank deposits. However, indebtedness
levels remain low by international comparison.
Indeed, debt servicing costs still appear to be
manageable. Implicit interest payments for
households stood at 2.9% of gross disposable
income, while for non-fi nancial enterprises they
represented 1.8% of GDP. Nonetheless, it should
be borne in mind that many borrowers have no
prior experience with fi nancial products and
lack any credit history. This is particularly true
for households and small and medium-sized
enterprises (SMEs).
Indirect credit risk through credit exposure
with a foreign currency component is material.
Foreign currency-denominated and indexed
loans represented 58.5% of total private sector
credit in 2009 (up from 54.7% in 2007). Many
Indebtedness data for 2009 are incomplete.28
Table 16 The former Yugoslav Republic of Macedonia: selected macro-prudential indicators – domestic debt
2002 2003 2004 2005 2006 2007 2008 2009 2)
Householdsto banks and savings houses
Debt Percentage of GDP 2.7 4.1 6.2 8.0 10.6 13.5 16.7 16.6
Debt Percentage of gross disposable income 4.0 5.7 9.1 12.4 16.3 22.6 29.0 ...
Debt Percentage, year on year 44.6 58.1 59.8 39.3 43.5 44.4 39.1 1.6
Implicit interest payments Percentage of gross disposable income 0.6 0.7 1.0 1.5 1.7 2.2 2.9 ...
+ to leasing companiesDebt Percentage of GDP ... ... 6.7 8.7 11.5 14.5 17.7 ...
Debt Percentage of gross disposable income ... ... 9.7 13.4 17.5 24.3 30.7 ...
Debt Percentage, year on year ... ... ... 40.7 43.1 44.2 37.0 ...
Non-fi nancial enterprisesto banks and savings houses
Debt Percentage of GDP 13.2 14.3 15.7 16.5 19.0 21.5 25.3 26.6
Debt Percentage of corporate bank deposits 173.8 143.9 135.3 137.7 129.1 133.9 163.2 196.9
Debt Percentage, year on year -2.2 11.2 16.0 13.7 24.6 29.2 32.0 7.2
Implicit interest payments Percentage of GDP 1.4 1.2 1.1 1.2 1.3 1.5 1.8 2.1
+ to leasing companiesDebt Percentage of GDP ... ... 16.1 17.1 19.7 22.8 26.8 ...
Debt Percentage of corporate bank deposits ... ... 138.6 142.4 134.1 141.6 173.3 ...
Debt Percentage, year on year ... ... ... 14.9 25.2 31.6 32.5 ...
Total non-fi nancial private sectorto banks and savings houses
Debt Percentage of GDP 15.9 18.4 21.9 24.6 29.6 35.0 42.0 43.2
Debt Percentage, year on year 3.5 19.1 25.8 21.0 30.8 34.7 34.7 5.0
+ to leasing companiesDebt Percentage of GDP ... ... 22.7 25.8 31.2 37.3 44.5 ...
Debt Percentage, year on year ... ... ... 22.5 31.2 36.2 34.3 ...
Central government 1)
Debt Percentage of GDP 15.7 14.5 13.6 12.9 12.8 9.5 7.2 7.4
Debt Percentage, year on year -7.8 -5.0 -0.6 2.1 7.4 -14.7 -15.5 5.2
Interest paid Percentage of GDP 0.5 0.4 0.4 0.4 0.4 0.3 0.3 0.2
Total non-fi nancial sectorDebt Percentage of GDP 31.6 32.9 35.6 37.5 42.4 44.6 49.1 50.6
Debt Percentage, year on year -2.5 7.2 14.2 13.8 22.8 19.8 24.0 5.0
Memorandum items:Total external debt Percentage of GDP … … 48.1 54.0 49.3 49.1 50.9 57.8
Total private external debt Percentage of GDP … … 20.1 22.2 24.3 30.8 33.8 37.8
Sources: NBRM, Ministry of Finance and State Statistical Offi ce.1) Total domestic public debt of central government. 2) For 2009, estimated GDP has been used.

36ECB
Occasional Paper No 115
July 2010
factors have contributed to the large share of
foreign currency-denominated and indexed
loans, including the fact that foreign currency-
denominated and indexed deposits account for
60.9% of the total. Moreover, the interest rate
differential for loans in domestic and foreign
currency is high, rendering the latter attractive
to domestic borrowers. The dominant role of
foreign-owned banks has further contributed to
the proliferation of foreign currency-denominated
and indexed loans. Last, but not least, prudential
rules for management of the banks’ direct
foreign exchange position provide an incentive
for them to offl oad their foreign currency to their
customers, transforming the exchange rate risk
into indirect credit risk. The share of foreign
currency-denominated and indexed loans is
higher for non-fi nancial enterprises (66.6% of
total non-fi nancial enterprises loans) than for
households (45.7% of total household loans).
Hence, at fi rst sight it seems that some of the
foreign currency loans have been extended
to unhedged borrowers. There are, however,
mitigating factors at work. Many households
have signifi cant income from remittances, while
many non-fi nancial enterprises have signifi cant
export revenues. In addition, as already
mentioned a signifi cant share of deposits is in
foreign currency, so some of the foreign currency
borrowers may also have deposits in foreign
currency. More importantly, the exchange rate
regime (a soft peg) protects borrowers in foreign
exchange from extreme short-term fl uctuations
in the exchange rate and, correspondingly, in
their debt servicing cost. That said, safeguarding
confi dence in the sustainability of the peg should
be a key anchor of monetary and fi scal policy.
The feeble macroeconomic environment has
taken its toll on the banks’ asset quality.
The ratio of non-performing loans increased to
9.0% in 2009 from 6.7% in 2008.29 This increase
in the NPL ratio in the course of 2009 reversed a
long-term downward trend that had started in
2001. Both household and non-fi nancial
corporate loans were affected, with the
respective NPL ratios reaching 8.2% and 9.6%
(see Table 2.6). Interestingly, the deterioration
was more pronounced for foreign currency-
denominated and indexed loans, where the NPL
ratio almost tripled in a year (11.0% in 2009
against 3.9% in 2008), returning to levels last
seen in 2004. This deterioration is concentrated
in foreign exchange-denominated loans to non-
fi nancial enterprises and could be partly
attributed to the signifi cant decline in export
revenues (as a result of reduced metal prices and
export demand).30 Concurrently, the increase in
the NPL ratio for loans in domestic currency
was moderate (8.5% in 2009 compared with
7.6% in 2008). Overall, the deterioration in asset
quality was widespread across the banking
system, but tended more to affect banks with
relatively low NPLs, as refl ected in the frequency
distribution of the NPL ratio. Specifi cally, the
inter-quartile range of the NPL ratio narrowed
to 6.8-17.7% in 2009 from 3.9-21.7% in 2008.
MARKET AND LIQUIDITY RISKS
Market risk remains limited and its importance
has decreased over time. Given that most
bank loans are issued with de facto variable
interest rates, interest rate risk is limited in the
banks’ balance sheets. For example, only 11%
of household loans have a fi xed interest rate.
That said, as exposure to interest rate fl uctuations
is largely passed on to the borrowers, this
represents an additional source of indirect credit
risk. The open foreign exchange position of
banks declined signifi cantly to only 1.6% of total
assets in 2009, compared with 4.5% in 2007
(see Table 2.6). Nonetheless, the high degree of
foreign currency usage in both deposits and loans
renders the careful monitoring of foreign currency
risk necessary. This is particularly true in times
of turbulence in the global fi nancial markets.
For example, at the end of 2008 the NBRM adopted
a decision which introduced the possibility for
domestic banks to hold foreign currency deposits
with the NBRM itself instead of placing them with
foreign banks abroad. This measure was aimed
at limiting the exposure of banks to counterparty
Non-performing loans are classifi ed in the D and E risk category 29
according to the NBRM’s classifi cation, and include loans not
collected for more than 90 days after the maturity date.
The deterioration in the asset quality of foreign currency loans 30
cannot be attributed to exchange rate volatility, since the
exchange rate was stable.
37ECB
Occasional Paper No 115
July 2010
2 THE FORMER
YUGOSLAV REPUBLIC
OF MACEDONIArisk when placing assets abroad. Banks’ exposure
to equity price risk is very limited, as the ratio of
shares and participations to total assets has been
historically low and declined even further to only
0.2% in 2009.
Liquidity risk is also contained. Deposits
represent the predominant funding source, with
the loan-to-deposit ratio standing at 92% in 2009.
Nonetheless, there is considerable dispersion
among banks. Around one-quarter of banks have
a loan-to-deposit ratio that exceeds 125%.
Moreover, in the last quarter of 2008 banks
experienced tightened liquidity conditions and
recorded an increase in the maturity and currency
mismatch of their assets and liabilities. Against
this backdrop, the NBRM adopted a decision on
liquidity risk management, which entered into
force in the fi rst quarter of 2009. Inter alia, the
new regulation introduced the requirement for
banks to maintain a minimum liquid assets ratio.31
As a result, the ratio of liquid assets 32 to total
assets and to short-term liabilities improved
somewhat in the course of 2009.
SHOCK-ABSORBING FACTORS
The banking sector entered the crisis with
a strong capital buffer. At the end of 2008
the capital adequacy ratio stood at 16.2%,
comfortably above the minimum required level
(8%). In 2009 it strengthened further to reach
16.4%, partly on account of the deceleration
of credit growth (loans have a high risk weight
relative to other assets). In addition, as exhibited
by the frequency distribution of the capital
adequacy ratio, most banks have a strong capital
buffer. Specifi cally, three out of four banks have
a capital adequacy ratio above 15% or so and
none of the banks had a capital adequacy ratio
below the minimum requirement. Moreover,
the leverage ratio (i.e. total assets over total
accounting equity) stood at 8.4 for the sector as a
whole, a very satisfactory level by international
standards. Retained earnings have been the most
important source of capital generation, followed
by subordinated instruments through parent
entities. Financing through equity issuance is of
very limited relevance.
The banking sector also had a signifi cant
provisioning buffer. At the end of 2008 the
coverage ratio stood at 133.5%, although in
2009 it declined to 112.6%, still above 100%
(see Table 15). Nonetheless, the frequency
distribution of the coverage ratio shows that
some banks are relatively under-provisioned,
with one out of four banks having a coverage
ratio below 77%. Still, these deviations should
be regarded with caution since the appropriate
coverage ratio depends on the composition and
risk profi le of the loan book of each individual
bank. In any case, provisioning levels remain
high by international standards, acting as a
second layer of defence against losses. This is
underpinned by the fact that the share of net
(i.e. after provisions) non-performing loans
as a percentage of prudential own funds is
negative (-5.7%).
Last but not least, profi t indicators reached
record highs from a very low level in 2006-08
(see Table 14). This is a positive development
since profi ts are the fi rst line of defence against
expected and unexpected losses. Banks followed
conservative dividend policies over this period,
with retained earnings representing more than
two-thirds of after-tax profi ts, contributing
to the strengthening of the capital base. As
mentioned earlier, however, the capital adequacy
ratio declined owing to the rapid increase in
risk-weighted assets. More importantly, returns
on equity and on assets halved in 2009, mainly as
a consequence of increased impairment charges.
In addition, certain banks recorded losses.
The minimum liquidity ratio equals 1, and is calculated as a ratio 31
between (i) assets and liabilities that mature in the next 30 days
(separately for assets and liabilities in domestic and in foreign
currency) and (ii) assets and liabilities that mature in the next
180 days (separately for assets and liabilities in domestic and in
foreign currency). The concentration of deposits is an additional
criterion for the calculation of relevant liabilities.
Liquid assets are defi ned as cash in vaults, deposits with the 32
NBRM, central bank bills and treasury bills (liquid assets
exclude reserve requirements with the NBRM, deposits and
correspondent accounts with domestic banks, but include
correspondent accounts with foreign banks). Total assets exclude
assets with domestic banks, and short-term liabilities exclude
short-term liabilities to domestic banks.

38ECB
Occasional Paper No 115
July 2010
According to the results of regular stress tests
based on different shock scenarios, the banking
system of the former Yugoslav Republic of
Macedonia is relatively resilient. The various
stress test simulations show that even in the case
of simultaneous materialisation of credit,
currency and interest rate risk of a severe nature,
the capital adequacy of the banking sector would
not fall below the minimum requirement of 8%.
This simulation assumes a simultaneous increase
of 50% in the credit exposure of the riskiest
categories of loans (C, D and E risk categories
according to the NBRM classifi cation), a 20%
depreciation in the denar’s value against the
euro and the US dollar, and an increase of
5 percentage points in domestic interest rates.33
2.4 CONCLUDING ASSESSMENT
AND POLICY IMPLICATIONS
The banking system in the former Yugoslav
Republic of Macedonia has so far weathered
the global fi nancial and economic crisis quite
successfully, limiting its impact on the domestic
economy. In the case of the former Yugoslav
Republic of Macedonia the transmission of the
global crisis occurred through the real sector,
since the banking sector was not exposed to
“toxic” assets and was not materially affected by
the disruption of the global money and capital
markets, as it is not dependent on external
fi nancing. The resilience of the banking sector
has been underpinned by signifi cant capital and
provisioning buffers, as well as by its strong
deposit base.
The macroeconomic outlook is favourable, with
the fi rst signs of recovery already observed in
late 2009. To the extent that advanced economies
do not experience a double-dip recession, the
anticipated return to positive real GDP growth
will support bank revenue growth and mitigate
credit risk. Lower than anticipated growth in
the south-eastern European region remains a
downside risk.
Fiscal consolidation would contribute to the
maintenance of a signifi cant foreign currency
reserves buffer, which in turn would underpin
international investors’ confi dence in the
long-term sustainability of the currency peg.
Concurrently, the increased focus on sovereign
risk and its interplay with fi nancial sector
risks has raised market sensitivity regarding
fi scal vulnerabilities worldwide. Hence, the
fi nancial stability implications of fi scal defi cit
and debt developments might merit a less
expansionary fi scal policy than otherwise would
be appropriate at this phase of the economic cycle.
The aforementioned considerations also apply
to the monetary policy stance. It should be
highlighted that as economic recovery gains
pace, policy-makers will enjoy higher degrees of
freedom, since investors and domestic economic
agents will feel increasingly reassured.
Turning to the banking sector, the key
challenge remains credit risk. A persistently
high NPL ratio is a structural weakness that
needs to be addressed in the medium term.
To this end providing further incentives for loan
restructuring or write-offs might be benefi cial.
In any case the banking sector as a whole remains
sound and resilient and seems to have avoided
the excesses that have been observed in some
other emerging European countries. Financial
deepening in the former Yugoslav Republic of
Macedonia is expected to continue contributing
to economic growth and social welfare.
For a macro stress-testing exercise, see section 4.2.33

39ECB
Occasional Paper No 115
July 2010
3 TURKEY
3 TURKEY
3.1 THE MACROECONOMIC ENVIRONMENT
As a consequence of the global economic and
fi nancial crisis, the Turkish economy slowed
down considerably in 2008 and entered a
recession in 2009 after a period of rapid
growth during previous years. Real GDP
growth decelerated to 0.9% in 2008 and fell
to -4.7% in 2009 (see Table 17). Falls in private
investment and consumption contributed
strongly to this decline, whereas public
consumption and investment increased and net
exports also contributed positively, as Turkish
exporters redirected part of their exports to
higher-growth regions.34 The Turkish economy
is expected to grow again at a rate of 4.7%
in 2010 and 4.5% in 2011.35
The infl ation rate fell to 6.3%, down from
10.4% in 2008, a very low rate in comparison
with those observed during previous years.
Currently the Central Bank of the Republic
of Turkey (CBRT) sees no need for monetary
policy tightening in the short term, especially in
the context of the lacklustre growth of credit to
the private sector, even if rate hikes are expected
in the second half of the year. The CBRT has
lowered the overnight borrowing rate on several
occasions since October 2008 (when it stood at
16.75%) to 6.5% (November 2009).
The current account defi cit, previously a notable
vulnerability of the Turkish economy, has
signifi cantly improved to -2.2% of GDP owing
to reduced domestic consumption and
investment, as well as falling energy prices. It is
expected to widen again to -4.5% in 2010. Its
fi nancing should benefi t from improved external
fi nancing conditions and the expected recovery
in foreign direct investment (FDI). Turkey,
however, remains vulnerable to a deterioration
in external fi nancing in view of its gross external
debt position of 44.8% of GDP in 2009.36 The
fi nancing structure of the current account defi cit
has changed as a result of the crisis. Before the
crisis, the defi cit was mainly fi nanced by
increasing long-term private sector external
debt. In the meantime, although decreasing in
absolute terms, FDI has become the most
important fi nancing item. In addition, external
public borrowing has increased.
As in many other countries, measures to sustain
economic growth and falling tax revenues have
caused the fi scal defi cit to increase substantially.
The Turkish general government defi cit is
As of end-January 2010, however, western Europe still accounted 34
for around 44% of Turkish exports.
Based on AMECO projections, spring 2010.35
Nevertheless, the external debt ratio is relatively low compared 36
with some other emerging market economies. Moreover, gross
external debt decreased in nominal terms in 2009, although
it worsened as a ratio to GDP due to the pronounced drop in
nominal GDP.
Table 17 Turkey: main macroeconomic indicators
Description 2003 2004 2005 2006 2007 2008 2009 2010 1) 2011 1)
Real GDP growth Percentage, period average 5.3 9.4 8.4 6.9 4.7 0.9 -4.7 4.7 4.5
Infl ation
Percentage, period average,
harmonised defi nition 25.3 10.1 8.1 9.3 8.8 10.4 6.3 9.0 7.8
Policy rate Percentage, end of period 26.0 18.0 13.5 17.5 15.8 15.0 6.5 … …
Nominal effective exchange rate Index (2001 = 100), period average 66.1 64.6 67.8 63.3 65.0 62.5 55.6 … …
Current account balance Percentage of GDP -2.5 -3.7 -4.6 -6.1 -5.9 -5.7 -2.2 -4.5 -5.4
FDI Percentage of GDP 0.4 0.5 1.9 3.6 3.1 2.1 1.0 1.5 1.7
Gross external debt Percentage of GDP 47.5 41.0 35.2 39.2 38.4 38.1 44.8 40.2 41.1
General government balance Percentage of GDP -10.4 -4.4 -0.6 -0.6 -2.1 -2.9 -6.2 -4.0 -3.5
General government gross debt Percentage of GDP 67.4 59.2 52.3 46.1 39.4 39.5 45.5 44.5 44.3
Central government balance Percentage of GDP -10.0 -3.9 0.0 0.1 -1.7 -2.4 -5.6 -3.4 -3.0
Unemployment rate Percentage 10.5 10.8 10.6 10.2 10.3 11.0 14.0 13.9 13.4
Sources: Eurostat (AMECO), Haver Analytics, IMF, national sources and ECB calculations.1) Forecasts.

40ECB
Occasional Paper No 115
July 2010
estimated to have reached 6.2% of GDP in 2009,
a level markedly higher than in previous years.
The primary balance, which has continually
decreased since 2005, fell to only 0.1% in 2009
from 3.5% in 2008. The general government
gross debt is estimated to have surged to
45.5% in 2009, up from 39.5% in 2008.
However, forecasts show only a stabilisation
in the next two years. On 16 September 2009
the Turkish government presented a
medium-term programme aimed at gradually
reducing the central government defi cit to 3.2%
of GDP in 2012. The programme comprises
a signifi cant number of policies, including
the prioritisation of public investments and
expenditures, an increase in the effi ciency of
health expenditures and social aid, and reduced
tax loss and fraud. The programme is also aimed
at improving education, enhancing the effi ciency
of the Credit Guarantee Fund (see below) and
fostering the effi ciency of the judicial system.
Rating agencies welcomed the medium-term
programme and the relative resilience of the
Turkish economy during the crisis. In fact, the
Republic of Turkey’s issuer rating was recently
upgraded (to one or two notches below investment
grade) by the three major rating agencies.
3.2 THE FINANCIAL SYSTEM: STRUCTURE
AND DEVELOPMENTS
THE STRUCTURE OF THE BANKING SYSTEM
The Turkish banking sector experienced two
signifi cant crises at the beginning of the last
decade. In 2000 volatility in international capital
markets and deteriorating domestic economic
conditions resulted in signifi cant losses in the
banking system. This in turn triggered signifi cant
capital outfl ows and a sharp fall in international
reserves. In December 2000 the IMF and the
Turkish authorities agreed on a rescue package
in order to avoid the unravelling of the existing
disinfl ation programme. However, as infl ation
did not come down as quickly as predicted and,
in addition, foreign investors withdrew from the
Turkish market owing to the political uncertainty
and fears that the stabilisation policies might
be reversed, the authorities fl oated the Turkish
lira on 22 February 2001 to avoid further
reserve losses.
Following the 2000 and 2001 crises, the Turkish
banking sector went through several structural
transformations, including the restructuring
of state-owned banks, the resolution of banks
transferred to the Savings Deposit Insurance
Fund (SDIF) and the strengthening of privately
owned banks. Since then, concentration in
the banking sector has increased as a result
of liquidations or mergers and acquisitions,
and foreign participation has risen markedly.
This latter trend came to a halt in 2009, with
the share of foreign banks in total assets falling
for the fi rst time since 2003 (see Table 18).
The share of (domestic) privately owned banks
in total assets also decreased in 2009. Hence,
the share of state-owned banks and, to a lesser
extent, participation banks has increased, which
could be explained by the relatively lower
Table 18 Turkey: structure of the banking sector
2002 2003 2004 2005 2006 2007 2008 2009
EBRD index of banking sector reform 1) n.a. n.a. n.a. n.a. n.a. n.a. 3.0 3.0
Number of banks (foreign-owned 2)) 54 (18) 50 (16) 48 (15) 51 (17) 50 (21) 50 (24) 50 (25) 49 (24)
Number of banks per 100,000 inhabitants 0.08 0.07 0.07 0.07 0.07 0.07 0.07 0.07
Assets of private banks Percentage of total assets 56.2 57.0 57.4 58.3 53.2 50.5 50.5 49.6
Assets of foreign banks Percentage of total assets 3.3 3.0 3.5 6.3 13.1 16.1 17.0 15.8
Assets of the four largest banks Percentage of total assets 49.6 51.9 51.1 53.5 51.1 51.1 51.4 52.7
Herfi ndahl-Hirschmann index 3) 883 942 949 935 911 879 886 913
Sources: CBRT, BRSA and EBRD.1) Reform progress ranges from 1 (little progress beyond the establishment of a two-tier system) to 4+ (standards and performance norms of advanced industrial economies). 2) Banks whose controlling shareholders are foreign (51% share or higher); participation banks have been included since 2005.3) Sum of the squared asset shares of individual banks. The index ranges between 0 and 10,000. Below 1,000 it suggests a non-concentrated sector; above 1,800 it is highly concentrated.

41ECB
Occasional Paper No 115
July 2010
3 TURKEY
propensity of private banks to expand their
activities than in previous years. The Turkish
banking sector counts three major state-owned
banks whose privatisation remains on hold on
account of unfavourable global conditions.
THE ASSET AND LIABILITY STRUCTURE
OF THE BANKING SYSTEM
The total assets of the banking sector continued
to grow in 2009, albeit at a slower pace than
in previous years (by approximately 10%),
refl ecting the impact of the economic slowdown.
The crisis also triggered a reversal of the ongoing
transformation of the asset structure of banks.
Since the early 2000s banks had gradually
shifted towards core activities and decreased
their holdings of government securities.
From mid-2008 onwards the share of loans in
total assets started declining to the benefi t of
growing exposures to sovereign securities,
the rising share in total assets of claims
on general government refl ecting a certain
preference of the banking sector for assets with
a lower regulatory risk weight (see Table 19).
At the end of 2009 around one-third of total
assets were securities holdings. Almost all of
these are exposures on the Republic of Turkey,
making these securities portfolios vulnerable to
concentration risk and sovereign risk.
At the end of 2009, 49.8% of bank assets were
loans to domestic non-banks. The loans to the
domestic private sector grew at an annual rate of
7%, sharply below the growth rates observed
during recent years (which varied between 28%
and 61%). Housing and other consumer loans
increased in 2009 37 as a consequence of the
fi scal stimulus package and the general
improvement in expectations. The average
maturity of assets has increased over the past
few years owing to an increasing share of
mortgage loans.
Car loans count as an exception, as their growth rate turned 37
negative despite a lowering of the private consumption tax rates
on the automotive sector.
Table 19 Turkey: asset structure of the banking sector
2002 2003 2004 2005 2006 2007 2008 2009
Commercial bank assets 1) Percentage of GDP 60.7 54.9 54.8 62.7 65.9 69.0 77.1 87.4
Total domestic claims 2) Percentage of total assets 77.7 81.7 83.9 86.9 85.6 90.2 89.8 90.9
Claims on domestic MFIs 3) Percentage of total assets 11.7 10.8 9.4 11.3 9.0 9.4 9.9 8.3
Claims on domestic non-banks 2) Percentage of total assets 66.0 70.9 74.4 75.6 76.6 80.9 79.8 82.6
of which:claims on general government 2) Percentage of total assets 39.0 42.0 41.5 36.4 32.3 31.0 29.2 34.0
claims on domestic households
and enterprises Percentage of total assets 27.0 28.9 32.9 39.2 44.3 49.8 50.7 48.6
of which:claims on domestic enterprises Percentage of total assets 23.8 23.4 24.0 27.3 29.9 32.9 33.9 31.9
claims on domestic households Percentage of total assets 3.3 5.5 8.9 11.9 14.3 16.9 16.7 16.7
Money market fund shares 4) Percentage of total assets 0.2 0.3 0.1 0.1 0.0 0.0 0.0 0.0
External assets Percentage of total assets 8.7 5.8 6.2 5.6 7.9 5.1 5.4 5.2
Claims on domestic households
Percentage of total claims
on household and enterprises 12.0 19.2 27.1 30.4 32.4 33.9 33.0 34.3
Loans-to-claims ratio for domestic
non-banks 2) 42.3 42.3 46.3 53.7 59.6 63.1 65.3 60.3
of which:Loans-to-claims ratio
for general government 2) 3.1 4.6 5.4 5.3 5.2 5.8 7.6 5.5
Loans-to-claims ratio
for domestic households
and enterprises 98.8 97.0 98.0 98.5 99.3 98.8 98.6 98.7
Sources: CBRT and Turkish Statistical Institute.Note: Participation banks have been included since 2005. 1) All banks (public, private, foreign, investment and development, and participation banks) are included in line with the other data provided.2) Securities portfolio shown at balance sheet value. 3) Deposits, loans, reverse repo and reserve requirement claims on the central bank and/or banks are included. 4) Claims on securities mutual funds.

42ECB
Occasional Paper No 115
July 2010
Turning to the liability structure of the banking
sector, deposits of domestic non-banks made
up 60% of total liabilities at the end of 2009,
leaving some limited dependency on more
volatile wholesale funds. The deposit share
of the Turkish banking sector’s liabilities has
shown a very stable profi le since 2001. External
liabilities accounted for 13% of total liabilities
and consisted primarily of loans from banks
abroad, which decreased in 2009. However,
funds from repo transactions denominated
in Turkish liras have increased since 2007,
especially for state-owned banks. Capital and
reserves grew from 11.8% of total liabilities in
2008 to 13.3% in 2009. Book equity rose as a
result of capital increases and rising profi ts
(see Table 20).
BANKING SECTOR PROFITABILITY
Despite the global fi nancial volatility, the
Turkish banking sector remained profi table
in 2008 and 2009. In 2009 net profi ts even
increased markedly compared with 2008.
Returns on equity reached 24.9% at the end
of 2009 from 20.4% in 2008. This increase in
profi ts was made possible, inter alia, by the lack
of direct exposure to sub-prime mortgages or
other toxic assets. Moreover, operating income
increased by around 35% in 2009 on account of
rising net interest income and other operating
income, particularly trading income. Turkish
banks increased their net interest margin (from
5.0% in 2008 to 5.8% in 2009), as policy rate
cuts were not transmitted to rates on loans at
the same pace as on deposits. The difference
between the weighted average interest rates for
loans and deposits rose to 7.6% for corporates
in 2009, up from 7.3% in 2008, and to 9.8% for
natural persons, up from 3.4% (see Table 21).
Operating expenses, including personnel
expenses, remained broadly stable in 2009 in
absolute amounts, but declined markedly as a
share of operating income. By contrast, loan loss
provision expenses rose in absolute terms, at an
even faster pace than operating income. Hence,
their share in operating income increased.
As the increase in provisions was offset by
improvements in interest and trading incomes,
the net profi t of the banking sector reached 34%
of total operating income, 4.4 percentage points
higher than in 2008. As margins are expected
to normalise as a consequence of the combined
lagged effect of rate cuts on loan rates and rising
Table 20 Turkey: liability structure of the banking sector
2002 2003 2004 2005 2006 2007 2008 2009
Deposits of MFIs Percentage of total liabilities 1.3 1.5 1.5 1.7 1.4 1.3 0.9 0.9
Deposits of domestic non-banks Percentage of total liabilities 62.6 60.1 60.3 59.6 59.6 59.7 60.2 59.8
of which:deposits of general government Percentage of total liabilities 2.2 3.3 3.4 3.4 3.2 3.5 2.9 3.0
deposits of households
and enterprises Percentage of total liabilities 60.4 56.9 56.9 56.1 56.4 56.2 57.3 56.8
Money market fund shares 1) Percentage of total liabilities 0.0 0.0 0.0 0.0 0.0 0.0 0.0 0.0
Debt securities issued Percentage of total liabilities 0.4 0.2 0.2 0.0 0.0 0.0 0.0 0.0
Capital and reserves Percentage of total liabilities 12.1 14.2 15.0 13.4 11.9 13.0 11.8 13.3
External liabilities Percentage of total liabilities 10.7 11.7 11.7 14.1 15.5 13.5 14.9 13.2
Remaining liabilities Percentage of total liabilities 12.9 12.3 11.4 11.2 11.6 12.5 12.2 12.9
Memorandum items:Domestic non-banks’
claim-to-deposit ratio 2) 105.4 118.0 123.5 126.9 128.5 135.5 132.7 138.1
General government’s
claim-to-deposit ratio 2) 1,755.5 1,290.5 1,230.6 1,057.9 1,019.4 893.3 1,011.7 1,125.8
Households’ and enterprises’
claim-to-deposit ratio 44.7 50.9 57.8 69.8 78.5 88.7 88.4 85.6
Source: CBRT.Note: Participation banks have been included since 2005. 1) Liabilities to securities mutual funds.2) Securities portfolio shown at balance sheet value.

43ECB
Occasional Paper No 115
July 2010
3 TURKEY
competition in credit granting, and loan loss
provisions are expected to remain important,
it is unlikely that the results observed in 2009
will be achievable again in 2010.
NON-BANK FINANCIAL INSTITUTIONS
The fi nancial sector of the Republic of Turkey
continues to be dominated by the banking sector,
which accounted for 88.2% of total fi nancial
sector assets in June 2009. This share remained
stable in 2008 and 2009, slightly up from 87.1%
in 2007. From a fi nancial stability perspective,
non-bank fi nancial activities remained marginal.
The share of insurance companies in the fi nancial
sector remained stable at 3.3%. Securities
mutual funds, which accounted for 3.9% of the
fi nancial sector assets at the end of 2007, now
represent 3.3%. Shares of leasing and factoring
companies also slightly decreased, to 1.8%
and 1% respectively. The remaining activities
together account for 2.6% of the sector’s assets.
Like the banking sector, the insurance market
is underdeveloped and there is thus room for
growth in the years ahead.
3.3 RISKS AND SHOCK-ABSORBING CAPACITIES
OVERALL RISK INDICATORS
Over the past two years, risk perceptions of the
banking sector have largely followed the
international risk perception of Turkish
sovereign bonds. This is the case, in particular,
for credit default swap (CDS) premia, which are
plotted in Chart 3 for both the Republic of
Turkey and a selected Turkish bank (Turkye IS
Bankasi, the largest privately-owned bank).38
Throughout the crisis, the risk profi les of the
Turkish government and the selected bank have
been considered as highly correlated. Since
peaking at almost 900 basis points at the end of
October 2008, CDS premia for Turkish
sovereign bonds and bonds of the selected bank
CDS data are not available for other Turkish banks.38
Table 21 Turkey: profitability of the banking sector
2002 2003 2004 2005 2006 2007 2008 2009
Total operating income 1) Percentage of total income 100.0 100.0 100.0 100.0 100.0 100.0 100.0 100.0
of which:Net interest income Percentage of operating income 64.5 47.5 67.0 63.2 64.1 65.1 68.9 70.2
Net non-interest income 2) Percentage of operating income -38.6 -7.3 -22.9 -33.1 -21.7 -22.8 -34.7 -29.2
General administrative expenses 3) Percentage of operating income 18.9 17.9 18.2 18.8 19.9 20.1 21.8 17.3
Operating expenses
(excluding loan loss provisions) 4) Percentage of operating income 49.6 44.5 41.8 50.3 45.0 43.5 46.8 36.6
Loan loss provision expenses 5) Percentage of operating income 24.5 15.2 14.1 19.6 12.7 14.2 19.0 22.4
Income tax Percentage of operating income 5.8 10.4 10.0 11.5 9.6 8.4 7.1 8.4
After-tax profi t/loss Percentage of operating income 14.6 23.7 24.5 19.7 34.2 37.1 29.6 34.0
Net interest income Percentage of average assets 6.6 5.0 6.2 5.2 4.5 4.8 4.6 5.3
Net non-interest income Percentage of average assets -3.9 -0.8 -2.1 -2.7 -1.5 -1.7 -2.3 -2.2
Interest rate spread
(total loans – total deposits) 6) Percentage points 12.4 12.3 11.0 6.9 5.9 5.9 7.3 7.6
Interest rate spread
(total loans – total deposits) 7) Percentage points 9.2 15.2 13.2 6.4 4.8 5.0 3.4 9.8
Return on average assets – before tax Percentage 2.1 3.6 3.2 2.6 3.1 3.3 2.4 3.2
Return on average equity – before tax Percentage 20.1 25.5 22.7 18.5 25.5 26.0 20.4 24.9
Net interest margin 8) Percentage 8.2 6.0 7.2 5.8 5.0 5.2 5.0 5.8
Sources: CBRT and BRSA.Note: Owing to changes in operating principles, calculations in this table do not include participation banks. 1) Operating income = net interest income + net fees and commissions income + dividend income + net trading income (loss) + other operating income. 2) Net non-interest income = net fees and commissions income + dividend income + net trading income (loss) + other operating income – provision for credits and other receivables - other operating expenses. 3) Includes personnel expenses and provision for termination indemnities. 4) Operating expenses = personnel expenses + provision for termination indemnities + depreciation + taxes, duties, charges and funds + other non-interest expenses. 5) Includes special provision for non-performing loans, provision for general loan losses, provision for securities impairment, provision for affi liates, subsidiaries and joint ventures impairment and other provisions. 6) The difference between the weighted average interest rate for corporate loans and deposits. 7) The difference between the weighted average interest rate for consumer loans and deposits.8) Net interest margin = net interest income / average interest-earning assets.

44ECB
Occasional Paper No 115
July 2010
have decreased and almost reached their
pre-crisis levels.
This strong link between sovereign risk and
banking sector risk also emerges from a review
of recent rating decisions. Following the three
major rating agencies’ recent upgrades of the
Republic of Turkey’s issuer rating, the ratings
of Turkish banks underwent a similar change.
Standard & Poor’s reported that “Turkish banks’
ratings and fundamentals will remain closely
correlated with sovereign creditworthiness
through, among other things, their signifi cant
holdings of government securities and exposure
to the domestic economic and fi nancial
environment”. Indeed, the majority of Turkish
banks’ activities are directed at the domestic
market and almost all debt securities held by
Turkish banks are Turkish sovereign bonds.
In the current context of uncertainty in the
sovereign bond market, this highly concentrated
exposure could make Turkish banks vulnerable
to a contagion effect in the event of a lack of
fi scal discipline by the Turkish government.
Another aggregate risk indicator for the fi nancial
sector is the “Financial strength index” computed
by the CBRT. This index is constructed on the
basis of six sub-indices 39 covering all major
risks facing the banking sector. It points to a
consolidation of Turkish banks’ fi nancial
strength since the index has increased and
remains above its long-term average
(see Chart 4).
CREDIT RISK
The growth of credit to the private sector fell
markedly in 2009 after the rapid growth of
previous years. Although credit to the private
sector recovered in the second half of the year,
its year-on-year real growth rate was only slightly
positive at the end of 2009 (0.8%). This decrease
in private sector credit growth can mainly be
attributed to the corporate loan segment. Loans
to households continued to increase, albeit at
a slower pace than in previous years. Housing
and personal fi nance loans contributed to credit
growth, while consumer car loans decreased.
Consumer credit card amounts also grew but at
a slower pace than other consumer loans.
One-third of the Turkish banks’ private sector
credit portfolio consists of loans to households
Asset quality, liquidity, exchange rate risk, interest rate risk, 39
profi tability and capital adequacy.
Chart 3 Turkey: credit default swap premia
(basis points)
1,000
900
800
700
600
500
400
300
200
100
0
1,000
900
800
700
600
500
400
300
200
100
02004 2005 2006 2007 2008 2009
Turkiye IS Bankasi
Republic of Turkey
Source: Thomson Reuters Datastream.
Chart 4 Turkey: Financial strength index
(1999 = 100)
125
120
115
110
105
100
125
120
115
110
105
100
financial strength index
average
2002 2003 2004 2005 2006 2007 2008 2009
Sources: CBRT and BRSA.

45ECB
Occasional Paper No 115
July 2010
3 TURKEY
(including mortgage loans and credit cards).
Slightly less than half of the portfolio consists
of corporate loans (excluding SMEs) and a little
over one-fi fth is constituted by loans to SMEs.
Despite the slowdown in credit growth, credit
risk continues to represent the largest risk factor
for the banking sector. Non-performing loans
(NPLs) 40 amounted to 5.3% of total loans,
up from 3.7% at the end of December 2008.
The non-performing loan ratio of corporates
rose to 4.9% by the end of 2009, up from 3.7%
at the end of the previous year. The NPL ratio
for SME loans reached 7.6% at the end of 2009,
from 4.8% at the end of 2008, underlining the
larger impact of the crisis on SMEs. For loans to
micro-enterprises only (slightly over one-third
of SME loans), the NPL ratio amounted to
10.5%. The increase in the NPL ratio for other
corporate loans was more moderate. Although
the level of NPLs for SME loans is a source of
concern, it is expected to decrease as a result of
the support of the Credit Guarantee Fund, which
is being used to guarantee SME loans
(see section 4.7).
The non-performing loan ratio of households
stood at 6% at the end of 2009, up from 3.7% at
the end of 2008. The NPL ratio for credit cards
rose to 10.4% at the end of 2009, compared with
6.5% one year earlier. Deterioration in the other
consumer lending segment, with the NPL ratio
increasing from 3% in 2008 to 5.5% in 2009,
could become a source of concern because of
the tight margins in this business segment. Since
repayments on housing loans are prioritised
owing to the fear of losing property, NPL ratios
for this segment are lower than for credit cards
or other loans, including car loans, where the
NPL ratio reached 10.3% at the end of 2009
from 6.0% at the end of 2008.
Looking ahead, NPLs may continue to weigh on
the profi tability of the Turkish banking sector.
Even though the latest fi gures show a decrease
in the NPL ratio, asset quality is a lagging
indicator and thus some renewed deterioration
cannot be ruled out. However, the high number
of non-performing credit card loans that are
rescheduled, as stipulated in Law 5464 on bank
cards and credit cards (see section 4.3) or on a
voluntary basis, are expected to have a positive
effect on NPL ratios.
Credit-risk stress tests performed by the CBRT
have shown that the NPL ratio would need to
rise by more than 15 percentage points before
the solvency threshold (capital adequacy ratio)
of 12% came under threat.
Household debt rose steadily in previous
years to reach 14.6% of GDP by the end of
2009. However, this level is still low when
compared with that in many other countries.
Hence, interest payments represent only 2.3%
of gross disposable income. The percentage of
foreign exchange-denominated or indexed loans
and that of fl oating rate loans is low, making
households less vulnerable to unfavourable
developments in economic conditions. At the
same time, the low proportion of fl oating rate
loans (only 0.03% for housing loans at the end
of October 2009) prevents existing debtors from
reaping the benefi ts of the recent cuts in interest
rates. As regards households, it is also worth
noting that strong social links in Turkey bolster
repayment capacities. The high unemployment
rate remains a major source of concern, as it
climbed to 14% in 2009 41 from 11% in 2008.
Both domestic and foreign sales were adversely
affected during the crisis, leading to a decrease
in the net profi ts of the corporate sector. Firms
in manufacturing suffered the most. Indeed,
NPLs are highest in the textile as well as in the
beverages, food and tobacco industries, and have
increased strongly in machinery and equipment
and also in the metal manufacturing industries.
However, high levels or increases in NPL
For Turkey, non-performing loans include loans and other 40
receivables classifi ed as loss, doubtful loans and other receivables,
and loans and other receivables with limited collectability.
According to “The BRSA Regulation on the Procedures and
Principles for Determination of Qualifi cations of Loans and
Other Receivables by Banks and Provisions to be Set Aside”,
published in Offi cial Gazette 26333 of 1 November 2006, loans
are recorded as non-performing receivables when they are more
than 90 days past their due date.
Based on AMECO data, spring 2010.41

46ECB
Occasional Paper No 115
July 2010
ratios have also been observed in other sectors
such as wholesale and retail, construction and
agriculture. These sectors, in which NPL ratios
were highest or increasing the most, form an
important part of the banking sector’s sectoral
exposures.
As with households, debt among corporates as
a percentage of GDP increased only moderately
in 2009 and is still low in comparison with
international levels. In contrast to households,
around half of corporate loans are short-term
loans. Hence, corporates were able to benefi t
from the recent interest rate cuts, either for
foreign exchange loans or loans denominated
in Turkish liras. Nevertheless, this also
makes them more vulnerable to an increase in
interest rates.
MARKET AND LIQUIDITY RISK
Turkish banks face a limited direct exchange
rate risk, as their overall foreign exchange
position is almost balanced (an on-balance
sheet short position offset by an off-balance
sheet long position). By the end of 2009, the net
open foreign exchange position of the Turkish
banking sector represented -0.4% of Tier I
capital (see Table 22).
Thus, exchange rate risk for Turkish banks
mainly takes the form of indirect risk.
Depreciation of the Turkish lira could result
in an increase in corporate NPLs. While loans
from Turkish banks to individuals are almost
all denominated in Turkish liras, the share of
foreign exchange-based lending to non-bank
corporations is much higher (almost 50%).
Previously, Turkish banks were not allowed to
lend directly in foreign exchange to unhedged
borrowers, with the result that companies
borrowed from off-shore branches of foreign
banks or used foreign exchange-indexed
loans. As regards individuals, only foreign
exchange-indexed loans were allowed. The
regulation was amended in June 2009 and now
Table 22 Turkey: selected banking sector stability indicators
2002 2003 2004 2005 2006 2007 2008 2009
Credit riskDomestic credit growth Percentage, year-on-year 28.9 35.2 50.0 57.5 40.0 30.4 28.6 6.9
Real domestic credit growth 1) -0.6 14.2 37.2 42.5 27.7 20.3 16.9 0.3
Credit growth to the private sector Percentage, year-on-year 29.0 32.5 50.5 60.8 41.7 30.7 27.6 7.4
Real credit growth to the private sector 1) -0.6 11.9 37.7 45.4 29.2 20.6 16.0 0.8
Credit growth to households Percentage, year-on-year 27.4 113.2 96.2 76.7 47.9 37.5 23.3 10.9
Growth of consumer housing loans Percentage, year-on-year -4.2 80.2 224.9 395.5 79.3 38.8 19.9 15.4
Non-performing loans 2) 17.6 11.5 6.0 4.8 3.8 3.5 3.7 5.3
of which:Non-performing loans
of households 2)
Percentage of total
household loans 4.6 1.8 2.7 3.2 3.0 2.9 3.7 6.0
Non-performing loans
of corporates 2)
Percentage of total
corporate loans 19.2 13.7 7.2 5.4 4.1 3.8 3.7 4.9
Non-performing loans
in domestic currency
Percentage of total domestic
currency loans ... ... ... ... ... ... ... ...
Non-performing loans
in foreign currency
Percentage of total foreign
currency loans ... ... ... ... ... ... ... ...
Foreign currency loans Percentage of total loans 58.9 45.4 35.2 27.4 25.5 24.0 28.7 26.6
Foreign currency deposits Percentage of total deposits 57.3 48.6 44.7 36.8 39.4 35.4 35.3 33.7
Growth of foreign liabilities 3), 10) Percentage, year on year … 37.1 58.2 55.0 53.8 -5.9 16.5 -23.5
Foreign liabilities 3), 10)Percentage of total
liabilities3.3 4.0 5.2 6.1 7.5 6.2 5.6 3.9
Market riskInterest rate risk
Interest income Percentage of total assets 20.9 15.7 13.2 10.7 11.2 12.2 11.7 10.2
Net non-interest income 4) Percentage of total assets -3.6 -0.7 -2.0 -2.4 -1.4 -1.6 -2.1 -2.1
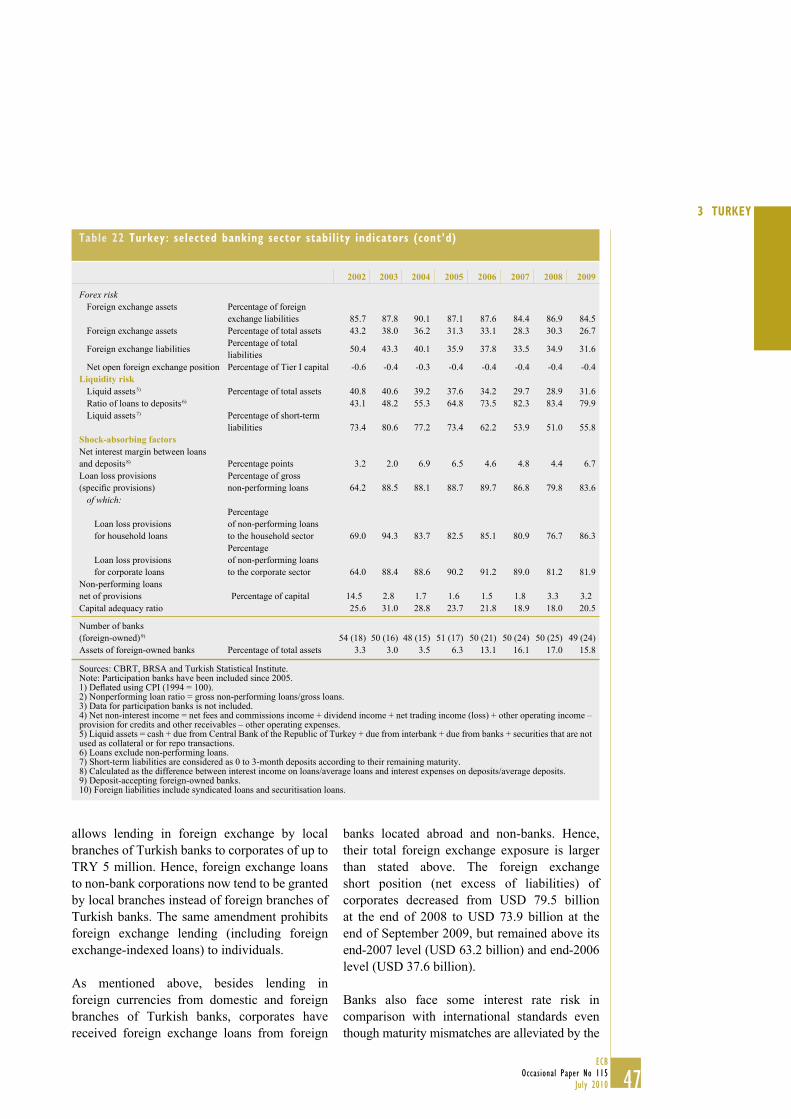
47ECB
Occasional Paper No 115
July 2010
3 TURKEY
allows lending in foreign exchange by local
branches of Turkish banks to corporates of up to
TRY 5 million. Hence, foreign exchange loans
to non-bank corporations now tend to be granted
by local branches instead of foreign branches of
Turkish banks. The same amendment prohibits
foreign exchange lending (including foreign
exchange-indexed loans) to individuals.
As mentioned above, besides lending in
foreign currencies from domestic and foreign
branches of Turkish banks, corporates have
received foreign exchange loans from foreign
banks located abroad and non-banks. Hence,
their total foreign exchange exposure is larger
than stated above. The foreign exchange
short position (net excess of liabilities) of
corporates decreased from USD 79.5 billion
at the end of 2008 to USD 73.9 billion at the
end of September 2009, but remained above its
end-2007 level (USD 63.2 billion) and end-2006
level (USD 37.6 billion).
Banks also face some interest rate risk in
comparison with international standards even
though maturity mismatches are alleviated by the
Table 22 Turkey: selected banking sector stability indicators (cont’d)
2002 2003 2004 2005 2006 2007 2008 2009
Forex riskForeign exchange assets Percentage of foreign
exchange liabilities 85.7 87.8 90.1 87.1 87.6 84.4 86.9 84.5
Foreign exchange assets Percentage of total assets 43.2 38.0 36.2 31.3 33.1 28.3 30.3 26.7
Foreign exchange liabilitiesPercentage of total
liabilities50.4 43.3 40.1 35.9 37.8 33.5 34.9 31.6
Net open foreign exchange position Percentage of Tier I capital -0.6 -0.4 -0.3 -0.4 -0.4 -0.4 -0.4 -0.4
Liquidity riskLiquid assets 5) Percentage of total assets 40.8 40.6 39.2 37.6 34.2 29.7 28.9 31.6
Ratio of loans to deposits 6) 43.1 48.2 55.3 64.8 73.5 82.3 83.4 79.9
Liquid assets 7) Percentage of short-term
liabilities 73.4 80.6 77.2 73.4 62.2 53.9 51.0 55.8
Shock-absorbing factorsNet interest margin between loans
and deposits 8) Percentage points 3.2 2.0 6.9 6.5 4.6 4.8 4.4 6.7
Loan loss provisions
(specifi c provisions)
Percentage of gross
non-performing loans 64.2 88.5 88.1 88.7 89.7 86.8 79.8 83.6
of which:
Loan loss provisions
for household loans
Percentage
of non-performing loans
to the household sector 69.0 94.3 83.7 82.5 85.1 80.9 76.7 86.3
Loan loss provisions
for corporate loans
Percentage
of non-performing loans
to the corporate sector 64.0 88.4 88.6 90.2 91.2 89.0 81.2 81.9
Non-performing loans
net of provisions Percentage of capital 14.5 2.8 1.7 1.6 1.5 1.8 3.3 3.2
Capital adequacy ratio 25.6 31.0 28.8 23.7 21.8 18.9 18.0 20.5
Number of banks
(foreign-owned) 9) 54 (18) 50 (16) 48 (15) 51 (17) 50 (21) 50 (24) 50 (25) 49 (24)
Assets of foreign-owned banks Percentage of total assets 3.3 3.0 3.5 6.3 13.1 16.1 17.0 15.8
Sources: CBRT, BRSA and Turkish Statistical Institute.Note: Participation banks have been included since 2005. 1) Defl ated using CPI (1994 = 100). 2) Nonperforming loan ratio = gross non-performing loans/gross loans. 3) Data for participation banks is not included. 4) Net non-interest income = net fees and commissions income + dividend income + net trading income (loss) + other operating income – provision for credits and other receivables – other operating expenses. 5) Liquid assets = cash + due from Central Bank of the Republic of Turkey + due from interbank + due from banks + securities that are not used as collateral or for repo transactions.6) Loans exclude non-performing loans. 7) Short-term liabilities are considered as 0 to 3-month deposits according to their remaining maturity. 8) Calculated as the difference between interest income on loans/average loans and interest expenses on deposits/average deposits. 9) Deposit-accepting foreign-owned banks. 10) Foreign liabilities include syndicated loans and securitisation loans.
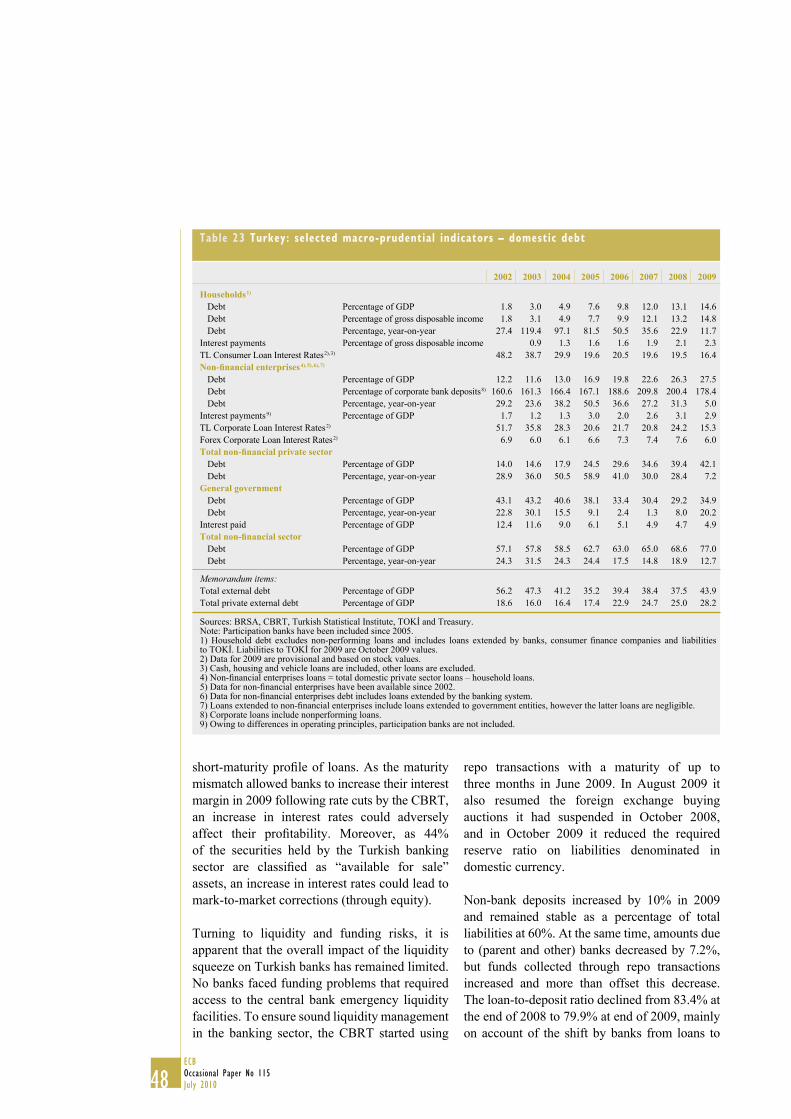
48ECB
Occasional Paper No 115
July 2010
short-maturity profi le of loans. As the maturity
mismatch allowed banks to increase their interest
margin in 2009 following rate cuts by the CBRT,
an increase in interest rates could adversely
affect their profi tability. Moreover, as 44%
of the securities held by the Turkish banking
sector are classifi ed as “available for sale”
assets, an increase in interest rates could lead to
mark-to-market corrections (through equity).
Turning to liquidity and funding risks, it is
apparent that the overall impact of the liquidity
squeeze on Turkish banks has remained limited.
No banks faced funding problems that required
access to the central bank emergency liquidity
facilities. To ensure sound liquidity management
in the banking sector, the CBRT started using
repo transactions with a maturity of up to
three months in June 2009. In August 2009 it
also resumed the foreign exchange buying
auctions it had suspended in October 2008,
and in October 2009 it reduced the required
reserve ratio on liabilities denominated in
domestic currency.
Non-bank deposits increased by 10% in 2009
and remained stable as a percentage of total
liabilities at 60%. At the same time, amounts due
to (parent and other) banks decreased by 7.2%,
but funds collected through repo transactions
increased and more than offset this decrease.
The loan-to-deposit ratio declined from 83.4% at
the end of 2008 to 79.9% at end of 2009, mainly
on account of the shift by banks from loans to
Table 23 Turkey: selected macro-prudential indicators – domestic debt
2002 2003 2004 2005 2006 2007 2008 2009
Households 1)
Debt Percentage of GDP 1.8 3.0 4.9 7.6 9.8 12.0 13.1 14.6
Debt Percentage of gross disposable income 1.8 3.1 4.9 7.7 9.9 12.1 13.2 14.8
Debt Percentage, year-on-year 27.4 119.4 97.1 81.5 50.5 35.6 22.9 11.7
Interest payments Percentage of gross disposable income 0.9 1.3 1.6 1.6 1.9 2.1 2.3
TL Consumer Loan Interest Rates 2), 3) 48.2 38.7 29.9 19.6 20.5 19.6 19.5 16.4
Non-fi nancial enterprises 4), 5), 6), 7)
Debt Percentage of GDP 12.2 11.6 13.0 16.9 19.8 22.6 26.3 27.5
Debt Percentage of corporate bank deposits 8) 160.6 161.3 166.4 167.1 188.6 209.8 200.4 178.4
Debt Percentage, year-on-year 29.2 23.6 38.2 50.5 36.6 27.2 31.3 5.0
Interest payments 9) Percentage of GDP 1.7 1.2 1.3 3.0 2.0 2.6 3.1 2.9
TL Corporate Loan Interest Rates 2) 51.7 35.8 28.3 20.6 21.7 20.8 24.2 15.3
Forex Corporate Loan Interest Rates 2) 6.9 6.0 6.1 6.6 7.3 7.4 7.6 6.0
Total non-fi nancial private sectorDebt Percentage of GDP 14.0 14.6 17.9 24.5 29.6 34.6 39.4 42.1
Debt Percentage, year-on-year 28.9 36.0 50.5 58.9 41.0 30.0 28.4 7.2
General governmentDebt Percentage of GDP 43.1 43.2 40.6 38.1 33.4 30.4 29.2 34.9
Debt Percentage, year-on-year 22.8 30.1 15.5 9.1 2.4 1.3 8.0 20.2
Interest paid Percentage of GDP 12.4 11.6 9.0 6.1 5.1 4.9 4.7 4.9
Total non-fi nancial sectorDebt Percentage of GDP 57.1 57.8 58.5 62.7 63.0 65.0 68.6 77.0
Debt Percentage, year-on-year 24.3 31.5 24.3 24.4 17.5 14.8 18.9 12.7
Memorandum items:Total external debt Percentage of GDP 56.2 47.3 41.2 35.2 39.4 38.4 37.5 43.9
Total private external debt Percentage of GDP 18.6 16.0 16.4 17.4 22.9 24.7 25.0 28.2
Sources: BRSA, CBRT, Turkish Statistical Institute, TOKİ and Treasury.Note: Participation banks have been included since 2005. 1) Household debt excludes non-performing loans and includes loans extended by banks, consumer fi nance companies and liabilities to TOKİ. Liabilities to TOKİ for 2009 are October 2009 values. 2) Data for 2009 are provisional and based on stock values. 3) Cash, housing and vehicle loans are included, other loans are excluded. 4) Non-fi nancial enterprises loans = total domestic private sector loans – household loans. 5) Data for non-fi nancial enterprises have been available since 2002. 6) Data for non-fi nancial enterprises debt includes loans extended by the banking system. 7) Loans extended to non-fi nancial enterprises include loans extended to government entities, however the latter loans are negligible. 8) Corporate loans include nonperforming loans. 9) Owing to differences in operating principles, participation banks are not included.

49ECB
Occasional Paper No 115
July 2010
3 TURKEY
debt securities,42 but remained much higher than
its level at the beginning of the last decade.
For foreign-owned banks only, this ratio was
greater than 110% at the end of 2009.
Liquid assets increased both as a percentage of
total assets and in terms of short-term liabilities,
to 31.6% and 55.8% respectively, albeit to much
lower levels than those reached in 2003 (40.6%
and 80.6% respectively).
Stress tests were performed in October 2009
for both interest rate and exchange rate risks
(assuming a 30% depreciation of the lira and a
5-6% increase in interest rates). They resulted,
under the worst-case scenario, in a decrease in
the capital adequacy ratio of 2 percentage points,
which nevertheless would remain above the
12% target rate.43 However, these stress tests do
not measure the impact of interest and exchange
rate developments on the repayment capacity of
corporates and the resulting rise in NPLs.
SHOCK-ABSORBING FACTORS
The Turkish banking sector still follows the Basel
I rules but the supervisory framework already
features many aspects of Basel II, including in
the area of operational risk, which was added
in 2007. The evolution of the capital adequacy
ratio, as shown in Table 22, is partly attributable
to convergence towards Basel II. A fully-fl edged
Basel II-compliant supervisory framework is
set for adoption in Turkey by 2011, in line with
the commitment of G20 countries. The move
to Basel II is expected to weigh on the capital
adequacy ratio, especially in a scenario where
Turkish government securities denominated
in foreign exchange are assigned a risk weight
of 100% instead of 0% under Basel I.
Although the capital adequacy ratio decreased
in 2008 owing to the rise in loans and convergence
towards Basel II, it increased in 2009 to 20.5%,
from 18.0% at the end of 2008.44 The average
risk weight of Turkish banks’ assets decreased
on account of their lower appetite for higher
risk-weighted assets (a shift from loans to
sovereign debt securities), and high profi tability
contributed to the strengthening of own funds.
Turkish banks have also been able to count on
retained earnings with dividend pay-out ratios
declining as a consequence of specifi c measures
implemented to limit profi t distribution
(see section 4.7). Finally, the sector strengthened
its regulatory own funds via the available-for-sale
revaluation reserve due to the effect of lower
interest rates on the value of debt securities.
This latter effect would be reversed in the event
of an increase in interest rates.
The Turkish banks’ coverage ratio of NPLs
(including only specifi c provisions) stood at
84% in 2009. Although this rate increased in
comparison with 2008, it was lower than the
level reached in 2006 (90%).
3.4 CONCLUDING ASSESSMENT AND POLICY
IMPLICATIONS
The previous report on fi nancial stability
challenges in candidate countries (ECB, 2008)
identifi ed three main sources of risk for the
banking sector, namely credit risk, interest rate
risk and exchange rate risk. The international
fi nancial crisis has highlighted the fact that
credit risk remains a major potential risk factor,
as the severe economic slowdown triggered
some deterioration in asset quality. Overall,
however, the banking sector has withstood
the shockwaves of the crisis reasonably well,
suggesting that the reform efforts in the banking
sector over recent years have paid off.
Although Turkish real GDP contracted by 4.7%
in 2009, it is expected to bounce back to an
annual growth rate of 4.7% in 2010, underlining
the relative strength of the Turkish economy in
the face of the global fi nancial crisis. The current
account defi cit was corrected to -2.2% of GDP.
The government defi cit and gross debt expanded
to 6.2% and 45.5% of GDP respectively as a
result of support measures and the operation of
The same shift results in an increase in free securities (neither 42
held as collateral, nor used for repo transactions), which is the
largest item in liquid assets.
For a macro stress-testing exercise, see section 4.2.43
While the regulatory minimum capital adequacy ratio is 8%, 44
the target rate needed to continue opening new branches is 12%.

50ECB
Occasional Paper No 115
July 2010
automatic stabilisers. The primary surplus fell
to 0.1% of GDP, underlining the weakening
fi scal performance.
In the light of the strong correlation between
the ratings of the Turkish government and those
of Turkish banks, owing primarily to the high
level of government securities holdings and
their focus on domestic activities, weak fi scal
performance in the future – namely a lack
of commitment to the consolidation plans as
announced in the medium-term programme –
could lead to problems for the Turkish banking
sector. However, the most recent indicators
show some improvement in fi scal performance.
This would reinforce the generally positive
perception about fi scal policy credibility and
ease the government’s fi nancing requirement,
which remains vulnerable to a deterioration
in external conditions. Fiscal consolidation is
also important for avoiding the crowding-out
of credit to the private sector as the economy
recovers. Following buoyant credit growth
developments since the end of 2007, and in
spite of a quasi-halt to credit growth in 2009,
credit risks have become even more important
as asset quality deteriorated markedly in 2009.
Even though different measures have been taken
to limit a further deterioration in NPL ratios,
and despite some decline since November 2009,
loan loss provisions are expected to remain
above pre-crisis levels in 2010. In addition,
as already identifi ed in the previous report
(ECB, 2008), exchange rate and interest rate
shocks could increase the vulnerability of the
corporate sector. In 2009 banks were able to
offset increasing loan loss provisions with
increased interest and trading incomes, and
even managed to improve their results. This
supported the rise in the capital adequacy ratio to
above 20%. However, the profi tability observed
in 2009 is unlikely to persist in 2010, as interest
margins are expected to normalise and loan loss
provisions are expected to continue weighing
on profi tability. A marked increase in CBRT
interest rates could also expose banks to a larger
negative impact on their profi tability.
Like credit risk (including risks induced
by interest rate and potential exchange rate
shocks), liquidity and funding risks also need to
be monitored closely. However, compared with
credit risk, they remain less important.
Despite these risks, the Turkish banking sector
has shown a remarkable resilience to the crisis
due, inter alia, to high capital adequacy levels.
Not a single Turkish bank has had to request
capital or liquidity support from the authorities.
Nevertheless, Turkish banks remain vulnerable
to the risks discussed above, and these risks
would require particularly close monitoring if
the international or domestic macroeconomic
environment were to turn out less favourably
than expected.

51ECB
Occasional Paper No 115
July 2010
4 SPEC IAL
FEATURES4 SPECIAL FEATURES
4.1 DISTRIBUTION OF MAJOR BANKING
STABILITY INDICATORS ACROSS INDIVIDUAL
BANKS IN THE CANDIDATE COUNTRIES
While the average values of prudential indicators
allow a quick assessment of the stability of the
fi nancial system as a whole, the distribution of
values can provide important additional
information on the resilience of individual
institutions and the degree of systemic risk.
This section presents a comparison of fi ve key
banking indicators in Croatia, the former
Yugoslav Republic of Macedonia and Turkey,
using several distribution parameters: average,
median, and fi rst and third quartiles.45
The indicators considered are the capital
adequacy ratio, the liquidity ratio (the ratio of
liquid assets over total assets), the NPL ratio,
the return on assets and the loan-to-deposit ratio
(see Chart 5). In order to allow an assessment of
recent trends, the values are presented at
pre-crisis levels, i.e. as at December 2007 and
December 2009.
In the two-year period under consideration,
the median capital adequacy ratio decreased
slightly in Croatia and the former Yugoslav
Republic of Macedonia and increased in Turkey.
However, regulatory increases in risk weights in
2008 in Croatia and the former Yugoslav Republic
of Macedonia led to a mechanical decline in
capital adequacy ratios (in Croatia the estimated
impact of this measure on the average is about
0.9 percentage points, hence there is no decrease
on average after allowing for this mechanical
impact). The spread between the fi rst and third
quartiles is quite narrow in Croatia and Turkey
and has been squeezed further, driven on the one
hand by the requirements for adequate capital in
anticipation of credit quality deterioration and on
the other by lower profi tability in the aftermath
of the crisis. The former Yugoslav Republic of
Macedonia stands out, with some banks having
considerably larger capital buffers than in the
other two countries possibly on account of the
higher NPL ratios they are facing. However,
in the three countries all banks remain relatively
well-capitalised and the minimum capital
adequacy ratio stands above 10%.
Developments in the average liquidity ratio of
banks were different across the three countries,
as the ratio decreased in Croatia, remained
roughly the same in the former Yugoslav
Republic of Macedonia (although the median
and quartiles declined) and increased in Turkey.
The declines in Croatia and the former Yugoslav
Republic of Macedonia may be related to
temporary deposit withdrawals stemming from
depositors’ weakened confi dence and the high
cost of holding large stocks of liquid assets
during a period of decreased profi tability and
competitive pressure. An additional factor for
Croatia was the reduction in general reserve
requirements and the abolition of the marginal
reserve requirements in 2008, and for the former
Yugoslav Republic of Macedonia (where
distribution as a whole shifted downwards) the
outfl ow of liquid funds owing to the repayment
of external liabilities. In Turkey, although the
weighted average value is quite high (31.6%
in December 2009), it seems to be driven by
several large banks with high liquidity, since
three-quarters of all banks have below-average
liquid assets.
Over the two-year period, the average
non-performing loan ratio increased in all three
countries, refl ecting the negative impact of the
economic slowdown on loan collectability.
The percentage change was higher in Croatia
and Turkey, whereas in the former Yugoslav
Republic of Macedonia the average and
median NPL level for 2009 was higher than
in the other two countries (9.4%). Moreover,
while NPL levels in the upper half of the
distribution do not reach excessively high
levels in Croatia and Turkey, the third quartile
and the maximum values are high in the former
Yugoslav Republic of Macedonia (at 18% and
38% respectively), indicating the presence of
several institutions facing very high rates of
borrower default.
Where relevant, the analysis also refers to minimum and 45
maximum values (not shown in Chart 5).
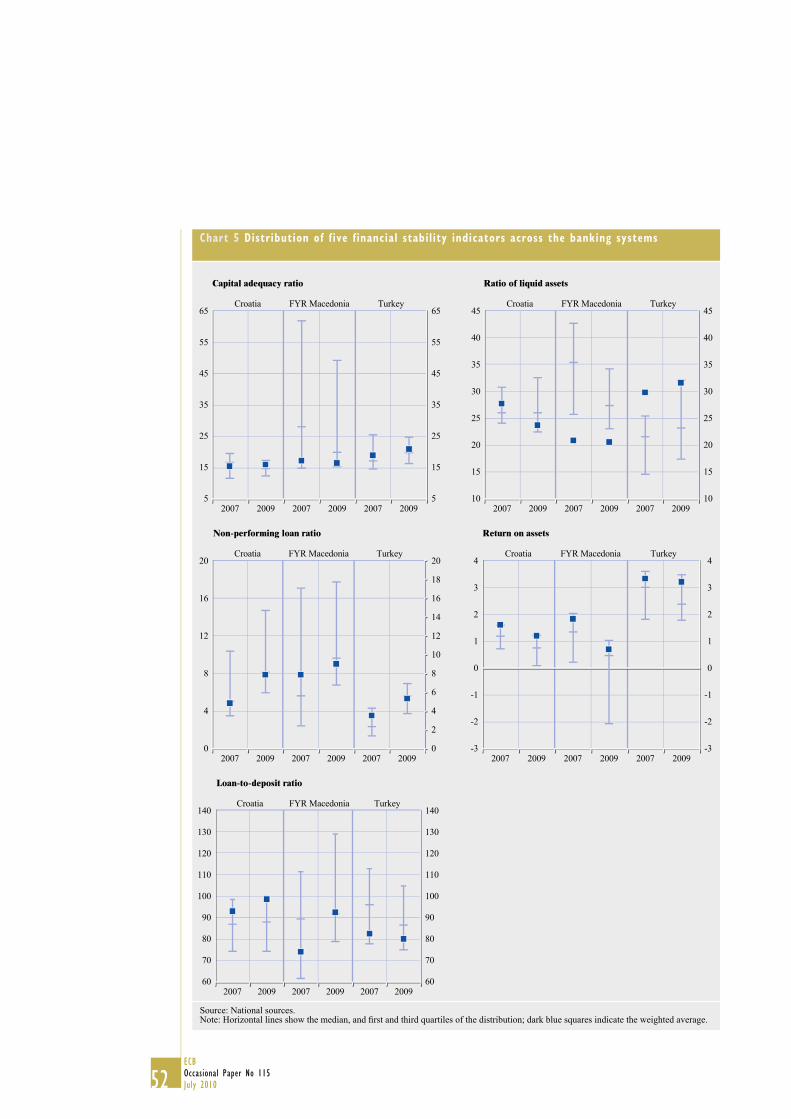
52ECB
Occasional Paper No 115
July 2010
Chart 5 Distribution of five financial stability indicators across the banking systems
Capital adequacy ratio Ratio of liquid assets
65
55
45
35
25
15
5
65
55
45
35
25
15
52007 2009 2007 2009 2007 2009
Croatia FYR Macedonia Turkey45
40
35
30
25
20
15
10
45
40
35
30
25
20
15
102007 2009 2007 2009 2007 2009
Croatia FYR Macedonia Turkey
Non-performing loan ratio Return on assets
20
16
12
8
4
0
20
18
16
14
12
10
8
6
4
2
02007 2009 2007 2009 2007 2009
Croatia FYR Macedonia Turkey4
3
2
1
0
-1
-2
-3
4
3
2
1
0
-1
-2
-32007 2009 2007 2009 2007 2009
Croatia FYR Macedonia Turkey
Loan-to-deposit ratio
140
120
110
130
100
70
80
90
60
140
120
110
130
100
70
80
90
602007 2009 2007 2009 2007 2009
Croatia FYR Macedonia Turkey
Source: National sources.Note: Horizontal lines show the median, and fi rst and third quartiles of the distribution; dark blue squares indicate the weighted average.

53ECB
Occasional Paper No 115
July 2010
4 SPEC IAL
FEATURESWith regard to the return on assets, the three
candidate countries are in very different
positions. Although in Croatia the entire return
distribution shifted downwards, the indicator
remains positive for three-quarters of the banks.
In the former Yugoslav Republic of Macedonia,
the decrease is much more pronounced, with
individual values for almost half of the banks in
the negative range. This may be due to increased
impairment charges related to the adverse
developments in loan portfolio quality (see the
respective country section). In stark contrast to
these two countries, in Turkey the average return
on assets remained high and all banks reported
positive returns on account of improved interest
and trading incomes (see the respective country
section for more details).
Turning to the loan-to-deposit ratio, its average
has increased in Croatia and the former Yugoslav
Republic of Macedonia, reaching a value very
close to 100% in the former. This development
can be traced back to the episodes of deposit
withdrawals and the incomplete recovery of
deposit levels in these two countries. The former
Yugoslav Republic of Macedonia stands out,
with outliers on the upper side, a third quartile
of 129% and a maximum value as high as 260%,
suggesting a very high level of credit exposure
for some banks.46
4.2 RESULTS OF MACRO STRESS TESTS
IN THE CANDIDATE COUNTRIES
The recent global downturn and the possible
spillovers into the fi nancial sector have directed
attention to macro-prudential analysis methods.
This horizontal issue presents the results of a
two-step macro stress-testing exercise for
Croatia, the former Yugoslav Republic of
Macedonia and Turkey. First, the major sources
of risk were identifi ed and their potential
impact on the credit quality of the banking
system was assessed. In the second step, the
identifi ed link between macroeconomic factors
and credit quality was used to project the likely
impact of different macroeconomic scenarios
on individual banking institutions and on the
system as a whole. This allowed an assessment
of the propensity of the fi nancial system to
withstand shocks and an evaluation of the
degree of systemic risk. Interbank exposures
and hence potential contagion were also taken
into account.47 The main fi nding is that under
extreme but not implausible scenarios, the
banking systems of the three candidate
countries appear well-capitalised and
suffi ciently endowed with liquidity to withstand
shocks, provided that such shocks do not occur
simultaneously.
The main sources of risk in the candidate
countries appear to be the unfavourable external
environment lasting longer than currently
expected and a further deterioration in the
domestic business cycle, spilling over into the
local banking systems through a deterioration
in credit quality and constrained access to
foreign funding. Moreover, the high share of
foreign-denominated lending is an additional
source of risk in the event of adverse exchange
rate developments.48
The link between economic activity and credit
quality is addressed empirically through a
simple econometric model using historical data.
Changes in credit quality (measured by the ratio
of non-performing loans to total credit) are
regressed to allow for lags in real GDP growth
and changes in the exchange rate. The estimated
results for the individual country models are
listed in the fi rst three columns of Table 24.
There are two important caveats, namely the
low number of observations and the simplifi ed
model structure, disregarding potential feedback
effects from credit quality to the macroeconomic
variables of the model. Nevertheless, in line
with intuition, a real GDP decline is related to
worsening credit quality as a consequence of the
increased diffi culty on the part of borrowers to
This high loan-to-deposit ratio for some banks in the former 46
Yugoslav Republic of Macedonia mainly concerns banks that are
not very active in attracting deposits.
The risk of possible interbank contagion is taken into account 47
by estimating bilateral exposures using the maximum entropy
principle. See, for example, Upper and Worms (2002).
For a detailed overview of recent trends in foreign exchange-48
denominated lending in the three countries, see section 4.6.

54ECB
Occasional Paper No 115
July 2010
repay their loans. In the individual regressions,
the differing lag structures and coeffi cients
suggest that the magnitude and speed of the
impact will vary across the countries. For
instance, the impact of a 1 percentage point
decrease in real GDP appears to be much stronger
in the former Yugoslav Republic of Macedonia
and Turkey than in Croatia (by considering the
cumulative value, obtained by taking the sum
of GDP lag coeffi cients). The exchange rate is
signifi cant for Croatia and Turkey, meaning that
an increase in the exchange rate (depreciation
of the domestic currency) might lead to an
additional increase in NPLs. These individual
results are broadly compatible with those of
an extended panel model covering several
additional eastern European countries (shown
in the fourth column of Table 24). Although the
individual regressions provide an insight into
the country-specifi c credit quality patterns, the
panel arrangement was preferred for compiling
the NPL forecast owing to its larger number
of observations and better out-of-sample
forecasting properties.
In the second step of the process, the estimated
coeffi cients are used as an input for a macro
stress test of the banking system using an
approach similar to the IMF stress-testing
method.49 It considers the impact of a one-off
NPL increase on the bank’s capital adequacy
ratio via additional provisions,50 and does not
take profi ts into account as a buffer against
potential shocks. This gives the method a static
character, but it is a prudent way of assessing
the shock impact (Cihak, 2007). For each
country, the top ten banks in terms of total assets
are considered.51
A baseline and a downside credit shock
scenario are considered for all countries, as
follows: country-specifi c GDP forecasts are
used to obtain plausible forecasts for NPL
ratios. At the same time, it is assumed in the
baseline scenario that exchange rates remain
stable. The downside scenario incorporates the
idea of a double-dip recession and has identical
assumptions across the countries: a real GDP
decline in the fi rst three quarters and a return to
the projected path from the baseline scenario
thereafter, combined with a 5% domestic
currency depreciation in two consecutive
quarters. The magnitude and quarter-on-quarter
profi le of the GDP decline is broadly in line
with those observed in the three candidate
countries in the period 2008Q3-2009Q2 during
See Čihák (2007).49
A uniform provisioning rate of 50% of new NPLs was assumed 50
for all banks.
An important caveat in these calculations is the timeliness of 51
the bank data used as input: data are taken from BankScope and
refer to the end of 2008 given the unavailability of more recent
and suffi ciently detailed individual bank data.
Table 24 Econometric estimates: credit quality model
(Dependent variable: percentage change in the non-performing loan ratio)
FYR Macedonia Croatia Turkey Panel regression
Constant 0.77 2.27** -0.94 2.29**
ΔGDP
ΔGDP (-1) -1.72** -1.78***
ΔGDP (-2) -2.36** -2.17*** -1.32**
ΔGDP (-3) -2.86** -1.41**
ΔGDP (-4) -1.30**
ΔER
ΔER (-1) 1.98** 0.61** 0.58***
ΔER (-2)
ΔER (-3) 2.14** 0.35** 0.69***
Adj. R2 0.34 0.51 0.53 0.38
Sample 2003Q4-2009Q4 1999Q2-2009Q4 2002Q1-2009Q4 2000Q2-2009Q4
Source: ECB staff estimates using data from national sources.Notes: *, ** and *** denote coeffi cients signifi cant at the 10%, 5% and 1% level respectively. The exchange rate used is the nominal effective exchange rate, expressed as the domestic currency price of a trade-weighted basket of currencies. The unbalanced panel includes the three candidate countries, as well as Bulgaria, Romania, Russia and Ukraine. The panel regression uses a fi xed-effect estimate, and the length of the time series varies country by country.

55ECB
Occasional Paper No 115
July 2010
4 SPEC IAL
FEATURES
the recent crisis. Moreover, the resulting NPL
change is also in line with assumed NPL
increases in stress tests conducted by the
respective central banks.52 In addition to the
two credit scenarios, a liquidity scenario is also
considered, which assumes the withdrawal of
deposits that have to be paid out of the
liquid assets available to the bank. It is also
designed in two versions: a moderate and a
severe bank run, corresponding, respectively,
to 4% and 8% deposit withdrawals on each of
two consecutive days.53
The following panel of charts compares the
results of the two credit shock scenarios for
the three candidate countries, presenting the
weighted average along with the fi rst and third
quartile of the capital adequacy ratios for the top
ten banks before and after each of the shocks.
For Croatia and Turkey the impact of the
baseline and even of the downside scenario is
relatively modest, with the top ten banks staying
well above the minimum capital adequacy
ratio. Although the average decrease in the
capital adequacy ratio is more substantial for
the former Yugoslav Republic of Macedonia,
there are no bank failures 54 or contagion.
However, the shock might also result in some
institutions not meeting the minimum capital
requirements or having insuffi cient Tier 1
capital,55 and thus requiring recapitalisation.
The estimated recapitalisation needs of the
top ten banks resulting from the two scenarios
are modest when measured as a share of GDP
(in Turkey, no recapitalisation is needed even
under the downside scenario).
As a result of the liquidity scenario (not shown
in the charts), the banks appear to have suffi cient
liquid assets to withstand the assumed deposit
withdrawals: in the three countries, there is
For instance, for Croatia the NPL increase in the downside 52
scenario (55%) is comparable with the 48% increase in the
stress-testing of the CNB, see CNB (2009b) as of August 2009.
The “moderate” rate of withdrawal roughly corresponds to 53
the withdrawal rate during the run on the Kaupthing bank
(Iceland, 2009).
A bank failure is defi ned as equity capital falling below zero.54
Tier 1 capital consists of equity capital and Tier 2 of hybrid 55
capital and subordinated debt. The requirement that Tier 2
capital makes up no more than 50% of total capital forms part of
the Basel I accord.
Chart 6 Changes in the capital adequacy ratio under the baseline and downside scenarios
Croatia
6
8
20
18
16
14
12
10
6
8
20
18
16
14
12
10
Pre-shock Post-shock
(Baseline)
Post-shock
(Downside)
The former Yugoslav Republic of Macedonia
18
16
14
12
10
8
6
18
16
14
12
10
8
6
Pre-shock Post-shock
(Baseline)
Post-shock
(Downside)
Turkey
18
16
14
12
10
8
6
18
16
14
12
10
8
6
Pre-shock Post-shock
(Baseline)
Post-shock
(Downside)
Source: ECB staff estimates using data from national sources.Notes: Horizontal lines show the fi rst and third quartiles of the distribution; dark blue squares indicate the weighted average. Since no bank failures are observed, the results with and without contagion are identical and therefore not shown separately.

56ECB
Occasional Paper No 115
July 2010
no incidence of a bank becoming illiquid and
requiring a liquidity injection.
Overall, the results of the credit risk scenarios
reveal that the banking systems of the candidate
countries are considered relatively resilient under
the assumed scenarios, with no bank failures
being observed. The credit model suggests that
NPLs in the candidate countries peaked in 2009
and are likely to level off in 2010, provided
that the economic recovery gathers pace and
exchange rates remain stable.
4.3 CREDIT QUALITY IN CANDIDATE
COUNTRIES 56
Croatia, the former Yugoslav Republic of
Macedonia and Turkey entered the last decade
with high non-performing loan ratios. Turkey
inherited a signifi cant stock of non-performing
loans 57 from the 2000 and 2001 crises, while
in Croatia and the former Yugoslav Republic
of Macedonia earlier economic and fi nancial
shocks had left high levels of non-performing
loans. From 2002 until the recent global fi nancial
crisis, non-performing loan ratios kept on falling
substantially in all three countries.
Apart from the favourable macroeconomic
environment, a major underlying factor in
improving asset quality indicators was a lending
boom in the candidate countries. Croatia and
Turkey had already recorded rises in the stock
of non-performing loans in the years preceding
the global fi nancial crisis.58 Nevertheless,
high credit growth generally led to receding
non-performing loan ratios. In Turkey, the stock
of non-performing loans has risen since 2005.
This development, however, has long been
masked by high nominal credit growth rates
to the private sector, which averaged 39%
over the period from 2002 to 2008. In Croatia,
non-performing loan ratios continued to fall
until 2007 owing to rapid credit growth, while
non-performing loans started to grow in 2006.
In the former Yugoslav Republic of Macedonia,
credit grew at double-digit rates, thus reducing
the non-performing loan ratio in 2007 to roughly
one-third of its value in 2002.
The fallout from the global fi nancial crisis,
however, led to a signifi cant surge in the ratio
of non-performing loans in all three candidate
countries. For the Turkish banking sector, the
ratio of non-performing loans to gross loans
rose by 160 basis points to 5.3% between 2008
and 2009, as asset quality deteriorated in the
private sector and credit growth abated. In Croatia,
credit growth deceleration and a signifi cant
deterioration in the macroeconomic environment
caused a steep rise in the ratio of non-performing
loans to total loans from 2008 onwards.59
This ratio increased by 290 basis points to 7.8%
between 2008 and 2009. Following a 230-basis
point surge to 9.0%, the former Yugoslav
Republic of Macedonia registered the highest
non-performing loan ratio. Declining foreign
and domestic demand and, hence, the contraction
of economic activity in 2009, led to a rising
non-performing loan ratio for the fi rst time in
six years. A simultaneous slowdown of lending
in the second half of 2008 and a gradually
more pronounced deceleration in 2009 also
contributed to the rise.
Analysing asset quality by sector, the
deterioration has been particularly sharp for
consumer loans. This is especially true in the
former Yugoslav Republic of Macedonia and
Turkey, while in Croatia the deterioration in
the corporate loan portfolio has been even more
pronounced.
In Turkey, the non-performing loan ratio of
corporate loans, which constitute 67% 60 of all
loans, rose to 4.9% in 2009. Surging to 6%,
the increase in the non-performing loan ratio
Although considerable efforts were made to guarantee the 56
consistency of data across the countries, the underlying
defi nitions for national asset quality indicators may differ
according to national classifi cations.
For the defi nitions of non-performing loans, see footnote 17 57
for Croatia, footnote 29 for the former Yugoslav Republic of
Macedonia and footnote 40 for Turkey.
According to NBRM data, the stock of non-performing loans 58
decreased until 2007 and started to increase in 2008.
In Croatia, the loan classifi cation scheme changed in 2004. This 59
has prompted a methodological change for non-performing loans
and loan loss provisions.
Data for the sectoral composition of loans and indebtedness 60
by sector in Turkey has been taken from the latest available
Financial Stability Report. See CBRT (2009).
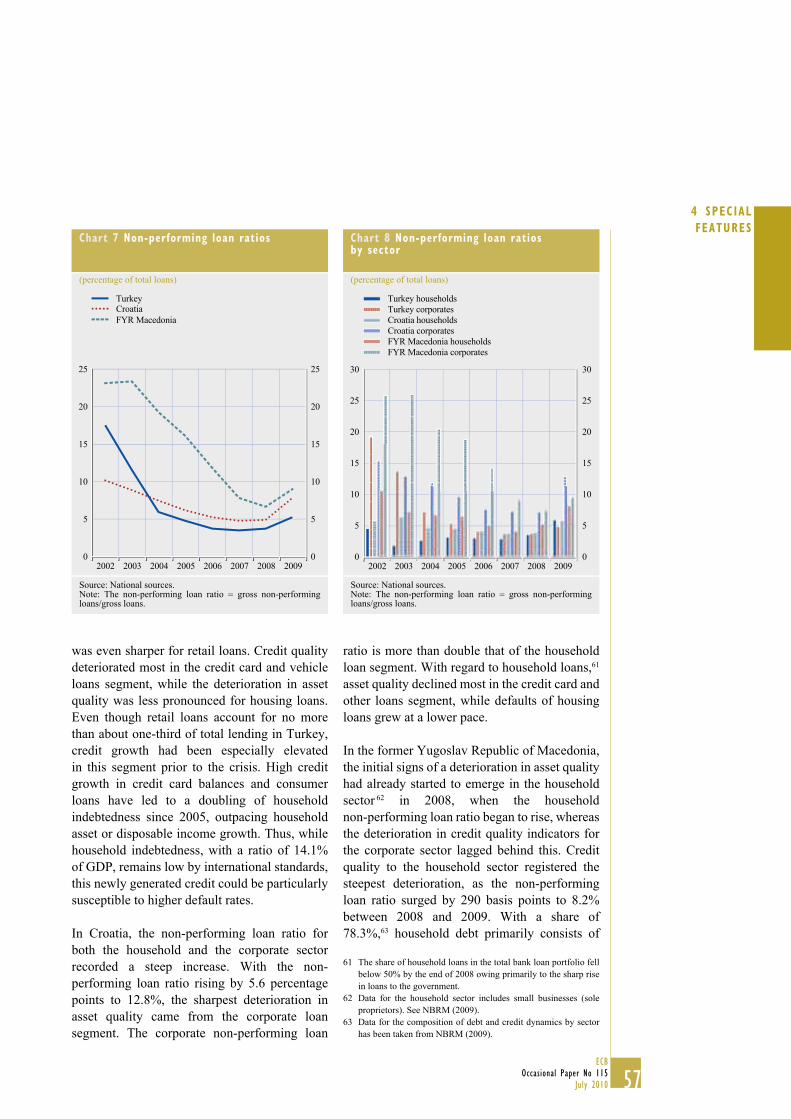
57ECB
Occasional Paper No 115
July 2010
4 SPEC IAL
FEATURES
was even sharper for retail loans. Credit quality
deteriorated most in the credit card and vehicle
loans segment, while the deterioration in asset
quality was less pronounced for housing loans.
Even though retail loans account for no more
than about one-third of total lending in Turkey,
credit growth had been especially elevated
in this segment prior to the crisis. High credit
growth in credit card balances and consumer
loans have led to a doubling of household
indebtedness since 2005, outpacing household
asset or disposable income growth. Thus, while
household indebtedness, with a ratio of 14.1%
of GDP, remains low by international standards,
this newly generated credit could be particularly
susceptible to higher default rates.
In Croatia, the non-performing loan ratio for
both the household and the corporate sector
recorded a steep increase. With the non-
performing loan ratio rising by 5.6 percentage
points to 12.8%, the sharpest deterioration in
asset quality came from the corporate loan
segment. The corporate non-performing loan
ratio is more than double that of the household
loan segment. With regard to household loans,61
asset quality declined most in the credit card and
other loans segment, while defaults of housing
loans grew at a lower pace.
In the former Yugoslav Republic of Macedonia,
the initial signs of a deterioration in asset quality
had already started to emerge in the household
sector 62 in 2008, when the household
non-performing loan ratio began to rise, whereas
the deterioration in credit quality indicators for
the corporate sector lagged behind this. Credit
quality to the household sector registered the
steepest deterioration, as the non-performing
loan ratio surged by 290 basis points to 8.2%
between 2008 and 2009. With a share of
78.3%,63 household debt primarily consists of
The share of household loans in the total bank loan portfolio fell 61
below 50% by the end of 2008 owing primarily to the sharp rise
in loans to the government.
Data for the household sector includes small businesses (sole 62
proprietors). See NBRM (2009).
Data for the composition of debt and credit dynamics by sector 63
has been taken from NBRM (2009).
Chart 7 Non-performing loan ratios
(percentage of total loans)
25
20
15
10
5
0
25
20
15
10
5
02002 2003 2004 2005 2006 2007 2008 2009
TurkeyCroatia
FYR Macedonia
Source: National sources.Note: The non-performing loan ratio = gross non-performing loans/gross loans.
Chart 8 Non-performing loan ratios by sector
(percentage of total loans)
30
25
20
15
10
5
0
30
25
20
15
10
5
02002 2003 2004 2005 2006 2007 2008 2009
Turkey households
FYR Macedonia households
FYR Macedonia corporates
Croatia households
Turkey corporates
Croatia corporates
Source: National sources.Note: The non-performing loan ratio = gross non-performing loans/gross loans.

58ECB
Occasional Paper No 115
July 2010
loans for consumption purposes (consumer
loans, automobile loans, current account
overdrafts and credit cards). In 2008 credit card
balances and current account overdrafts recorded
the fastest growth. As this is unsecured lending,
it may pose a particular risk for asset quality,
especially when taking into account the high
unemployment rate. That said, despite growing
household indebtedness, the ratio of total
household debt to GDP, which stood at 17.7%
at the end of 2008, was still moderate, although
this does not rule out high indebtedness in
individual household segments. Loans
denominated in or indexed to foreign currency
recorded a particularly sharp drop in asset
quality as the ratio of non-performing loans
almost tripled for this segment, while the
non-performing loan ratio for credit denominated
in local currency rose by about 12% in the
former Yugoslav Republic of Macedonia.64
While exchange rate and interest sensitivity
constitute substantial risks for asset quality
in Croatia and the former Yugoslav Republic
of Macedonia, this is less true for Turkey.65
The share of foreign exchange-indexed loans,
which was low in the Turkish household
sector (4.9% in 2008 66), continued to decline
as consumers were discouraged from taking
out foreign exchange loans in 2009 by new
regulation.67 This has left asset quality in the
consumer credit sector less sensitive to exchange
rate movements than in eastern Europe. In the
corporate sector, however, foreign exchange-
denominated debt accounted for 46.2% of
total loans, making credit quality signifi cantly
more vulnerable to potential fl uctuations
in the exchange rate than in the household
sector. In Croatia, the fi nancial crisis in 2007
had the effect of reversing a trend, observed
over several years, of declines in foreign
exchange-denominated lending and the growing
importance of local currency loans. While
households moved part of their deposits into
foreign currency in the face of rising uncertainty,
Croatian banks stepped up the extension of
foreign currency loans until the fi rst quarter of
2009. To some extent this was also a response
to the provision of foreign currency liquidity
by the central bank. Consequently, the share in
total loans of foreign currency loans increased
to 72.7% in 2009.68 In the former Yugoslav
Republic of Macedonia, debt denominated in or
indexed to foreign exchange amounted to about
66.6% in the corporate sector, making corporate
loans especially vulnerable to currency risk. For
household credits this ratio amounted to more
than 46%, meaning that sensitivity to adverse
exchange rate movements remains a key
vulnerability of the credit portfolio in the latter
two countries, whereas in Turkey exchange rate
sensitivity is primarily an issue in the corporate
loan sector.
In Turkey, exposure among households to
interest rate changes is lower than in central and
eastern European peers, as variable rate loans
are less common. In Croatia and the former
Yugoslav Republic of Macedonia, however,
the interest rate risk exposure of the household
sector is signifi cant. Since late 2008 the interest
rate exposure of Croatian households has
increased. According to the CNB, at the end
of March 2009 almost 97% of total household
loans had been issued at interest rates adjustable
within a year. In the former Yugoslav Republic
of Macedonia, adjustable interest rate loans
accounted for 87.3% of total household loans
(2008). As borrowing is mostly long-term,
this has led to a considerable vulnerability of
households to interest rate risk and therefore
could impair asset quality. In the corporate
sector, borrowing is also dominated by
adjustable-rate credit.
In all three candidate countries, high credit
growth has been a signifi cant driver of falling
NPL ratios in the period since 2002. Hence,
the quality of this newly generated credit is
still unknown. However, it may have been
compromised by the extension of credits to
Separate NPL ratios for loans denominated in foreign exchange 64
and local currency were not available for Croatia or Turkey.
See the country sections for a more detailed discussion of 65
exchange rate regimes.
See CBRT (2009), p 40.66
See the country section for more details.67
This was also partly due to a substantial increase in foreign 68
currency borrowing from the banking sector by the government.

59ECB
Occasional Paper No 115
July 2010
4 SPEC IAL
FEATURES
new borrower segments and more lax lending
standards. Since the quality of this credit
portfolio is currently being tested in a harsh
economic environment, asset quality is likely
to deteriorate further in 2010 in Croatia and the
former Yugoslav Republic of Macedonia.
At a level of 5.3%, the overall NPL ratio in
Turkey does not seem alarming when compared
with the level of peers and historical highs.
Nevertheless, steep credit growth in recent
years – from 2002 to 2008, total loans grew at
an annual average rate of approximately 20% –
as a by-product of strong growth and prospects
for EU accession may have endangered credit
quality. The latest data available from the
Turkish Banking Regulation and Supervision
Agency suggest a halt in the deterioration in
asset quality, with overall non-performing loan
ratios declining slightly and the stock of
non-performing loans itself retreating
marginally. Nevertheless, as asset quality is a
lagging indicator and with credit growth
subdued, Turkish banks in the short term could
still see non-performing loan ratios above
pre-crisis levels. The main cyclical risks to
credit quality are deteriorating labour market
conditions and a subdued economic recovery
in western Europe, as Turkey’s real sector is
largely dependent on exports to this region.69
In Croatia, the current recession will put
additional pressure on asset quality in the near
term. Unfavourable economic conditions and
more expensive funding due to rising interest
rates have reduced corporate liquidity to historic
lows and considerably added to the corporate
debt burden. As recovery is likely to be fragile
on account of sluggish bank lending and tight
fi scal policy, there could be a further rise in
defaults in the corporate sector. Additionally,
unfavourable employment and wage dynamics
owing to persistent negative trends in the
domestic labour market coupled with receding
house prices could further erode asset quality in
the consumer loan and mortgage segments. This
can be expected to put a further strain on asset
quality in 2010.
In recent years growing indebtedness and
decreasing liquidity in the corporate sector of
the former Yugoslav Republic of Macedonia
have intensifi ed vulnerabilities to adverse
dynamics in the real sector. As the slow pace
of recovery in main trading partners and tight
external fi nancing conditions will continue to
put a strain on the economy, credit quality is
expected to deteriorate further. With regard to
the household sector, the labour market outlook
will be crucial as the unemployment rate stood
at 32.2% in 2009.
While asset quality is likely to come under
further strain in the current year, potential rises
in non-performing loan ratios are expected to
be manageable, given the satisfactory level of
capital adequacy. Moreover, loan loss provisions
seem comfortable in Turkey, where the indicator
exceeds 80% of non-performing loans for both
the total and the sectoral loan portfolios. In the
former Yugoslav Republic of Macedonia, loan
loss provisions (112.6% of non-performing
Despite the growing importance of the Middle East as a 69
destination for Turkish exports, western Europe still accounted
for approximately 40% of all exports in 2009 according to
national statistics.
Chart 9 Real credit growth to the private sector
(percentage; year on year)
50
40
30
20
10
0
-10
50
40
30
20
10
0
-102002 2003 2004 2005 2006 2007 2008 2009
Turkey
Croatia
FYR Macedonia
Source: National sources.
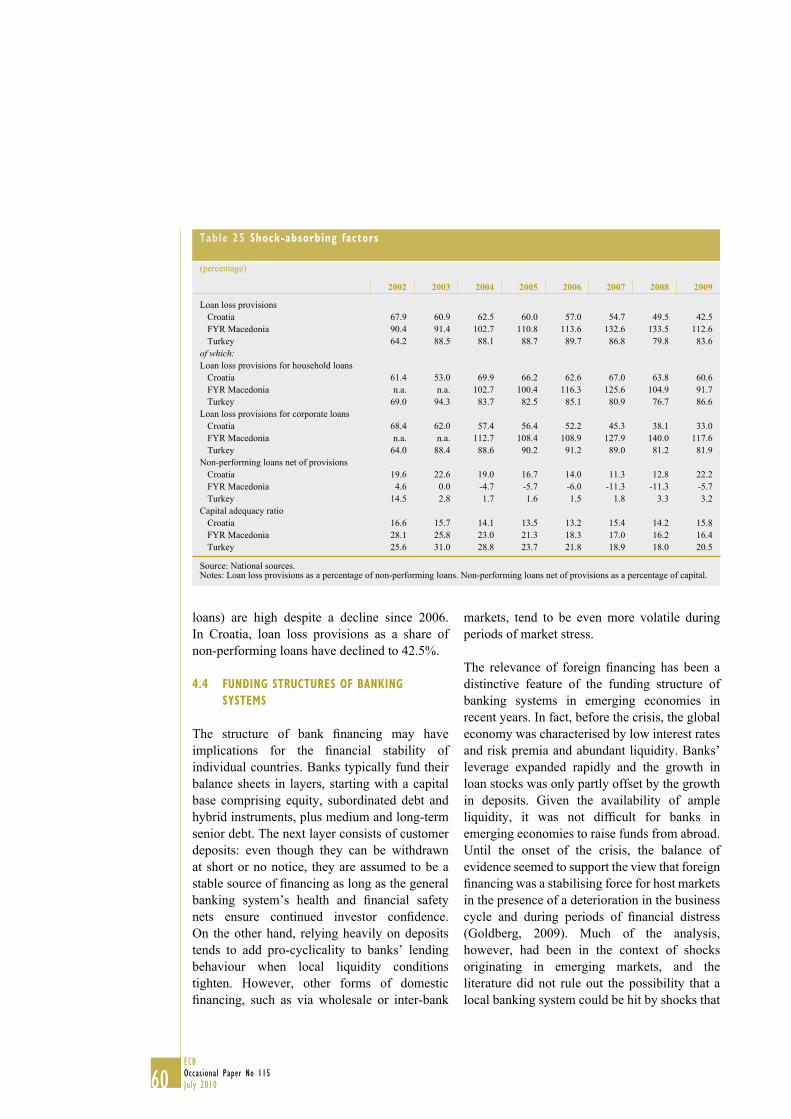
60ECB
Occasional Paper No 115
July 2010
loans) are high despite a decline since 2006.
In Croatia, loan loss provisions as a share of
non-performing loans have declined to 42.5%.
4.4 FUNDING STRUCTURES OF BANKING
SYSTEMS
The structure of bank fi nancing may have
implications for the fi nancial stability of
individual countries. Banks typically fund their
balance sheets in layers, starting with a capital
base comprising equity, subordinated debt and
hybrid instruments, plus medium and long-term
senior debt. The next layer consists of customer
deposits: even though they can be withdrawn
at short or no notice, they are assumed to be a
stable source of fi nancing as long as the general
banking system’s health and fi nancial safety
nets ensure continued investor confi dence.
On the other hand, relying heavily on deposits
tends to add pro-cyclicality to banks’ lending
behaviour when local liquidity conditions
tighten. However, other forms of domestic
fi nancing, such as via wholesale or inter-bank
markets, tend to be even more volatile during
periods of market stress.
The relevance of foreign fi nancing has been a
distinctive feature of the funding structure of
banking systems in emerging economies in
recent years. In fact, before the crisis, the global
economy was characterised by low interest rates
and risk premia and abundant liquidity. Banks’
leverage expanded rapidly and the growth in
loan stocks was only partly offset by the growth
in deposits. Given the availability of ample
liquidity, it was not diffi cult for banks in
emerging economies to raise funds from abroad.
Until the onset of the crisis, the balance of
evidence seemed to support the view that foreign
fi nancing was a stabilising force for host markets
in the presence of a deterioration in the business
cycle and during periods of fi nancial distress
(Goldberg, 2009). Much of the analysis,
however, had been in the context of shocks
originating in emerging markets, and the
literature did not rule out the possibility that a
local banking system could be hit by shocks that
Table 25 Shock-absorbing factors
(percentage)
2002 2003 2004 2005 2006 2007 2008 2009
Loan loss provisions
Croatia 67.9 60.9 62.5 60.0 57.0 54.7 49.5 42.5
FYR Macedonia 90.4 91.4 102.7 110.8 113.6 132.6 133.5 112.6
Turkey 64.2 88.5 88.1 88.7 89.7 86.8 79.8 83.6
of which:Loan loss provisions for household loans
Croatia 61.4 53.0 69.9 66.2 62.6 67.0 63.8 60.6
FYR Macedonia n.a. n.a. 102.7 100.4 116.3 125.6 104.9 91.7
Turkey 69.0 94.3 83.7 82.5 85.1 80.9 76.7 86.6
Loan loss provisions for corporate loans
Croatia 68.4 62.0 57.4 56.4 52.2 45.3 38.1 33.0
FYR Macedonia n.a. n.a. 112.7 108.4 108.9 127.9 140.0 117.6
Turkey 64.0 88.4 88.6 90.2 91.2 89.0 81.2 81.9
Non-performing loans net of provisions
Croatia 19.6 22.6 19.0 16.7 14.0 11.3 12.8 22.2
FYR Macedonia 4.6 0.0 -4.7 -5.7 -6.0 -11.3 -11.3 -5.7
Turkey 14.5 2.8 1.7 1.6 1.5 1.8 3.3 3.2
Capital adequacy ratio
Croatia 16.6 15.7 14.1 13.5 13.2 15.4 14.2 15.8
FYR Macedonia 28.1 25.8 23.0 21.3 18.3 17.0 16.2 16.4
Turkey 25.6 31.0 28.8 23.7 21.8 18.9 18.0 20.5
Source: National sources.Notes: Loan loss provisions as a percentage of non-performing loans. Non-performing loans net of provisions as a percentage of capital.

61ECB
Occasional Paper No 115
July 2010
4 SPEC IAL
FEATURESseriously affected banks in advanced economies,
as demonstrated by the latest crisis.70 These
shocks might be large and more diffi cult for the
local authorities to deal with by themselves.
Lending fl uctuations in host market economies
in response to external shocks may also refl ect
the composition of banks’ exposure to various
sources of foreign fi nancing. Local banks are
likely to be affected differently by global
liquidity conditions according to their relative
exposure to funding in wholesale international
interbank markets, as opposed to fi nancing
directly from their own international banking
groups’ headquarters or related affi liates
(“internal capital market”). More generally,
subsidiaries of large global groups may fi nd it
easier to raise funds in international fi nancial
markets, as information barriers are likely to be
more limited for these entities and, even when
wholesale international markets dry up, they
may still have access to fi nancial support from
their parent group, largely on account of the
long-term nature of the investment and
reputational considerations (Winkler, 2009).71
A general look at banks’ funding structures in
the countries under review at the onset of the
global crisis highlights similarities but also
signifi cant differences (see Chart 10). Such
differences refl ect not only national and
institutional factors, such as prudential
regulations and the relevance of foreign
ownership, but could also be explained by the
level of sophistication of the banks’ business
models and of domestic fi nancial markets,
as well as by differences in asset composition.
For instance, less mature banking systems tend
to be more reliant on retail deposits for their
funding, and this is indeed the case in all
countries under review. In the case of the former
Yugoslav Republic of Macedonia, customer
deposits accounted for 70% of banks’ total
liabilities in 2007; in comparison, their shares
were substantially lower in Turkey (60%) and
markedly so in Croatia (53%), where the relative
importance of customer deposits as a funding
source has signifi cantly decreased since 2001.72
By contrast, the external liability position of
banks in Croatia was relatively high, larger than
The response of the Japanese banks to the capital and real estate 70
market collapse in the early 1990s is indicative of how banks in
advanced economies can transmit domestic fi nancial shocks to
foreign markets (Peek and Rosengren, 1997).
By contrast, in the Asian crisis in the 1990s, as domestic banks 71
had engaged in maturity transformation fi nanced by short-term
loans from many western banks on the basis of an arm’s length
relationship, international lenders did not have information about
the long-term solvency of the borrowers in host markets. Nor had
they particular incentives to acquire such information, given the
short-term nature of their engagement.
By comparison, in 2007 deposits accounted, on average, 72
for around 39% of total liabilities of European banks
(ECB, 2009).
Chart 10 Bank liabilities structure
(percentage of total liabilities and capital)
MFIs deposits
deposits of non-MFIs
debt securities issued
capital and reserves
external liabilities
other liabilities
Croatia
100
80
60
40
20
0
100
80
60
40
20
02007 2008 2009
FYR Macedonia
100
80
60
40
20
0
100
80
60
40
20
02007 2008 2009
Turkey
100
80
60
40
20
0
100
80
60
40
20
02007 2008 2009
Source: National sources.

62ECB
Occasional Paper No 115
July 2010
in both Turkey and the former Yugoslav
Republic of Macedonia.73
Given the large market share held by local
subsidiaries of international banking groups,
fi nancing by foreign parent banks through
non-capital instruments accounted for a sizable
share of total external liabilities in Croatia and
the former Yugoslav Republic of Macedonia: in
the former country it represented about 66% of
total external liabilities in 2007, corresponding
to 13% of GDP, while in the latter the share was
lower (40.5%, corresponding to 2.8% of GDP).
On the other hand, funding in international
wholesale markets (syndicated lending and
placement of bonds, notes and money market
instruments) represented a relevant source of
external fi nancing for Turkey and, to a much
lesser extent, for Croatia, while it was practically
non-existent for banks in the former Yugoslav
Republic of Macedonia (see Chart 11).
Financing through capital and reserves plays
an important role, representing more than 10%
of total liabilities in 2007, a high level when
compared with the average in the European
Union (around 4%). The stronger capital
position in part refl ects the high capital adequacy
requirements as well as the presumably
higher risks faced by banks. It should also be
seen in the light of the high level of foreign
participation in some countries under review, as
parent banks provide a portion of fi nancing to
their subsidiaries in the form of equity capital
(Walko, 2008).
Financing through domestic debt securities was
negligible in all countries, in sharp contrast
with the trend prevailing in EU banking
systems.74 This refl ected a generally low level of
development in corporate debt markets and the
limited scope for institutional investors, as well
At an individual level, however, the dependence on external 73
fi nancing in the banking system in the former Yugoslav Republic
of Macedonia varies considerably.
In 2007 capital market funding accounted for around 27% of 74
the total liabilities of European banks (ECB, 2009). It should be
noted that this fi gure comprises both funding in domestic and
international capital markets, which are considered separately in
the text. The limited reliance on this funding segment by banks
in the countries under review may have represented a stabilising
factor, considering that the issuance of banks’ debt instruments
rapidly dried up during the recent crisis.
Chart 11 Funding in international wholesale markets
(percentage of total liabilities)
2007
2008
2009
International debt securities issuance International syndicated credit facilities
4
3
2
1
0
4
3
2
1
0Croatia Turkey
4
3
2
1
0
4
3
2
1
0Croatia Turkey
Sources: BIS, CNB and CBRT.

63ECB
Occasional Paper No 115
July 2010
4 SPEC IAL
FEATURESas the absence of a legal framework for the
issuance of covered bonds.
Following the eruption of the fi nancial crisis in
August 2007, liquidity became scarce and all
funding sources were more or less affected, even
though immediate spillovers into the banking
systems of the countries under review seem to
have been generally contained.
Customer deposits were initially affected only
to a limited extent, as central bank liquidity
remained available throughout the turmoil and
local authorities were quick to step up their
efforts to support funding needs, for instance
by raising deposit insurance limits where
deemed necessary and preventing bank runs
even in countries where public confi dence in the
banking system was more fragile. As the global
crisis unfolded, however, it spilled over into
domestic funding markets, marking their more
recent developments, when the liquidity position
of banks was adversely affected by a marked
slowdown in both corporate and household
deposits that refl ected the severity of the shock.
In 2009 the growth rates of household and
enterprise deposits sharply decelerated in real
terms in comparison with the pre-crisis level in
Croatia and in the former Yugoslav Republic
of Macedonia, and were subdued in Turkey
(see Chart 12).
Looking at the foreign sources of fi nancing, there
was a relatively larger impact in international
wholesale markets. Indeed, funding in these
markets had not kept pace with balance sheet
growth since the end of 2007, and after the
collapse of Lehman Brothers these sources of
fi nancing almost dried up. In Turkey, rollover
ratios of long-term loans borrowed from abroad
by the banking sector declined sharply at the
end of 2008, stabilising at 90% in subsequent
quarters, while net debt securities issuance
was negative in 2008 and picked up again only
modestly in 2009.
In Croatia, the increasing constraints in
international wholesale markets were offset by
an increase in parent banks’ fi nancing of their
own subsidiaries, as shown by the parent groups’
share of deposits and loans, which reached
73% of total liabilities (15% of GDP) in 2008
and increased further in the fi rst half of 2009.
As a result, foreign liabilities grew on average
by about 10% yearly. In the former Yugoslav
Republic of Macedonia foreign bank support
also increased during the crisis, accounting
for 66% of total foreign fi nancing at the end
of 2009.
Despite a drop in benchmark interest rates in
major advanced economies, higher risk premia
and slowing deposits have signifi cantly raised
banks’ domestic and external funding costs
in Croatia and the former Yugoslav Republic
of Macedonia, where banks in particular have
been forced to compete for resident deposits
by offering higher rates, which in turn has
increased pressure on their interest margins
(see Chart 13). In Turkey the pressure on the
liability side has been balanced by the marked
decline in the central bank’s policy rates to date
(10 percentage points since November 2008;
see the country section).
Chart 12 Real growth in households’ and enterprises’ deposits
(annual percentage change)
Croatia FYR Macedonia Turkey
25
20
15
10
5
0
-5
25
20
15
10
5
0
-5
2007
2008
2009
Source: National sources.

64ECB
Occasional Paper No 115
July 2010
The most recent developments may imply
that, in the near term, funding could represent
a key constraint for banking activity in all
the countries under review. Should banks in
advanced countries continue to deleverage and
to rebalance globally, the reduced availability
and higher cost of external fi nancing would
weigh on banks that rely on these sources of
fi nance. On the other hand, greater reliance
on domestic sources may offer limited scope
for raising funds, as domestic savings in these
countries will likely remain rather subdued
in the foreseeable future and the increased
competition for retail deposits may force banks
to increase rates, thus raising funding costs and
possibly eroding net interest margins.
4.5 THE ROLE OF PARENT BANKS IN CANDIDATE
COUNTRIES
As a result of privatisation and fi nancial sector
liberalisation, foreign-owned banks have
established a dominant position in the banking
sectors of Croatia and the former Yugoslav
Republic of Macedonia, where, respectively,
they held 90.9% and 93.3% of total banking
assets at the end of 2009. Such high levels of
foreign ownership are a common feature of
many transition economies in central, eastern
and south-eastern Europe, but are unprecedented
in recent economic history. In contrast, the
foreign bank presence is less substantial in
Turkey, where 15.8% of banking assets were
under foreign control in 2009.
Foreign ownership of banks predominantly
takes the form of subsidiaries (see Table 26),
established mainly as a result of the acquisition
of domestic banking institutions in the process
of privatisation or restructuring. Branches of
Chart 13 Interest expenses
(percentage of total interest-bearing liabilities)
Croatia
10
8
6
4
2
0
10
8
6
4
2
02007 2008 2009
FYR Macedonia
10
8
6
4
2
0
10
8
6
4
2
02007 2008 2009
Turkey
10
8
6
4
2
0
10
8
6
4
2
02007 2008 2009
Source: National sources.
Table 26 Foreign bank presence in candidate countries
Croatia FYR Macedonia Turkey
Number of banks under foreign control 1) 15 14 24
of which:Subsidiaries of foreign banks 15 8 18
Branches of foreign banks 0 0 6
Other forms of foreign ownership 0 6 0
Share of assets held by foreign banks 90.9 93.3 15.8
Source: National sources.1) Banks with at least 50% of their capital under foreign control (banks, other fi nancial institutions, non-fi nancial legal entities or legal persons).
65ECB
Occasional Paper No 115
July 2010
4 SPEC IAL
FEATURESforeign banks operate only in Turkey.
The preference for subsidiaries can be explained
by restrictive host country regulation 75 of the
opening of branches, the focus of foreign bank
activities on retail services and the preferences
and business models of parent banks. In the
former Yugoslav Republic of Macedonia some
foreign majority shareholders are non-banking
corporations or natural persons in the case of
some very small banks. It is also important to
note that the subsidiaries of foreign banks in the
former Yugoslav Republic of Macedonia barely
depend on external funding from their parent
banks (see section 4.4).
IMPLICATIONS FOR FINANCIAL STABILITY
IN HOST COUNTRIES
On balance, the experience so far suggests
that fi nancial stability in the region has
benefi ted from the presence of foreign banks.
Recent empirical research 76 has argued that
the reduction in cross-border bank fl ows to
emerging Europe during the current crisis was
more limited than the reduction in the fl ows
to emerging Asia and Latin America because
of a high penetration of foreign banks and a
relatively sound banking system in the region.
The strength of the banking system is the result
of a focus on mainstream banking activities in
a growing market, low exposure to toxic assets
and sound prudential management.
Other empirical research 77 has found that
foreign banks contributed to credit market
stabilisation in transition economies, as their
lending activities were more resilient to local
shocks than those of domestic banks. In addition
to having easier access to cross-border lending
in general, foreign bank subsidiaries dependent
on external funding were able, in particular, to
draw on the deep pockets of their parent banks,
which were willing to support them. Considering
that parent banks entered the region with a long-
term perspective related to EU integration and
convergence, expected future profi ts, as well
as the potentially high costs of damage to their
reputation in the event of a pull-out, underpin
their decision to maintain activities.
In addition, large-scale multilateral support
packages and the private sector coordination
orchestrated by multilateral institutions and
foreign creditors (European Bank Coordination
Initiative) were also very instrumental in
encouraging the continued commitment of
cross-border banks to the broader region.
At the same time, foreign banks have been the
drivers of rapid credit growth and they may
have underestimated the build-up of credit
risk in a period of buoyant economic growth.
They have also promoted foreign currency
lending, effectively passing on the exchange
rate risk to (mostly unhedged) borrowers.
High domestic vulnerabilities to exchange rate
shocks have constrained the ability of host
country governments to use the exchange rate
as an instrument during the economic downturn
(except for Turkey).
Foreign bank subsidiaries could also become
destabilising factors when they transmit shocks
originating in the parent bank or elsewhere in
the group. Indeed, research 78 has found that a
deterioration in parent bank health is associated
with a decline in growth of credit to emerging
markets.
An additional concern for Croatia and the
former Yugoslav Republic of Macedonia is
that the ownership of their banking system is
highly concentrated in a couple of countries
(see Chart 14), namely Austria and Italy for
the former and Greece and Slovenia for the
latter. This amplifi es the risk of a transmission
of shocks originating in the home country.
Contagion can be prevented through rapid and
decisive actions by the international community
The regulation of foreign bank branches in Croatia is still very 75
restrictive, while the former Yugoslav Republic of Macedonia
did not allow the opening of foreign bank branches before its
new banking law of 2007 came into force.
See, for example, the EBRD Annual Report (2009) and 76
Herrmann and Mihaljek (2010).
See, for example, De Haas and Van Lelyveld (2010) and 77
Hasselmann (2006).
See, for example, McGuire and Taraslev (2008), De Haas and 78
Van Lelyveld (2006) and Popov and Udell (2010).

66ECB
Occasional Paper No 115
July 2010
and home country governments, as the recent
troubles with Hypo Group Alpe Adria and
Volksbank, which were quickly rescued by the
Austrian government, illustrate. In the case of
the former Yugoslav Republic of Macedonia,
direct spillovers from the Greek crisis are very
limited given that local subsidiaries depend little
on external funding and are well-capitalised.
Sound parent banks can also act as a buffer for
the transmission of shocks originating at home
(e.g. Greece). By contrast, foreign banks in
Turkey come from various countries that are not
all closely interrelated (some from the European
Union and others from the Middle East),
resulting in a better diversifi cation of risks.
SUPERVISION OF BANKING GROUPS
For host countries with a high participation of
foreign banks, some of them being systemically
important for the host country’s banking sector,
negative spillovers from parent banks may be a
source of concern in times of crisis. Especially in
cases where home country authorities turn out to
be unwilling or unable to conduct the rescue of
an entire group (e.g. the collapse of the Icelandic
banks), spillovers into the host countries can be
very severe. In the case of branches, the scope
for action by host authorities is limited because
parent banks are fully responsible for the
liabilities of their branches. In the case of
subsidiaries, the scope for measures by host
Chart 14 Geographic distribution of parent banks
(percentage share of foreign bank assets held by parent banks of the same country; ultimate owner basis)
Croatia FYR Macedonia
IT
AT
FR
other
GR
Sl
FR
other
Turkey
GR
GB
BE
other
Sources: BankScope and national sources.

67ECB
Occasional Paper No 115
July 2010
4 SPEC IAL
FEATURESauthorities may be larger, as subsidiaries
can be ring-fenced from the group and can
continue their operations in the host country
as independent units, or be liquidated by the
host country authorities that are responsible for
insuring local depositors. However, the recently
observed trend of centralisation at parent bank
level of some key functions, such as risk and
liquidity management, implies that the viability
of the subsidiary as a stand-alone unit may not be
taken for granted, hence the cost of a failure to
host countries could be high. Moreover, the risk
of unilateral actions and recourse to fi nancial
protectionism by the home authorities is greater,
as there is no legal requirement for the parent
bank to support its subsidiaries. Conversely,
unilateral actions on behalf of host governments
to ring-fence a subsidiary of a troubled bank can
also infl ict damage on the parent bank, its home
government and the subsidiaries in other host
countries.
These complexities have highlighted the need
for information sharing and cooperation between
different national bank supervisors in order to
supervise more effectively banks with signifi cant
cross-border operations and to coordinate actions
during a crisis. One possibility is to establish
supervisory colleges – a formal structure
bringing together some of the host supervisors
with the home supervisor, namely the banking
supervisor of the country in which the banking
group is headquartered. Supervisory colleges
are designed to share prudential information
about a particular fi nancial institution with
cross-border operations. They operate within the
frameworks developed by the Basel Committee
of Banking Supervisors, the Financial Stability
Board (FSB) and the Committee of European
Banking Supervisors (CEBS). Moreover, they
have gained in importance since the eruption
of the global fi nancial crisis. All systemically
important international and European banking
groups now have a supervisory college in full
operation. At the same time, there has been a
reinforcement of the mandates of the FSB and
CEBS to promote the functioning of supervisory
colleges through the drafting of more stringent
principles and guidelines on home-host
cooperation. Refl ecting the deep integration
of EU fi nancial markets, the framework for
supervisory cooperation at the European level
is more ambitious, aiming for the convergence
of supervisory practices and the development
of common reporting formats for prudential
information, as well as a centralised database.
Recently, CEBS has been granted observer
status on all supervisory colleges overseeing
European banking groups and a mediator role in
confl icts between national supervisors, although
it lacks the power to impose its decisions directly
on national supervisors or fi nancial institutions.
Another instrument to promote the exchange of
information between banking supervisors in the
context of the supervision of international banks
is the conclusion of memoranda of understanding
(MoU) between the supervisors and central
banks of two or occasionally more countries.
This tool is particularly attractive for smaller
countries given that the participation of host
supervisors in a supervisory college is often
limited to those overseeing subsidiaries that are
signifi cant or systemically relevant to the
banking group, which tends to favour larger host
countries. The candidate countries have
concluded many bilateral MoU with their main
partners in the European Union as well as with
the other countries in the western Balkans.
The Bank of Greece has also concluded a
multilateral MoU on high-level principles of
cooperation and exchange of information in the
fi eld of banking supervision across south-eastern
Europe.79 This MoU foresees regular meetings
of Heads of Supervision Departments and
Governors, annual information exchanges on
macroeconomic and fi nancial sector indicators,
joint on-site inspections and the creation of task
forces on specifi c issues to be tackled
(e.g. stress-testing).
The above developments are important for the
promotion of information sharing between
national bank regulators and will hopefully
This multilateral MoU was signed in 2007 by the central banks 79
of Albania, Bosnia and Herzegovina, Bulgaria, Cyprus, Greece,
the former Yugoslav Republic of Macedonia, Montenegro,
Romania and Serbia.

68ECB
Occasional Paper No 115
July 2010
strengthen the resilience of the banking systems
through better supervision of international and
European fi nancial institutions and the early
identifi cation of problems in these institutions.
In the meantime, the current global crisis provides
a solid testing ground for the adequacy of the
institutional framework to ensure cooperation
between supervisors and governments in home
and host countries. In particular, the following
issues warrant closer examination:
Is the information shared during a crisis •
mutually satisfactory? Information sharing
under a MoU or in the context of a supervisory
college should, in principle, be reciprocal,
but may take the form of a predominantly
one-way communication from the host to the
home supervisor. It should be highlighted
that trust is crucial in these arrangements.
Are supervisory standards in host countries •
on a par with international standards? Only
Turkey, as a member of the G20, benefi ts
from participation in the meetings of the
Basel Committee of Banking Supervisors
and the FSB. However, none of the three
candidate countries participate in CEBS
meetings even though they are expected
to adopt its regulatory and supervisory
standards upon EU accession. This lack of
access to information is partly addressed
by the Eurosystem’s technical assistance
programme on strengthening macro
and micro-prudential supervision in EU
candidates and potential candidates, which
is aimed at promoting supervisory standards
in the target countries through the transfer
of expertise and know-how via extensive
training sessions.
Can the current arrangements prevent •
unilateral actions by home or host
supervisors/governments to the detriment
of the banking group? Neither instrument
can guarantee a coordinated approach to
crisis resolution in the event of a banking
failure, as this requires a consensus between
different banking supervisors and fi nancial
sector regulators. The incentives of national
supervisors to protect their national interests
and residents may impede the emergence of
a consensus, while there is no supranational
institution that can impose binding decisions
directly on an insolvent bank with signifi cant
cross-border operations.
4.6 TRENDS IN FOREIGN EXCHANGE LOANS
AND DEPOSITS
The use of foreign currencies is a potential
vulnerability in each of the candidate countries.
Particularly in Croatia and the former Yugoslav
Republic of Macedonia a majority of loans and
deposits are denominated in or indexed to foreign
currencies. Households especially tend to save in
foreign exchange-denominated accounts, while
both corporations and households have borrowed
heavily via foreign currency-indexed loans. In
Turkey, household lending in foreign currencies
is low and – as a consequence of new regulations
– declining, but there is widespread provision
of corporate credit in foreign currencies. Owing
to prudential rules that discourage currency
mismatches at credit institutions, open foreign
exchange positions in the fi nancial sector are
small. However, foreign exchange lending does
raise fi nancial stability concerns insofar as it
represents a (pro-cyclical) systemic credit risk.
While authorities in candidate countries have
used a range of measures to discourage such
lending both before and during the crisis, the
recent global fi nancial turbulence has brought
about a decline in trust in local currencies in
Croatia and the former Yugoslav Republic of
Macedonia, which has led once again to an
increasing use of foreign currencies in fi nancial
transactions. Appropriate policy responses are
needed to manage and reduce systemic risks
arising from the use of foreign currency.
FINANCIAL STABILITY CONCERNS RELATED
TO THE USE OF FOREIGN CURRENCY
The widespread use of foreign currency in the
fi nancial system generates risks due to currency
mismatches as a result of which the balance
sheets of economic actors can be severely
affected by changes in nominal exchange rates
(see ECB, 2006 and 2008). There are especially

69ECB
Occasional Paper No 115
July 2010
4 SPEC IAL
FEATURESlarge risks where mismatches may trigger
economy-wide losses in a simultaneous,
pro-cyclical manner, particularly during a crisis.
In this perspective, currency mismatches at credit institutions are a well-known threat to the
smooth functioning of the fi nancial system.
Yet, in the candidate countries, the use of
prudential policies by the authorities has so far
been relatively successful in discouraging such
mismatches. In all countries, there are additional
reserve or liquidity requirements for foreign
exchange positions. In Turkey, the banks’ open
foreign currency position may not exceed 20%
of bank equity, but Croatia and the former
Yugoslav Republic of Macedonia have similar
measures too, according to which the banks’
open foreign exchange position is currently
limited to 30% of banks’ own funds. As long as
these measures remain effective, credit
institutions should be well-insulated from direct
exchange rate risk. On the other hand,
the spillovers from the global fi nancial crisis
have entailed in some instances a relaxation of
related legislation in order to leave banks more
room for manoeuvre in times of heightened
(foreign exchange) liquidity pressures.80
The more salient risk from a systemic stability
perspective is constituted by currency mismatches on the balance sheet of borrowers,
i.e. currency-induced credit risk. In the case of
more pronounced exchange rate depreciations,
as is common during crises, a short foreign
currency position (net foreign currency
borrowing) can cause the real debt level of
households and corporations to rise, leading to
a pro-cyclical decline in credit quality. Because
loan values are linked to the value of a foreign
currency, both foreign exchange-indexed and
denominated loans behave similarly in this
regard. Yet, even without depreciation, risks
can materialise. In the case of an external shock,
a country might need to increase interest rates
(sharply) to mitigate downward pressures on
the exchange rate. This may in turn affect
clients borrowing in local currency at adjustable
interest rates and also lead to a deterioration in
(local currency) credit quality in the economy.
Thus, the authorities of countries with rigid
exchange rates may face a policy confl ict
owing to the widespread use of foreign
currency, which may complicate responses to
fi nancial crises.
RECENT TRENDS AND FACTORS INFLUENCING
THE USE OF FOREIGN CURRENCIES
Between 2004 and 2007 the candidate countries,
in particular Croatia and Turkey, experienced
rather substantial declines in the overall use
of foreign currency in the fi nancial system on
both the asset and liability sides. In the former
Yugoslav Republic of Macedonia, a declining
use of foreign currencies on the liability side
went hand in hand with an increasing use of
foreign currencies on the asset side. At the
same time, foreign exchange-denominated and
indexed loans and deposits were still in the
majority in Croatia and the former Yugoslav
Republic of Macedonia, where the overall use
of foreign currencies in the economy is higher.
During the crisis years of 2008 and 2009, this
downward trend reversed, and particularly
in Croatia and the former Yugoslav Republic
of Macedonia the use of foreign currencies
increased markedly. In Turkey, however,
the degree of foreign currency use remained
largely stable at levels comparable with
those of 2007.
As regards deposits, the share of foreign currency-
denominated deposits increased fi rst and foremost
in the corporate sector but also (except for
Turkey) in the household segment (see Chart 15).
There is evidence that the increasing propensity
of households to save in foreign currency – or
to convert local currency-denominated deposits
into foreign currency deposits – followed a
general fall in confi dence in local currencies and
the banking sector as a result of the fi nancial
crisis (see Dvorsky, Scheiber and Stix, 2009).81
For example, among other measures the Croatian National Bank 80
(CNB) increased the maximum permitted open foreign exchange
position for banks from 20% to 30% of equity in February 2009
and decreased the required ratio of foreign currency liabilities
to liquid foreign currency claims of banks in several steps,
from 32% in May 2008 to 20% in February 2009.
This was accompanied by episodes of temporary deposit 81
withdrawals, mainly in Croatia and the former Yugoslav
Republic of Macedonia, in the fi nal quarter of 2008.

70ECB
Occasional Paper No 115
July 2010
Market stabilisation and policy measures,
such as the expansion of the deposit guarantee
system in Croatia in the fi nal quarter of 2008,
may have begun to underpin public confi dence
(see section 4.7), but the effects on the use of
local currencies are more diffi cult to gauge and
may be more persistent.
Turning to foreign currency-denominated
loans, the greater share of foreign exchange
deposits and sizeable differentials between
local and foreign currency interest rates were
mirrored by a greater reliance among fi rms on
foreign currency borrowing (see Chart 16).
Throughout the review period, foreign
currency lending (domestic foreign currency
demand) was buttressed by the large savings
position in (the domestic supply of) foreign
currency. Foreign wholesale funding (Turkey)
and funding by parent banks (Croatia and the
former Yugoslav Republic of Macedonia)
provided a further supply of foreign exchange
to the economy, though this was constrained
at the height of the fi nancial crisis as cross-
border capital fl ows slowed (see section 4.4).
At such times, candidate country central banks
were on the spot to provide the economies
with suffi cient foreign currency liquidity.
Furthermore, as a consequence of the global
fi nancial crisis, the currency composition of
foreign currency loans has changed. In Croatia,
for example, the share of Swiss franc loans in
total foreign currency loans – which had grown
rapidly in the period 2004-07 as a result of very
low interest rates – decreased substantially
in 2008 and 2009. Likely causes were the higher
volatility of the kuna against the Swiss franc
(in contrast to the euro), the more limited supply
of CHF loans by banks (diffi culties in obtaining
CHF liquidity) and subsequent conversions of
CHF-denominated loans into euro loans.
Factors infl uencing the growth in foreign
currency borrowing are manifold. Survey
evidence from the national central banks of
the three candidate countries exhibits the
different motives underpinning borrowing in
foreign currency in the respective economies,
with both demand-side and supply-side factors
playing a key role (see Table 27 and Chart 17).
In each country, foreign currency-denominated
loans are attractive on account of economic
Chart 15 Development of foreign currency deposits (2007-09)
(percentage of total deposits)
Forex-indexed deposits
Forex-denominated deposits
Croatia
0
10
20
30
40
50
60
70
80
90
100
0
10
20
30
40
50
60
70
80
90
100
2007 2008 2009 2007 2008 2009 2007 2008 2009
All sectors Households Non-bank
corporations
FYR Macedonia
0
10
20
30
40
50
60
70
80
90
100
0
10
20
30
40
50
60
70
80
90
100
2007 2008 2009 2007 2008 2009 2007 2008 2009
All sectors Households Non-bank
corporations
Turkey
0
10
20
30
40
50
60
70
80
90
100
0
10
20
30
40
50
60
70
80
90
100
2007 2008 2009 2007 2008 2009 2007 2008 2009
All sectors Households Non-bank
corporations
Source: National sources.Note: For forex-indexed deposits no sectoral breakdown is available before 2009 in the former Yugoslav Republic of Macedonia.

71ECB
Occasional Paper No 115
July 2010
4 SPEC IAL
FEATURES
factors, particularly a lower interest rate for
borrowers and the lack of availability of
medium and long-term local currency fi nancing
at a reasonable price. While local currency
credit and money markets have continued to
deepen in the candidate countries in recent
years, interest rate and term factors remain less
favourable than in foreign currency markets. The
openness of domestic economies also explains
the attractiveness of foreign exchange loans.
For fi rms with access to export earnings and
households that receive remittances or income
from tourism (e.g. Croatia), foreign currency
borrowing may represent a means of reducing
currency mismatches and smoothing the
purchasing power of foreign currency income.
However, for households and fi rms without
income in foreign exchange, such borrowing
represents an unhedged foreign currency
position that increases the credit risk for banks.
Chart 16 Development of foreign currency loans (2007-09)
(percentage of total loans)
Forex-indexed loans
Forex-denominated loans
Croatia
0
10
20
30
40
50
60
70
80
90
100
0
10
20
30
40
50
60
70
80
90
100
2007 2008 2009 2007 2008 2009 2007 2008 2009
All sectors Households Non-bank
corporations
FYR Macedonia
0
10
20
30
40
50
60
70
80
90
100
0
10
20
30
40
50
60
70
80
90
100
2007 2008 2009 2007 2008 2009 2007 2008 2009
All sectors Households Non-bank
corporations
Turkey
0
10
20
30
40
50
60
70
80
90
100
0
10
20
30
40
50
60
70
80
90
100
2007 2008 2009 2007 2008 2009 2007 2008 2009
All sectors Households Non-bank
corporations
Source: National sources.
Chart 17 Credit and deposit growth in candidate countries (2007-09)
(percentage, year on year; resident non-MFIs)
Croatia (LC)
FYR Macedonia (LC)
Croatia (FC)FYR Macedonia (FC)
Turkey (FC)
Turkey (LC)
Credit growth in candidate countries
-20
0
20
40
60
80
-20
0
20
40
60
80
June June June2008 20092007
Deposit growth in candidate countries
-20
0
20
40
60
80
-20
0
20
40
60
80
June June June2008 20092007
Source: National sources.Note: LC = local currency; FC = foreign currency.

72ECB
Occasional Paper No 115
July 2010
The stability of the exchange rate, especially in
the former Yugoslav Republic of Macedonia
and Croatia, also encourages borrowing in
foreign currency, in the expectation that the
loan’s value will remain stable. Expectations
of future euro accession, while less salient than
in new EU Member States, may also play a
role. In Turkey, expectation among borrowers
of lira appreciation was a further contributing
factor. In Croatia, persistently low confi dence
in the domestic currency given recurring
hyperinfl ationary episodes in the past is cited
as an explanation for foreign currency lending.
This is probably also valid for Turkey and the
former Yugoslav Republic of Macedonia. In
the former Yugoslav Republic of Macedonia
especially, the high presence of foreign-owned
banks may also have contributed to fuelling
foreign currency loans.
POLICY RESPONSES: PAST, PRESENT AND FUTURE
Evidence from the central banks of Croatia and
the former Yugoslav Republic of Macedonia
shows that there are signifi cant unhedged
positions on household balance sheets, which
means that currency-induced credit risk in
the household sector is a key risk. In general,
it is estimated that in Croatia 82% of all foreign
currency loans were unhedged as of June 2009,
while at the same time 96% of households’
net placements and contingent liabilities in
foreign currency were not hedged. The fall
in tourism and remittance income during
the crisis, particularly in the western Balkan
countries, may have also deprived borrowers of
foreign currency income and thus contributed
to declining credit quality (see section 4.3).
On the other hand, the low interest rates on
euro-denominated loans may actually have
been a stabilising factor in credit quality,
especially as local currency interest rates
proved to be more volatile.
For fi rms, there is evidence that foreign currency
lending is most common among borrowers with
foreign exchange income (Brown, Ongena and
Yesin, 2009), although unhedged currency positions
could also represent a risk for corporations.
Borrowing based on appreciation expectations –
“carry trade behaviour” by fi rms – appears to be
present in Turkey. This is a source of particular
concern insofar as borrowers are purposefully
taking on currency risk, speculating on a falling
real debt level. If exchange rate expectations
materialise – i.e. nominal appreciation occurs
– foreign currency lending becomes attractive;
in the case of unexpected adverse exchange
rate movements, however – particularly during
economic downturns or crises – such lending
increases credit risk in a pro-cyclical manner.
Table 27 Factors influencing foreign currency borrowing
Croatia FYR Macedonia Turkey
Demand-side factors
Interest rate differential for loans in domestic and foreign currency Medium High Medium
High level of “euroisation” in the economy Medium High Low
High openness of the economy High Medium Medium
No or low historical exchange rate volatility Low n.a. n.a.
Fixed/pegged exchange rate to the euro Low High n.a.
Appreciation and/or expectation of appreciation of domestic currency n.a. n.a. High
Persistently low confi dence in domestic currency owing to decades
of recurring hyper-infl ationary episodes
High n.a. n.a.
Supply-side factors
Insuffi cient domestic savings Medium Low Low
Low-developed local currency credit/money markets Low n.a. n.a.
Unavailability of longer-term debt in local currency High Medium Low
High presence of foreign-owned banks Low High n.a.
Prudential rules for direct foreign exchange risk management by banks Medium High n.a.
Source: National central banks.Note: n.a. = not available.

73ECB
Occasional Paper No 115
July 2010
4 SPEC IAL
FEATURESThe Turkish authorities’ decision in June 2009
also to ban foreign currency-indexed borrowing
by households may have been a reaction to
these concerns. Thus, in Turkey, foreign
currency-denominated and indexed loans are
now available only for commercial purposes,
but foreign exchange-denominated loans
must have a maturity greater than one year
and a volume greater than USD 5 million.
Central banks in Croatia and the former
Yugoslav Republic of Macedonia have
also taken measures to discourage foreign
exchange lending to households (see Table 28),
in particular by tightening reserve requirements
on banks’ foreign currency liabilities. The
Croatian authorities also proactively increased
these risk weights between 2005 and 2008, thus
lowering capital adequacy ratios and spurring
capital increases by banks. Such measures were
likely to have been constructive, even if they
could not fully dampen the provision of new
unhedged foreign currency lending.
In the aftermath of the crisis, it is a challenge
for authorities to fi nd policies which can
effectively reduce systemic risks and yet be
implemented over an appropriate time period
without hampering the recovery of the economy
and the fi nancial system. There is a balance
between loosening regulations in order to
support recovery and reforming them so as
to prevent the build-up of new systemic risks.
While restrictions on foreign currency lending
may be desirable from a fi nancial stability
point of view, their implementation – given
the lack of long-term funding in local currency
markets – may drastically restrict the supply
of credit to the economy. As a result, both the
design and the timing of policy are critical.
Therefore, developing long-term local currency
funding markets seems of key importance.
In fi nding effective policies, there is also the
need to differentiate between the stock and
fl ow problem, as recent or future regulations
only target newly-generated foreign exchange
lending and do not deal with the available
stock of foreign exchange-denominated or
indexed loans. Furthermore, there is a very
clear link between the microeconomic choice
of foreign currency lending and macroeconomic
imbalances. Tackling persistent external defi cits,
for example through fi scal restraint, therefore
may also contribute to reducing foreign
exchange risks.
As mentioned in previous reports on fi nancial
stability challenges in the candidate countries
(e.g. ECB 2006 and 2008), there is a clear role
for fi nancial literacy and moral suasion to make
sure that borrowers are aware of currency-related
risks. In the interests of consumer protection,
the transparency of lending products in foreign
currencies can also be enhanced. For example,
banks can illustrate the sensitivity of interest
payments to potential depreciation scenarios
and provide information on the past volatility of
the exchange rate over a suffi ciently long time
period. In addition, banks may sell insurance
against excessive exchange rate volatility.
Moreover, banks could apply stricter credit
criteria (e.g. lower payment-to-income and/or
loan-to-value ratios for mortgages) on foreign
currency loans, again with the above-mentioned
caveats in terms of the timing and scale of such
restrictions.
Previous experience shows that discouraging
the accumulation of such risks through policy is
Table 28 Measures taken by authorities to discourage foreign currency lending
Croatia FYR Macedonia Turkey
Reserve requirements on bank liabilities in foreign currency X X X
Quantitative restrictions on forex lending X
Special forex liquidity requirements X X
Increasing risk weights X
Guidelines/recommendations for banks or customers X X
Source: National central banks.

74ECB
Occasional Paper No 115
July 2010
diffi cult even in benign economic environments
(Rosenberg and Tirpák, 2008). On the other
hand, increased awareness of the topic at the
international level is more and more evident.
In this regard, there are ongoing discussions
to broaden the scope of the European Bank
Coordination (“Vienna”) Initiative, which was
launched at the height of the global fi nancial
crisis in January 2009 with the participation of
the home and host authorities of large cross-
border banking groups operating in central,
eastern and south-eastern Europe, international
fi nancial institutions (e.g. IMF, EBRD,
EIB, World Bank) and the banking groups
themselves. Alongside maintaining parent bank
exposures, the focus of the initiative should
also be extended to the remaining challenges,
such as the region’s strong reliance on external
fi nancing and large foreign exchange exposures.
In particular, it should tackle the vulnerabilities
arising from weak domestic capital markets, the
limited reliance on domestic fi nancing sources
and foreign exchange lending to unhedged
borrowers.
As fundamentals improve, the emphasis should
naturally shift towards enhanced implementation
of risk-mitigating policies. Discussion with
authorities within and outside the European
Union will be necessary to come up with best
practices for limiting systemic risk stemming
from foreign currency lending.
4.7 MEASURES TAKEN TO TACKLE
THE IMPLICATIONS OF THE CRISIS
This section reviews monetary policy,
regulatory and administrative measures that
have been taken in the candidate countries to
mitigate the impact of the crisis on the banking
sector. The timeframe covers the period since
the intensifi cation of the global fi nancial crisis
following the fall of Lehman Brothers. Most
measures entailed reversing or abolishing
previous measures to slow down credit growth
and avoid lending booms, which allowed a
timely and countercyclical response to the
crisis. Furthermore, it should be emphasised
that monetary policy transmission operates
to a large extent via exchange rate policy,
especially in Croatia and the former Yugoslav
Republic of Macedonia, given their tightly
managed exchange rate regimes and the banking
sector’s sizeable share of foreign exchange-
denominated assets and liabilities. Monetary
policy transmission tends to be more effective
in Turkey, operating under an infl ation-targeting
and fl oating exchange rate policy framework,
but exchange rate management also played an
important role as testifi ed by several measures
taken to stabilise the currency at the end of 2008.
In what follows, we only describe the measures
that have been implemented in a given country,
i.e. if a particular measure is not mentioned for a
given country, then that type of measure has not
been implemented there (see Table 29).
MONETARY POLICY MEASURES
Change in policy rates and reserve requirements
The paths of policy interest rates between
October 2008 and early 2010 differed
considerably across the candidate countries.
In Croatia, the repo rate was reduced from
7.75% to 6% in December 2008. The CNB also
changed some of its operational instruments.
Auctions were changed from multiple to
fi xed-price. This contributed to stabilising
the interest rates on the domestic money
market, which had been highly volatile in
the months following the fall of Lehman
Brothers. Several changes in the reserve
requirements for banks were introduced in
order to free domestic and foreign exchange
liquidity. Most of the measures entailed
reversing or abolishing previous measures
designed to slow down overall bank lending.
The marginal reserve requirement, fi rst
introduced in July 2004 to curb banks’ foreign
indebtedness and then raised several times
before the crisis, was abolished in October 2008.
In addition, the special reserve requirement on
banks’ liabilities arising from issued securities,
introduced in February 2006, was abolished in
February 2009. The general reserve requirement
ratio was reduced from 17% to 14% in
December 2008 and the foreign exchange
component of the reserve requirement ratio cut

75ECB
Occasional Paper No 115
July 2010
4 SPEC IAL
FEATURES
in January 2009 to release foreign exchange
liquidity for the banking sector. This reserve
requirement was further reduced from 14% to
13% in February 2010.
In the former Yugoslav Republic of Macedonia,
the interest rate on central bank bills was fi rst
increased in March 2009, from 7% to 9%, in the
context of increased pressures on the domestic
currency. In May the NBRM adopted additional
restrictive monetary policy measures by
increasing the reserve requirement for foreign
exchange liabilities from 10% to 13%, and
from 10% to 20% for foreign currency-indexed
liabilities (where the change in the former was
implemented in two steps). The alleviation of
pressures on the foreign exchange market at the
end of 2009 has allowed the NBRM to lower
its main interest rate on several occasions since
December 2009 – from 9% to 5% by the middle
of June 2010.
In Turkey, the central bank responded to
the crisis by making sizeable cuts in policy
rates in a context of rapidly falling infl ation
triggered by contracting domestic and external
demand. The CBRT has reduced its main policy
rate – the overnight borrowing rate – by a
cumulative amount of 1,025 basis points since
October 2008 – from 16.75% to 6.5% by
Table 29 Measures implemented to tackle the crisis in the candidate countries
Croatia FYR Macedonia Turkey
Monetary policy
Main interest rate 7.75% to 6% 7% to 9% (March 2009)
9% to 5% (since December 2009)
16.75% to 6.5%
Reserve requirements 17% to 13%; abolition
of marginal reserve
requirement and special
reserve requirement
10% to 13% (forex liabilities)
10% to 20% (forex-indexed
liabilities)
6% to 5% (TRY liabilities);
11% to 9% (forex liabilities)
Exchange rate Net selling of €784 million
(October 2008-February 2009);
foreign currency swaps with
banks; reduction of minimum
forex claims ratio
Net selling of €230 million
(fi rst half of 2009); allowing forex
deposits at the central bank from
banks
Intermediation window for
banks FX deposits; forex selling
auctions (USD 100 million);
decreasing the lending rate
on central bank forex loans
Collateral Broadening the eligible
collateral to Ministry of
Finance T-bills denominated
in EUR
Regulatory measures
Quantitative limits on lending Annual credit growth limit
of 12% removed
Annual credit growth limit
of 11.3% removed
Open FX position Open forex position
from 20% to 30%
Deposit insurance HRK 100,000 to HRK 400,000 Council of Ministers authorised
to raise the amount (not used)
Profi t distribution Obligation for banks to get
permission for profi t distribution
for 2008 and 2009
Loan restructuring Changes in the regulation on
provisioning; loan restructuring
of credit card loans
Other Introducing a minimum liquidity
ratio
Administrative measures
Extension of the limit of export
rediscount credit; guarantee
scheme cash loans extended
to the SMEs
Source: National central banks.Notes: The table refers to measures taken since October 2008. Forex = foreign exchange.

76ECB
Occasional Paper No 115
July 2010
November 2009 – and has kept it unchanged
since then. In addition, the foreign exchange
reserve requirement ratio was reduced from
11% to 9% in December 2008. As a result,
the Turkish banking sector was provided
with foreign exchange liquidity equivalent to
USD 2.5 billion. More recently, since June 2009,
with the aim of enhancing the sound functioning
of the banks’ liquidity management and
strengthening the monetary policy transmission
mechanism, the CBRT started to use more
actively, when necessary, repo transactions with
maturities of up to three months (in addition to the
one-week maturity repo auctions that is the usual
CBRT operating instrument). In October 2009,
in order to reduce intermediation costs and inject
permanent liquidity into the markets with the
aim of supporting the upward trend in Turkish
lira loans that became discernible in the last
quarter of 2009, the domestic currency reserve
requirement ratio was cut from 6% to 5%.
With this reduction, an amount of liquidity
equivalent to approximately TRY 3.3 billion
was pumped into the Turkish banking system.
Exchange rate stabilisation measures
In all three candidate countries, some measures
were taken to support the exchange rates at
the height of the fi nancial crisis in late 2008
and early 2009. The precise design and extent
of the measures differed, however, in view
of differences in prevailing exchange rate
regimes, the degree of foreign exchange market
pressures and the operational framework of
central banks.
In Croatia, the CNB intervened directly on the
foreign exchange market by selling €271 million
in October 2008, €328 million in January 2009
and €185 million in February 2009. Foreign
currency swap contracts with the banks were
introduced in January 2009 in order to support
government borrowing from the banking
sector: in exchange for €261 million of foreign
currency pledged as collateral, banks obtained
HRK 1.9 billion to lend to the central government.
Subsequently, the amount of the swap contract
was increased to €288 million and extended
until June. In parallel, the ratio of minimum
required liquid foreign currency claims
over total foreign liabilities was reduced
twice in February 2009 from 28.5%
to 25.0%, and additionally to 20.0%
(this followed a previous reduction in this
ratio from 32.0% to 28.5% in May 2008). This
measure resulted in freeing €2.1 billion in foreign
exchange liquidity for the banks and provided
them with the funds required for fi nancing the
central government, thus minimising the risk of
crowding out the private sector.
In the former Yugoslav Republic of Macedonia,
the NBRM adopted a decision on foreign
exchange deposits at the end of 2008, which
introduced the possibility for domestic banks to
hold foreign exchange deposits with the NBRM.
The objective was to retain foreign exchange
liquidity at home instead of banks placing their
foreign exchange liquidity with foreign banks
abroad. This measure also helped to limit the
exposure of banks to credit risk when placing
assets abroad in the context of the volatile global
fi nancial environment. During the fi rst half
of 2009, shortages of external fi nancing resulted
in a loss of foreign reserves for the NBRM
related to interventions on the foreign exchange
market worth a net sell of €230 million. During
the second half of 2009, however, exchange rate
pressures abated owing to a correction of external
imbalances and the NBRM intervened by making
net purchases of foreign currency. The NBRM’s
action helped rebuild foreign reserves, which
by the end of 2009 had risen by €102.6 million
compared with levels at the end of 2008.
In Turkey, the intermediation window for
foreign exchange deposits – a facility where
the CBRT plays the role of intermediary in
the interbank market – was reactivated during
October 2008. The objective was to prevent
a liquidity squeeze in the foreign exchange
interbank market resulting from the confi dence
shock that hit the world banking industry after
the fall of Lehman Brothers. This facility was a
last resort facility and was intended to cease once
uncertainties arising from the global fi nancial
crisis had disappeared. By 24 October 2008 the
transaction limit for banks under this facility

77ECB
Occasional Paper No 115
July 2010
4 SPEC IAL
FEATUREShad been doubled, reaching USD 10.8 billion
in total. However, as Turkish banks did not
encounter major foreign exchange liquidity
problems, they had used only 4% of this limit
by the end of October 2008. In addition, foreign
exchange buying auctions were suspended and
foreign exchange selling auctions initiated in
mid-October 2008. The objective was to
strengthen the foreign exchange liquidity
position of the Turkish banking sector and
to prevent negative pressures on the Turkish
lira. The daily amount for foreign exchange
selling auctions was set at USD 50 million.
Two auctions were held and an amount of
USD 100 million was sold in total. However,
owing to positive developments in the global
fi nancial markets, foreign exchange selling
auctions were terminated at the end of
October 2008. In November 2008, another direct
measure to strengthen the foreign exchange
liquidity position of the Turkish banking sector
was introduced by increasing the maturity
of foreign exchange loans extended to banks
by the CBRT from one week to one month.
The lending rate on these loans, denominated in
euro and US dollars, was reduced from an initial
level of 10% for both currencies to 9% for the
euro and 7% for the US currency. However,
none of the Turkish banks made use of this
facility. More recently, in August 2009 foreign
exchange buying auctions were initiated once
more to absorb foreign exchange liquidity on
account of the increasing capital infl ows related
to improved market sentiment vis-à-vis the
Turkish economy.
Eligible collateral
Amendments to the central bank’s collateral
policy were made only in Croatia, where the
CNB broadened the set of eligible collateral
in March 2009. As collateral for the central
bank’s short-term liquidity operations, banks
have been allowed to use Ministry of Finance
treasury bills denominated in euro with an
original maturity of up to one year (initially only
treasury bills in kuna were eligible). In addition,
the CNB extended the set of eligible collateral
further to other instruments in December 2009.
Up to March 2010, however, banks had not
shown any reliance on the new set of collateral
instruments.
REGULATORY MEASURES
Contrary to many EU countries, neither
recapitalisation schemes for banks nor state
guarantees for bank liabilities were introduced
in the countries under review.
Removing quantitative limits on lending
In Croatia, the CNB removed the quantitative
restrictions on lending introduced in
January 2007 (i.e. the obligation for banks to
subscribe CNB bills in cases where annual
growth in their credit portfolio exceeded 12%).
Based on available indicators pointing to a
considerable slowdown of bank lending and the
fact that banks started to exercise greater caution
regarding credit and associated risks, restrictions
on credit growth were deemed to be no longer
necessary as the CNB initiated measures to spur
bank lending.
In the former Yugoslav Republic of Macedonia,
the measures implemented during 2008 to limit
household lending were abandoned in 2010.
At the end of 2009, the annual growth rate of
household credits stood at 2.6%, signifi cantly
lower than the 11.3% limit determined by the
regulation (as in Croatia’s case, banks were
obliged to subscribe to a compulsory deposit
with the NBRM if the growth rate of household
credits exceeded the limit set by the NBRM).
Open foreign currency position
In Croatia, the maximum permitted open foreign
exchange position for banks was increased from
20% to 30% in February 2009. This move was
made in order to ensure consistency with the
reduction in the minimum required foreign
currency claims ratio (see above). These
measures helped to maintain the stability of the
kuna by allowing banks to substitute foreign
exchange-denominated assets with domestic
currency-denominated assets.
Change in the deposit insurance framework
In Croatia, the deposit insurance framework
was strengthened in October 2008 by increasing

78ECB
Occasional Paper No 115
July 2010
the limit for the deposit guarantee on individual
accounts from HRK 100,000 to HRK 400,000.
This move came in an environment of negative
perceptions among depositors concerning
subsidiary banks, related to fears about the
parent banks’ losses resulting from the failure
of Lehman Brothers. This triggered an outfl ow
of deposits from the Croatian subsidiaries
during October 2008, but the quick response
of monetary and fi scal authorities proved to be
effective as the outfl ow of household deposits
was halted.
In Turkey, the Council of Ministers was
authorised to raise the amount of deposit
insurance in November 2008. However, there
appeared to be no need to change the amount of
deposit insurance as banks were not subject to any
deposit outfl ows (the amount of deposit insurance
has stood at TRY 50,000 since July 2004).
Limits on profit distribution
In Turkey, in order to strengthen banks’ own
funds, the Banking Regulation and Supervision
Agency required banks to obtain permission
for the distribution of profi ts from the years
2008 and 2009. As a result of this measure, the
dividend payout ratio of deposit banks declined
from 34.6% at the end of 2007 to 16.6% at the
end of 2008.
Loan restructuring measures
In Turkey, an amendment to the Regulation on
loans qualifi cation and provisioning introduced
new facilities allowing the banks to classify their
loans within a group level that would be more
advantageous for them in terms of provisioning.
Additionally, in order to restructure credit
card receivables, a provisional clause was
added to the “Law on Bank Cards and Credit
Cards”, allowing customers whose credit card
receivables are classifi ed as non-performing
to apply within 60 days for a restructuring of
their debt under certain conditions. Some banks
voluntarily extended the application period of
this clause, due to end on 4 September 2009,
until the end of the year. The total amount of
restructured credit card receivables as a result
of this measure was TRY 1.3 billion, which
represents 36.5% of total non-performing credit
card loans as of May 2009.
Other measures
At the end of 2008 the NBRM adopted a
Decision on the management of liquidity risk by
banks. This imposed the requirement for banks
to maintain a minimum level of liquidity equal
to 1, defi ned as a ratio between the assets and
liabilities with maturity up to 30 and 180 days
for both domestic and foreign currencies.
The implementation of this decision started in
February 2009, when the banks were required
to submit a fi rst report on initial liquidity ratios
as of 28 February 2009 to the NBRM. From
the end of March, a requirement for increasing
the liquidity ratios on a monthly basis was
introduced, with a monthly increment of 1/24
of the gap between the minimum level and the
initial level of the liquidity ratio for maturities
up to 30 days, and 1/60 of the gap between
the minimum level and the initial level of the
liquidity ratio for maturities up to 180 days.
The decision was amended in May 2009,
allowing for the possibility of using NBRM
instruments in fulfi lling the liquidity ratios, either
in domestic or in foreign currency. The effect of
these measures became apparent as the liquidity
of the banking system improved signifi cantly in
the third quarter of 2009. The improvement was
driven by the obligation for banks to comply
with the above-mentioned requirement, but it
was also a prudent response by the banking
system to the enhanced liquidity risk associated
with the global fi nancial crisis.
ADMINISTRATIVE MEASURES
In Turkey, at the end of 2008 the limit for export
rediscount credits was raised from
USD 500 million to USD 1 billion and the
utilisation of these credits facilitated with an
amendment to the application guidelines and
conditions for export rediscount credits.
Moreover, the credit limit for individual
companies was extended from USD 10 million
to USD 20 million.82 These arrangements led to
The limit was raised to USD 40 million for so-called “foreign 82
trade capital companies”.

79ECB
Occasional Paper No 115
July 2010
4 SPEC IAL
FEATURESa sharp increase in the volume of export
rediscount credits extended via Turkey’s
Eximbank: total export rediscount credit
utilisation was USD 1.7 million for 2008,
reaching USD 502.5 million in the period
between 1 January and 16 April 2009. Having
taken this development into account, in order to
make the fullest possible contribution to meeting
the fi nancing needs of export companies, the
export rediscount credit limit was raised further
by USD 1.5 billion to USD 2.5 billion in
April 2009.
In addition, a guarantee scheme in Turkey aimed
at sustaining lending to SMEs was implemented.
The Turkish government (Undersecretariat of
Treasury) implicitly introduced guarantees on
cash loans extended to SMEs by signing an
agreement with the Credit Guarantee Fund in
October 2009. The Credit Guarantee Fund was
mandated to guarantee SME loans up to a total
amount of TRY 10 billion (this amount is equal
to almost one-eighth of cash loans extended
to SMEs). The protocol between the Credit
Guarantee Fund and the banks that provide loans
was signed at the end of 2009 and fi rms started
to apply for guarantees in January 2010.
FURTHER CHALLENGES
Although most of the measures listed above have
proved to be effective in avoiding a liquidity
squeeze in the banking sector and averting
disruption in the exchange rate market, lending
to the private sector remains at historically
low levels. Therefore, the main challenge in
the countries under review is to restart lending
and avoid a prolonged period of credit crunch.
The above review suggests that the bulk of
measures implemented in Turkey to support
lending to SMEs and export companies
proved to be fairly effective as regards recent
macroeconomic developments. No similar
measures were implemented in the two
other candidate countries and the Turkish
example could provide a useful benchmark.
Furthermore, fi nancial stability could be
strengthened via the pursuit of sound and
stability-oriented macroeconomic policies and
by creating robust domestic funding markets
to encourage lending in domestic currency,
although it should be noted that this might
prove challenging for small countries in which
foreign-owned banks represent a large share of
the banking sector. Given the potential fi nancial
stability risks associated with the very high
shares of foreign currency-denominated loans
in Croatia and the former Yugoslav Republic
of Macedonia, macro-prudential measures to
reduce the underlying vulnerabilities related to
foreign currency lending are essential.

80ECB
Occasional Paper No 115
July 2010
5 CONCLUSIONS
This paper has reviewed fi nancial stability
developments in the EU candidate countries.
On the basis of the analysis, three main
conclusions and recommendations emerge:
First, as of early 2010, the key challenge for
the fi nancial systems in the three candidate
countries relates to the deterioration in credit
quality. Given the lag in the transmission of the
economic cycle to asset quality, and especially
in the event of a renewed deterioration in
economic conditions, a further deterioration in
asset quality may occur, calling for continued
close monitoring by the supervisory authorities
of candidate countries. However, although
uncertainties remain regarding credit quality,
the shock-absorbing capacities of the banking
systems are fairly high, as also evidenced by
their relative resilience to date.
Second, as the economic recovery sets in, central
banks should resume and possibly step up
the implementation of measures to avoid a
pro-cyclical build-up of credit (asset) boom-bust
cycles. While at the moment the immediate
challenge is more one of restarting credit growth,
lending growth may resume strongly as the
recovery gains ground, given the potential for
further convergence in the economies of the
EU candidate countries. Therefore, monetary
authorities should design and communicate
clearly their exit strategies from the loose
monetary policy conditions applied via various
channels at the present juncture.83
Third, given the relevance of foreign-owned
banks in most of the countries, a continued
strengthening of home-host cooperation in the
supervisory area will be crucial to avoid any kind
of regulatory arbitrage, to enhance the effi ciency
of macro-prudential measures and to provide
authorities with comprehensive information for
planning their actions. Improving home-host
cooperation is one of the key objectives of
the Eurosystem’s crisis response package in
EU candidates and potential candidates, which
is aimed at promoting supervisory standards
in the target countries through the transfer of
expertise and know-how.
The Central Bank of the Republic of Turkey had already made 83
an announcement on 14 April 2010, stating that it would “gradually
remove the liquidity measures implemented during the crisis”.

81ECB
Occasional Paper No 115
July 2010
REFERENCES
REFERENCES
Baliño, T.J.T., A. Bennett and E. Borensztein (1999), “Monetary policy in Dollarized Economies”,
IMF Occasional Paper No. 171
Bokan N., L. Grgurić, I. Krznar and M. Lang (2009), “The Impact of the Financial Crisis and Policy
Responses in Croatia”, Croatian National Bank, Working Paper No. 22, Zagreb, December 2009
Brown, M., S.R.G. Ongena, and P.A. Yesin (2009), “Foreign Currency Borrowing by Small Firms”,
Swiss National Bank Working Papers 2009-2
Cerovac S. and L. Ivičic (2009), “Credit Risk Assessment of Corporate Sector in Croatia”, Financial
Theory and Practice, 33 (4), 373-399
Čihák, M. (2007), “Introduction to Applied Stress Testing”, IMF Working Paper No. 59
CBRT (2009), “Financial Stability Report”, Vol. 9, November 2009
CNB (2009a), “Bank Bulletins”, Zagreb
CNB (2009b), “Financial Stability Reports”, Zagreb
CNB (2009c), “Semi-Annual Reports”, Zagreb
CNB (2009d), “Annual Reports”, Zagreb
CNB (2009e), “Monthly Bulletins”, Zagreb
De Haas, R. and I. van Lelyveld (2006), “Foreign Banks and Credit Stability in Central and Eastern
Europe: A Panel Data Analysis”, Journal of Banking and Finance, 30, 1927-1952
De Haas, R. and I. van Lelyveld (2010), “Internal Capital Markets and Lending by Multinational
Bank Subsidiaries”, Journal of Financial Intermediation, 19, 1-25
Dvorsky, S., T. Scheiber and H. Stix (2009), “CESEE Households amid the Financial Crisis:
Euro Survey Shows Darkened Economic Sentiment and Changes in Savings Behavior”,
Oesterreichische Nationalbank, Focus on European Economic Integration, Q4 2009, 71-83
EBRD (2008), “Transition Report 2008: Growth in Transition”, London, November 2008
EBRD (2009), “Transition Report 2009: Transition in Crisis?”, London, November 2009
ECB (2006), “Macroeconomic and Financial Stability Challenges in Acceding and Candidate
Countries”, ECB Occasional Paper Series No. 48, Frankfurt, July 2006
ECB (2008), “Financial Stability Challenges in Candidate Countries: Managing the Transition to
Deeper and More Market-Oriented Financial Systems”, ECB Occasional Paper Series No. 95,
Frankfurt, September 2008

82ECB
Occasional Paper No 115
July 2010
ECB
Occasional Paper No 115
July 2010
European Central Bank (2009), “EU Banks’ Funding Structures and Policies”
European Commission (2009), “EU Candidate and Pre-Accession Countries Economic Quarterly”,
Brussels, October 2009
European Commission (2010), “EU Candidate and Pre-Accession Countries Economic Quarterly”,
Brussels, January 2010
Fitch (2009), “Turkey”, Credit analysis, 3 December
Gardó, S. (2008), “Croatia: Coping with Rapid Financial Deepening”, Oesterreichische Nationalbank,
Focus on European Economic Integration 1/2008, 61-81
Goldberg, L. S. (2009), “Understanding Banking Sector Globalization”, IMF Staff Papers, Vol. 56 (1)
Hasselmann, R. (2006), “Strategies of Foreign Banks in Transition Economies”, Emerging Market
Review, 7, 283-299
Herrmann, S. and D. Mihaljek (2010), “The Determinants of Cross-Border Bank Flows to Emerging
Markets – New Empirical Evidence on the Spread of the Financial Crises”, mimeo
IMF (2008), “Republic of Croatia: Financial System Stability Assessment – Update”, IMF Country
Report 08/160, Washington, May 2008
IMF (2009), “Republic of Croatia: 2009 Article IV Consultation – Staff Report”, Country Report
09/185, Washington, June 2009
IMF (2010), “Global Financial Stability Review”, Washington, April 2010
Krznar, M. (2009), “Contagion Risk in the Croatian Banking System”, Croatian National Bank,
Working Paper No. 20, Zagreb, May 2009
Kubo, K. (2008), “Do Foreign Currency Deposits Promote or Deter Financial Intermediary
Development in Low-Income Countries? An Empirical Analysis of Cross-Country Data”,
The Developing Economies Vol. 46 (3), 264-289
McGuire, P. and N. Tarashev (2008), “Bank Health and Lending to Emerging Markets”,
BIS Quarterly Review, December 2008, 67-80
Moody’s (2010), “Moody’s upgrades Turkey’s government ratings to Ba2/stable”, 8 January
NBRM (2009), “Financial Stability Report 2008”, Skopje, July 2009
Peek, J., and E.S. Rosengren (1997), “The International Transmission of Financial Shocks:
The Case of Japan”, American Economic Review, Vol. 87 (4)
Popov, A. and E.F. Udell (2010), “Cross-Border Lending and the Transmission of Financial Distress
during the Crisis of 2007-2008”, mimeo
83ECB
Occasional Paper No 115
July 2010
ECB
Occasional Paper No 115
July 2010
REFERENCES
Rosenberg, C.B. and M. Tirpák (2008), “Determinants of Foreign Currency Borrowing in the New
Member States of the EU”, IMF Working Paper WP/08/173
Scheiber T. and H. Stix (2009), “Euroization in Central, Eastern and Southeastern Europe –
New Evidence on its Extent and Some Evidence on its Causes”, Oesterreichische Nationalbank,
Working Paper No. 159
Standard & Poor’s (2010), “Republic of Turkey long-term foreign currency rating raised to ‘BB’
on improving economic fl exibility; outlook positive”, 19 February
Upper, C. and A. Worms (2002): “Estimating Bilateral Exposures in the German Interbank Market:
Is There a Danger of Contagion?”, Bundesbank Discussion Paper 09/02, February 2002
Walko Z. (2008), “The Refi nancing Structure of Banks in Selected CESEE Countries”,
Oesterreichische Nationalbank, Financial Stability Report 16, December 2008, 76-95
Winkler A. (2009), “Southeastern Europe: Financial Deepening, Foreign Banks and Sudden Stops in
Capital Flows, Oesterreichische Nationalbank, Focus on European Economic Integration Q1 2009
World Bank (2009a), “EU10 Regular Economic Report – Croatia Supplement”, May 2009
World Bank (2009b), “EU10 Regular Economic Report – Croatia Supplement”, October 2009
Zumer T., B. Égert and P. Backé (2009), “Credit Developments in CEE: From Boom to Bust or
Back to Balance?”, Slovenian Journal for Money and Banking, Vol. 58 (11), November 2009,
94-101

84ECB
Occasional Paper No 115
July 2010
ECB
Occasional Paper No 115
July 2010
EUROPEAN CENTRAL BANK
OCCASIONAL PAPER SERIES SINCE 2009
100 “Survey data on household fi nance and consumption: research summary and policy use” by the
Eurosystem Household Finance and Consumption Network, January 2009.
101 “Housing fi nance in the euro area” by a Task Force of the Monetary Policy Committee of the
European System of Central Banks, March 2009.
102 “Domestic fi nancial development in emerging economies: evidence and implications”
by E. Dorrucci, A. Meyer-Cirkel and D. Santabárbara, April 2009.
103 “Transnational governance in global fi nance: the principles for stable capital fl ows and fair debt
restructuring in emerging markets” by R. Ritter, April 2009.
104 “Fiscal policy challenges in oil-exporting countries – a review of key issues” by M. Sturm,
F. Gurtner and J. Gonzalez Alegre, June 2009.
105 “Flow-of-funds analysis at the ECB – framework and applications” by L. Bê Duc and
G. Le Breton, August 2009.
106 “Monetary policy strategy in a global environment” by P. Moutot and G. Vitale, August 2009.
107 “The collateral frameworks of the Eurosystem, the Federal Reserve System and the Bank of
England and the fi nancial market turmoil” by S. Cheun, I. von Köppen-Mertes and B.Weller,
December 2009.
108 “Trade consistency in the context of the Eurosystem projection exercises – an overview”
by K. Hubrich and T. Karlsson, March 2010.
109 “Euro area fi scal policies and the crisis” by editor Ad van Riet, April 2010.
110 “Protectionist responses to the crisis: global trends and implications” by M. Bussière,
E. Pérez-Barreiro, R. Straub and D. Taglioni, April 2010.
111 “Main drivers of the ECB fi nancial accounts and ECB fi nancial strength over the fi rst 11 years”
by O. Vergote, W. Studener, I. Efthymiadis and N. Merriman, May 2010.
112 “Public wages in the euro area towards securing stability and competitiveness” by F. Holm-Hadulla,
K. Kamath, A. Lamo, J. J. Pérez and L. Schuknecht, June 2010.
113 “Energy markets and the euro area macroeconomy” by a Task Force of the Monetary Policy
Committee of the European System of Central Banks, June 2010.
114 “The impact of the global economic and fi nancial crisis on central, eastern and south-eastern
Europe: A stock-taking exercise” by Sándor Gardó and Reiner Martin, June 2010.
115 “Financial stability challenges in EU candidate countries. Financial systems in the aftermath of
the global crisis” by an IRC expert group of the ESCB, July 2010.

Occas iOnal PaPer ser i e snO 112 / j une 2010
PuBlic WaGes in
THe eurO area
TOWarDs securinG
sTaBiliTY anD
cOMPeTiTiVeness
by Fédéric Holm-Hadulla, Kishore Kamath, Ana Lamo, Javier J. Pérez and Ludger Schuknecht