Oc housing news
58
OC Housing News [email protected] 1 of 58 January 2016 Shevy Akason 877-409-8515 2 ..… Meet the Everyday Luxury Real Estate Group at Evergreen Realty 3 ..… Los Angeles County Housing Market Overview 4 ..… Los Angeles County Median Home Price and Rents 5 ..… Los Angeles County Resale and rental $/SF Year-over-Year Percentage Change 6 ..… Los Angeles County Historic Valuation and Market Timing Rating 7 ..… Los Angeles County Investor Returns 8 ..… East Los Angeles Market Performance and Trends: Ventura County, Major Cities, and Zips 11 ..… East Los Angeles Market Timing Rating and Valuations: Ventura County, Major Cities, and Zips 14 ..… West Los Angeles Market Performance and Trends: Ventura County, Major Cities, and Zips 18 ..… West Los Angeles Market Timing Rating and Valuations: Ventura County, Major Cities, and Zips 22 ..… Orange County Housing Market Overview 23 ..… Orange County Median Home Price and Rents 24 ..… Orange County Resale and rental $/SF Year-over-Year Percentage Change 25 ..… Orange County Historic Valuation and Market Timing Rating 26 ..… Orange County Investor Returns 27 ..… Orange County Market Performance and Trends: Ventura County, Major Cities, and Zips 29 ..… Orange County Market Timing Rating and Valuations: Ventura County, Major Cities, and Zips 31 ..… Riverside County Housing Market Overview 32 ..… Riverside County Median Home Price and Rents 33 ..… Riverside County Resale and rental $/SF Year-over-Year Percentage Change 34 ..… Riverside County Historic Valuation and Market Timing Rating 35 ..… Riverside County Investor Returns 36 ..… Riverside County Market Performance and Trends: Ventura County, Major Cities, and Zips 38 ..… Riverside County Market Timing Rating and Valuations: Ventura County, Major Cities, and Zips 40 ..… San Bernardino County Housing Market Overview 41 ..… San Bernardino County Median Home Price and Rents 42 ..… San Bernardino County Resale and rental $/SF Year-over-Year Percentage Change 43 ..… San Bernardino County Historic Valuation and Market Timing Rating 44 ..… San Bernardino County Investor Returns 45 ..… San Bernardino County Market Performance and Trends: Ventura County, Major Cities, and Zips 47 ..… San Bernardino County Market Timing Rating and Values: Ventura County, Major Cities, and Zips 49 ..… Ventura County Housing Market Overview 50 ..… Ventura County Median Home Price and Rents 51 ..… Ventura County Resale and rental $/SF Year-over-Year Percentage Change 52 ..… Ventura County Historic Valuation and Market Timing Rating 53 ..… Ventura County Investor Returns 54 ..… Ventura County Market Performance and Trends: Ventura County, Major Cities, and Zips 55 ..… Ventura County Market Timing Rating and Valuations: Ventura County, Major Cities, and Zips Southern California Housing Report Table of Contents
-
Upload
fiverrclient -
Category
Real Estate
-
view
91 -
download
0
Transcript of Oc housing news

1of58
January2016ShevyAkason877-409-8515
2..…MeettheEverydayLuxuryRealEstateGroupatEvergreenRealty3..…LosAngelesCountyHousingMarketOverview4..…LosAngelesCountyMedianHomePriceandRents5..…LosAngelesCountyResaleandrental$/SFYear-over-YearPercentageChange6..…LosAngelesCountyHistoricValuationandMarketTimingRating7..…LosAngelesCountyInvestorReturns8..…EastLosAngelesMarketPerformanceandTrends:VenturaCounty,MajorCities,andZips11..…EastLosAngelesMarketTimingRatingandValuations:VenturaCounty,MajorCities,andZips14..…WestLosAngelesMarketPerformanceandTrends:VenturaCounty,MajorCities,andZips18..…WestLosAngelesMarketTimingRatingandValuations:VenturaCounty,MajorCities,andZips
22..…OrangeCountyHousingMarketOverview23..…OrangeCountyMedianHomePriceandRents24..…OrangeCountyResaleandrental$/SFYear-over-YearPercentageChange25..…OrangeCountyHistoricValuationandMarketTimingRating26..…OrangeCountyInvestorReturns27..…OrangeCountyMarketPerformanceandTrends:VenturaCounty,MajorCities,andZips29..…OrangeCountyMarketTimingRatingandValuations:VenturaCounty,MajorCities,andZips
31..…RiversideCountyHousingMarketOverview32..…RiversideCountyMedianHomePriceandRents33..…RiversideCountyResaleandrental$/SFYear-over-YearPercentageChange34..…RiversideCountyHistoricValuationandMarketTimingRating35..…RiversideCountyInvestorReturns36..…RiversideCountyMarketPerformanceandTrends:VenturaCounty,MajorCities,andZips38..…RiversideCountyMarketTimingRatingandValuations:VenturaCounty,MajorCities,andZips
40..…SanBernardinoCountyHousingMarketOverview 41..…SanBernardinoCountyMedianHomePriceandRents42..…SanBernardinoCountyResaleandrental$/SFYear-over-YearPercentageChange43..…SanBernardinoCountyHistoricValuationandMarketTimingRating44..…SanBernardinoCountyInvestorReturns45..…SanBernardinoCountyMarketPerformanceandTrends:VenturaCounty,MajorCities,andZips47..…SanBernardinoCountyMarketTimingRatingandValues:VenturaCounty,MajorCities,andZips
49..…VenturaCountyHousingMarketOverview50..…VenturaCountyMedianHomePriceandRents51..…VenturaCountyResaleandrental$/SFYear-over-YearPercentageChange52..…VenturaCountyHistoricValuationandMarketTimingRating53..…VenturaCountyInvestorReturns54..…VenturaCountyMarketPerformanceandTrends:VenturaCounty,MajorCities,andZips55..…VenturaCountyMarketTimingRatingandValuations:VenturaCounty,MajorCities,andZips
SouthernCaliforniaHousingReport
TableofContents

3of58
January2016ShevyAkason877-409-8515
Historically,propertiesinthismarketsellata9.5%discount.Today'sdiscountis14.2%.Thismarketis4.7%undervalued.Medianhomepriceis$507,300witharentalparityvalueof$589,300.Thismarket'sdiscountis$82,000.Monthlypaymentaffordabilityhasbeenimprovingoverthelast3month(s).Momentumsuggestsimprovingaffordability.Resalepricesona$/SFbasisincreasedfrom$407/SFto$409/SF.Resalepriceshavebeenrisingfor10month(s).Overthelast12months,resalepricesrose5.4%indicatingalongertermupwardpricetrend.Medianrentalratesincreased$8lastmonthfrom$2,633to$2,641.Thecurrentcapitalizationrate(rent/price)is5.0%.Rentshavebeenrisingfor12month(s).Pricemomentumsignalsrisingrentsoverthenextthreemonths.Marketrating=7
MedianHomePriceandRentalParitytrailingtwelvemonthsDate Rating Median RentalParity HistoricValue1/2015 7 469,300$ 569,000$ 514,855$2/2015 7 467,600$ 570,000$ 515,759$3/2015 8 470,100$ 567,700$ 513,678$4/2015 8 475,100$ 578,200$ 523,179$5/2015 7 484,300$ 571,900$ 517,479$6/2015 7 492,600$ 566,200$ 512,321$7/2015 8 501,000$ 567,000$ 513,045$8/2015 8 505,100$ 581,300$ 525,984$9/2015 8 508,100$ 588,300$ 532,318$10/2015 7 508,000$ 599,000$ 542,000$11/2015 7 508,800$ 588,900$ 532,861$12/2015 7 507,300$ 589,300$ 533,223$
Resale$/SFandyear-over-yearpercentagechangetrailingtwelvemonthsDate ±Typ.Value $/SF %Change1/2015 -6.2% 388$ 8.7%2/2015 -7.5% 382$ 7.1%3/2015 -8.0% 383$ 7.1%4/2015 -8.1% 387$ 7.6%5/2015 -7.3% 391$ 7.6%6/2015 -5.9% 395$ 7.6%7/2015 -3.8% 398$ 6.6%8/2015 -3.1% 400$ 4.8%9/2015 -3.3% 403$ 4.4%10/2015 -4.5% 406$ 4.8%11/2015 -4.6% 407$ 4.9%12/2015 -4.7% 409$ 5.4% -0.0951588
Rentalrateandyear-over-yearpercentagechangetrailingtwelvemonthsDate %Change Rent Own HistoricCosttoOwnRelativetoRent1/2015 5.3% 2,474$ 2,087$ 2,239$2/2015 5.5% 2,478$ 2,054$ 2,242$3/2015 6.0% 2,487$ 2,044$ 2,250$4/2015 6.2% 2,502$ 2,049$ 2,264$5/2015 6.7% 2,527$ 2,085$ 2,286$6/2015 6.8% 2,544$ 2,136$ 2,302$7/2015 6.9% 2,569$ 2,208$ 2,325$8/2015 6.9% 2,590$ 2,245$ 2,344$9/2015 6.9% 2,615$ 2,260$ 2,366$10/2015 7.0% 2,633$ 2,247$ 2,383$11/2015 7.2% 2,633$ 2,255$ 2,383$12/2015 7.4% 2,642$ 2,261$ 2,390$
LosAngelesCountyHousingMarketNews
$-
$200,000
$400,000
$600,000
$800,000
1/2015
2/2015
3/2015
4/2015
5/2015
6/2015
7/2015
8/2015
9/2015
10/2015
11/2015
12/2015
Median RentalParity HistoricValue
$388$382$383
$387$391
$395$398
$400$403$406$407
$409
$370$375$380$385$390$395$400$405$410$415
1/2015
2/2015
3/2015
4/2015
5/2015
6/2015
7/2015
8/2015
9/2015
10/2015
11/2015
12/2015
$2,474
$2,478
$2,487
$2,502
$2,527
$2,544
$2,569
$2,590
$2,615
$2,633
$2,633
$2,642
$1,800
$2,000
$2,200
$2,400
$2,600
$2,800
1/2015
2/2015
3/2015
4/2015
5/2015
6/2015
7/2015
8/2015
9/2015
10/2015
11/2015
12/2015
Rent Own HistoricCosttoOwnRelagvetoRent

4of58
January2016ShevyAkason877-409-8515
LosAngelesCountymedianhomepricesinceJanuary1988
LosAngelesCountymedianrentandmonthlycostofownershipsinceJanuary1988
$0
$100,000
$200,000
$300,000
$400,000
$500,000
$600,000
$700,000
1/1988
1/1989
1/1990
1/1991
1/1992
1/1993
1/1994
1/1995
1/1996
1/1997
1/1998
1/1999
1/2000
1/2001
1/2002
1/2003
1/2004
1/2005
1/2006
1/2007
1/2008
1/2009
1/2010
1/2011
1/2012
1/2013
1/2014
1/2015
1/2016
1/2017
MedianResale RentalParity HistoricValue Projecgon
$0
$500
$1,000
$1,500
$2,000
$2,500
$3,000
$3,500
1/1988
1/1989
1/1990
1/1991
1/1992
1/1993
1/1994
1/1995
1/1996
1/1997
1/1998
1/1999
1/2000
1/2001
1/2002
1/2003
1/2004
1/2005
1/2006
1/2007
1/2008
1/2009
1/2010
1/2011
1/2012
1/2013
1/2014
1/2015
1/2016
1/2017
MedianRent CosttoOwn HistoricCosttoOwnRelagvetoRent

5of58
January2016ShevyAkason877-409-8515
Resale$/SFYear-over-YearPercentageChange:LosAngelesCountysinceJanuary1989
Rental$/SFYear-over-YearPercentageChange:LosAngelesCountysinceJanuary1989
-8%
-6%
-4%
-2%
0%
2%
4%
6%
8%
10%
12%
14%
16%
18%
1/1989
1/1990
1/1991
1/1992
1/1993
1/1994
1/1995
1/1996
1/1997
1/1998
1/1999
1/2000
1/2001
1/2002
1/2003
1/2004
1/2005
1/2006
1/2007
1/2008
1/2009
1/2010
1/2011
1/2012
1/2013
1/2014
1/2015
1/2016
1/2017
Normalandsustainable
Rentalratesinexcessof7%arenotsustainable.Longperiodsofexcessiveappreciagonleadtoacrash.
Falling/Correcgng
Weak
-50%-45%-40%-35%-30%-25%-20%-15%-10%-5%0%5%
10%15%20%25%30%35%40%45%50%
1/1989
1/1990
1/1991
1/1992
1/1993
1/1994
1/1995
1/1996
1/1997
1/1998
1/1999
1/2000
1/2001
1/2002
1/2003
1/2004
1/2005
1/2006
1/2007
1/2008
1/2009
1/2010
1/2011
1/2012
1/2013
1/2014
1/2015
1/2016
1/2017
Normalandsustainable
Appreciagonratesinexcessof7%arenotsustainable.Longperiodsofexcessiveappreciagonleadtoacrash.
Falling/Correcgng

6of58
January2016ShevyAkason877-409-8515
HistoricMedianHomePriceRelativetoRentalParity:LosAngelesCountysinceJanuary1988
OCHNMarketTimingSystemRating:LosAngelesCountysinceJanuary1988
-49.0%-42.0%-35.0%-28.0%-21.0%-14.0%-7.0%0.0%7.0%14.0%21.0%28.0%35.0%42.0%49.0%56.0%63.0%70.0%77.0%84.0%91.0%
1/1988
1/1989
1/1990
1/1991
1/1992
1/1993
1/1994
1/1995
1/1996
1/1997
1/1998
1/1999
1/2000
1/2001
1/2002
1/2003
1/2004
1/2005
1/2006
1/2007
1/2008
1/2009
1/2010
1/2011
1/2012
1/2013
1/2014
1/2015
1/2016
1/2017
Discou
ntorP
remium
ValueRelagvetoRentalParity HistoricNorm
Stableperiodbetweenhousingbubblesfrom1993-1999establisheshistoricnorm.
0
1
2
3
4
5
6
7
8
9
10
1/1988
1/1989
1/1990
1/1991
1/1992
1/1993
1/1994
1/1995
1/1996
1/1997
1/1998
1/1999
1/2000
1/2001
1/2002
1/2003
1/2004
1/2005
1/2006
1/2007
1/2008
1/2009
1/2010
1/2011
1/2012
1/2013
1/2014
1/2015
1/2016
1/2017
Values7-10:UndervaluedMarket:StrongBuyRecommendagon
Values4-6:NeutralMarket,WeakBuyRecommendagon
Values1-3:InflatedorWeakMarket:ConsiderSelling.DonotBuy.

7of58
January2016ShevyAkason877-409-8515
CashInvestorCapitalizationRate:LosAngelesCountysinceJanuary1988
FinancedInvestorCash-on-CashReturn:LosAngelesCountysinceJanuary1988
0.0%
2.0%
4.0%
6.0%
8.0%
10.0%
12.0%
1/1988
1/1989
1/1990
1/1991
1/1992
1/1993
1/1994
1/1995
1/1996
1/1997
1/1998
1/1999
1/2000
1/2001
1/2002
1/2003
1/2004
1/2005
1/2006
1/2007
1/2008
1/2009
1/2010
1/2011
1/2012
1/2013
1/2014
1/2015
1/2016
1/2017
CapitalizagonRate MortgageInterestRate
-30.0%
-25.0%
-20.0%
-15.0%
-10.0%
-5.0%
0.0%
5.0%
10.0%
15.0%
20.0%
25.0%
1/1988
1/1989
1/1990
1/1991
1/1992
1/1993
1/1994
1/1995
1/1996
1/1997
1/1998
1/1999
1/2000
1/2001
1/2002
1/2003
1/2004
1/2005
1/2006
1/2007
1/2008
1/2009
1/2010
1/2011
1/2012
1/2013
1/2014
1/2015
1/2016
1/2017

8of58
January2016ShevyAkason877-409-8515
Median Resale% Rent% Median Costof Ownership
City Resale$ ChangeYoY Resale$/SF ChangeYoY Rent$ Ownership Prem./Disc. CapRate
Alhambra 533,600$ 3.7% 392$ 10.8% 2,098$ 2,372$ 274$ 3.8%
Arcadia 941,700$ -14.5% 507$ 4.3% 2,803$ 4,204$ 1,401$ 2.9%
Artesia 392,400$ 15.3% 377$ 0.6% 1,717$ 1,757$ 40$ 4.2%
Azusa 372,700$ 1.7% 286$ 3.0% 1,887$ 1,644$ (243)$ 4.9%
BaldwinPark 347,500$ 8.5% 300$ 10.3% 1,746$ 1,553$ (193)$ 4.8%
Bellflower 420,500$ 14.5% 326$ 3.9% 1,925$ 1,840$ (85)$ 4.4%
CanyonCountry 419,800$ 10.1% 255$ 7.9% 2,174$ 1,863$ (311)$ 5.0%
Cerritos 629,800$ 8.1% 375$ 5.9% 2,564$ 2,799$ 235$ 3.9%
Claremont 579,100$ 0.7% 307$ 4.4% 2,225$ 2,595$ 370$ 3.7%
Covina 430,100$ 8.2% 302$ 8.8% 2,001$ 1,906$ (95)$ 4.5%
DiamondBar 533,400$ 3.2% 336$ 4.2% 2,403$ 2,378$ (24)$ 4.3%
Downey 472,500$ 14.3% 347$ 12.0% 1,921$ 2,117$ 196$ 3.9%
Duarte 413,900$ 9.6% 343$ 9.0% 1,994$ 1,802$ (192)$ 4.6%
ElMonte 412,400$ 2.6% 304$ 17.0% 1,811$ 1,842$ 31$ 4.2%
Glendora 528,100$ 5.0% 341$ 5.6% 2,275$ 2,341$ 66$ 4.1%
HaciendaHeights 545,000$ 2.7% 312$ 1.4% 2,272$ 2,417$ 145$ 4.0%
LaMirada 488,500$ 4.8% 328$ 4.5% 2,442$ 2,163$ (279)$ 4.8%
LaPuente 380,100$ 9.9% 307$ 5.8% 1,933$ 1,681$ (252)$ 4.9%
LaVerne 561,900$ 6.7% 327$ 3.1% 2,326$ 2,565$ 239$ 4.0%
Lakewood 491,300$ 8.4% 379$ 4.6% 2,249$ 2,177$ (72)$ 4.4%
Lancaster 208,200$ 11.0% 122$ 0.0% 1,474$ 909$ (565)$ 6.8%
Monrovia 548,000$ 1.1% 399$ 5.8% 2,306$ 2,451$ 146$ 4.0%
MontereyPark 539,800$ 4.0% 368$ 5.3% 2,257$ 2,356$ 98$ 4.0%
Newhall 354,300$ 7.4% 254$ 8.6% 1,683$ 1,591$ (91)$ 4.6%
Norwalk 391,500$ 14.1% 343$ 4.5% 1,965$ 1,741$ (224)$ 4.8%
Palmdale 249,700$ 14.8% 140$ 8.7% 1,535$ 1,100$ (435)$ 5.9%
Pasadena 668,700$ -0.7% 484$ 3.4% 2,389$ 2,968$ 579$ 3.4%
Pomona 327,200$ 7.6% 250$ 3.4% 1,644$ 1,452$ (192)$ 4.8%
RowlandHeights 565,100$ 4.3% 342$ 2.5% 2,259$ 2,522$ 263$ 3.8%
SanDimas 500,200$ 7.4% 318$ 6.6% 2,000$ 2,175$ 175$ 3.8%
SanGabriel 660,200$ -2.1% 419$ 0.0% 2,322$ 2,939$ 616$ 3.4%
SanMarino 2,223,800$ -12.0% 820$ 1.9% 3,572$ 9,915$ 6,342$ 1.5%
SierraMadre 836,400$ 3.8% 489$ -6.5% 2,364$ 3,718$ 1,354$ 2.7%
SouthPasadena 1,045,700$ -2.5% 553$ 5.2% 2,607$ 4,614$ 2,007$ 2.4%
StevensonRanch 623,000$ 2.5% 265$ -5.8% 2,326$ 2,746$ 419$ 3.6%
Sunland 441,900$ 13.1% 342$ 32.1% 1,965$ 1,988$ 22$ 4.3%
MarketPerformanceandTrends:EastLosAngelesCounty,MajorCities,andZips

9of58
January2016ShevyAkason877-409-8515
Median Resale% Rent% Median Costof Ownership
City Resale$ ChangeYoY Resale$/SF ChangeYoY Rent$ Ownership Prem./Disc. CapRate
TempleCity 653,700$ -3.4% 430$ 6.4% 2,139$ 2,950$ 811$ 3.1%
Tujunga 468,600$ 20.6% 368$ -1.3% 2,127$ 2,075$ (51)$ 4.4%
VanNuys 439,200$ 5.5% 303$ 8.5% 1,966$ 1,934$ (32)$ 4.3%
WestCovina 460,600$ 6.9% 311$ 2.6% 2,042$ 2,038$ (3)$ 4.3%
Whittier 448,200$ 7.8% 329$ 1.9% 2,008$ 1,990$ (18)$ 4.3%
WoodlandHills 652,500$ 4.6% 360$ 6.3% 2,554$ 2,892$ 338$ 3.8%
Alhambra91801 531,300$ 4.7% 399$ 12.2% 1,962$ 2,361$ 399$ 3.5%
Alhambra91803 535,200$ 4.8% 389$ 5.7% 1,885$ 2,387$ 502$ 3.4%
Arcadia91006 928,000$ -7.5% 518$ 4.0% 2,817$ 4,134$ 1,317$ 2.9%
Azusa91702 372,700$ 1.7% 286$ 3.0% 1,887$ 1,644$ (243)$ 4.9%
CanyonCountry91351 395,400$ 9.2% 258$ 8.9% 1,744$ 1,756$ 13$ 4.2%
CanyonCountry91387 461,100$ 9.1% 250$ 3.5% 2,437$ 2,016$ (420)$ 5.1%
Covina91722 399,700$ 5.8% 306$ 0.4% 2,121$ 1,778$ (343)$ 5.1%
Covina91723 425,500$ 9.9% 309$ 18.1% 1,729$ 1,884$ 155$ 3.9%
DiamondBar91765 540,500$ 2.5% 331$ 5.0% 2,411$ 2,394$ (17)$ 4.3%
Duarte91010 413,900$ 9.9% 344$ 8.5% 1,994$ 1,798$ (197)$ 4.6%
ElMonte91732 392,800$ 5.7% 302$ 8.5% 1,742$ 1,779$ 37$ 4.3%
Glendora91740 454,700$ 6.0% 331$ 6.9% 2,325$ 2,022$ (303)$ 4.9%
Glendora91741 635,400$ 4.7% 352$ 4.6% 2,367$ 2,831$ 463$ 3.6%
HaciendaHts91745 552,500$ 2.9% 313$ -0.7% 2,322$ 2,455$ 133$ 4.0%
LaPuente91744 377,300$ 10.6% 307$ 5.2% 1,864$ 1,669$ (195)$ 4.7%
LaVerne91750 567,500$ 5.7% 324$ 3.1% 2,326$ 2,585$ 260$ 3.9%
Lakewood90713 507,600$ 8.8% 390$ -0.3% 2,211$ 2,247$ 35$ 4.2%
Lakewood90715 412,300$ 11.9% 341$ 14.9% 1,804$ 1,807$ 3$ 4.2%
Monrovia91016 548,000$ 1.1% 399$ 5.8% 2,306$ 2,451$ 146$ 4.0%
MontereyPark91754 544,600$ 6.2% 383$ 5.6% 2,207$ 2,367$ 160$ 3.9%
MontereyPark91755 478,200$ 1.4% 346$ -0.2% 2,356$ 2,132$ (224)$ 4.7%
Newhall91321 343,500$ 7.3% 254$ 8.3% 1,683$ 1,547$ (135)$ 4.7%
Norwalk90650 391,500$ 14.1% 343$ 4.5% 1,965$ 1,741$ (224)$ 4.8%
Pasadena91101 493,500$ 0.7% 481$ 4.3% 2,514$ 2,210$ (305)$ 4.9%
Pasadena91103 604,300$ 26.7% 492$ 10.5% 2,392$ 2,620$ 228$ 3.8%
Pasadena91104 662,500$ 11.3% 479$ 13.0% 2,226$ 2,985$ 759$ 3.2%
Pasadena91105 1,127,600$ -2.4% 548$ 14.7% 3,402$ 5,172$ 1,771$ 2.9%
Pasadena91106 555,900$ 10.7% 483$ 4.6% 2,411$ 2,435$ 23$ 4.2%
Pasadena91107 699,200$ -5.0% 455$ 0.7% 2,562$ 3,134$ 573$ 3.5%
PlayadelRey90293 570,200$ 14.0% 555$ 5.5% 2,898$ 2,503$ (394)$ 4.9%
Pomona91767 340,700$ 7.3% 248$ 3.9% 1,808$ 1,505$ (303)$ 5.1%
MarketPerformanceandTrends:EastLosAngelesCounty,MajorCities,andZips

10of58
January2016ShevyAkason877-409-8515
Median Resale% Rent% Median Costof Ownership
City Resale$ ChangeYoY Resale$/SF ChangeYoY Rent$ Ownership Prem./Disc. CapRate
Pomona91767 340,700$ 7.3% 248$ 3.9% 1,808$ 1,505$ (303)$ 5.1%
Pomona91768 324,200$ 8.6% 248$ 9.7% 1,535$ 1,433$ (102)$ 4.5%
Rosemead91770 506,200$ 5.0% 374$ 3.3% 1,923$ 2,220$ 297$ 3.6%
RowlandHeights91748 565,100$ 4.2% 342$ 2.6% 2,259$ 2,522$ 263$ 3.8%
SanDimas91773 500,200$ 7.3% 318$ 6.5% 2,000$ 2,175$ 175$ 3.8%
SanGabriel91775 757,400$ 1.2% 451$ -6.8% 2,322$ 3,334$ 1,012$ 2.9%
SanGabriel91776 548,900$ -8.6% 379$ 12.7% 1,943$ 2,409$ 466$ 3.4%
SanMarino91108 2,223,800$ -12.0% 820$ 1.8% 3,572$ 9,915$ 6,342$ 1.5%
SierraMadre91024 870,400$ 3.8% 489$ -6.7% 2,364$ 3,849$ 1,485$ 2.6%
SouthPasadena91030 1,045,700$ -2.4% 554$ 5.2% 2,607$ 4,614$ 2,007$ 2.4%
StevensonRanch91381 623,000$ 2.5% 265$ -5.8% 2,326$ 2,746$ 419$ 3.6%
Sunland91040 441,900$ 13.1% 342$ 32.1% 1,965$ 1,988$ 22$ 4.3%
TempleCity91780 648,500$ -3.4% 430$ 6.5% 2,139$ 2,936$ 797$ 3.2%
Tujunga91042 468,600$ 20.7% 368$ 0.0% 2,359$ 2,075$ (284)$ 4.8%
WestCovina91790 452,500$ 7.8% 321$ 3.4% 2,177$ 1,996$ (182)$ 4.6%
WestCovina91791 488,100$ 3.9% 307$ 1.0% 2,108$ 2,153$ 45$ 4.1%
WestCovina91792 422,000$ 7.0% 296$ 5.2% 1,943$ 1,899$ (44)$ 4.4%
Whittier90603 504,700$ 6.1% 335$ 1.2% 2,499$ 2,235$ (264)$ 4.8%
Whittier90605 439,000$ 8.6% 337$ 8.3% 1,959$ 1,950$ (10)$ 4.3%
WoodlandHills91364 751,500$ 3.0% 363$ 4.9% 3,045$ 3,318$ 273$ 3.9%
MarketPerformanceandTrends:EastLosAngelesCounty,MajorCities,andZips

11of58
January2016ShevyAkason877-409-8515
%Over/Under Historic %Over/UnderCity Rating Median RentalParity RentalParity Premium HistoricPrem.
Alhambra 8 533,600$ 468,100$ 12.0% 26.6% -14.5%Arcadia 5 941,700$ 625,300$ 50.7% 56.3% -5.6%Artesia 6 392,400$ 383,000$ -1.3% 12.9% -14.1%Azusa 7 372,700$ 421,000$ -11.7% 1.8% -13.5%BaldwinPark 7 347,500$ 389,600$ -9.8% 4.2% -14.0%Bellflower 10 420,500$ 429,400$ -3.5% 23.0% -26.5%CanyonCountry 8 419,800$ 484,900$ -12.4% 8.8% -21.2%Cerritos 8 629,800$ 572,000$ 9.8% 21.4% -11.6%Claremont 6 579,100$ 496,300$ 14.2% 19.1% -4.9%Covina 7 430,100$ 446,400$ -4.3% 9.8% -14.1%DiamondBar 10 533,400$ 536,000$ -0.8% 25.6% -26.4%Downey 6 472,500$ 428,600$ 11.0% 7.2% 3.8%Duarte 7 413,900$ 444,900$ -10.4% 2.5% -12.9%ElMonte 7 412,400$ 404,000$ -1.2% 3.6% -4.8%Glendora 9 528,100$ 507,500$ 5.4% 20.6% -15.2%HaciendaHeights 7 545,000$ 506,900$ 7.3% 21.0% -13.6%LaMirada 9 488,500$ 544,700$ -11.8% -0.5% -11.3%LaPuente 9 380,100$ 431,300$ -12.0% 4.2% -16.3%LaVerne 10 561,900$ 518,800$ 10.4% 33.8% -23.4%Lakewood 8 491,300$ 501,600$ -3.1% 12.2% -15.3%Lancaster 6 208,200$ 328,800$ -37.8% -14.0% -23.8%Monrovia 7 548,000$ 514,300$ 10.1% 18.9% -8.9%MontereyPark 10 539,800$ 503,600$ 7.1% 29.7% -22.6%Newhall 9 354,300$ 375,300$ -3.1% 23.1% -26.2%Norwalk 8 391,500$ 438,400$ -12.1% 0.4% -12.5%Palmdale 7 249,700$ 342,400$ -26.9% -15.2% -11.7%Pasadena 6 668,700$ 532,900$ 22.1% 17.1% 5.1%Pomona 8 327,200$ 366,700$ -13.9% -4.6% -9.3%RowlandHeights 8 565,100$ 503,900$ 8.1% 13.5% -5.4%SanDimas 9 500,200$ 446,200$ 7.4% 24.5% -17.2%SanGabriel 4 660,200$ 518,000$ 28.2% 32.5% -4.3%SanMarino 1 2,223,800$ 796,900$ 170.8% 100.0% 70.8%SierraMadre 4 836,400$ 527,300$ 59.0% 53.2% 5.8%SouthPasadena 4 1,045,700$ 581,600$ 77.3% 56.6% 20.7%StevensonRanch 4 623,000$ 519,000$ 15.8% 14.6% 1.2%Sunland 6 441,900$ 438,400$ -0.4% 4.1% -4.4%
MarketTimingRatingandValuations:EastLosAngelesCounty,MajorCities,andZips

12of58
January2016ShevyAkason877-409-8515
%Over/Under Historic %Over/Under
City Rating Median RentalParity RentalParity Premium HistoricPrem.
TempleCity 6 653,700$ 477,100$ 36.9% 40.6% -3.7%Tujunga 4 468,600$ 474,400$ -2.4% -6.7% 4.4%VanNuys 8 439,200$ 438,700$ -3.1% 5.5% -8.6%WestCovina 9 460,600$ 455,500$ -1.3% 12.4% -13.7%Whittier 6 448,200$ 448,000$ -0.1% 10.1% -10.2%WoodlandHills 8 652,500$ 569,700$ 12.7% 20.2% -7.6%
Alhambra91801 8 531,300$ 437,600$ 18.6% 31.1% -12.5%Alhambra91803 8 535,200$ 420,400$ 25.2% 20.3% 4.9%Arcadia91006 6 928,000$ 628,400$ 47.1% 56.9% -9.9%Azusa91702 7 372,700$ 421,000$ -11.7% 1.8% -13.5%CanyonCountry91351 7 395,400$ 389,000$ -2.6% 9.7% -12.3%CanyonCountry91387 10 461,100$ 543,600$ -17.9% 31.7% -49.5%Covina91722 9 399,700$ 473,200$ -14.9% 10.5% -25.3%Covina91723 6 425,500$ 385,600$ 7.2% 11.1% -3.9%DiamondBar91765 10 540,500$ 537,900$ -0.5% 26.9% -27.4%Duarte91010 7 413,900$ 444,900$ -10.7% 2.5% -13.2%ElMonte91732 7 392,800$ 388,500$ -0.7% 5.5% -6.3%Glendora91740 10 454,700$ 518,700$ -10.2% 10.9% -21.1%Glendora91741 10 635,400$ 528,100$ 21.5% 43.2% -21.7%HaciendaHts91745 6 552,500$ 518,000$ 5.8% 20.9% -15.1%LaPuente91744 8 377,300$ 415,800$ -9.9% 5.0% -14.9%LaVerne91750 10 567,500$ 518,800$ 11.3% 33.4% -22.1%Lakewood90713 5 507,600$ 493,300$ 1.8% 12.4% -10.5%Lakewood90715 7 412,300$ 402,400$ 1.9% 10.3% -8.3%Monrovia91016 7 548,000$ 514,300$ 10.1% 18.9% -8.9%MontereyPark91754 10 544,600$ 492,300$ 10.1% 30.8% -20.7%MontereyPark91755 6 478,200$ 525,500$ -8.0% 23.4% -31.4%Newhall91321 9 343,500$ 375,300$ -5.8% 23.7% -29.5%Norwalk90650 8 391,500$ 438,400$ -12.1% 0.4% -12.4%Pasadena91101 6 493,500$ 560,900$ -12.2% -8.8% -3.4%Pasadena91103 5 604,300$ 533,600$ 8.0% -5.2% 13.2%Pasadena91104 6 662,500$ 496,500$ 33.5% 31.3% 2.2%Pasadena91105 6 1,127,600$ 758,900$ 51.8% 65.5% -13.7%Pasadena91106 8 555,900$ 537,900$ 0.2% 15.8% -15.6%Pasadena91107 5 699,200$ 571,500$ 23.4% 32.5% -9.1%PlayadelRey90293 10 570,200$ 646,400$ -13.4% 19.5% -32.9%
MarketTimingRatingandValuations:EastLosAngelesCounty,MajorCities,andZips

13of58
January2016ShevyAkason877-409-8515
%Over/Under Historic %Over/Under
City Rating Median RentalParity RentalParity Premium HistoricPrem.
Pomona91767 8 340,700$ 403,200$ -16.4% -6.7% -9.6%Pomona91768 6 324,200$ 342,400$ -5.7% -8.1% 2.4%Rosemead91770 9 506,200$ 428,900$ 14.0% 29.3% -15.3%RowlandHeights91748 8 565,100$ 503,900$ 8.1% 14.0% -5.9%SanDimas91773 9 500,200$ 446,200$ 7.4% 24.5% -17.2%SanGabriel91775 2 757,400$ 518,000$ 42.0% 43.4% -1.4%SanGabriel91776 5 548,900$ 433,500$ 24.0% 37.3% -13.4%SanMarino91108 1 2,223,800$ 796,900$ 170.8% 99.5% 71.3%SierraMadre91024 3 870,400$ 527,300$ 64.6% 53.2% 11.3%SouthPasadena91030 4 1,045,700$ 581,600$ 77.3% 56.6% 20.7%StevensonRanch91381 4 623,000$ 519,000$ 15.8% 23.4% -7.5%Sunland91040 6 441,900$ 438,400$ -0.4% 3.1% -3.5%TempleCity91780 6 648,500$ 477,100$ 36.3% 40.8% -4.5%Tujunga91042 6 468,600$ 526,200$ -11.7% -0.5% -11.2%WestCovina91790 9 452,500$ 485,700$ -7.3% 14.4% -21.8%WestCovina91791 7 488,100$ 470,300$ 0.5% 13.9% -13.3%WestCovina91792 8 422,000$ 433,400$ -0.3% 12.6% -12.9%Whittier90603 9 504,700$ 557,600$ -9.6% 20.4% -30.0%Whittier90605 7 439,000$ 437,100$ 2.3% 15.9% -13.7%WoodlandHills91364 9 751,500$ 679,400$ 7.0% 15.7% -8.7%
MarketTimingRatingandValuations:EastLosAngelesCounty,MajorCities,andZips

14of58
January2016ShevyAkason877-409-8515
Median Resale% Rent% Median Costof Ownership
City Resale$ ChangeYoY Resale$/SF ChangeYoY Rent$ Ownership Prem./Disc. CapRate
AgouraHills 687,600$ 9.2% 349$ 4.4% 2,788$ 3,026$ 239$ 3.9%
Altadena 672,700$ 12.3% 446$ -7.7% 2,467$ 3,019$ 552$ 3.5%
BeverlyHills 2,211,100$ 7.8% 954$ 7.8% 3,963$ 9,684$ 5,721$ 1.7%
Burbank 642,600$ 4.2% 444$ 10.9% 2,692$ 2,849$ 157$ 4.0%
Calabasas 1,035,900$ 5.8% 412$ 1.7% 3,268$ 4,599$ 1,331$ 3.0%
CanogaPark 368,400$ 12.5% 298$ 0.1% 1,792$ 1,656$ (136)$ 4.7%
Carson 413,100$ 8.8% 300$ 10.5% 2,257$ 1,850$ (407)$ 5.2%
Chatsworth 483,900$ 0.7% 271$ 9.7% 2,460$ 2,235$ (225)$ 4.9%
CulverCity 739,300$ 17.4% 578$ 3.1% 3,177$ 3,277$ 100$ 4.1%
Encino 689,600$ 2.0% 401$ 7.2% 2,747$ 3,108$ 361$ 3.8%
Gardena 418,300$ 9.6% 322$ 7.2% 2,243$ 1,855$ (388)$ 5.1%
Glendale 631,300$ 9.4% 423$ 3.4% 2,262$ 2,842$ 580$ 3.4%
GranadaHills 534,300$ 9.2% 319$ 6.6% 2,476$ 2,389$ (86)$ 4.4%
HarborCity 485,900$ 8.3% 319$ 1.7% 2,375$ 2,107$ (267)$ 4.7%
Hawthorne 485,000$ 5.5% 392$ 4.9% 2,939$ 2,182$ (757)$ 5.8%
HermosaBeach 1,394,100$ 11.2% 934$ 11.1% 3,766$ 6,119$ 2,353$ 2.6%
Inglewood 368,200$ 20.2% 291$ 1.6% 1,694$ 1,637$ (56)$ 4.4%
LaCanadaFlintridge 1,564,100$ 12.8% 632$ -1.9% 3,577$ 6,829$ 3,252$ 2.2%
LaCrescenta 728,300$ 9.4% 458$ 13.1% 3,212$ 3,237$ 24$ 4.2%
Lomita 523,400$ 11.0% 373$ 9.7% 2,203$ 2,320$ 117$ 4.0%
LongBeach 462,000$ 8.2% 382$ 9.5% 2,197$ 2,048$ (149)$ 4.6%
LosAngeles(City) 654,600$ 6.8% 512$ 7.8% 3,233$ 2,915$ (317)$ 4.7%
Malibu 2,022,100$ 1.5% 1,049$ 7.0% 3,960$ 8,719$ 4,759$ 1.9%
ManhattanBeach 2,096,600$ 18.0% 1,138$ 15.1% 3,856$ 9,078$ 5,223$ 1.8%
MarinadelRey 896,900$ 6.7% 604$ 6.2% 3,517$ 3,954$ 436$ 3.8%
Montrose 547,800$ 5.6% 406$ -1.7% 2,701$ 2,442$ (260)$ 4.7%
NorthHills 433,400$ 10.6% 267$ 7.7% 2,446$ 1,931$ (515)$ 5.4%
NorthHollywood 472,600$ 11.3% 364$ 3.8% 2,171$ 2,094$ (78)$ 4.4%
Northridge 600,500$ 8.3% 304$ 4.4% 3,081$ 2,661$ (421)$ 4.9%
PacificPalisades 2,251,700$ 4.7% 925$ -1.2% 4,642$ 10,019$ 5,378$ 2.0%
PlayadelRey 570,200$ 14.0% 555$ 6.2% 2,898$ 2,503$ (394)$ 4.9%
RanchoPalosVerdes 1,093,200$ 5.2% 518$ 3.3% 3,825$ 4,809$ 984$ 3.4%
RedondoBeach 852,900$ 7.3% 536$ 3.7% 3,117$ 3,819$ 702$ 3.5%
Reseda 428,300$ 10.9% 311$ 2.5% 2,359$ 1,900$ (459)$ 5.3%
SanPedro 467,700$ 7.6% 354$ 4.5% 1,943$ 2,079$ 136$ 4.0%
SantaMonica 1,196,800$ 0.6% 940$ 8.2% 3,592$ 5,402$ 1,810$ 2.9%
ShermanOaks 735,500$ 6.7% 451$ 3.1% 2,814$ 3,221$ 408$ 3.7%
MarketPerformanceandTrends:WestLosAngelesCounty,MajorCities,andZips

15of58
January2016ShevyAkason877-409-8515
Median Resale% Rent% Median Costof Ownership
City Resale$ ChangeYoY Resale$/SF ChangeYoY Rent$ Ownership Prem./Disc. CapRate
StudioCity 927,700$ 5.8% 530$ 12.5% 3,682$ 4,189$ 507$ 3.8%
Sylmar 395,400$ 5.5% 268$ 3.1% 2,400$ 1,754$ (646)$ 5.8%
Tarzana 559,700$ 5.4% 333$ 9.3% 2,649$ 2,503$ (146)$ 4.5%
Torrance 591,500$ 2.7% 417$ 5.6% 2,693$ 2,644$ (49)$ 4.4%
Valencia 472,500$ 5.6% 288$ 4.2% 2,459$ 2,090$ (368)$ 5.0%
ValleyVillage 782,400$ 4.6% 423$ 11.0% 2,790$ 3,489$ 700$ 3.4%
Venice 1,597,700$ 8.3% 1,096$ 9.4% 3,958$ 7,269$ 3,310$ 2.4%
Walnut 709,900$ -1.5% 370$ 3.2% 2,616$ 3,182$ 566$ 3.5%
WestHills 574,300$ 10.6% 346$ 5.8% 2,735$ 2,544$ (192)$ 4.6%
WestHollywood 695,600$ 15.3% 701$ 4.2% 3,489$ 3,067$ (421)$ 4.8%
Winnetka 460,300$ 8.9% 293$ 3.3% 2,474$ 2,026$ (449)$ 5.2%
AgouraHills91301 687,600$ 9.2% 349$ 4.4% 2,788$ 3,026$ 239$ 3.9%
Altadena91001 672,700$ 12.1% 446$ -7.7% 2,467$ 3,019$ 552$ 3.5%
BeverlyHills90210 2,717,800$ 6.2% 1,036$ 5.2% 3,913$ 12,185$ 8,273$ 1.4%
BeverlyHills90211 1,541,600$ 0.1% 756$ 1.7% 4,298$ 6,698$ 2,400$ 2.7%
Burbank91501 598,000$ 8.7% 433$ 0.6% 2,567$ 2,632$ 65$ 4.1%
Burbank91504 623,700$ 3.2% 405$ 4.1% 2,889$ 2,748$ (141)$ 4.4%
Burbank91505 628,000$ 4.7% 470$ 14.8% 2,456$ 2,784$ 328$ 3.8%
Calabasas91302 1,124,800$ 5.0% 414$ 1.6% 3,356$ 4,886$ 1,531$ 2.9%
Chatsworth91311 483,900$ 0.7% 271$ 9.7% 2,460$ 2,235$ (225)$ 4.9%
CulverCity90230 510,800$ 16.6% 531$ 5.2% 2,839$ 2,220$ (619)$ 5.3%
Gardena90247 383,000$ 7.8% 299$ -2.0% 1,600$ 1,705$ 105$ 4.0%
Glendale91202 571,200$ 10.6% 401$ 10.7% 2,571$ 2,513$ (58)$ 4.3%
Glendale91206 628,600$ 7.4% 389$ -3.2% 2,246$ 2,645$ 399$ 3.4%
Glendale91207 810,900$ 15.3% 452$ 4.6% 2,665$ 3,675$ 1,011$ 3.2%
Glendale91208 829,000$ 10.8% 449$ 1.2% 2,635$ 3,700$ 1,065$ 3.1%
GranadaHills91344 537,200$ 8.5% 318$ 6.6% 2,476$ 2,406$ (69)$ 4.4%
HarborCity90710 482,100$ 8.2% 319$ 2.0% 2,383$ 2,098$ (285)$ 4.7%
LaCanadaFlintridge91011 1,564,100$ 12.8% 632$ -1.9% 3,577$ 6,829$ 3,252$ 2.2%
LaCrescenta91214 728,300$ 9.4% 458$ 13.1% 3,212$ 3,237$ 24$ 4.2%
Lomita90717 523,400$ 11.4% 373$ 9.1% 2,203$ 2,320$ 117$ 4.0%
LongBeach90802 293,000$ 9.0% 377$ 9.4% 2,084$ 1,291$ (793)$ 6.8%
LongBeach90803 660,700$ 4.3% 502$ 7.5% 2,497$ 3,044$ 547$ 3.6%
LongBeach90804 359,700$ 6.6% 358$ 7.6% 1,881$ 1,577$ (304)$ 5.0%
LongBeach90805 353,300$ 7.4% 308$ 10.2% 1,933$ 1,568$ (365)$ 5.3%
LongBeach90805 353,300$ 7.4% 308$ 10.2% 1,933$ 1,568$ (365)$ 5.3%
LongBeach90806 422,800$ 15.9% 346$ 9.8% 1,653$ 1,849$ 196$ 3.8%
MarketPerformanceandTrends:WestLosAngelesCounty,MajorCities,andZips

16of58
January2016ShevyAkason877-409-8515
Median Resale% Rent% Median Costof Ownership
City Resale$ ChangeYoY Resale$/SF ChangeYoY Rent$ Ownership Prem./Disc. CapRate
LongBeach90807 533,500$ 11.1% 369$ 8.3% 1,556$ 2,325$ 769$ 2.8%
LongBeach90808 571,900$ 3.6% 398$ 10.0% 2,252$ 2,546$ 295$ 3.8%
LongBeach90813 299,800$ 15.0% 300$ 10.3% 1,182$ 1,332$ 150$ 3.8%
LongBeach90814 617,400$ 1.6% 419$ 27.3% 2,236$ 2,718$ 482$ 3.5%
LongBeach90815 582,300$ 8.9% 406$ 11.2% 2,462$ 2,571$ 110$ 4.1%
LosAngeles90004 806,300$ 12.1% 629$ 23.3% 3,448$ 3,610$ 162$ 4.1%
LosAngeles90005 607,700$ -2.3% 435$ 10.6% 2,943$ 2,659$ (284)$ 4.6%
LosAngeles90012 460,800$ 2.5% 519$ 7.0% 2,294$ 2,051$ (243)$ 4.8%
LosAngeles90019 877,200$ 9.7% 497$ 5.6% 2,587$ 3,896$ 1,309$ 2.8%
LosAngeles90020 441,800$ 1.6% 493$ 9.0% 2,326$ 1,946$ (380)$ 5.1%
LosAngeles90024 834,800$ 5.7% 678$ 5.7% 3,114$ 3,686$ 573$ 3.6%
LosAngeles90025 772,100$ 10.5% 586$ 7.5% 3,721$ 3,430$ (291)$ 4.6%
LosAngeles90026 826,900$ 8.4% 592$ -1.7% 3,450$ 3,544$ 94$ 4.0%
LosAngeles90027 1,205,000$ 2.7% 605$ 10.7% 3,193$ 5,319$ 2,126$ 2.5%
LosAngeles90034 828,000$ 12.6% 596$ 32.4% 3,811$ 3,763$ (48)$ 4.4%
LosAngeles90035 973,900$ 14.6% 625$ 8.3% 3,269$ 4,288$ 1,019$ 3.2%
LosAngeles90036 1,205,200$ 1.9% 617$ 10.0% 3,743$ 5,153$ 1,411$ 3.0%
LosAngeles90042 511,700$ 0.7% 443$ 9.6% 2,127$ 2,315$ 187$ 4.0%
LosAngeles90045 913,200$ 8.5% 576$ 15.1% 3,627$ 4,009$ 382$ 3.8%
LosAngeles90046 1,232,200$ 1.3% 696$ -3.9% 3,426$ 5,566$ 2,140$ 2.7%
LosAngeles90048 1,507,200$ 13.6% 759$ -0.5% 3,744$ 6,643$ 2,899$ 2.4%
LosAngeles90049 1,624,800$ 5.6% 801$ 11.5% 3,743$ 7,057$ 3,314$ 2.2%
LosAngeles90064 1,066,400$ 8.1% 693$ 6.3% 3,478$ 4,627$ 1,149$ 3.1%
LosAngeles90066 1,126,600$ 9.8% 710$ 4.0% 3,793$ 4,990$ 1,197$ 3.2%
LosAngeles90068 1,193,500$ 7.8% 612$ 7.7% 3,944$ 5,321$ 1,377$ 3.2%
ManhattanBeach90266 2,096,600$ 18.3% 1,141$ 14.2% 3,856$ 9,078$ 5,223$ 1.8%
MarinadelRey90292 896,900$ 6.7% 604$ 6.2% 3,517$ 3,954$ 436$ 3.8%
Montrose91020 551,400$ 6.2% 407$ -1.0% 2,676$ 2,455$ (221)$ 4.7%
NorthHills91343 433,400$ 10.6% 267$ 7.6% 2,446$ 1,931$ (515)$ 5.4%
Northridge91325 531,800$ 10.7% 292$ 3.5% 2,357$ 2,352$ (5)$ 4.3%
PacificPalisades90272 2,251,700$ 4.8% 926$ -0.5% 4,642$ 10,019$ 5,378$ 2.0%
PalosVerdesEstates90274 1,640,200$ -2.3% 674$ 8.7% 3,793$ 7,467$ 3,674$ 2.2%
RedondoBeach90277 911,500$ 6.0% 597$ 5.6% 3,147$ 4,093$ 946$ 3.3%
RedondoBeach90278 804,800$ 11.2% 485$ 4.1% 3,285$ 3,587$ 302$ 3.9%
Reseda91335 428,300$ 11.0% 311$ 2.5% 2,359$ 1,900$ (459)$ 5.3%
SanPedro90731 472,300$ 8.7% 363$ 3.2% 1,668$ 2,085$ 417$ 3.4%
SanPedro90732 460,400$ 6.7% 343$ 6.5% 1,939$ 2,054$ 115$ 4.0%
MarketPerformanceandTrends:WestLosAngelesCounty,MajorCities,andZips

17of58
January2016ShevyAkason877-409-8515
Median Resale% Rent% Median Costof Ownership
City Resale$ ChangeYoY Resale$/SF ChangeYoY Rent$ Ownership Prem./Disc. CapRate
SantaMonica90402 2,832,500$ 3.3% 1,239$ -8.7% 3,631$ 12,592$ 8,961$ 1.2%
SantaMonica90403 1,183,300$ 2.5% 825$ 1.2% 3,715$ 5,062$ 1,347$ 3.0%
SantaMonica90404 755,800$ 7.3% 661$ 5.8% 3,310$ 3,505$ 196$ 4.2%
SantaMonica90405 1,359,800$ 6.6% 906$ 6.4% 3,577$ 6,153$ 2,576$ 2.5%
ShermanOaks91403 842,100$ 7.2% 450$ 1.9% 2,721$ 3,760$ 1,038$ 3.1%
ShermanOaks91423 857,300$ 7.0% 471$ 4.3% 2,669$ 3,684$ 1,015$ 3.0%
Tarzana91356 754,800$ 7.4% 339$ 10.9% 2,611$ 3,198$ 586$ 3.3%
Torrance90501 544,800$ 2.4% 404$ 3.4% 2,459$ 2,404$ (54)$ 4.3%
Torrance90502 613,900$ -24.3% 316$ 0.4% 1,806$ 2,732$ 926$ 2.8%
Torrance90503 668,700$ 6.7% 453$ 4.4% 2,725$ 2,957$ 232$ 3.9%
Torrance90504 579,300$ 5.9% 417$ 2.8% 2,616$ 2,598$ (18)$ 4.3%
Torrance90505 772,300$ -2.3% 458$ 8.1% 3,004$ 3,485$ 481$ 3.7%
Valencia91354 479,000$ 5.3% 275$ 4.5% 2,527$ 2,117$ (410)$ 5.1%
Valencia91355 430,100$ 7.5% 302$ 5.7% 1,877$ 1,930$ 53$ 4.2%
ValleyVillage91607 810,800$ 3.9% 415$ 9.3% 2,790$ 3,566$ 776$ 3.3%
Venice90291 1,662,600$ 12.9% 1,155$ 10.2% 3,709$ 7,547$ 3,837$ 2.1%
Walnut91789 709,900$ -1.5% 370$ 3.2% 2,616$ 3,182$ 566$ 3.5%
WestHills91307 536,900$ 6.8% 340$ 4.5% 2,793$ 2,386$ (407)$ 5.0%
WestHollywood90069 682,400$ 21.0% 704$ 4.8% 3,488$ 2,941$ (547)$ 4.9%
Winnetka91306 460,300$ 8.9% 293$ 3.3% 2,474$ 2,026$ (449)$ 5.2%
MarketPerformanceandTrends:WestLosAngelesCounty,MajorCities,andZips

18of58
January2016ShevyAkason877-409-8515
%Over/Under Historic %Over/UnderCity Rating Median RentalParity RentalParity Premium HistoricPrem.
AgouraHills 9 687,600$ 621,900$ 8.0% 24.3% -16.3%Altadena 1 672,700$ 550,300$ 25.5% 5.4% 20.1%BeverlyHills 6 2,211,100$ 884,100$ 143.6% 136.7% 6.9%Burbank 7 642,600$ 600,500$ 7.4% 3.5% 3.9%Calabasas 9 1,035,900$ 729,000$ 38.9% 70.9% -32.0%CanogaPark 8 368,400$ 399,800$ -11.9% 13.8% -25.7%Carson 7 413,100$ 503,600$ -18.1% -3.3% -14.7%Chatsworth 7 483,900$ 548,900$ -9.4% 8.7% -18.1%CulverCity 7 739,300$ 708,700$ 5.5% 6.5% -1.0%Encino 6 689,600$ 612,900$ 13.1% 25.7% -12.6%Gardena 8 418,300$ 500,300$ -17.0% 5.0% -22.0%Glendale 7 631,300$ 504,600$ 23.1% 21.5% 1.6%GranadaHills 7 534,300$ 552,300$ -1.7% 3.1% -4.8%HarborCity 8 485,900$ 529,800$ -11.6% 13.8% -25.4%Hawthorne 8 485,000$ 655,700$ -22.2% -18.5% -3.7%HermosaBeach 6 1,394,100$ 840,100$ 60.3% 62.6% -2.4%Inglewood 6 368,200$ 377,800$ -0.8% 9.6% -10.4%LaCanadaFlintridge 1 1,564,100$ 798,100$ 94.6% 58.7% 35.9%LaCrescenta 7 728,300$ 716,600$ 0.8% 14.5% -13.7%Lomita 9 523,400$ 491,400$ 10.8% 39.0% -28.3%LongBeach 7 462,000$ 490,100$ -6.8% 2.2% -9.0%LosAngeles(City) 6 654,600$ 721,100$ -9.3% -23.1% 13.8%Malibu 2 2,022,100$ 883,400$ 119.3% 92.4% 26.8%ManhattanBeach 1 2,096,600$ 860,100$ 135.1% 67.3% 67.8%MarinadelRey 8 896,900$ 784,700$ 10.0% 11.1% -1.1%Montrose 7 547,800$ 602,700$ -9.6% 8.2% -17.8%NorthHills 8 433,400$ 545,600$ -20.3% -3.1% -17.2%NorthHollywood 7 472,600$ 484,400$ -5.1% -2.9% -2.2%Northridge 7 600,500$ 687,400$ -10.5% -8.4% -2.1%PacificPalisades 3 2,251,700$ 1,035,500$ 122.8% 103.8% 19.0%PlayadelRey 10 570,200$ 646,400$ -13.4% 20.8% -34.1%RanchoPalosVerdes 10 1,093,200$ 853,300$ 26.8% 71.1% -44.3%RedondoBeach 7 852,900$ 695,300$ 20.1% 21.0% -0.9%Reseda 8 428,300$ 526,300$ -18.5% -9.3% -9.3%SanPedro 10 467,700$ 433,500$ 5.0% 34.9% -29.9%SantaMonica 1 1,196,800$ 801,300$ 51.3% 16.2% 35.0%ShermanOaks 8 735,500$ 627,700$ 13.5% 21.0% -7.5%
MarketTimingRatingandValuations:WestLosAngelesCounty,MajorCities,andZips

19of58
January2016ShevyAkason877-409-8515
%Over/Under Historic %Over/Under
City Rating Median RentalParity RentalParity Premium HistoricPrem.
StudioCity 7 927,700$ 821,500$ 17.3% 23.0% -5.7%Sylmar 10 395,400$ 535,500$ -25.4% -6.8% -18.6%Tarzana 10 559,700$ 591,000$ -5.0% 21.2% -26.2%Torrance 10 591,500$ 600,700$ -3.0% 17.1% -20.1%Valencia 10 472,500$ 548,500$ -14.8% 6.8% -21.6%ValleyVillage 9 782,400$ 622,300$ 24.1% 40.8% -16.6%Venice 1 1,597,700$ 883,100$ 86.3% -9.1% 95.4%Walnut 7 709,900$ 583,500$ 21.8% 36.2% -14.4%WestHills 8 574,300$ 610,200$ -6.6% 2.2% -8.8%WestHollywood 7 695,600$ 778,300$ -11.9% -9.1% -2.7%Winnetka 8 460,300$ 551,900$ -17.4% -2.3% -15.2%AgouraHills91301 9 687,600$ 621,900$ 8.0% 24.3% -16.3%Altadena91001 1 672,700$ 550,300$ 25.5% 5.4% 20.1%BeverlyHills90210 7 2,717,800$ 872,900$ 211.1% 195.7% 15.4%BeverlyHills90211 4 1,541,600$ 958,900$ 58.7% 64.5% -5.8%Burbank91501 6 598,000$ 572,700$ 4.5% 12.7% -8.2%Burbank91504 10 623,700$ 644,500$ -2.7% 14.8% -17.5%Burbank91505 7 628,000$ 547,800$ 12.4% 4.4% 8.0%Calabasas91302 8 1,124,800$ 748,600$ 43.5% 65.1% -21.6%Chatsworth91311 7 483,900$ 548,900$ -9.4% 8.7% -18.1%CulverCity90230 10 510,800$ 633,300$ -19.8% 7.9% -27.7%Gardena90247 3 383,000$ 357,000$ 9.0% 11.6% -2.7%Glendale91202 10 571,200$ 573,600$ -4.7% 29.6% -34.3%Glendale91206 4 628,600$ 501,000$ 18.3% 29.7% -11.5%Glendale91207 10 810,900$ 594,400$ 37.2% 74.7% -37.5%Glendale91208 6 829,000$ 587,900$ 40.4% 49.8% -9.3%GranadaHills91344 7 537,200$ 552,300$ -1.0% 3.1% -4.1%HarborCity90710 8 482,100$ 531,500$ -12.5% 15.0% -27.5%LaCanadaFlintridge91011 1 1,564,100$ 798,100$ 94.6% 62.6% 31.9%LaCrescenta91214 7 728,300$ 716,600$ 0.8% 14.1% -13.3%Lomita90717 9 523,400$ 491,400$ 10.8% 36.0% -25.2%LongBeach90802 6 293,000$ 465,000$ -36.4% -40.4% 4.0%LongBeach90803 10 660,700$ 557,100$ 16.1% 56.1% -40.0%LongBeach90804 9 359,700$ 419,700$ -17.8% 3.5% -21.3%LongBeach90805 10 353,300$ 431,200$ -19.1% 19.7% -38.8%LongBeach90805 10 353,300$ 431,200$ -19.1% 19.7% -38.8%LongBeach90806 10 422,800$ 368,700$ 13.9% 52.5% -38.6%
MarketTimingRatingandValuations:WestLosAngelesCounty,MajorCities,andZips

20of58
January2016ShevyAkason877-409-8515
%Over/Under Historic %Over/Under
City Rating Median RentalParity RentalParity Premium HistoricPrem.
LongBeach90807 9 533,500$ 347,200$ 48.2% 74.4% -26.1%LongBeach90808 7 571,900$ 502,300$ 8.8% 13.0% -4.2%LongBeach90813 5 299,800$ 263,600$ 11.7% -2.0% 13.7%LongBeach90814 5 617,400$ 498,700$ 24.6% 29.4% -4.8%LongBeach90815 7 582,300$ 549,200$ 5.0% 15.1% -10.1%LosAngeles90004 10 806,300$ 769,200$ 6.1% 44.2% -38.0%LosAngeles90005 10 607,700$ 656,500$ -8.7% 48.5% -57.1%LosAngeles90012 8 460,800$ 511,700$ -9.8% -5.2% -4.5%LosAngeles90019 2 877,200$ 577,100$ 46.7% 3.8% 42.9%LosAngeles90020 9 441,800$ 518,900$ -16.7% 17.4% -34.1%LosAngeles90024 10 834,800$ 694,700$ 16.9% 43.9% -27.0%LosAngeles90025 8 772,100$ 830,200$ -7.5% 14.7% -22.2%LosAngeles90026 2 826,900$ 769,800$ 5.6% -11.1% 16.7%LosAngeles90027 6 1,205,000$ 712,300$ 68.4% 53.4% 15.0%LosAngeles90034 6 828,000$ 850,100$ -1.1% 3.2% -4.4%LosAngeles90035 4 973,900$ 729,400$ 32.3% 15.8% 16.6%LosAngeles90036 2 1,205,200$ 835,000$ 39.4% 11.4% 28.0%LosAngeles90042 4 511,700$ 474,600$ 8.6% -5.0% 13.6%LosAngeles90045 6 913,200$ 809,100$ 13.2% 20.4% -7.2%LosAngeles90046 1 1,232,200$ 764,300$ 64.9% 14.2% 50.6%LosAngeles90048 1 1,507,200$ 835,200$ 81.6% 28.8% 52.8%LosAngeles90049 9 1,624,800$ 835,100$ 86.8% 110.5% -23.6%LosAngeles90064 7 1,066,400$ 775,900$ 33.6% 37.1% -3.5%LosAngeles90066 6 1,126,600$ 846,300$ 30.2% 14.8% 15.3%LosAngeles90068 4 1,193,500$ 879,800$ 36.1% 17.8% 18.3%ManhattanBeach90266 1 2,096,600$ 860,100$ 135.1% 66.1% 69.1%MarinadelRey90292 8 896,900$ 784,700$ 10.0% 11.0% -1.0%Montrose91020 7 551,400$ 597,000$ -8.3% 7.9% -16.2%NorthHills91343 8 433,400$ 545,600$ -20.3% -3.1% -17.2%Northridge91325 9 531,800$ 525,800$ -1.0% 21.6% -22.6%PacificPalisades90272 3 2,251,700$ 1,035,500$ 122.8% 103.5% 19.3%PalosVerdesEstates90274 4 1,640,200$ 846,100$ 105.6% 94.0% 11.6%RedondoBeach90277 8 911,500$ 702,100$ 27.0% 31.5% -4.5%RedondoBeach90278 7 804,800$ 732,900$ 9.7% 12.3% -2.5%Reseda91335 8 428,300$ 526,300$ -18.5% -9.3% -9.3%SanPedro90731 9 472,300$ 372,200$ 23.4% 45.2% -21.8%SanPedro90732 10 460,400$ 432,500$ 4.2% 32.7% -28.5%
MarketTimingRatingandValuations:WestLosAngelesCounty,MajorCities,andZips

21of58
January2016ShevyAkason877-409-8515
%Over/Under Historic %Over/Under
City Rating Median RentalParity RentalParity Premium HistoricPrem.
SantaMonica90402 1 2,832,500$ 810,000$ 242.7% 179.8% 62.9%SantaMonica90403 3 1,183,300$ 828,800$ 34.2% 5.9% 28.3%SantaMonica90404 7 755,800$ 738,400$ 5.1% 5.4% -0.3%SantaMonica90405 1 1,359,800$ 798,000$ 72.0% 14.0% 58.0%ShermanOaks91403 4 842,100$ 607,100$ 40.9% 28.4% 12.5%ShermanOaks91423 6 857,300$ 595,500$ 34.9% 25.8% 9.1%Tarzana91356 6 754,800$ 582,600$ 22.6% 22.5% 0.0%Torrance90501 10 544,800$ 548,500$ -1.0% 16.3% -17.4%Torrance90502 10 613,900$ 402,800$ 48.8% 120.2% -71.4%Torrance90503 10 668,700$ 607,900$ 6.9% 31.3% -24.5%Torrance90504 10 579,300$ 583,600$ 0.2% 16.5% -16.3%Torrance90505 7 772,300$ 670,200$ 14.5% 38.4% -23.9%Valencia91354 10 479,000$ 563,800$ -15.7% 12.5% -28.2%Valencia91355 10 430,100$ 418,600$ -1.5% 36.2% -37.7%ValleyVillage91607 5 810,800$ 622,300$ 26.8% 4.6% 22.2%Venice90291 1 1,662,600$ 827,500$ 104.4% -9.2% 113.6%Walnut91789 7 709,900$ 583,500$ 21.8% 36.2% -14.4%WestHills91307 10 536,900$ 623,000$ -13.2% 4.6% -17.8%WestHollywood90069 7 682,400$ 778,100$ -15.9% -8.1% -7.8%Winnetka91306 8 460,300$ 551,900$ -17.4% -2.3% -15.2%
MarketTimingRatingandValuations:WestLosAngelesCounty,MajorCities,andZips

22of58
January2016ShevyAkason877-409-8515
Historically,propertiesinthismarketsellata0.6%premium.Today'sdiscountis3.5%.Thismarketis4.1%undervalued.Medianhomepriceis$594,700witharentalparityvalueof$611,600.Thismarket'sdiscountis$16,900.Monthlypaymentaffordabilityhasbeenimprovingoverthelast3month(s).Momentumsuggestsimprovingaffordability.Resalepricesona$/SFbasisincreasedfrom$392/SFto$394/SF.Resalepriceshavebeenrisingfor11month(s).Overthelast12months,resalepricesrose5.1%indicatingalongertermupwardpricetrend.Medianrentalratesdeclined$8lastmonthfrom$2,750to$2,741.Thecurrentcapitalizationrate(rent/price)is4.4%.Rentshavebeenrisingfor12month(s).Pricemomentumsignalsrisingrentsoverthenextthreemonths.Marketrating=8
MedianHomePriceandRentalParitytrailingtwelvemonthsDate Rating Median RentalParity HistoricValue1/2015 8 560,800$ 601,600$ 605,294$2/2015 8 558,800$ 597,800$ 601,470$3/2015 8 560,500$ 593,400$ 597,043$4/2015 8 563,400$ 600,700$ 604,388$5/2015 8 569,400$ 599,500$ 603,181$6/2015 8 577,800$ 595,100$ 598,754$7/2015 8 586,900$ 597,500$ 601,169$8/2015 8 592,800$ 617,000$ 620,788$9/2015 8 594,400$ 622,300$ 626,121$10/2015 8 597,000$ 627,200$ 631,051$11/2015 8 596,600$ 615,000$ 618,776$12/2015 8 594,700$ 611,600$ 615,355$
Resale$/SFandyear-over-yearpercentagechangetrailingtwelvemonthsDate ±Typ.Value $/SF %Change1/2015 -5.7% 374$ 5.9%2/2015 -6.8% 375$ 4.8%3/2015 -6.9% 375$ 4.7%4/2015 -6.7% 377$ 4.5%5/2015 -6.2% 378$ 3.8%6/2015 -5.3% 380$ 3.5%7/2015 -3.9% 384$ 3.3%8/2015 -3.5% 386$ 3.7%9/2015 -4.0% 388$ 3.6%10/2015 -5.0% 391$ 4.5%11/2015 -4.7% 392$ 4.7%12/2015 -4.1% 394$ 5.1% 0.00613984
Rentalrateandyear-over-yearpercentagechangetrailingtwelvemonthsDate %Change Rent Own HistoricCosttoOwnRelativetoRent1/2015 4.9% 2,616$ 2,494$ 2,632$2/2015 5.0% 2,599$ 2,454$ 2,615$3/2015 5.1% 2,599$ 2,441$ 2,615$4/2015 5.1% 2,599$ 2,441$ 2,615$5/2015 5.4% 2,648$ 2,469$ 2,665$6/2015 5.5% 2,674$ 2,516$ 2,691$7/2015 5.6% 2,708$ 2,590$ 2,724$8/2015 5.9% 2,749$ 2,632$ 2,766$9/2015 6.1% 2,766$ 2,647$ 2,783$10/2015 6.0% 2,758$ 2,636$ 2,774$11/2015 6.0% 2,750$ 2,645$ 2,767$12/2015 6.0% 2,742$ 2,652$ 2,759$
OrangeCountyHousingMarketNews
$520,000
$540,000
$560,000
$580,000
$600,000
$620,000
$640,000
1/2015
2/2015
3/2015
4/2015
5/2015
6/2015
7/2015
8/2015
9/2015
10/2015
11/2015
12/2015
Median RentalParity HistoricValue
$374$375$375$377$378
$380$384
$386$388$391$392
$394
$360$365$370$375$380$385$390$395$400
1/2015
2/2015
3/2015
4/2015
5/2015
6/2015
7/2015
8/2015
9/2015
10/2015
11/2015
12/2015
$2,616
$2,599
$2,599
$2,599
$2,648
$2,674
$2,708
$2,749
$2,766
$2,758
$2,750
$2,742
$2,200$2,300$2,400$2,500$2,600$2,700$2,800$2,900
1/2015
2/2015
3/2015
4/2015
5/2015
6/2015
7/2015
8/2015
9/2015
10/2015
11/2015
12/2015
Rent Own HistoricCosttoOwnRelagvetoRent

23of58
January2016ShevyAkason877-409-8515
OrangeCountymedianhomepricesinceJanuary1988
OrangeCountymedianrentandmonthlycostofownershipsinceJanuary1988
$0
$100,000
$200,000
$300,000
$400,000
$500,000
$600,000
$700,000
$800,000
1/1988
1/1989
1/1990
1/1991
1/1992
1/1993
1/1994
1/1995
1/1996
1/1997
1/1998
1/1999
1/2000
1/2001
1/2002
1/2003
1/2004
1/2005
1/2006
1/2007
1/2008
1/2009
1/2010
1/2011
1/2012
1/2013
1/2014
1/2015
1/2016
1/2017
MedianResale Projecgon RentalParity HistoricValue
$0
$500
$1,000
$1,500
$2,000
$2,500
$3,000
$3,500
$4,000
$4,500
1/1988
1/1989
1/1990
1/1991
1/1992
1/1993
1/1994
1/1995
1/1996
1/1997
1/1998
1/1999
1/2000
1/2001
1/2002
1/2003
1/2004
1/2005
1/2006
1/2007
1/2008
1/2009
1/2010
1/2011
1/2012
1/2013
1/2014
1/2015
MedianRent CosttoOwn HistoricCosttoOwnRelagvetoRent

24of58
January2016ShevyAkason877-409-8515
Resale$/SFYear-over-YearPercentageChange:OrangeCountysinceJanuary1989
Rental$/SFYear-over-YearPercentageChange:OrangeCountysinceJanuary1989
-8%
-6%
-4%
-2%
0%
2%
4%
6%
8%
10%
12%
14%
1/1989
1/1990
1/1991
1/1992
1/1993
1/1994
1/1995
1/1996
1/1997
1/1998
1/1999
1/2000
1/2001
1/2002
1/2003
1/2004
1/2005
1/2006
1/2007
1/2008
1/2009
1/2010
1/2011
1/2012
1/2013
1/2014
1/2015
Normalandsustainable
Rentalratesinexcessof7%arenotsustainable.Longperiodsofexcessiveappreciagonleadtoacrash.
Falling/Correcgng
Weak
-20%
-15%
-10%
-5%
0%
5%
10%
15%
20%
25%
30%
35%
40%
1/1989
1/1990
1/1991
1/1992
1/1993
1/1994
1/1995
1/1996
1/1997
1/1998
1/1999
1/2000
1/2001
1/2002
1/2003
1/2004
1/2005
1/2006
1/2007
1/2008
1/2009
1/2010
1/2011
1/2012
1/2013
1/2014
1/2015
Normalandsustainable
Appreciagonratesinexcessof7%arenotsustainable.Longperiodsofexcessiveappreciagonleadtoacrash.
Falling/Correcgng

25of58
January2016ShevyAkason877-409-8515
HistoricMedianHomePriceRelativetoRentalParity:OrangeCountysinceJanuary1988
OCHNMarketTimingSystemRating:OrangeCountysinceJanuary1988
-35.0%-28.0%-21.0%-14.0%-7.0%0.0%7.0%14.0%21.0%28.0%35.0%42.0%49.0%56.0%63.0%70.0%77.0%84.0%91.0%
1/1988
1/1989
1/1990
1/1991
1/1992
1/1993
1/1994
1/1995
1/1996
1/1997
1/1998
1/1999
1/2000
1/2001
1/2002
1/2003
1/2004
1/2005
1/2006
1/2007
1/2008
1/2009
1/2010
1/2011
1/2012
1/2013
1/2014
1/2015
Discou
ntorP
remium
ValueRelagvetoRentalParity HistoricNorm
Stableperiodbetweenhousingbubblesfrom1993-1999establisheshistoricnorm.
0
1
2
3
4
5
6
7
8
9
10
1/1988
1/1989
1/1990
1/1991
1/1992
1/1993
1/1994
1/1995
1/1996
1/1997
1/1998
1/1999
1/2000
1/2001
1/2002
1/2003
1/2004
1/2005
1/2006
1/2007
1/2008
1/2009
1/2010
1/2011
1/2012
1/2013
1/2014
1/2015
Values7-10:UndervaluedMarket:StrongBuyRecommendagon
Values4-6:NeutralMarket,WeakBuyRecommendagon
Values1-3:InflatedorWeakMarket:ConsiderSelling.DonotBuy.

26of58
January2016ShevyAkason877-409-8515
CashInvestorCapitalizationRate:OrangeCountysinceJanuary1988
FinancedInvestorCash-on-CashReturn:OrangeCountysinceJanuary1988
0.0%
2.0%
4.0%
6.0%
8.0%
10.0%
12.0%
1/1988
1/1989
1/1990
1/1991
1/1992
1/1993
1/1994
1/1995
1/1996
1/1997
1/1998
1/1999
1/2000
1/2001
1/2002
1/2003
1/2004
1/2005
1/2006
1/2007
1/2008
1/2009
1/2010
1/2011
1/2012
1/2013
1/2014
1/2015
CapitalizagonRate MortgageInterestRate
-25.0%
-20.0%
-15.0%
-10.0%
-5.0%
0.0%
5.0%
10.0%
15.0%
1/1988
1/1989
1/1990
1/1991
1/1992
1/1993
1/1994
1/1995
1/1996
1/1997
1/1998
1/1999
1/2000
1/2001
1/2002
1/2003
1/2004
1/2005
1/2006
1/2007
1/2008
1/2009
1/2010
1/2011
1/2012
1/2013
1/2014
1/2015

27of58
January2016ShevyAkason877-409-8515
Median Resale% Rent% Median Costof Ownership
City Resale$ ChangeYoY Resale$/SF ChangeYoY Rent$ Ownership Prem./Disc. CapRate
AlisoViejo 506,200$ 3.0% 357$ 4.3% 2,507$ 2,269$ (238)$ 4.8%
Anaheim 470,600$ 5.5% 319$ 5.2% 2,183$ 2,093$ (90)$ 4.5%
AnaheimHills 627,700$ 5.0% 337$ 3.4% 2,583$ 2,796$ 213$ 4.0%
Brea 625,300$ 4.9% 340$ 7.8% 2,561$ 2,803$ 242$ 3.9%
BuenaPark 475,900$ 6.8% 333$ 3.8% 2,303$ 2,128$ (175)$ 4.6%
CoronaDelMar 1,528,300$ 14.2% 1,106$ 0.5% 4,071$ 6,615$ 2,543$ 2.6%
CostaMesa 686,700$ 8.6% 458$ 5.9% 2,802$ 3,051$ 249$ 3.9%
CotoDeCaza 1,019,200$ 3.6% 343$ 3.8% 3,584$ 4,523$ 939$ 3.4%
Cypress 543,600$ 8.2% 352$ 1.0% 2,533$ 2,430$ (103)$ 4.5%
DanaPoint 801,100$ 9.1% 545$ 6.5% 2,584$ 3,553$ 969$ 3.1%
FountainValley 668,300$ 6.5% 362$ 4.1% 2,794$ 2,985$ 191$ 4.0%
Fullerton 524,400$ 5.4% 342$ 6.5% 2,519$ 2,311$ (209)$ 4.6%
GardenGrove 490,200$ 5.4% 336$ 4.3% 2,006$ 2,176$ 170$ 3.9%
HuntingtonBeach 678,500$ 6.2% 439$ 4.8% 2,718$ 3,019$ 301$ 3.8%
Irvine 712,800$ 3.7% 433$ 3.3% 3,006$ 3,201$ 196$ 4.0%
LaHabra 471,800$ 7.5% 324$ 5.5% 1,801$ 2,068$ 268$ 3.7%
LaPalma 615,200$ 2.5% 311$ 0.5% 2,628$ 2,751$ 122$ 4.1%
LaderaRanch 630,500$ 3.2% 329$ 2.7% 2,907$ 2,828$ (79)$ 4.4%
LagunaBeach 1,671,100$ 4.8% 1,051$ 6.0% 3,571$ 7,305$ 3,734$ 2.1%
LagunaHills 600,500$ 2.9% 344$ 5.0% 2,539$ 2,585$ 46$ 4.1%
LagunaNiguel 719,300$ 2.9% 388$ 4.2% 2,757$ 3,211$ 453$ 3.7%
LagunaWoods 228,900$ 4.5% 230$ 9.0% 1,731$ 1,023$ (708)$ 7.3%
LakeForest 575,100$ 5.2% 342$ 1.4% 2,490$ 2,560$ 70$ 4.2%
MissionViejo 620,000$ 5.3% 352$ 3.0% 2,693$ 2,761$ 68$ 4.2%
NewportBeach 1,513,600$ 6.2% 789$ 9.7% 3,522$ 6,715$ 3,193$ 2.2%
NewportCoast 2,923,400$ 0.6% 761$ 3.4% 4,456$ 12,835$ 8,379$ 1.5%
NorthTustin 867,800$ 5.2% 362$ 5.5% 1,539$ 4,341$ 2,803$ 1.7%
Orange 581,700$ 6.5% 352$ 9.3% 2,588$ 2,609$ 22$ 4.3%
Placentia 579,800$ 5.5% 316$ 8.9% 2,397$ 2,548$ 151$ 4.0%
RanchoSantaMargarita 563,700$ 5.1% 343$ 7.4% 2,453$ 2,518$ 66$ 4.2%
SanClemente 837,300$ 7.1% 433$ 9.8% 2,622$ 3,701$ 1,079$ 3.0%
SanJuanCapistrano 719,600$ 3.7% 351$ 1.6% 2,756$ 3,183$ 427$ 3.7%
SantaAna 416,600$ 8.6% 325$ 5.9% 1,999$ 1,862$ (137)$ 4.6%
Tustin 560,200$ 6.3% 375$ 6.5% 2,456$ 2,506$ 51$ 4.2%
Westminster 556,500$ 7.8% 372$ -3.4% 2,482$ 2,491$ 9$ 4.3%
YorbaLinda 726,200$ 4.0% 352$ 1.1% 3,069$ 3,230$ 161$ 4.1%
MarketPerformanceandTrends:OrangeCountyandMajorCitiesandZips

28of58
January2016ShevyAkason877-409-8515
Median Resale% Rent% Median Costof Ownership
City Resale$ ChangeYoY Resale$/SF ChangeYoY Rent$ Ownership Prem./Disc. CapRate
Anaheim92801 426,200$ 5.2% 320$ 4.8% 2,033$ 1,909$ (123)$ 4.6%
Anaheim92802 457,500$ 4.1% 316$ 3.7% 2,081$ 2,051$ (30)$ 4.4%
Anaheim92804 482,800$ 9.6% 318$ 8.1% 2,032$ 2,146$ 115$ 4.0%
Anaheim92805 450,600$ 8.0% 331$ 2.4% 2,238$ 1,991$ (246)$ 4.8%
Anaheim92806 525,200$ 6.2% 302$ 5.0% 2,357$ 2,318$ (39)$ 4.3%
Anaheim92807 514,000$ 5.4% 331$ 5.8% 1,693$ 2,279$ 587$ 3.2%
Fullerton92831 558,000$ 7.1% 346$ 4.1% 2,481$ 2,442$ (39)$ 4.3%
Fullerton92832 436,100$ 7.4% 352$ 7.6% 2,287$ 1,960$ (327)$ 5.0%
Fullerton92833 515,000$ 4.4% 342$ 5.7% 2,450$ 2,257$ (193)$ 4.6%
Fullerton92835 606,000$ 5.0% 335$ 5.2% 3,103$ 2,728$ (375)$ 4.9%
GardenGrove92840 453,200$ 2.7% 321$ 3.2% 1,852$ 2,009$ 157$ 3.9%
GardenGrove92841 520,600$ 8.6% 341$ 11.6% 2,231$ 2,309$ 78$ 4.1%
HuntingtonBeach92646 574,200$ 4.6% 404$ 3.3% 2,841$ 2,535$ (307)$ 4.8%
HuntingtonBeach92647 640,000$ 5.3% 412$ 2.4% 2,650$ 2,857$ 207$ 4.0%
HuntingtonBeach92648 812,400$ 6.8% 462$ 6.1% 3,252$ 3,618$ 366$ 3.8%
HuntingtonBeach92649 709,000$ 6.7% 479$ 4.7% 2,465$ 3,143$ 679$ 3.3%
NewportBeach92660 1,552,200$ 6.6% 678$ 3.9% 3,611$ 6,899$ 3,288$ 2.2%
NewportBeach92663 1,348,500$ 5.2% 808$ 11.8% 3,574$ 5,943$ 2,368$ 2.5%
Orange92867 551,400$ 4.5% 343$ 8.1% 2,249$ 2,527$ 279$ 3.9%
Orange92869 579,800$ 5.5% 316$ 8.9% 2,397$ 2,548$ 151$ 4.0%
MarketPerformanceandTrends:OrangeCountyandMajorCitiesandZips

29of58
January2016ShevyAkason877-409-8515
%Over/Under Historic %Over/UnderCity Rating Median RentalParity RentalParity Premium HistoricPrem.
AlisoViejo 8 506,200$ 559,300$ -9.6% -4.7% -4.9%Anaheim 8 470,600$ 487,100$ -3.5% 4.5% -8.0%AnaheimHills 9 627,700$ 576,300$ 7.5% 22.2% -14.7%Brea 7 625,300$ 571,300$ 9.5% 14.9% -5.4%BuenaPark 8 475,900$ 513,700$ -8.0% -1.5% -6.5%CoronaDelMar 7 1,528,300$ 908,300$ 59.6% 82.6% -23.0%CostaMesa 7 686,700$ 625,100$ 8.3% 13.8% -5.5%CotoDeCaza 10 1,019,200$ 799,600$ 27.3% 54.3% -27.0%Cypress 7 543,600$ 565,100$ -3.0% 17.6% -20.6%DanaPoint 7 801,100$ 576,400$ 34.1% 26.8% 7.3%FountainValley 9 668,300$ 623,400$ 9.0% 21.0% -12.0%Fullerton 8 524,400$ 562,100$ -8.2% -4.4% -3.8%GardenGrove 8 490,200$ 447,400$ 8.9% 5.3% 3.6%HuntingtonBeach 8 678,500$ 606,400$ 10.7% 15.8% -5.1%Irvine 8 712,800$ 670,500$ 6.7% 13.2% -6.5%LaHabra 6 471,800$ 401,700$ 15.5% 5.5% 10.0%LaPalma 7 615,200$ 586,400$ 5.6% 21.4% -15.8%LaderaRanch 9 630,500$ 648,600$ -4.7% 5.5% -10.2%LagunaBeach 3 1,671,100$ 796,700$ 107.3% 59.5% 47.8%LagunaHills 10 600,500$ 566,400$ 1.1% 27.8% -26.7%LagunaNiguel 8 719,300$ 615,100$ 14.0% 18.7% -4.7%LagunaWoods 10 228,900$ 386,000$ -40.9% -10.4% -30.5%LakeForest 6 575,100$ 555,500$ 2.1% 8.8% -6.7%MissionViejo 9 620,000$ 600,800$ 2.6% 11.6% -9.1%NewportBeach 6 1,513,600$ 785,800$ 88.3% 75.3% 13.0%NewportCoast 1 2,923,400$ 994,000$ 181.3% 105.3% 76.0%NorthTustin 1 867,800$ 343,300$ 151.1% 46.4% 104.7%Orange 6 581,700$ 577,300$ -0.2% -9.6% 9.4%Placentia 7 579,800$ 534,800$ 3.4% -1.3% 4.7%RanchoSantaMargarita 7 563,700$ 547,200$ 0.0% 2.2% -2.1%SanClemente 5 837,300$ 585,000$ 40.6% 28.9% 11.7%SanJuanCapistrano 6 719,600$ 614,700$ 14.8% 22.7% -7.8%SantaAna 7 416,600$ 445,900$ -8.2% -1.4% -6.8%Tustin 8 560,200$ 547,800$ 2.2% 6.3% -4.0%Westminster 3 556,500$ 553,700$ 4.1% 5.8% -1.7%YorbaLinda 8 726,200$ 684,800$ 4.9% 23.6% -18.7%
MarketTimingRatingandValuations:OrangeCountyandMajorCitiesandZips

30of58
January2016ShevyAkason877-409-8515
%Over/Under Historic %Over/UnderCity Rating Median RentalParity RentalParity Premium HistoricPrem.
Anaheim92801 7 426,200$ 453,400$ -5.6% -16.5% 11.0%Anaheim92802 9 457,500$ 464,200$ -2.4% 5.7% -8.1%Anaheim92804 5 482,800$ 453,200$ 2.8% -10.0% 12.8%Anaheim92805 6 450,600$ 455,700$ -1.5% -12.7% 11.2%Anaheim92806 8 525,200$ 525,900$ -1.5% 0.4% -1.9%Anaheim92807 3 514,000$ 377,600$ 34.6% -10.9% 45.6%Fullerton92831 7 558,000$ 544,700$ 4.1% -1.9% 6.0%Fullerton92832 6 436,100$ 510,200$ -15.0% -12.7% -2.3%Fullerton92833 9 515,000$ 546,600$ -8.3% 2.3% -10.6%Fullerton92835 10 606,000$ 692,300$ -9.8% 47.3% -57.1%GardenGrove92840 8 453,200$ 413,100$ 8.0% 9.6% -1.6%GardenGrove92841 7 520,600$ 497,700$ 3.6% 18.2% -14.6%HuntingtonBeach92646 10 574,200$ 633,900$ -10.8% 10.2% -21.0%HuntingtonBeach92647 8 640,000$ 591,200$ 7.8% 13.1% -5.3%HuntingtonBeach92648 10 812,400$ 725,500$ 13.4% 56.1% -42.7%HuntingtonBeach92649 8 709,000$ 549,800$ 27.9% 21.8% 6.1%NewportBeach92660 8 1,552,200$ 805,600$ 90.6% 83.2% 7.4%NewportBeach92663 3 1,348,500$ 797,300$ 68.6% 36.5% 32.1%Orange92867 6 551,400$ 501,700$ 9.3% 0.6% 8.7%Orange92869 7 579,800$ 534,800$ 3.4% -1.3% 4.7%
MarketTimingRatingandValuations:OrangeCountyandMajorCitiesandZips

31of58
January2016ShevyAkason877-409-8515
Historically,propertiesinthismarketsellata18.5%discount.Today'sdiscountis23.5%.Thismarketis4.9%undervalued.Medianhomepriceis$306,900witharentalparityvalueof$397,300.Thismarket'sdiscountis$90,400.Monthlypaymentaffordabilityhasbeenimprovingoverthelast3month(s).Momentumsuggestsimprovingaffordability.Resalepricesona$/SFbasisincreasedfrom$172/SFto$173/SF.Resalepriceshavebeenrisingfor2month(s).Overthelast12months,resalepricesrose4.9%indicatingalongertermupwardpricetrend.Medianrentalratesdeclined$4lastmonthfrom$1,785to$1,781.Thecurrentcapitalizationrate(rent/price)is5.6%.Rentshavebeenrisingfor12month(s).Pricemomentumsignalsrisingrentsoverthenextthreemonths.Marketrating=8
MedianHomePriceandRentalParitytrailingtwelvemonthsDate Rating Median RentalParity HistoricValue1/2015 7 289,600$ 389,100$ 316,987$2/2015 8 290,500$ 389,100$ 316,987$3/2015 8 292,300$ 386,200$ 314,625$4/2015 8 294,800$ 392,900$ 320,083$5/2015 8 298,100$ 388,600$ 316,580$6/2015 8 301,000$ 385,700$ 314,217$7/2015 8 305,100$ 388,000$ 316,091$8/2015 8 306,300$ 398,400$ 324,563$9/2015 8 306,500$ 401,800$ 327,333$10/2015 8 306,100$ 406,200$ 330,918$11/2015 8 307,400$ 399,300$ 325,297$12/2015 8 306,900$ 397,300$ 323,667$
Resale$/SFandyear-over-yearpercentagechangetrailingtwelvemonthsDate ±Typ.Value $/SF %Change1/2015 -5.6% 165$ 7.4%2/2015 -6.5% 164$ 5.4%3/2015 -6.5% 166$ 4.7%4/2015 -6.3% 168$ 4.2%5/2015 -5.7% 169$ 3.9%6/2015 -4.9% 170$ 3.6%7/2015 -3.7% 171$ 3.6%8/2015 -3.6% 172$ 3.4%9/2015 -4.2% 172$ 3.9%10/2015 -5.3% 172$ 4.3%11/2015 -5.3% 172$ 4.7%12/2015 -4.9% 173$ 4.9% -0.1853326
Rentalrateandyear-over-yearpercentagechangetrailingtwelvemonthsDate %Change Rent Own HistoricCosttoOwnRelativetoRent1/2015 2.2% 1,692$ 1,287$ 1,378$2/2015 2.2% 1,692$ 1,270$ 1,378$3/2015 2.4% 1,692$ 1,267$ 1,378$4/2015 2.4% 1,700$ 1,273$ 1,385$5/2015 2.7% 1,717$ 1,291$ 1,399$6/2015 2.9% 1,733$ 1,315$ 1,412$7/2015 3.4% 1,758$ 1,351$ 1,432$8/2015 3.7% 1,775$ 1,366$ 1,446$9/2015 4.0% 1,786$ 1,370$ 1,455$10/2015 4.2% 1,786$ 1,357$ 1,455$11/2015 4.6% 1,786$ 1,361$ 1,455$12/2015 5.0% 1,781$ 1,365$ 1,451$
RiversideCountyHousingMarketNews
$-
$100,000
$200,000
$300,000
$400,000
$500,000
1/2015
2/2015
3/2015
4/2015
5/2015
6/2015
7/2015
8/2015
9/2015
10/2015
11/2015
12/2015
Median RentalParity HistoricValue
$165$164$166$168
$169$170$171$172$172$172$172
$173
$150
$155
$160
$165
$170
$175
1/2015
2/2015
3/2015
4/2015
5/2015
6/2015
7/2015
8/2015
9/2015
10/2015
11/2015
12/2015
$1,692
$1,692
$1,692
$1,700
$1,717
$1,733
$1,758
$1,775
$1,786
$1,786
$1,786
$1,781
$1,000
$1,200
$1,400
$1,600
$1,800
$2,000
1/2015
2/2015
3/2015
4/2015
5/2015
6/2015
7/2015
8/2015
9/2015
10/2015
11/2015
12/2015
Rent Own HistoricCosttoOwnRelagvetoRent

32of58
January2016ShevyAkason877-409-8515
RiversideCountymedianhomepricesinceJanuary1988
RiversideCountymedianrentandmonthlycostofownershipsinceJanuary1988
$0
$50,000
$100,000
$150,000
$200,000
$250,000
$300,000
$350,000
$400,000
$450,000
1/1988
1/1989
1/1990
1/1991
1/1992
1/1993
1/1994
1/1995
1/1996
1/1997
1/1998
1/1999
1/2000
1/2001
1/2002
1/2003
1/2004
1/2005
1/2006
1/2007
1/2008
1/2009
1/2010
1/2011
1/2012
1/2013
1/2014
1/2015
1/2016
1/2017
MedianResale RentalParity HistoricValue Projecgon
$0
$500
$1,000
$1,500
$2,000
$2,500
$3,000
1/1989
1/1990
1/1991
1/1992
1/1993
1/1994
1/1995
1/1996
1/1997
1/1998
1/1999
1/2000
1/2001
1/2002
1/2003
1/2004
1/2005
1/2006
1/2007
1/2008
1/2009
1/2010
1/2011
1/2012
1/2013
1/2014
1/2015
1/2016
1/2017
MedianRent CosttoOwn HistoricCosttoOwnRelagvetoRent

33of58
January2016ShevyAkason877-409-8515
Resale$/SFYear-over-YearPercentageChange:RiversideCountysinceJanuary1989
Rental$/SFYear-over-YearPercentageChange:RiversideCountysinceJanuary1989
-8%
-6%
-4%
-2%
0%
2%
4%
6%
8%
10%
12%
14%
16%
18%
1/1989
1/1990
1/1991
1/1992
1/1993
1/1994
1/1995
1/1996
1/1997
1/1998
1/1999
1/2000
1/2001
1/2002
1/2003
1/2004
1/2005
1/2006
1/2007
1/2008
1/2009
1/2010
1/2011
1/2012
1/2013
1/2014
1/2015
1/2016
1/2017
Normalandsustainable
Rentalratesinexcessof7%arenotsustainable.Longperiodsofexcessiveappreciagonleadtoacrash.
Falling/Correcgng
Weak
-50%-45%-40%-35%-30%-25%-20%-15%-10%-5%0%5%
10%15%20%25%30%35%40%45%50%
1/1989
1/1990
1/1991
1/1992
1/1993
1/1994
1/1995
1/1996
1/1997
1/1998
1/1999
1/2000
1/2001
1/2002
1/2003
1/2004
1/2005
1/2006
1/2007
1/2008
1/2009
1/2010
1/2011
1/2012
1/2013
1/2014
1/2015
1/2016
1/2017
Normalandsustainable
Appreciagonratesinexcessof7%arenotsustainable.Longperiodsofexcessiveappreciagonleadtoacrash.
Falling/Correcgng

34of58
January2016ShevyAkason877-409-8515
HistoricMedianHomePriceRelativetoRentalParity:RiversideCountysinceJanuary1988
OCHNMarketTimingSystemRating:RiversideCountysinceJanuary1988
-63.0%-56.0%-49.0%-42.0%-35.0%-28.0%-21.0%-14.0%-7.0%0.0%7.0%14.0%21.0%28.0%35.0%42.0%49.0%56.0%63.0%70.0%77.0%84.0%91.0%98.0%
105.0%112.0%
1/1989
1/1990
1/1991
1/1992
1/1993
1/1994
1/1995
1/1996
1/1997
1/1998
1/1999
1/2000
1/2001
1/2002
1/2003
1/2004
1/2005
1/2006
1/2007
1/2008
1/2009
1/2010
1/2011
1/2012
1/2013
1/2014
1/2015
1/2016
1/2017
Discou
ntorP
remium
ValueRelagvetoRentalParity HistoricNorm
Stableperiodbetweenhousingbubblesfrom1993-1999establisheshistoricnorm.
0
1
2
3
4
5
6
7
8
9
10
1/1988
1/1989
1/1990
1/1991
1/1992
1/1993
1/1994
1/1995
1/1996
1/1997
1/1998
1/1999
1/2000
1/2001
1/2002
1/2003
1/2004
1/2005
1/2006
1/2007
1/2008
1/2009
1/2010
1/2011
1/2012
1/2013
1/2014
1/2015
1/2016
1/2017
Values7-10:UndervaluedMarket:StrongBuyRecommendagon
Values4-6:NeutralMarket,WeakBuyRecommendagon
Values1-3:InflatedorWeakMarket:ConsiderSelling.DonotBuy.

35of58
January2016ShevyAkason877-409-8515
CashInvestorCapitalizationRate:RiversideCountysinceJanuary1988
FinancedInvestorCash-on-CashReturn:RiversideCountysinceJanuary1988
0.0%
2.0%
4.0%
6.0%
8.0%
10.0%
12.0%
1/1988
1/1989
1/1990
1/1991
1/1992
1/1993
1/1994
1/1995
1/1996
1/1997
1/1998
1/1999
1/2000
1/2001
1/2002
1/2003
1/2004
1/2005
1/2006
1/2007
1/2008
1/2009
1/2010
1/2011
1/2012
1/2013
1/2014
1/2015
1/2016
1/2017
CapitalizagonRate MortgageInterestRate
-25.0%
-20.0%
-15.0%
-10.0%
-5.0%
0.0%
5.0%
10.0%
15.0%
20.0%
25.0%
30.0%
1/1988
1/1989
1/1990
1/1991
1/1992
1/1993
1/1994
1/1995
1/1996
1/1997
1/1998
1/1999
1/2000
1/2001
1/2002
1/2003
1/2004
1/2005
1/2006
1/2007
1/2008
1/2009
1/2010
1/2011
1/2012
1/2013
1/2014
1/2015
1/2016
1/2017
36of58
January2016ShevyAkason877-409-8515
Median Resale% Rent% Median Costof Ownership
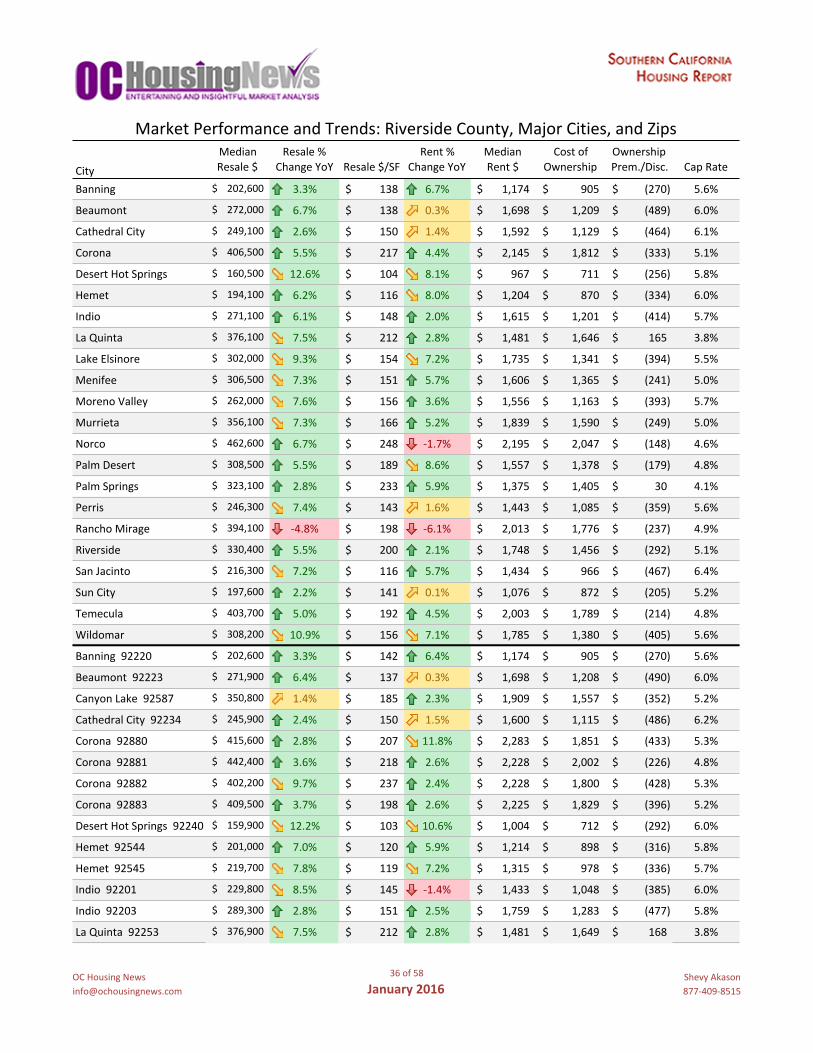
City Resale$ ChangeYoY Resale$/SF ChangeYoY Rent$ Ownership Prem./Disc. CapRate
Banning 202,600$ 3.3% 138$ 6.7% 1,174$ 905$ (270)$ 5.6%
Beaumont 272,000$ 6.7% 138$ 0.3% 1,698$ 1,209$ (489)$ 6.0%
CathedralCity 249,100$ 2.6% 150$ 1.4% 1,592$ 1,129$ (464)$ 6.1%
Corona 406,500$ 5.5% 217$ 4.4% 2,145$ 1,812$ (333)$ 5.1%
DesertHotSprings 160,500$ 12.6% 104$ 8.1% 967$ 711$ (256)$ 5.8%
Hemet 194,100$ 6.2% 116$ 8.0% 1,204$ 870$ (334)$ 6.0%
Indio 271,100$ 6.1% 148$ 2.0% 1,615$ 1,201$ (414)$ 5.7%
LaQuinta 376,100$ 7.5% 212$ 2.8% 1,481$ 1,646$ 165$ 3.8%
LakeElsinore 302,000$ 9.3% 154$ 7.2% 1,735$ 1,341$ (394)$ 5.5%
Menifee 306,500$ 7.3% 151$ 5.7% 1,606$ 1,365$ (241)$ 5.0%
MorenoValley 262,000$ 7.6% 156$ 3.6% 1,556$ 1,163$ (393)$ 5.7%
Murrieta 356,100$ 7.3% 166$ 5.2% 1,839$ 1,590$ (249)$ 5.0%
Norco 462,600$ 6.7% 248$ -1.7% 2,195$ 2,047$ (148)$ 4.6%
PalmDesert 308,500$ 5.5% 189$ 8.6% 1,557$ 1,378$ (179)$ 4.8%
PalmSprings 323,100$ 2.8% 233$ 5.9% 1,375$ 1,405$ 30$ 4.1%
Perris 246,300$ 7.4% 143$ 1.6% 1,443$ 1,085$ (359)$ 5.6%
RanchoMirage 394,100$ -4.8% 198$ -6.1% 2,013$ 1,776$ (237)$ 4.9%
Riverside 330,400$ 5.5% 200$ 2.1% 1,748$ 1,456$ (292)$ 5.1%
SanJacinto 216,300$ 7.2% 116$ 5.7% 1,434$ 966$ (467)$ 6.4%
SunCity 197,600$ 2.2% 141$ 0.1% 1,076$ 872$ (205)$ 5.2%
Temecula 403,700$ 5.0% 192$ 4.5% 2,003$ 1,789$ (214)$ 4.8%
Wildomar 308,200$ 10.9% 156$ 7.1% 1,785$ 1,380$ (405)$ 5.6%
Banning92220 202,600$ 3.3% 142$ 6.4% 1,174$ 905$ (270)$ 5.6%
Beaumont92223 271,900$ 6.4% 137$ 0.3% 1,698$ 1,208$ (490)$ 6.0%
CanyonLake92587 350,800$ 1.4% 185$ 2.3% 1,909$ 1,557$ (352)$ 5.2%
CathedralCity92234 245,900$ 2.4% 150$ 1.5% 1,600$ 1,115$ (486)$ 6.2%
Corona92880 415,600$ 2.8% 207$ 11.8% 2,283$ 1,851$ (433)$ 5.3%
Corona92881 442,400$ 3.6% 218$ 2.6% 2,228$ 2,002$ (226)$ 4.8%
Corona92882 402,200$ 9.7% 237$ 2.4% 2,228$ 1,800$ (428)$ 5.3%
Corona92883 409,500$ 3.7% 198$ 2.6% 2,225$ 1,829$ (396)$ 5.2%
DesertHotSprings92240 159,900$ 12.2% 103$ 10.6% 1,004$ 712$ (292)$ 6.0%
Hemet92544 201,000$ 7.0% 120$ 5.9% 1,214$ 898$ (316)$ 5.8%
Hemet92545 219,700$ 7.8% 119$ 7.2% 1,315$ 978$ (336)$ 5.7%
Indio92201 229,800$ 8.5% 145$ -1.4% 1,433$ 1,048$ (385)$ 6.0%
Indio92203 289,300$ 2.8% 151$ 2.5% 1,759$ 1,283$ (477)$ 5.8%
LaQuinta92253 376,900$ 7.5% 212$ 2.8% 1,481$ 1,649$ 168$ 3.8%
MarketPerformanceandTrends:RiversideCounty,MajorCities,andZips

37of58
January2016ShevyAkason877-409-8515
Median Resale% Rent% Median Costof Ownership
City Resale$ ChangeYoY Resale$/SF ChangeYoY Rent$ Ownership Prem./Disc. CapRate
LakeElsinore92530 279,600$ 8.2% 161$ 8.5% 1,393$ 1,233$ (159)$ 4.8%
Menifee92584 317,600$ 7.0% 151$ 2.9% 1,757$ 1,416$ (341)$ 5.3%
MorenoValley92551 250,800$ 7.2% 151$ 10.0% 1,388$ 1,115$ (273)$ 5.3%
MorenoValley92553 239,500$ 8.9% 167$ 5.7% 1,416$ 1,059$ (357)$ 5.7%
MorenoValley92555 301,800$ 2.3% 135$ 2.8% 1,700$ 1,336$ (364)$ 5.4%
MorenoValley92557 276,200$ 11.5% 165$ 0.6% 1,532$ 1,226$ (306)$ 5.3%
Murrieta92562 358,700$ 7.0% 179$ 4.5% 1,892$ 1,606$ (285)$ 5.1%
Murrieta92563 353,200$ 7.9% 155$ 6.3% 1,790$ 1,564$ (226)$ 4.9%
Norco92860 462,600$ 6.7% 248$ -1.7% 2,195$ 2,047$ (148)$ 4.6%
PalmDesert92211 307,400$ 4.5% 182$ 2.5% 1,659$ 1,381$ (279)$ 5.2%
PalmDesert92260 307,700$ 6.9% 198$ 16.4% 1,475$ 1,382$ (92)$ 4.6%
PalmSprings92262 330,500$ 1.8% 242$ 12.0% 1,618$ 1,444$ (173)$ 4.7%
PalmSprings92264 315,900$ 3.4% 222$ -2.2% 1,434$ 1,404$ (29)$ 4.4%
Perris92571 247,700$ 3.7% 142$ 2.5% 1,456$ 1,090$ (366)$ 5.6%
RanchoMirage92270 394,100$ -4.9% 198$ -6.0% 2,013$ 1,776$ (237)$ 4.9%
Riverside92503 330,900$ 5.8% 203$ 1.1% 1,731$ 1,448$ (283)$ 5.0%
Riverside92504 297,400$ 8.8% 205$ 8.6% 1,559$ 1,319$ (240)$ 5.0%
Riverside92506 361,800$ 7.2% 219$ 8.1% 1,629$ 1,620$ (8)$ 4.3%
Riverside92507 280,700$ 5.1% 195$ 3.6% 1,375$ 1,233$ (142)$ 4.7%
Riverside92508 414,800$ 3.6% 176$ -3.7% 1,973$ 1,838$ (135)$ 4.6%
SanJacinto92583 201,200$ 9.1% 122$ 5.7% 1,302$ 905$ (397)$ 6.2%
SunCity92586 183,200$ 1.1% 139$ 5.2% 1,085$ 814$ (270)$ 5.7%
Temecula92592 403,600$ 5.5% 193$ 3.9% 1,993$ 1,789$ (204)$ 4.7%
Wildomar92595 309,300$ 11.2% 156$ 6.5% 1,740$ 1,384$ (356)$ 5.4%
MarketPerformanceandTrends:RiversideCounty,MajorCities,andZips

38of58
January2016ShevyAkason877-409-8515
%Over/Under Historic %Over/UnderCity Rating Median RentalParity RentalParity Premium HistoricPrem.
Banning 9 202,600$ 397,300$ -24.1% -14.6% -9.5%Beaumont 6 272,000$ 378,800$ -28.7% -31.6% 2.9%CathedralCity 7 249,100$ 355,200$ -27.7% -18.0% -9.7%Corona 8 406,500$ 478,400$ -15.7% -19.4% 3.7%DesertHotSprings 6 160,500$ 215,600$ -25.1% -26.9% 1.8%Hemet 7 194,100$ 268,500$ -27.5% -20.2% -7.3%Indio 8 271,100$ 360,300$ -24.6% -31.2% 6.6%LaQuinta 6 376,100$ 330,300$ 10.5% -3.5% 14.1%LakeElsinore 6 302,000$ 387,000$ -23.7% -27.4% 3.7%Menifee 8 306,500$ 358,200$ -15.1% -7.0% -8.1%MorenoValley 7 262,000$ 347,200$ -25.2% -18.4% -6.8%Murrieta 8 356,100$ 410,200$ -14.0% -3.9% -10.1%Norco 5 462,600$ 489,700$ -5.1% -7.6% 2.5%PalmDesert 10 308,500$ 347,400$ -11.0% 14.9% -25.9%PalmSprings 7 323,100$ 306,700$ 2.6% -11.1% 13.7%Perris 5 246,300$ 322,000$ -25.2% -26.8% 1.6%RanchoMirage 6 394,100$ 449,000$ -11.8% 21.3% -33.1%Riverside 8 330,400$ 390,000$ -16.5% -20.4% 3.9%SanJacinto 8 216,300$ 319,900$ -31.8% -23.5% -8.2%SunCity 7 197,600$ 240,100$ -17.2% -4.0% -13.2%Temecula 8 403,700$ 446,800$ -12.3% -9.2% -3.1%Wildomar 8 308,200$ 398,100$ -23.0% -5.5% -17.5%
Banning92220 9 202,600$ 262,000$ -24.1% -13.9% -10.2%Beaumont92223 6 271,900$ 378,800$ -28.7% -33.6% 4.9%CanyonLake92587 9 350,800$ 425,900$ -18.7% 5.9% -24.5%CathedralCity92234 7 245,900$ 357,000$ -29.1% -20.1% -9.1%Corona92880 7 415,600$ 509,400$ -18.5% -19.9% 1.4%Corona92881 8 442,400$ 497,000$ -10.3% -10.2% -0.1%Corona92882 7 402,200$ 496,900$ -17.3% -10.2% -7.1%Corona92883 8 409,500$ 496,400$ -17.8% -22.0% 4.2%DesertHotSprings92240 7 159,900$ 224,000$ -30.5% -19.1% -11.3%Hemet92544 10 201,000$ 270,800$ -24.5% -1.9% -22.7%Hemet92545 6 219,700$ 293,300$ -25.6% -20.5% -5.1%Indio92201 4 229,800$ 319,600$ -27.2% -30.5% 3.3%Indio92203 10 289,300$ 392,500$ -27.1% -4.1% -23.0%LaQuinta92253 5 376,900$ 330,300$ 10.7% -8.2% 18.9%
MarketTimingRatingandValuations:RiversideCounty,MajorCities,andZips

39of58
January2016ShevyAkason877-409-8515
%Over/Under Historic %Over/Under
City Rating Median RentalParity RentalParity Premium HistoricPrem.
LakeElsinore92530 6 279,600$ 310,600$ -15.9% -18.2% 2.3%Menifee92584 8 317,600$ 391,900$ -18.9% -10.1% -8.8%MorenoValley92551 6 250,800$ 309,500$ -20.6% -14.6% -6.0%MorenoValley92553 7 239,500$ 315,800$ -25.9% -22.3% -3.6%MorenoValley92555 9 301,800$ 379,200$ -20.6% -5.7% -14.9%MorenoValley92557 6 276,200$ 341,800$ -19.8% -11.0% -8.8%Murrieta92562 9 358,700$ 422,000$ -15.1% 0.3% -15.3%Murrieta92563 7 353,200$ 399,200$ -13.3% -6.3% -7.1%Norco92860 5 462,600$ 489,700$ -5.1% -7.6% 2.5%PalmDesert92211 10 307,400$ 370,200$ -16.4% 22.5% -38.9%PalmDesert92260 8 307,700$ 328,900$ -4.4% 9.8% -14.3%PalmSprings92262 4 330,500$ 360,800$ -8.7% -17.9% 9.2%PalmSprings92264 4 315,900$ 319,800$ -4.2% -1.7% -2.4%Perris92571 8 247,700$ 324,800$ -25.5% -29.5% 4.0%RanchoMirage92270 4 394,100$ 449,000$ -11.8% 8.0% -19.8%Riverside92503 6 330,900$ 386,000$ -17.3% -23.0% 5.7%Riverside92504 5 297,400$ 347,700$ -14.5% -24.5% 10.0%Riverside92506 6 361,800$ 363,300$ -2.1% 0.0% -2.2%Riverside92507 8 280,700$ 306,700$ -11.2% -18.5% 7.3%Riverside92508 3 414,800$ 440,100$ -6.3% -16.9% 10.5%SanJacinto92583 8 201,200$ 290,500$ -31.1% -17.7% -13.5%SunCity92586 8 183,200$ 242,000$ -23.3% -4.1% -19.1%Temecula92592 8 403,600$ 444,700$ -10.5% -10.4% -0.1%Wildomar92595 9 309,300$ 388,200$ -21.6% -5.5% -16.1%
MarketTimingRatingandValuations:RiversideCounty,MajorCities,andZips

40of58
January2016ShevyAkason877-409-8515
Historically,propertiesinthismarketsellata25.7%discount.Today'sdiscountis32.2%.Thismarketis6.6%undervalued.Medianhomepriceis$280,200witharentalparityvalueof$406,600.Thismarket'sdiscountis$126,400.Monthlypaymentaffordabilityhasbeenworseningoverthelast1month(s).Momentumsuggestsunchangingaffordability.Resalepricesona$/SFbasisincreasedfrom$184/SFto$184/SF.Resalepriceshavebeenrisingfor1month(s).Overthelast12months,resalepricesrose7.0%indicatingalongertermupwardpricetrend.Medianrentalratesdeclined$23lastmonthfrom$1,845to$1,822.Thecurrentcapitalizationrate(rent/price)is6.2%.Rentshavebeenrisingfor12month(s).Pricemomentumsignalsrisingrentsoverthenextthreemonths.Marketrating=8
MedianHomePriceandRentalParitytrailingtwelvemonthsDate Rating Median RentalParity HistoricValue1/2015 9 258,700$ 400,900$ 297,987$2/2015 9 258,200$ 402,800$ 299,399$3/2015 9 261,100$ 400,100$ 297,392$4/2015 9 263,500$ 407,700$ 303,041$5/2015 9 267,300$ 407,200$ 302,670$6/2015 9 268,800$ 406,900$ 302,447$7/2015 8 274,600$ 407,100$ 302,595$8/2015 7 278,000$ 417,600$ 310,400$9/2015 8 278,800$ 418,700$ 311,218$10/2015 7 281,000$ 422,300$ 313,893$11/2015 8 280,100$ 412,800$ 306,832$12/2015 8 280,200$ 406,600$ 302,224$
Resale$/SFandyear-over-yearpercentagechangetrailingtwelvemonthsDate ±Typ.Value $/SF %Change1/2015 -8.7% 171$ 5.8%2/2015 -9.5% 171$ 4.5%3/2015 -9.7% 172$ 4.6%4/2015 -9.7% 173$ 4.4%5/2015 -9.2% 174$ 3.9%6/2015 -8.9% 176$ 3.8%7/2015 -7.9% 179$ 6.3%8/2015 -7.6% 181$ 7.0%9/2015 -7.5% 183$ 6.9%10/2015 -7.8% 184$ 7.1%11/2015 -7.3% 184$ 6.6%12/2015 -6.6% 184$ 7.0% -0.2567051
Rentalrateandyear-over-yearpercentagechangetrailingtwelvemonthsDate %Change Rent Own HistoricCosttoOwnRelativetoRent1/2015 4.5% 1,743$ 1,148$ 1,296$2/2015 4.7% 1,752$ 1,134$ 1,302$3/2015 4.7% 1,752$ 1,130$ 1,303$4/2015 4.8% 1,764$ 1,135$ 1,311$5/2015 5.1% 1,799$ 1,155$ 1,337$6/2015 5.0% 1,828$ 1,176$ 1,359$7/2015 5.0% 1,845$ 1,211$ 1,371$8/2015 4.8% 1,861$ 1,230$ 1,383$9/2015 4.8% 1,861$ 1,241$ 1,383$10/2015 4.5% 1,857$ 1,238$ 1,380$11/2015 4.1% 1,846$ 1,242$ 1,372$12/2015 4.0% 1,823$ 1,248$ 1,355$
SanBernardinoCountyHousingMarketNews
$-
$100,000
$200,000
$300,000
$400,000
$500,000
1/2015
2/2015
3/2015
4/2015
5/2015
6/2015
7/2015
8/2015
9/2015
10/2015
11/2015
12/2015
Median RentalParity HistoricValue
$171$171$172$173$174
$176$179
$181$183$184$184$184
$160
$165
$170
$175
$180
$185
$190
1/2015
2/2015
3/2015
4/2015
5/2015
6/2015
7/2015
8/2015
9/2015
10/2015
11/2015
12/2015
$1,743
$1,752
$1,752
$1,764
$1,799
$1,828
$1,845
$1,861
$1,861
$1,857
$1,846
$1,823
$800
$1,000
$1,200
$1,400
$1,600
$1,800
$2,000
1/2015
2/2015
3/2015
4/2015
5/2015
6/2015
7/2015
8/2015
9/2015
10/2015
11/2015
12/2015
Rent Own HistoricCosttoOwnRelagvetoRent

41of58
January2016ShevyAkason877-409-8515
SanBernardinoCountymedianhomepricesinceJanuary1988
SanBernardinoCountymedianrentandmonthlycostofownershipsinceJanuary1988
$0
$50,000
$100,000
$150,000
$200,000
$250,000
$300,000
$350,000
$400,000
$450,000
1/1988
1/1989
1/1990
1/1991
1/1992
1/1993
1/1994
1/1995
1/1996
1/1997
1/1998
1/1999
1/2000
1/2001
1/2002
1/2003
1/2004
1/2005
1/2006
1/2007
1/2008
1/2009
1/2010
1/2011
1/2012
1/2013
1/2014
1/2015
1/2016
1/2017
MedianResale RentalParity HistoricValue Projecgon
$0
$500
$1,000
$1,500
$2,000
$2,500
Date
12/1988
12/1989
12/1990
12/1991
12/1992
12/1993
12/1994
12/1995
12/1996
12/1997
12/1998
12/1999
12/2000
12/2001
12/2002
12/2003
12/2004
12/2005
12/2006
12/2007
12/2008
12/2009
12/2010
12/2011
12/2012
12/2013
12/2014
12/2015
12/2016
MedianRent CosttoOwn HistoricCosttoOwnRelagvetoRent

42of58
January2016ShevyAkason877-409-8515
Resale$/SFYear-over-YearPercentageChange:SanBernardinoCountysinceJanuary1989
Rental$/SFYear-over-YearPercentageChange:SanBernardinoCountysinceJanuary1989
-8%
-6%
-4%
-2%
0%
2%
4%
6%
8%
10%
12%
14%
16%
18%
1/1989
1/1990
1/1991
1/1992
1/1993
1/1994
1/1995
1/1996
1/1997
1/1998
1/1999
1/2000
1/2001
1/2002
1/2003
1/2004
1/2005
1/2006
1/2007
1/2008
1/2009
1/2010
1/2011
1/2012
1/2013
1/2014
1/2015
Normalandsustainable
Rentalratesinexcessof7%arenotsustainable.Longperiodsofexcessiveappreciagonleadtoacrash.
Falling/Correcgng
Weak
-50%-45%-40%-35%-30%-25%-20%-15%-10%-5%0%5%
10%15%20%25%30%35%40%45%50%
1/1989
1/1990
1/1991
1/1992
1/1993
1/1994
1/1995
1/1996
1/1997
1/1998
1/1999
1/2000
1/2001
1/2002
1/2003
1/2004
1/2005
1/2006
1/2007
1/2008
1/2009
1/2010
1/2011
1/2012
1/2013
1/2014
1/2015
Normalandsustainable
Appreciagonratesinexcessof7%arenotsustainable.Longperiodsofexcessiveappreciagonleadtoacrash.
Falling/Correcgng

43of58
January2016ShevyAkason877-409-8515
HistoricMedianHomePriceRelativetoRentalParity:SanBernardinoCountysinceJanuary1988
OCHNMarketTimingSystemRating:SanBernardinoCountysinceJanuary1988
-70.0%-63.0%-56.0%-49.0%-42.0%-35.0%-28.0%-21.0%-14.0%-7.0%0.0%7.0%14.0%21.0%28.0%35.0%42.0%49.0%56.0%63.0%70.0%77.0%84.0%
1/1989
1/1990
1/1991
1/1992
1/1993
1/1994
1/1995
1/1996
1/1997
1/1998
1/1999
1/2000
1/2001
1/2002
1/2003
1/2004
1/2005
1/2006
1/2007
1/2008
1/2009
1/2010
1/2011
1/2012
1/2013
1/2014
1/2015
1/2016
1/2017
Discou
ntorP
remium
ValueRelagvetoRentalParity HistoricNorm
Stableperiodbetweenhousingbubblesfrom1993-1999establisheshistoricnorm.
0
1
2
3
4
5
6
7
8
9
10
1/1988
1/1989
1/1990
1/1991
1/1992
1/1993
1/1994
1/1995
1/1996
1/1997
1/1998
1/1999
1/2000
1/2001
1/2002
1/2003
1/2004
1/2005
1/2006
1/2007
1/2008
1/2009
1/2010
1/2011
1/2012
1/2013
1/2014
1/2015
1/2016
Values7-10:UndervaluedMarket:StrongBuyRecommendagon
Values4-6:NeutralMarket,WeakBuyRecommendagon
Values1-3:InflatedorWeakMarket:ConsiderSelling.DonotBuy.

44of58
January2016ShevyAkason877-409-8515
CashInvestorCapitalizationRate:SanBernardinoCountysinceJanuary1988
FinancedInvestorCash-on-CashReturn:SanBernardinoCountysinceJanuary1988
0.0%
2.0%
4.0%
6.0%
8.0%
10.0%
12.0%
14.0%
1/1988
1/1989
1/1990
1/1991
1/1992
1/1993
1/1994
1/1995
1/1996
1/1997
1/1998
1/1999
1/2000
1/2001
1/2002
1/2003
1/2004
1/2005
1/2006
1/2007
1/2008
1/2009
1/2010
1/2011
1/2012
1/2013
1/2014
1/2015
1/2016
1/2017
CapitalizagonRate MortgageInterestRate
-30.0%
-20.0%
-10.0%
0.0%
10.0%
20.0%
30.0%
40.0%
50.0%
1/1988
1/1989
1/1990
1/1991
1/1992
1/1993
1/1994
1/1995
1/1996
1/1997
1/1998
1/1999
1/2000
1/2001
1/2002
1/2003
1/2004
1/2005
1/2006
1/2007
1/2008
1/2009
1/2010
1/2011
1/2012
1/2013
1/2014
1/2015
1/2016
1/2017

45of58
January2016ShevyAkason877-409-8515
Median Resale% Rent% Median Costof Ownership
City Resale$ ChangeYoY Resale$/SF ChangeYoY Rent$ Ownership Prem./Disc. CapRate
Adelanto 155,800$ 6.7% 98$ 11.7% 1,056$ 695$ (361)$ 6.5%
AppleValley 193,200$ 1.7% 110$ 3.5% 968$ 860$ (107)$ 4.8%
Chino 417,100$ 5.6% 238$ 5.3% 2,106$ 1,832$ (274)$ 4.8%
ChinoHills 533,000$ 6.0% 308$ -0.2% 2,289$ 2,397$ 108$ 4.1%
Colton 222,600$ 8.6% 173$ 3.2% 1,242$ 981$ (261)$ 5.4%
Fontana 331,600$ 6.9% 195$ 0.6% 2,041$ 1,477$ (564)$ 5.9%
Hesperia 214,300$ 4.6% 116$ 3.4% 1,240$ 953$ (287)$ 5.6%
Highland 274,900$ 12.7% 167$ -0.4% 1,670$ 1,196$ (475)$ 5.8%
JoshuaTree 121,300$ 6.9% 95$ -5.9% 824$ 531$ (294)$ 6.5%
LomaLinda 332,500$ 0.0% 153$ -0.1% 1,620$ 1,479$ (141)$ 4.7%
Montclair 345,800$ 8.1% 244$ 0.1% 1,656$ 1,535$ (121)$ 4.6%
Ontario 341,500$ 10.0% 245$ 0.6% 1,803$ 1,509$ (293)$ 5.1%
RanchoCucamonga 420,700$ 5.0% 248$ 0.8% 2,108$ 1,864$ (245)$ 4.8%
Redlands 330,800$ 8.3% 210$ 4.9% 1,711$ 1,482$ (229)$ 5.0%
Rialto 280,800$ 8.2% 180$ 5.7% 1,536$ 1,245$ (291)$ 5.3%
SanBernardino(City) 214,100$ 10.2% 159$ 2.1% 1,366$ 943$ (423)$ 6.1%
TwentyninePalms 71,200$ -7.4% 68$ -13.3% 828$ 319$ (509)$ 11.2%
Upland 466,600$ 4.6% 262$ 10.2% 2,040$ 2,119$ 78$ 4.2%
Victorville 195,100$ 7.1% 106$ 3.7% 1,274$ 873$ (402)$ 6.3%
Yucaipa 310,000$ 7.2% 177$ 8.8% 1,337$ 1,371$ 34$ 4.1%
MarketPerformanceandTrends:SanBernardinoCounty,MajorCities,andZips

46of58
January2016ShevyAkason877-409-8515
Median Resale% Rent% Median Costof Ownership
City Resale$ ChangeYoY Resale$/SF ChangeYoY Rent$ Ownership Prem./Disc. CapRate
Chino91710 420,400$ 6.0% 246$ 6.7% 2,047$ 1,843$ (205)$ 4.7%
Fontana92336 388,300$ 5.4% 190$ 0.8% 2,172$ 1,723$ (449)$ 5.4%
Fontana92337 316,800$ 2.9% 195$ -2.0% 1,740$ 1,416$ (324)$ 5.3%
GrandTerrace92313 286,200$ 11.7% 187$ 6.4% 1,520$ 1,284$ (235)$ 5.1%
Hesperia92344 225,900$ 1.7% 106$ 4.1% 1,290$ 1,014$ (276)$ 5.5%
Mentone92359 321,200$ 6.6% 156$ 1.0% 1,195$ 1,409$ 214$ 3.6%
Ontario91762 340,600$ 10.3% 244$ -3.8% 1,471$ 1,501$ 30$ 4.1%
RanchoCucamonga91701 437,800$ 5.0% 252$ 1.3% 2,036$ 1,957$ (79)$ 4.5%
RanchoCucamonga91730 353,800$ 7.2% 247$ 2.5% 1,890$ 1,585$ (306)$ 5.1%
RanchoCucamonga91737 467,500$ -0.6% 252$ 3.1% 2,116$ 2,094$ (21)$ 4.3%
RanchoCucamonga91739 570,100$ 4.2% 246$ -2.6% 2,626$ 2,510$ (116)$ 4.4%
Redlands92373 384,600$ 12.5% 235$ 2.1% 1,929$ 1,743$ (187)$ 4.8%
Rialto92376 263,300$ 7.7% 177$ 3.7% 1,478$ 1,174$ (304)$ 5.4%
Rialto92377 336,100$ 10.2% 190$ 14.2% 1,822$ 1,479$ (343)$ 5.2%
SanBernardino(City)92405 200,100$ 13.6% 159$ 10.9% 1,221$ 890$ (331)$ 5.9%
SanBernardino(City)92410 161,900$ 5.0% 149$ 6.4% 1,010$ 707$ (302)$ 6.0%
Upland91784 579,900$ 4.7% 258$ 7.4% 2,344$ 2,602$ 257$ 3.9%
Upland91786 390,500$ 5.6% 267$ 10.4% 1,824$ 1,766$ (58)$ 4.5%
Victorville92392 199,200$ 9.0% 105$ 4.5% 1,246$ 893$ (354)$ 6.0%
Victorville92394 187,300$ 2.0% 101$ 1.6% 1,268$ 840$ (428)$ 6.5%
Victorville92395 191,000$ 9.4% 113$ 4.0% 1,205$ 846$ (359)$ 6.1%
MarketPerformanceandTrends:SanBernardinoCounty,MajorCities,andZips

47of58
January2016ShevyAkason877-409-8515
%Over/Under Historic %Over/UnderCity Rating Median RentalParity RentalParity Premium HistoricPrem.
Adelanto 10 155,800$ 235,600$ -33.6% -3.8% -29.8%AppleValley 8 193,200$ 215,900$ -11.0% 9.7% -20.7%Chino 8 417,100$ 469,700$ -13.3% -9.0% -4.3%ChinoHills 5 533,000$ 510,600$ 4.5% 6.6% -2.1%Colton 8 222,600$ 277,000$ -21.2% -10.7% -10.5%Fontana 6 331,600$ 455,300$ -28.0% -33.7% 5.7%Hesperia 8 214,300$ 276,700$ -24.0% -21.2% -2.8%Highland 6 274,900$ 372,600$ -28.6% -11.9% -16.7%JoshuaTree 5 121,300$ 183,900$ -35.4% -20.0% -15.4%LomaLinda 8 332,500$ 361,400$ -8.7% 34.8% -43.5%Montclair 5 345,800$ 369,500$ -5.6% -6.0% 0.4%Ontario 6 341,500$ 402,100$ -15.5% -3.9% -11.6%RanchoCucamonga 6 420,700$ 470,300$ -12.1% -7.6% -4.4%Redlands 8 330,800$ 381,700$ -12.0% -0.2% -11.8%Rialto 7 280,800$ 342,700$ -19.8% -22.8% 3.0%SanBernardino(City) 7 214,100$ 304,700$ -28.8% -28.5% -0.3%TwentyninePalms 4 71,200$ 184,700$ -60.6% -28.7% -31.9%Upland 7 466,600$ 455,200$ 2.7% 6.9% -4.1%Victorville 10 195,100$ 284,200$ -30.8% -6.4% -24.4%Yucaipa 5 310,000$ 298,200$ 0.2% -9.2% 9.4%
MarketTimingRatingandValuations:SanBernardinoCounty,MajorCities,andZips

48of58
January2016ShevyAkason877-409-8515
%Over/Under Historic %Over/Under
City Rating Median RentalParity RentalParity Premium HistoricPrem.
Chino91710 8 420,400$ 456,700$ -10.9% -7.4% -3.4%Fontana92336 5 388,300$ 484,600$ -20.6% -33.2% 12.6%Fontana92337 5 316,800$ 388,200$ -18.8% -20.6% 1.8%GrandTerrace92313 8 286,200$ 339,000$ -17.0% -7.2% -9.8%Hesperia92344 7 225,900$ 287,700$ -21.5% -13.1% -8.4%Mentone92359 7 321,200$ 266,600$ 15.6% 28.1% -12.4%Ontario91762 3 340,600$ 328,200$ 2.0% 8.6% -6.7%RanchoCucamonga91701 6 437,800$ 454,200$ -2.7% 3.1% -5.8%RanchoCucamonga91730 7 353,800$ 421,700$ -17.3% -14.6% -2.7%RanchoCucamonga91737 9 467,500$ 472,000$ -0.7% 23.9% -24.6%RanchoCucamonga91739 3 570,100$ 585,800$ -4.4% -17.3% 12.9%Redlands92373 10 384,600$ 430,400$ -5.2% 20.5% -25.7%Rialto92376 7 263,300$ 329,800$ -21.9% -22.1% 0.3%Rialto92377 7 336,100$ 406,400$ -19.0% -8.2% -10.8%SanBernardino(City)92405 6 200,100$ 272,300$ -26.2% -18.6% -7.7%SanBernardino(City)92410 10 161,900$ 225,200$ -28.5% -1.5% -27.0%Upland91784 7 579,900$ 523,000$ 8.7% 10.9% -2.2%Upland91786 8 390,500$ 406,900$ -3.4% 8.5% -11.9%Victorville92392 10 199,200$ 278,000$ -28.8% 3.8% -32.6%Victorville92394 8 187,300$ 282,900$ -32.9% -14.4% -18.5%Victorville92395 9 191,000$ 268,700$ -30.0% -9.8% -20.2%
MarketTimingRatingandValuations:SanBernardinoCounty,MajorCities,andZips

49of58
January2016ShevyAkason877-409-8515
Historically,propertiesinthismarketsellata15.8%premium.Today'sdiscountis12.2%.Thismarketis28.0%undervalued.Medianhomepriceis$518,300witharentalparityvalueof$583,000.Thismarket'sdiscountis$64,700.Monthlypaymentaffordabilityhasbeenimprovingoverthelast9month(s).Momentumsuggestsimprovingaffordability.Resalepricesona$/SFbasisincreasedfrom$320/SFto$322/SF.Resalepriceshavebeenrisingfor1month(s).Overthelast12months,resalepricesrose8.9%indicatingalongertermupwardpricetrend.Medianrentalratesdeclined$32lastmonthfrom$2,645to$2,613.Thecurrentcapitalizationrate(rent/price)is4.8%.Rentshavebeenrisingfor12month(s).Pricemomentumsignalsrisingrentsoverthenextthreemonths.Marketrating=10
MedianHomePriceandRentalParitytrailingtwelvemonthsDate Rating Median RentalParity HistoricValue1/2015 10 501,900$ 558,500$ 646,955$2/2015 10 506,100$ 557,900$ 646,260$3/2015 10 507,900$ 557,600$ 645,913$4/2015 10 513,800$ 572,200$ 662,825$5/2015 10 515,900$ 577,200$ 668,617$6/2015 10 522,600$ 588,800$ 682,054$7/2015 10 523,400$ 583,900$ 676,378$8/2015 10 523,400$ 597,600$ 692,248$9/2015 10 523,100$ 591,500$ 685,182$10/2015 10 521,900$ 601,800$ 697,113$11/2015 10 519,400$ 591,600$ 685,297$12/2015 10 518,300$ 583,000$ 675,335$
Resale$/SFandyear-over-yearpercentagechangetrailingtwelvemonthsDate ±Typ.Value $/SF %Change1/2015 -26.0% 296$ 2.3%2/2015 -25.8% 297$ 2.3%3/2015 -25.3% 302$ 3.8%4/2015 -25.3% 307$ 4.9%5/2015 -25.8% 312$ 6.0%6/2015 -26.5% 317$ 6.9%7/2015 -26.6% 319$ 6.5%8/2015 -27.2% 320$ 6.7%9/2015 -27.3% 321$ 7.0%10/2015 -28.3% 321$ 7.1%11/2015 -28.2% 320$ 7.3%12/2015 -28.0% 322$ 8.9% 1/0/00
Rentalrateandyear-over-yearpercentagechangetrailingtwelvemonthsDate %Change Rent Own HistoricCosttoOwnRelativetoRent1/2015 8.2% 2,428$ 2,215$ 2,813$2/2015 6.9% 2,426$ 2,199$ 2,810$3/2015 7.0% 2,443$ 2,202$ 2,829$4/2015 6.8% 2,476$ 2,216$ 2,868$5/2015 6.8% 2,550$ 2,242$ 2,954$6/2015 7.1% 2,646$ 2,283$ 3,065$7/2015 7.3% 2,646$ 2,333$ 3,065$8/2015 6.8% 2,663$ 2,350$ 3,084$9/2015 4.9% 2,629$ 2,343$ 3,045$10/2015 4.7% 2,646$ 2,317$ 3,064$11/2015 4.0% 2,646$ 2,314$ 3,064$12/2015 3.8% 2,613$ 2,313$ 3,027$
VenturaCountyHousingMarketNews
$-
$200,000
$400,000
$600,000
$800,000
1/2015
2/2015
3/2015
4/2015
5/2015
6/2015
7/2015
8/2015
9/2015
10/2015
11/2015
12/2015
Median RentalParity HistoricValue
$296$297
$302
$307
$312
$317$319$320$321$321$320$322
$290
$295
$300
$305
$310
$315
$320
$325
1/2015
2/2015
3/2015
4/2015
5/2015
6/2015
7/2015
8/2015
9/2015
10/2015
11/2015
12/2015
$2,428
$2,426
$2,443
$2,476
$2,550
$2,646
$2,646
$2,663
$2,629
$2,646
$2,646
$2,613
$1,400
$1,900
$2,400
$2,900
$3,400
1/2015
2/2015
3/2015
4/2015
5/2015
6/2015
7/2015
8/2015
9/2015
10/2015
11/2015
12/2015
Rent Own HistoricCosttoOwnRelagvetoRent

50of58
January2016ShevyAkason877-409-8515
VenturaCountymedianhomepricesinceJanuary1988
VenturaCountymedianrentandmonthlycostofownershipsinceJanuary1988
$0
$100,000
$200,000
$300,000
$400,000
$500,000
$600,000
$700,000
$800,000
1/1988
1/1989
1/1990
1/1991
1/1992
1/1993
1/1994
1/1995
1/1996
1/1997
1/1998
1/1999
1/2000
1/2001
1/2002
1/2003
1/2004
1/2005
1/2006
1/2007
1/2008
1/2009
1/2010
1/2011
1/2012
1/2013
1/2014
1/2015
1/2016
1/2017
MedianResale RentalParity HistoricValue Projecgon
$0
$500
$1,000
$1,500
$2,000
$2,500
$3,000
$3,500
$4,000
1/1988
1/1989
1/1990
1/1991
1/1992
1/1993
1/1994
1/1995
1/1996
1/1997
1/1998
1/1999
1/2000
1/2001
1/2002
1/2003
1/2004
1/2005
1/2006
1/2007
1/2008
1/2009
1/2010
1/2011
1/2012
1/2013
1/2014
1/2015
1/2016
1/2017
MedianRent CosttoOwn HistoricCosttoOwnRelagvetoRent

51of58
January2016ShevyAkason877-409-8515
Resale$/SFYear-over-YearPercentageChange:VenturaCountysinceJanuary1989
Rental$/SFYear-over-YearPercentageChange:VenturaCountysinceJanuary1989
-8%
-6%
-4%
-2%
0%
2%
4%
6%
8%
10%
12%
14%
16%
18%
1/1989
1/1990
1/1991
1/1992
1/1993
1/1994
1/1995
1/1996
1/1997
1/1998
1/1999
1/2000
1/2001
1/2002
1/2003
1/2004
1/2005
1/2006
1/2007
1/2008
1/2009
1/2010
1/2011
1/2012
1/2013
1/2014
1/2015
Normalandsustainable
Rentalratesinexcessof7%arenotsustainable.Longperiodsofexcessiveappreciagonleadtoacrash.
Falling/Correcgng
Weak
-50%-45%-40%-35%-30%-25%-20%-15%-10%-5%0%5%
10%15%20%25%30%35%40%45%50%
1/1989
1/1990
1/1991
1/1992
1/1993
1/1994
1/1995
1/1996
1/1997
1/1998
1/1999
1/2000
1/2001
1/2002
1/2003
1/2004
1/2005
1/2006
1/2007
1/2008
1/2009
1/2010
1/2011
1/2012
1/2013
1/2014
1/2015
Normalandsustainable
Appreciagonratesinexcessof7%arenotsustainable.Longperiodsofexcessiveappreciagonleadtoacrash.
Falling/Correcgng

52of58
January2016ShevyAkason877-409-8515
HistoricMedianHomePriceRelativetoRentalParity:VenturaCountysinceJanuary1988
OCHNMarketTimingSystemRating:VenturaCountysinceJanuary1988
-42.0%-35.0%-28.0%-21.0%-14.0%-7.0%0.0%7.0%14.0%21.0%28.0%35.0%42.0%49.0%56.0%63.0%70.0%77.0%84.0%91.0%98.0%
105.0%112.0%119.0%126.0%
1/1988
1/1989
1/1990
1/1991
1/1992
1/1993
1/1994
1/1995
1/1996
1/1997
1/1998
1/1999
1/2000
1/2001
1/2002
1/2003
1/2004
1/2005
1/2006
1/2007
1/2008
1/2009
1/2010
1/2011
1/2012
1/2013
1/2014
1/2015
1/2016
1/2017
Discou
ntorP
remium
ValueRelagvetoRentalParity HistoricNorm
Stableperiodbetweenhousingbubblesfrom1993-1999establisheshistoricnorm.
0
1
2
3
4
5
6
7
8
9
10
1/1988
1/1989
1/1990
1/1991
1/1992
1/1993
1/1994
1/1995
1/1996
1/1997
1/1998
1/1999
1/2000
1/2001
1/2002
1/2003
1/2004
1/2005
1/2006
1/2007
1/2008
1/2009
1/2010
1/2011
1/2012
1/2013
1/2014
1/2015
1/2016
1/2017
Values7-10:UndervaluedMarket:StrongBuyRecommendagon
Values4-6:NeutralMarket,WeakBuyRecommendagon
Values1-3:InflatedorWeakMarket:ConsiderSelling.DonotBuy.

53of58
January2016ShevyAkason877-409-8515
CashInvestorCapitalizationRate:VenturaCountysinceJanuary1988
FinancedInvestorCash-on-CashReturn:VenturaCountysinceJanuary1988
0.0%
2.0%
4.0%
6.0%
8.0%
10.0%
12.0%
1/1988
1/1989
1/1990
1/1991
1/1992
1/1993
1/1994
1/1995
1/1996
1/1997
1/1998
1/1999
1/2000
1/2001
1/2002
1/2003
1/2004
1/2005
1/2006
1/2007
1/2008
1/2009
1/2010
1/2011
1/2012
1/2013
1/2014
1/2015
1/2016
1/2017
CapitalizagonRate MortgageInterestRate
-35.0%
-30.0%
-25.0%
-20.0%
-15.0%
-10.0%
-5.0%
0.0%
5.0%
10.0%
15.0%
1/1988
1/1989
1/1990
1/1991
1/1992
1/1993
1/1994
1/1995
1/1996
1/1997
1/1998
1/1999
1/2000
1/2001
1/2002
1/2003
1/2004
1/2005
1/2006
1/2007
1/2008
1/2009
1/2010
1/2011
1/2012
1/2013
1/2014
1/2015
1/2016
1/2017

54of58
January2016ShevyAkason877-409-8515
Median Resale% Rent% Median Costof Ownership
City Resale$ ChangeYoY Resale$/SF ChangeYoY Rent$ Ownership Prem./Disc. CapRate
Camarillo 530,000$ 8.5% 311$ 2.6% 2,517$ 2,363$ (154)$ 4.6%
Moorpark 607,800$ 8.7% 284$ 1.6% 2,495$ 2,688$ 193$ 3.9%
NewburyPark 635,300$ 4.5% 321$ 2.7% 2,784$ 2,837$ 52$ 4.2%
OakPark 616,100$ 4.0% 366$ 7.1% 2,529$ 2,778$ 249$ 3.9%
Oxnard 421,700$ 13.0% 299$ 18.0% 2,139$ 1,891$ (248)$ 4.9%
PortHueneme 339,300$ -3.4% 262$ 6.1% 1,531$ 1,492$ (39)$ 4.3%
SimiValley 496,900$ 10.0% 296$ 1.0% 2,358$ 2,218$ (140)$ 4.6%
ThousandOaks 621,000$ 1.8% 343$ 7.2% 2,675$ 2,772$ 97$ 4.1%
Ventura 500,300$ 11.5% 356$ 0.3% 2,003$ 2,203$ 200$ 3.8%
WestlakeVillage 780,200$ 13.8% 395$ 9.1% 2,678$ 3,524$ 847$ 3.3%
Camarillo93010 524,500$ 5.4% 310$ 7.7% 2,340$ 2,360$ 20$ 4.3%
NewburyPark91320 634,200$ 4.6% 322$ 3.1% 2,784$ 2,832$ 48$ 4.2%
Oxnard93033 367,300$ 15.7% 398$ -8.3% 1,916$ 1,599$ (318)$ 5.0%
Oxnard93035 537,800$ 12.5% 221$ 16.7% 2,237$ 2,415$ 178$ 4.0%
PortHueneme93041 329,500$ -3.5% 262$ 6.0% 1,531$ 1,456$ (75)$ 4.5%
SimiValley93063 491,700$ 10.0% 293$ 0.9% 2,621$ 2,197$ (423)$ 5.1%
SimiValley93065 500,300$ 9.2% 298$ 7.3% 2,290$ 2,241$ (49)$ 4.4%
ThousandOaks91360 592,100$ -1.8% 333$ 6.4% 2,530$ 2,640$ 110$ 4.1%
ThousandOaks91362 670,300$ 9.0% 349$ 6.1% 2,895$ 3,008$ 113$ 4.1%
Ventura93004 501,800$ 20.8% 297$ 7.3% 2,391$ 2,223$ (168)$ 4.6%
WestlakeVillage91361 781,700$ 9.9% 412$ 12.7% 2,913$ 3,469$ 556$ 3.6%
MarketPerformanceandTrends:VenturaCounty,MajorCities,andZips

55of58
January2016ShevyAkason877-409-8515
%Over/Under Historic %Over/UnderCity Rating Median RentalParity RentalParity Premium HistoricPrem.
Camarillo 10 530,000$ 561,500$ -6.2% 26.7% -32.9%Moorpark 6 607,800$ 556,500$ 4.8% 17.6% -12.9%NewburyPark 9 635,300$ 621,100$ -0.4% 14.3% -14.8%OakPark 10 616,100$ 564,300$ 6.6% 37.8% -31.2%Oxnard 9 421,700$ 477,100$ -12.8% 12.2% -24.9%PortHueneme 9 339,300$ 341,500$ -1.3% 28.7% -29.9%SimiValley 6 496,900$ 526,100$ -9.1% 3.1% -12.1%ThousandOaks 8 621,000$ 596,800$ 1.3% 26.5% -25.2%Ventura 7 500,300$ 446,800$ 12.4% 33.5% -21.1%WestlakeVillage 8 780,200$ 597,400$ 36.3% 58.7% -22.5%
Camarillo93010 10 524,500$ 522,100$ 1.4% 29.5% -28.1%NewburyPark91320 9 634,200$ 621,100$ -0.6% 14.3% -14.9%Oxnard93033 8 367,300$ 427,500$ -16.4% 27.3% -43.7%Oxnard93035 9 537,800$ 499,000$ 5.1% 34.5% -29.4%PortHueneme93041 10 329,500$ 341,500$ -3.7% 28.6% -32.3%SimiValley93063 7 491,700$ 584,600$ -16.2% 7.4% -23.6%SimiValley93065 6 500,300$ 510,900$ -2.6% 1.9% -4.4%ThousandOaks91360 8 592,100$ 564,400$ 1.3% 19.8% -18.6%ThousandOaks91362 10 670,300$ 645,800$ 1.1% 45.4% -44.3%Ventura93004 10 501,800$ 533,400$ -7.1% 32.2% -39.3%WestlakeVillage91361 10 781,700$ 649,800$ 15.0% 66.5% -51.5%
MarketTimingRatingandValuations:VenturaCounty,MajorCities,andZips

56of58
January2016ShevyAkason877-409-8515
OCHousingNewsMonthlyMarketReportOCHousingNewsmonthlymarketreportandnewslelerprovidesaclearpictureofthehealthofthehousingmarket.Bothbuyersandsellersfindtheinformagononlocagon,valuagon,andpricetrends,gmelyandrelevanttotheirdecisiontobuyorsellahome.TheOCHousingNewsreportanswersthemostimportantquesgonstobuyersandsellers:(1)WhereshouldIlookforbargains,(2)Arecurrentpricesoverorundervaluedinmyarea,and(3)whatdirecgonarepricesheaded,upordowninmyarea?Armedwithbelerinformagon,peoplemakebelerdecisions.ThereistoomuchinformagonabouthousingfloagngaroundtheInternet,andmostofitisbad.Itiseasytotakedataandcreateprelychartsandgraphsthatdon'tprovideanyusefulinformagonsomeonemightusetomakeagooddecision.TheOCHousingNewshaseliminatedtheuselessinformagonanddisglledthemarketdowntothreekeypiecesofinformagon:(1)resalevaluerelagvetorent,(2)yearlychangeinresaleprices,and(3)yearlychangesinrents.UsingtheOCHNMonthlyReportWhenmostpeopleareconsideringrengngorbuyingahome,theyalreadyhavenarrowedtheirchoicesforlocagon.Mostwanttobenearwork,buttheymayalsowanttobenearfamily,friends,orapargcularschooldistrict.ThetableofcontentsonthefrontpageoftheOCHNmonthlyreportorganizesthereportsbycountysopeoplecannarrowtheirsearchtotheareatheyaremostinterestedin.Isuggestsearchersstartwiththeoverviewofthecountyasthisprovidesimportantdataonthebroaderrealestatemarket.InterpreJnganOCHNMonthlyMarketReportThefirstpageofacountyreportbreaksdownintofourparts:Thenewsoverview,MedianHomePriceandRentalParitytrailingtwelvemonths,Resale$/SFandyear-over-yearpercentagechangetrailingtwelvemonths,Rentalrateandyear-over-yearpercentagechangetrailingtwelvemonths.NEWSOVERVIEWThenewsoverviewprovidesconcisedescripgonsofthefactsandcondigonsinthemarket.Itstateswhetherthemarkettradesatapremiumoradiscounttorentalparityandprovidesameasureofit.Amarkettradingatapremiumtorentalparityismoredesirable,sobuyersarewillingtopaymorethanrentalparitytolivethere.Amarkettradingatadiscountislessdesirable,andpeoplemustbemogvatedtolivetherebysavingversusrengng.Thenewsoverviewmeasuresthecurrentpremiumordiscount,comparesittothehistoricpremiumordiscount,andstateswhetherthemarketiscurrentlyovervaluedorundervalued.Thisisanimportantmeasureoffuturefinancialperformance.MEDIANHOMEPRICEANDRENTALPARITYTRAILINGTWELVEMONTHSForthosewhowantthebolomlinewithoutalltheanalysisanddetail,themarketragngisthefirstrowofthefirstsecgonofdata.Theragngencapsulatesallthecondigonsofthemarketintoonefigure.Sufficetosaythataragngof10isgoodandaragngof1isbad.Buyerscanrestassuredthatahighlyratedpropertyormarketisagoodfinancialbuy.Thechartdisplaysthreelinesthatrevealmuchaboutthemarket.Thefirsttwolinestonotearetheparallelgreenandorangelines,rentalparity(green)andhistoricvalue(orange).Asmengonedpreviously,somemarketstradeatadiscountandsomeatapremiumtorentalparity.Iftheorangeline(historicvalue)isabovethegreenline(rentalparity),themarketisapremiummarket.Iftheorangeline(historicvalue)isbelowthegreenline(rentalparity),themarketisadiscountmarket.Thelargerthegap,thegreaterthepremiumordiscountis.Thethirdlineploledagainstthesetwoparallellinesisthemedianresalepriceforthearea.Thislinerevealswhetherthemarketiscurrentlytradingatapremiumordiscounttorentalparityandhistoricvalue.Themoreimportantoftheserelagonshipsisbetweenmedianresalepriceandhistoricvalue.Overgme,themarkethasshownatendencytowardtradingathistoricvalue.Ifittradesaboveforawhile,overgmeitwillrevertbacktothisvalue.Thatmayhappeneitherbyanextendedperiodoflilleornoappreciagonoranoutrightdeclineinprices.Ifthemarkettradesbelowitshistoricvalue,it’slikelytoseeareboundbacktothisvalueinthefuture.Thebestmarketsarethosetradingatasteepdiscounttoitshistoricvalue.

57of58
January2016ShevyAkason877-409-8515
RESALE$/SFANDYEAR-OVER-YEARPERCENTAGECHANGETRAILINGTWELVEMONTHSSincethehistoricvalueissoimportant,thefirstcolumninnextsecgondisplaysthepremiumordiscountfromhistoricvalueoverthelastyear.Thesecondcolumnandthechartshowsthedollars-per-square-footresalepriceinthemarket.Thelineonthechartvisuallyshowsthegeneraldirecgonofprices,andthethirdcolumnshowstheactualpercentagechange.It’simportanttonotethatthepercentagechangeinresalepricescanbemisleading.Mostbuyersfoolishlyextrapolateshort-termmovementsinmarketpriceswillcongnueforever,mogvagngthemtobuyatwhatisorentheworstpossiblegme.Inreality,buyinginadecliningmarketwhenvaluagonsarelowisgenerallythebestgmetobuybecausesellersaremogvatedandsupplyisabundant.Buyinginanappreciagngmarketmaynotbewise,pargcularlyifvaluagonsignalsabubble.Inshort,valuagonismuchmoreimportantthatpricemovement. RENTALRATEANDYEAR-OVER-YEARPERCENTAGECHANGETRAILINGTWELVEMONTHSThefinaltableandchartonthepageissimilartothefirstgrouping;itdisplaysthreelines,twoofwhichareparallelandshowcurrentrentandthehistoriccostofownershiprelagvetorent,andthethirdlineisthecurrentcostofownership.Therelagonshipsaresimilar,thechartswilllooksimilar,andtheinterpretagonsarethesame.Thismethodoflookingatthedataismorerevealingtothosewholiketofocusonmonthlycostsratherthanpurchaseprice.Itrevealshowaffordablepropergesarerelagvetomonthlyrent,whichiswhatrentalparityanalysisisallabout.Thefirstcolumnofdatashowstherateofrentgrowthoverthelastyear,andthenexttwocolumnsshowthecostofrengngandthecostofowningduringthesameperiod. HISTORICMARKETDATACHARTSThenextpageofthereportshowstwocharts:CountymedianhomepricesinceJanuary1988,andCountymedianrentandmonthlycostofownershipsinceJanuary1988.Thesechartsaredesignedtoputcurrentcircumstancesinhistoriccontext.Theyanswerquesgonslike,“Howvolagleareprices?”and“Howdoestoday’spricingcomparetothefluctuagonsofthepast?”and“Howmuchdangeristhereinbuyingtoday?”ThechartabovedisplaysLACountythroughearly2014,butthepalernissimilaracrossCalifornia.Withthegreenlineforrentalparityandtheorangelineforhistoricvalue,it’seasytotellwhenthemarketisfairlyvalued,overvalued,orundervalued.HISTORICVALUATIONThenextpageinthereportshowstwocharts:HistoricMedianHomePriceRelagvetoRentalParity:CountysinceJanuary1988,andOCHNMarketTimingSystemRagng:LosAngelesCountysinceJanuary1988.Thechartonhistoricvaluagonshows,ataglance,howclosethemarkettradestoitshistoricnorm.Thebenchmarkperiodisshowningreen,andthedegreeofmarketvolaglitycanbeinferredfromthescaletotheler.Forexample,LACountytradedforasmuchas42%belowrentalparityand84%aboveitduringthe26-yearperiodshown.Needlesstosay,thatisveryvolagle,andpeoplewhoboughtduringtheovervaluedperiodsenduredpainfulpricecorrecgonswhentheirhouseswereworthfarlessthantheypaid.

58of58
January2016ShevyAkason877-409-8515
OCHNRATINGSYSTEMCHARTThemarketgmingragngsystemmechanicallyidengfiesbothgoodandbuydimestobuybasedonvaluagon,resalepricechange,andrentalratechange.Since1988,inLACounty,itwaswronginitsrecommendagoninonlyasingletwo-yearperiodfromlate1999tomid2001asthelocaleconomygppedintoarecession.Thesystemcorrectlyidengfiedthehousingbubblesfromthelate80sandthemid00saswellasthebuyingopportunigesinthemid90sandearly10s.MARKETPERFORMANCEANDTRENDSTABLEThemarketperformancetrendstableprovidesatabularsummaryofthecurrentmarketcondigonsbycityandzipwithinthecounty.Itdisplaysthesameperformancemetricsdetailedinprevioussecgonsincluding:medianresaleprice,resalepercentagechangeyear-over-year,resaledollars-per-square-foot,rentpercentagechangeyear-over-year,medianrent,monthlycostofownership,theownershippremiumordiscountbasedonrent,andthecapitalizagonrate.Forhowtointerpretthesenumbersseeprevioussecgonsformoredetail.Tousethesetableseffecgvely,usersshouldhaveashortlistofpotengalcigestheywouldconsiderlivingin.Thesetablesallowtheusertosearchalphabegcallyforcitydata.It’ssuggestedtoconsultboththecitydataandthezipcodedatathatorenprovidesmoredetail,pargcularlyinlargercigesthatmayhavesignificantneighborhoodvariability.Forexample,inCanyonCountry,thetwozipcodesdemonstratethat91387ismoredesirablethan91351becausetheformercostsmoretoownthantorentwhereasthelatercostsmoretorentthantoown.Bycompilingandcomparingdatafromthevariouscigesinauserssearcharea,theycandeterminehowmuchtheywouldhavetospendtoeitherownorrentineacharea,suggesgnghowdesirableandaffordableeachareais.Thiswillalsoallowuserstoeliminateareastheymaynotbeabletoafford.MARKETTIMINGRATINGANDVALUATIONSTABLEThenexttableshowstheragngsandvaluagonsforeachcityandzipwithinthecounty.Thisinformagonismostvaluableforthosehungngforbargainpropergesorfearfulofoverpayinginanovervaluedmarket.IntheexampleaboveArtesiaisaprimemarketforbuyingahome.Themarketusuallytradesata12.9%premiumtorentalparity,butatthegmeofthisreport,itwastradingata16.9%discount,makingit29.6%undervalued!Abuyerinthismarketshouldexperienceaboveaverageappreciagonasthemarketreboundstoitshistoricnorm.Thistablehelpsbuyersspotthosemarketswherethebestdealsaretobefound.Helpingbuyerstargettheirsearchtowheredealsarebestistheprimaryvalueofthisreport.