Obtaining PVT Data For Very Sour Retrograde Condensate … · Obtaining PVT Data For Very Sour...
16
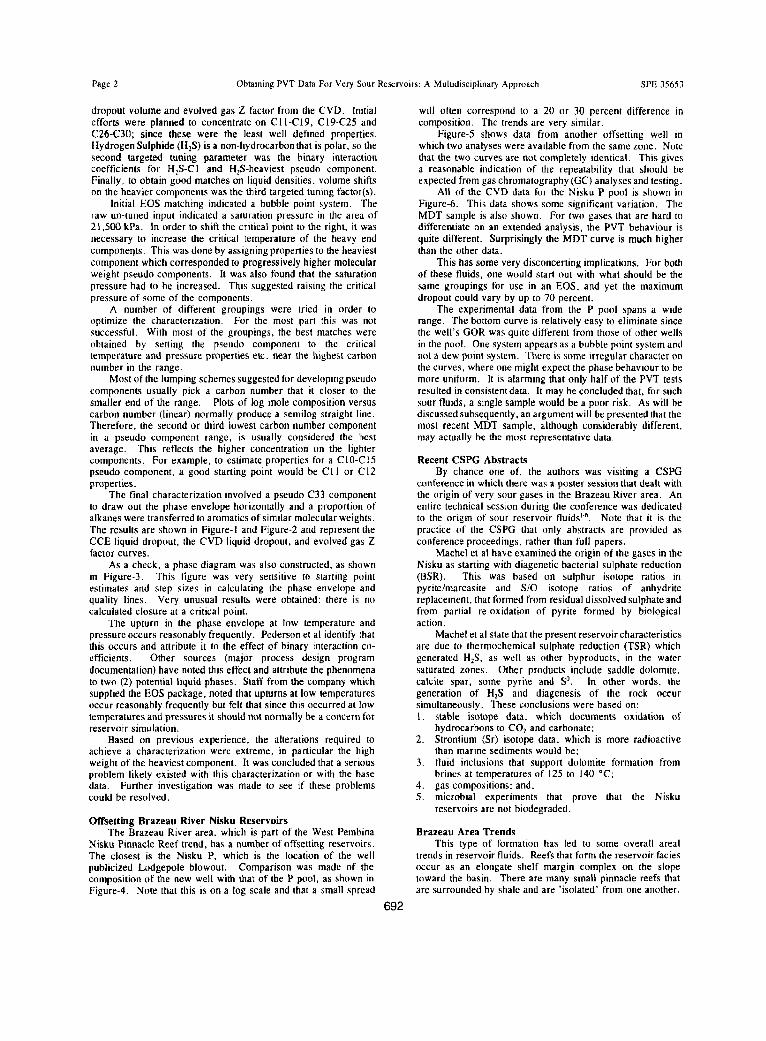
SPE 35653 Ii!!!!! - Sooiety of Petroleum Engineers Obtaining PVT Data For Very Sour Retrograde Condensate Gas and Volatile Oil Reservoirs: A Multidisciplinary Approach M.R. (Mike) Carlson, Applied Reservoir Engineering & Evaluation Ltd. W,B. (Bruce) Cawston, Anderson Exploration Ltd. Copyright 1996, SOClaly of Pcdrolaum Engineer., Inc. This paper was prepared for ~uentatlon at me Gas Technology Conference held in Calgary Alb6ti, Canada, 20 A@l -1 May19S6 lws pap, w,* 8el.cted for pre-tatim by WI SPE Program Comnittam following review of information contnined In &n ●bstract submittsd by rhe author(s). Contenb & me ~Pr as pr.senrod, hmm nor Men rovlewed by rho Scciofy of Petroleum Erratnrwws and are subJ#ct to cowectkm by th6 author(s). me materizl. as presented, does not necessarily mftact any G+the .%eiety of Petroleum Engineers, it% efllcars, or members. Papars presented at SPE meetings are subject to publication review by Editorial CM’rmlIte6s of UM SmAAV of Paf@6tIm Engineers. Pormisslon to COPY is ros!rlcted to ●n abstract ot not mom than 300 words. 111.straticms my no! b6 Co@ad. TtU ●tmtmct should CCMItAhICOn@CUO”S ● ckrwwiedgement of where ●nd by whom tf!e paper was presented. Write Iibrwian, SPE, POB S33836 Richard* on, Texas, 7S003-3836, U.S.A., fax 01-214.652.S435. Abstract Th!s paper is the result of experience gamed m developing a smrr retrograde condensate gas)volatile oil reservoir in the Brazeau River area of Alberta. Canada. h was not possible to obtain a samfactory PVT description anrf therefore reliable reservoir engineering calculations could not be made. Research m the I!terature, and offsening government PVT data, identified that [hese problems were not unique to this reservoir. Examples are gwerr Oi [hc variations in PVT pruperries from two other reservoirs. A slgndican[ effort was expended in identifying why these problems occurred, what impact they would have and what steps could be taken to correct them. Relevant issues include how high HIS fluids are generated (Geochemistry), obtaining stahihzed samples (compositional reservoir simrrla[ion), problems with ohfamirrg PVT data (physical laboratory procedures) as well as field implementation (testing program, screening samples. and checking PVT results). The implications to reservoir development are also discussed. Introduction Home (III Company Lim!ted (subsequently I subsidiary of Anderson Exploration Lul. ) made a number of discoveries m [he Brazeau River area of Alberta, which is located roughly 100 miles south west of” Edmonton Alberta. In pamcu[ar, a pool was discovered which early testing indicated contained a sour (approximately 29 mole percent HIS) retrograde condensate gas. Liquid dropout tolumes from a constant volume depletion (CVD) experiment on this fluid were very high at over 40 percent of prrre space. The retrograde condensate system with very high liquid dropouts suggested that a gas cycling scheme would likely be an economic development strategy. A major logistical problem m the Brazeau River area was obtaining sufficient gas processing capacity. Recently, a number of projects have been implemented in Alberta in which sour gas has been re- infected hack into the reservoir. Such a scheme could solve the plant capacity problem and, since sulphur prices are depressed, recovering HJS was not a priority, Most cycling schemes are now modelled with a compositional simulator. This technique typically relies on cubic Equations of State (EOS) to describe the pressure- vohime-temperature (PVT) behaviour of the in-situ wet gas and the interaction with injected gases, EOS calculations are not accurate enough to be used directly on a predictive basis, Input parameters must be “tuned” to match experimental data. Resuhs are therefore heavily dependent on the amount and accuracy of PVT laboratory data. MDT Sample The first sample obtained was derived from a bottom hole wireline tool (MDT) of 450 cc, The sample was sent out for PVT analysis. which included: a cnnstant composition expansion (CCE). with liquid volumes recorded, a constant volume depletmn (CVD) test and gas phase compositions from the CVD test. Key results are outlined below: 1, The dewpoint was measured at 27.642 kPa, at a temperature of 85 “C. 2. The maximum liquid dropout from the Crrnstant Composition Expansion was 36.65 percent at a pressure of 22,802 kPa, 3. The maximum liquid dropout during the Cnnstant Volume Depletion was 41.64 percent at a pressure of 17,326 kPa. These results were used as the basis few EOS tuning, which is described in the following. Tuning Procedure The initial plan was 10 get a characterization with a larger number of components and then simpli~ the system until the characterization degraded below acceptable levels. Initially a 10 cnmporrent model was used. A regression procedure was utilized that matched experimental and predicted data for: Ihe saturation pressure, the relative oil volume (ROV or two phase formation volume factor) frnm Lhe CCE, the liquid 691
Transcript of Obtaining PVT Data For Very Sour Retrograde Condensate … · Obtaining PVT Data For Very Sour...

SPE 35653 Ii!!!!!-Sooiety of Petroleum Engineers
Obtaining PVT Data For Very Sour Retrograde Condensate Gas
and Volatile Oil Reservoirs: A Multidisciplinary Approach
M.R. (Mike) Carlson, Applied Reservoir Engineering & Evaluation Ltd.
W,B. (Bruce) Cawston, Anderson Exploration Ltd.
Copyright 1996, SOClaly of Pcdrolaum Engineer., Inc.
This paper was prepared for ~uentatlon at me Gas Technology Conference heldin Calgary Alb6ti, Canada, 20 A@l -1 May19S6
lws pap, w,* 8el.cted for pre-tatim by WI SPEProgram Comnittam followingreview of information contnined In &n ●bstract submittsd by rhe author(s). Contenb& me ~Pr as pr.senrod, hmm nor Men rovlewed by rho Scciofy of Petroleum
Erratnrwws and are subJ#ct to cowectkm by th6 author(s). me materizl. aspresented, does not necessarily mftact any G+the .%eiety of Petroleum Engineers,it% efllcars, or members. Papars presented at SPE meetings are subject topublication review by Editorial CM’rmlIte6s of UM SmAAV of Paf@6tIm Engineers.Pormisslon to COPY is ros!rlcted to ●n abstract ot not mom than 300 words.111.straticms my no! b6 Co@ad. TtU ●tmtmct should CCMItAhICOn@CUO”S●ckrwwiedgement of where ●nd by whom tf!e paper was presented. Write Iibrwian,SPE, POB S33836 Richard* on, Texas, 7S003-3836, U.S.A., fax 01-214 .652.S435.
AbstractTh!s paper is the result of experience gamed m developing a
smrr retrograde condensate gas)volatile oil reservoir in the BrazeauRiver area of Alberta. Canada. h was not possible to obtain asamfactory PVT description anrf therefore reliable reservoirengineering calculations could not be made. Research m theI!terature, and offsening government PVT data, identified that[hese problems were not unique to this reservoir. Examples aregwerr Oi [hc variations in PVT pruperries from two otherreservoirs.
A slgndican[ effort was expended in identifying why theseproblems occurred, what impact they would have and what stepscould be taken to correct them. Relevant issues include how highHIS fluids are generated (Geochemistry), obtaining stahihzedsamples (compositional reservoir simrrla[ion), problems withohfamirrg PVT data (physical laboratory procedures) as well asfield implementation (testing program, screening samples. andchecking PVT results). The implications to reservoir developmentare also discussed.
IntroductionHome (III Company Lim!ted (subsequently I subsidiary of
Anderson Exploration Lul. ) made a number of discoveries m [heBrazeau River area of Alberta, which is located roughly 100 milessouth west of” Edmonton Alberta. In pamcu[ar, a pool wasdiscovered which early testing indicated contained a sour(approximately 29 mole percent HIS) retrograde condensate gas.Liquid dropout tolumes from a constant volume depletion (CVD)experiment on this fluid were very high at over 40 percent of prrrespace.
The retrograde condensate system with very high liquiddropouts suggested that a gas cycling scheme would likely bean economic development strategy. A major logisticalproblem m the Brazeau River area was obtaining sufficientgas processing capacity. Recently, a number of projects havebeen implemented in Alberta in which sour gas has been re-infected hack into the reservoir. Such a scheme could solvethe plant capacity problem and, since sulphur prices aredepressed, recovering HJS was not a priority,
Most cycling schemes are now modelled with acompositional simulator. This technique typically relies oncubic Equations of State (EOS) to describe the pressure-vohime-temperature (PVT) behaviour of the in-situ wet gasand the interaction with injected gases, EOS calculations arenot accurate enough to be used directly on a predictive basis,Input parameters must be “tuned” to match experimental data.Resuhs are therefore heavily dependent on the amount andaccuracy of PVT laboratory data.
MDT SampleThe first sample obtained was derived from a bottom hole
wireline tool (MDT) of 450 cc, The sample was sent out forPVT analysis. which included: a cnnstant compositionexpansion (CCE). with liquid volumes recorded, a constantvolume depletmn (CVD) test and gas phase compositionsfrom the CVD test. Key results are outlined below:1, The dewpoint was measured at 27.642 kPa, at a
temperature of 85 “C.2. The maximum liquid dropout from the Crrnstant
Composition Expansion was 36.65 percent at a pressureof 22,802 kPa,
3. The maximum liquid dropout during the CnnstantVolume Depletion was 41.64 percent at a pressure of17,326 kPa.
These results were used as the basis few EOS tuning, whichis described in the following.
Tuning ProcedureThe initial plan was 10 get a characterization with a larger
number of components and then simpli~ the system until thecharacterization degraded below acceptable levels. Initiallya 10 cnmporrent model was used. A regression procedurewas utilized that matched experimental and predicted data for:Ihe saturation pressure, the relative oil volume (ROV or twophase formation volume factor) frnm Lhe CCE, the liquid
691
Page 2 Obtammg PVT Data For Very Sour Reservoirs: A Muludisciplinary Approach SPE 35653
dropout volume and evoIved gas Z factor from the CVD. Initialefforts were planned to concentrate on C 11-Cl 9, C 19-C25 andC26-C30; since these were the least well defined propertiesHydrogen Sulphide (H2S) is a non-hydrocarbon that is polar, so thesecond targeted tuning parameter was the binary interactioncoefficients for H2S-C 1 and HIS-heaviest pseudo component.Finally, to obtain good matches on liquid densities, volume shiftson the heavier components was the third targeted tuning factor(s).
Initial EOS matching indicated a bubble point system. Theraw un-tuned input indicated a saturation pressure in the area of2 1,50Q kPa. In order to shift the critical point to the right, it wasnecessary to increase the critical temperature of the heavy endcomponents. This was dooe by assigning properties to the heaviestcomponent which corresponded to progressively higher molecularweight pseudo components. It was also found that the saturationpressure had to be increased. This suggested raising the criticalpressure of some of the components,
A number of different groupings were tried in order tooptimize the characterization, For the most part this was notsuccessful. Wi\h most of the groupings, the besl matches wereobtained by setting the pseudo component to the criticaltemperature and pressure properties etc. near the highest carbonnumber in the range.
Most of the lumping schemes suggested for developing pseudocomponents usually pick a carbon number that it closer to thesmaller end of the range. Plots of log mole composition versuscarbon number (linear) normally produce a semilog straight line.Therefore, the second or third lowest carbon number componentin a pseudo component range, is usually considered the bestaverage. This reflects the higher concentration on the lightercomponents. For example, to estimate properties for a CIO-C 15pseudo component. a good starting point would be C 11 or C 12properties.
The final characterization involved a pseudo C33 componentto draw out the phase envelope horizontally and a proportion ofalkanes were transferred to aromatics ofs imilar molecular weights.The results are shown in Figure-1 and Figure-2 and represent theCCE liquid dropout, the CVD liquid dropout, and evolved gas Zfactor curves.
As a check, a phase diagram was also constructed, as shownin Figure-3. This figure was very sensitive to starting pointestimates and step sizes in calculating the phase envelope andquality lines, Very unusual resuhs were obtained: there is nocalculated closure at a critical point,
The upturn in the phase envelope at low temperature andpressure occurs reasonably frequently. Pederson et al identi~ [hatthis occurs and attribute it to the effect of binary interaction co-efficients, Other sources (major process design programdocumentation) have noted this effect and attribute the phenomenato twrr (2) potential liquid phases. Staff from the company whichsupplied the EOS package, noted that upmrns at low temperaturesoccur reasonably frequently but felt that since this occurred at lowtemperatures and pressures it should not normally be a concern forreservoir simulation.
Based on previous experience, the alterations required 10achieve a characterization were extreme, in particular the highweight of the heaviest component. It was concluded that a seriousproblem likely existed with this characterization or with the basedata. Further investigation was made to see if these problemscould be resolved.
Offsetting Brazeau River Nisku ReservoirsThe Brazeau River area, which is part of the West Pembina
Nisku Pinnacle Reef trend, has a number of offsetting reservcrirs.Tbe closest is the Nisku P, which is the location of the wellpublicized Lodgepole blowout. Comparison was made of thecomposition of the new well with that of the P pool, as shown inFigure-4. Note that this is on a log scale and that a small spread
692
will often correspond [o a 20 or 30 percent difference incomposition. The trends are very similar,
Figure-5 shows data from another offsetting well in
which two analyses were available from the same zone, Notethat the two curves are not completely identical. This givesa reasonable indication of the repeatability that should beexpected from gas chromatography (GC) aoalyses and testing.
All of the CVD data for the Nisku P pool is shown inFigure-6. This data shows some significant variation. TheMDT sample is also shown. For two gases that arc hard todifferentiate on an extended analysis, the PVT behaviour isquite different. Surprisingly the MDT curve is much higherthan the other data.
This has some very disconcerting implications. For bothof these fluids, one would start out with what should be tbemme groupings for use in an EOS, and yet the maximumdropout could vary by up to 70 percent.
The experimental data from the P pool spans a widerange, The bottom curve is relatively easy to eliminate sincethe welI’s GOR was quite different from those of other wellsin the pool. One system appears as a bubble point system andnot a dew point system. There is some irregular character onthe curves, where one might expect the phase behaviour to bemore uniform. It is alarming that only half of the PVT testsresulted in consistent data. It may be concluded that, for suchsour fluids, a single sample would be a poor risk. As will bediscussed subsequently, an argument will be presented that themost recent MDT sample, although considerably different,may actually be the most representative data,
Recent CSPG AbstractsBy chance one of, the authors was visiting a CSPG
conference in which (here was a poster session that dealt withthe origin of very sour gases in the Brazeau River area. Anentire technical session during the conference was dedicatedto the origin of sour reservoir tluidsl’! Note that it is thepractice of the CSPG that only abstracts are provided asconference proceedings, rather than full papers.
Machel et al have examined the origin of the gases in theNisku as starting with diagenecic bacterial sulphate reduction(BSR). This was based on sulphur isotope ratios orpyrite/marcasite and S/0 isotope ratios of anhydritereplacement, that formed from residual dissolved sulphate andfrom partial re-oxidation of pyrite formed by biologicalaction.
Macbel et al state that the present reservoir characteristicsare due to thermochemical sulphate reduction (TSR) whichgenerated H#, as well as other byproducts, in tbe watersaturated zones. Other products include saddle dolomite,catcite spar, some pyrite and SO. In other words, thegeneration of H,S and diagenesis of the rock occursimultaneously. These conclusions were based on:1. stable isotope data, which documents oxidation of
hydrocarbons to COZ and carbonate:2. Strontium (Sr) isotope data, which is more radioactive
than marine sediments would be:3. tluid inclusions that support dolomite formation from
brines at temperatures of 125 to 140 “C;4, gas compositions; and,5, microbial experiments that prove that the Nisku
reservoirs are not biodegraded.
Brazeau Area TrendsThis type of formation has led to some overall areal
trends in reservoir fluids. Reefs rhat form the reservoir faciesoccur as an elongate shelf margin complex on the slopetoward the basin. There are many small pinnacle reefs thatare surrounded by shale and are ‘isolated’ from one another.

SPE 35653 MR. (Mike) Carlson and W.B, (Bruce) Cawston Page 3
This is demonstrated by widely varying virgin pressures. In theseisolated pools, HJ contenr generally increases downdip, There isalso gas on a carbonate bank edge reef development. The HIScontent varies widely on the shelf margin complex, The highestconcemrations are found up and down dip in the margin reefs.Amounts of more than 6 percent HIS and geochemical dataindicate that (TSR) must have taken place downdip from the area.
Viau et al identify that the proportion of C1] compared to C14also varies betwetm ethane and propane versus the proportion inCOZ. This data shows an isotope selectivity for the TSR reactmn.
Areas that also have TSR formed HIS include numerousfoorhills reservoirs, Caroline in parcictrlar, tbe Smackover trend inArkansas as well as the Crossfield member.
Sassen and Wade propose that in low HIS reservoirsmaturation is dominated by thermal cracking. Conversely, in highHIS reservoirs the reaction of hydrocarbons with su?phur (invarious species) results in preferential cracking of high molecularweight saturates while aromatics are relatively stable.Hydrocarbon alterations associated with TSR can therefore berecognized by low Cl$ + saturate content and low saturate/aromaticmtio. They state that hydrocarbon alteration converts crude oil togas condensate. Eventually even condensate is destroyed atshallow depths and low temperatures in comparison to thermalcracking alone.
A higher percentage of aromatics can be expected to affectheavy end characterization.
It was obvious from the various abstracts that tfrere are anumber of different processes that result in the formation of sourgases. These abstracts hinted that fisrrher investigation should bedone on geochemistry and other pools, such as Caroline.Unusually high concentration of aromatics in the heavy endsshould be expected for fluids formed fsy TSR. Thermal sulphatereduction is intimately linked with diagenesis which suggested amore complete understanding of geology would be useful. Theseareas are discussed more fully in the following.
GeochemistryTwo textbrsoks’8 on geochemistry were used as a starting
point. Large amounts of HIS are formed from the baclerialreduction of sulphates in near surface sediments. Tbe gas is sosoluble and reac[ive rhat practically all of it is converred eirher tofree sulphur, metallic sulpbides, or organic sulphur compounds insedimems, The amount of friogenic H2S that becomes a constituentof natural gas, however, is negligible compared to H2S from othersources.
Le Tran et al. demonstrated that most HIS in the subsurfaceoriginates from thermal decomposition of organic matter in finegrained rocks. Data from the Aquitaine basin (France) shows thatthe thermal cracking of sulphur structures in the dispersed organicmatter to form H2S starts later than tbe generation of methane.
Several factors cause higher concentrations of HIS incarbonate reservoirs compared to sand reservoirs:1, The sapropelic kerogen of carbonate source beds generates
more H2S than the humic kerogen of shales;2. Carbonate minerals catalyse the reacuon of sulphur with
hydrocarbons 10 form HIS; and,3. The ratio of iron content in shales over the iron content m
carbonates is 12/1 and the ratio of iron content in sands overthe iron content in carbonates is 3/1. This means that from 3to 12 times more H2S can be changed to iron scrlphide in sandsand shales than in carbonates,
Hydrogen sulphide will occur in sands if meteoric scrlphatecontaining waters contract a deep hydrocarbon reservoir.
Hydrogen sulphtde is responsible for the reduction of sulphateby organic compounds such as hydrocarbons. Toianddemonstrated that sulphate ion will rapidly oxidize hydrocarbonsin the presence of H2S. Figure-7 shows a number of suchreactions, which have all been carried out in the Iah. albeit at
higher temperatures. The reaction rates would probably behigh enough, at reservoir temperatures of 130 to 150 “C toresult in considerable oxidation of the hydrocarbons overrelatively short geologic time periods. Similar types ofreaction products are observed in crude oil.1. Reaction 1 converts m-xylene to Isphthalic acid in 89 to
100 percent yields m at 325 “C in one hour,2. Reaction 2 converts 90 percent of methane to C02 in 70
minutes at 325 ‘C. The subject flu]d has a relatively lowCOI content (under 2 percent) and therefore it is notthought that this reaction was a dominant process,although high C02 shows up in the Blackstone area ofAlberta.
4. When elemental sulphur reacts with HIS, as in reaction4, if forms polysulfides HIS,. Pnlysulfides are powerfuloxidizing agents rhat can convert saturated hydrocarbonscompletely to COZ at elevated temperatures. Under themild conditions typical of petroleum reservoirs, thesulphurization of hydrocarbons is favoured,
5. Reaction 5 involves the conversion of tetralin tonaphthalerre.
6. [n reaction 6, a thiophene is formed,7. Reaction 7 shows the formation of a thiol.8. A sulphide is formed in reaction 8.9. Reaction 9 involves the conversion of methane to COj.
The proof that such reacttons occur in the reservoir relleson isotope measurements. The sulphur of the dissolvedsulphate in reservoirs IS about 15 percent heavier Isotonicallythan the sulphur in immature crude oils. As rhe abovereactions occur, the sulphate sulphur bectrmes part of thesulphur in tbe crude oil and the associated H2S.Consequently, the sulphur in oil and H2S becomes isotonicallyheavier in the more mature oil subjected to highertemperatures. Of course, the crude oil cannot exceed theisotopic propor[irm of’the dissolved scdphate. The isotonicallyheavy srrlphur is preferentially introduced into lower boilingcompounds, such as thiophene, thiols, and sulphides ofreactions 6 through 8. Orr calculated that 64 percent of theorganic sulphur in the Manderson oil of the Big Horn basinof Wyoming was derived from the sulphate in formationwaters. A map conclusion of Orr’s study was that a largepercentage of the organic sulpbur compounds in mature crudeoils of Paleozoic age in Wyoming formed after tbe oil wasaccumulated.
Elemental sulphur has been encountered in reservoirdepths up to 9,144 meters. Reactions 5-9 show the kinds ofconversions that will occur in the presence of HIS, sulphurand polysultides. These are all reactions that reduce thehydrocarbon of the oil accumulation (with the exception ofequation 5) and Increase its sulphur compounds, many ofwhich are water soluble.
Valitiov found evidence that carbonates catalyze thesereactions. He found that when gasoline and sulphur areheated tn 175 “C it takes 2 hours and 40 minutes forhydrogen strlphide to appear. In the presence of limestone,however, hydrogen sulphide evolved within 35 minures.
Caroline Pool Data and EOS CharacterizationShell Canada documented part of thetr experience’. The
associated PVT data from all of their CVD experiments, areshown in Figure-8. Liquid dropout, as a percentage of porespace varies from about 2.5 percent to almost 14 percent.Such variations in a pool which appears to be in pressurecommunication is very unusual. Most pools are assumed tobe in thermodynamic equilibrium. EOS matches obtained inCaroline are shown in Figure-9. There appear to be commonmismatches between this Caroline data and the Brazeau Rivermatch presented earlier. For instance, the EOS curve is low
693

Page 4 ObrrmrmgPVT Dara For Very Sour Reservom A Multidisciplinary Approach SPE 35653
compared to lab data in the low pressure region. Shell’s projeclwas a major capital commitment and it would be reasonable toexpect that a considerable effort had been made in preparing thistype of characterization. The above matches were made using anSoave-Redlich-Kwong (SRK) equation whereas the data in thispaper was prepared using the Peng-Robinson equation.
Potential For Serious Problemh is apparent that the Caroline pool is difficult to match using
an EOS and there is tremendous variation in CVD lab data, forapparently very similar compositions. Similar problems are shownearlier for the Brazeau River area. At this point in time it became
apparent that the possibility of a systematic problem should beinvestigated.
Effects of Low Saturates/AromaticsAlthough the physical structure of the molecules varies
considerably, there are roughly similar numbers of hydrogen atomsfor each carbon atom. This reasoning has been used to justifyaverage properties (eg. Flroozabadi and Katz), Pederson et all”,in their text, concentrate on tuning the heavy end componentsbased on the percentage of Paraffins, Olefins, Napthenes, andAromatics (PNA’s).
Differences in the properties of these different classes arereadily observable on a convergence diagram. The Firoozabadiand Katz “critical properties’’ can be plotted. Note that the GPSAconvergence diagram has the critical points of pure alkanes alreadyplotted. It isalsopossible toaddtbe aromaticsin a trend whichincludes Benzene, Styrene, Naphthalene and Terphenyl. Alt oftfresesets ofproperties show alinear trend on the diagram. It isreasonable to deduce that the Firoozabadi and Katz propertiesreally represent a typical PNA distribution.
The analysis of the fluid from the discovery well did notinclude a comprehensive breakdown of the paraffhrs, napthenesand aromatics. Standard gaschromatographic analyses do identifysome of the lighter cyclic and aromatic compounds, but do notprovide detail allthewayto C30. Special test (PONAU) can bemade to about C12. A detailed procedure, which allows forestimating the proportion of PNA’s is outlined in Pedersonet al’stext. Part of EOStuning accounts forvariations in PNA's, as wellas overcoming the limitations of the technique.
As discussed earlier, the TSR process has a propensity toretain aromatics. This has been noted by others (personalcommunication) as key in characterizing similar reservoirs. Ahigh aromatic content should increase the critical pressure requiredfor the heavy end characterization.
Limitations of Gaa ChromatographyThis raised another important point. It is easy to forget the
complexity of GC techniques. In particular since the vast majorityof lab reports do not discuss the lab technique. First, multiplecolumns are required to cover the range of compositions that arecommonly supplied (to C30). There is overlap on the componentsrecovered by the different columns and integrating these results isan important issue, At higher carbon levels there is overlap onstructural isomers that cannot be distinguished and which aresometimes estimated. The technique is not capable, as yet, ofgiving complete PNA breakdowns.
Material obtained from column manufacturers identified thatthe standard detector used for hydrocarbons does not accuratelydetect strlphur compounds. Therefore, many of the reactionproducm described above will not be detected in an industrystandard suite of tests. Hydrogen Sulphide contents are determinedby Tutweiller titrations, since an accurate peak (sufficient forquantitative calculation) is not obtained on the standardhydrocarbon GC. The balance of hydrocarbon compositions areadjusted to match this H# concentration. In order to detectsulphur compounds, a completely different detector must be used.
694
Another alternative is the use of Gas Chromatography -Mass Spectrometer (GC-MS) anatysis.
GeologyThe geology of the area is described quite completely by
Machelll and Moore12. In total, over 20 different diageneticprocesses have been identified in the Brazeau River area.The Nisku in this area is also unusual in that relativelyisolated reef development occurs, which is required to getTSR conditions,
Normally Devonian reef reservoirs in the Western
Canadian Sedimentary Basin show important variations inreservoir quality that is linked to the depositionalenvironment. To date, no such correlation has appeared inthe literature pertaining to tbe Brazeau River Niskureservoirs. Pressure transient analysis indicates that thereservoir development is areally heterogeneous and hasdistinct layering.
Production TestingA well completion and testing program was prepared
based on the fluid obtained from the MDT sampte. This wellwas classified as a critical sour well. Two previous blowoutsfrom the Nisku P pool support potential bigb deliverability.Boffr previous incidents received major press coverage, inparticular since the H# could be detected (smelled) as faraway as Winnipeg. The public consequently has become verysensitive to sour gas well testing. A public consultationprocess was required for approvat of this well test,
The tesr design was based on the retrograde sour gassample obtained by MDT. Therefore. a four point isochronalflow rate scbedcde was programmed.
During the early part of the well test it became apparentthat the produced GOR of 805 m3/m3 was tower thanexpected. It was felt that the reservoir system might be abubble point system. The program was, however, carried outas originally planned i.e. as a four point isochronal test withan extended rate. Field operations, although delayed by rain,were completed witbout incident or any technical problems.
Fluid samples were taken at the end of each of the fourrates, as well as at the end of the extended rate. A totat of 5sample sets were therefore available. The samples were re-combined. The saturation pressure was found and the type ofsystem determined, i.e. dew point or bubble point. Theresults are summarized in Table-1, The first sample was adew point sample, while the remaining four samples exhibitedbubble points. Including the earlier MDT test, 2 out of 6samples were dew point systems.
A number of other points should be highlighted, First,the total GOR (m3 gas at 101.325 kPa and 15 “C/ stock tankm3 liquid) varied during the tests from a low of 602.15m3/m3 to a high of 882,09 m3/m3, a difference of 46,5percent. The H2S contents also change considerably from alow on the high pressure separator gas of 27.84 percent to ahigh of 34.91 percent. Note that separator conditions variedduring the test, which would affect GORS measured.
A comparison of the composition of the above samples ismade in Figure-10. Irr general, it appears that there is afairly good trend in all of the data. Differences which causeconcern can be seen in the area of iC4 to C9. Sample 3a waschosen for PVT testing. Note that a synthetic gas was usedwhen this sample was re-combined. This sample was, astabulated, a bubble point system or an oil sample.
Differential LiberationA differential liberation was performed with the results
shown in Figure-11. The oil formation volume factor (FVF)at [be bubble point (Boi) is 4.5. Visual inspection of these

SPE 35653 M.R. (Mtke) Carlson and W B. (Bruce) Cawston Page 5
curves indicated that the differential liberation had an unusualcharacter. In particular, the solution gas curve (not shown) doesnot rise rapidly initially as the FVF curve does. Further checksagainst formation volume factrrr (FVF) data from Chronquist,shown in Figure-12, did not support such a curve. Note that the
volatile oil curves are at the hrrttom. Volatile oils show a rapidlyincreasing slope as the bubble point pressure is approached. Thecurves with rapid initial FVF increases are medium to heavy oilswith low GORS. The slope on such fluids rarely varies as thebubble point is approached. Note that Chrmrquist’s curves are
normalized to the bubble point and therefore reflect character and
not absolute values. There is also a corresponding curve forsolution gas con[ent which is not shown.
Such volatile fluids are extremely rare, however, checkswithin teKt books and the literature indicated oil systems with Be’sas high as 6.0 are known to exist. Most of these systems weresweet, no sour systems were described in the material searched.Most of these fluids were very high in intermediate componentsi.e. ethane. Since HIS is quite close to ethane in criticalproperties, a high (30 percent) H2S concentration has a high defacto intermediate composition.
[t should also be pointed out that the Boi of 4.5 appbes onlyto the lab tests. In the latter field simulations, which utilized a 3stage cascaded separator, !he Bo dropped to 3.68.
Further checking was done by matching with an equation ofstate (EOS) program. The results are shown in Figure-1 I. Agood EOS match could not be obtained.
Constant Volume DepletionA CVD test was also performed on [he oil. EOS tits were
also pmwded tn the report by the lab company. The EOS matchindicates thal the results of the differential liberation and the CVDare not consistent. Neither the authors or the lab could explainwhat was causing this mis-match,
Cross-CheckOne of the remaining 4 samples, of [he original 5, was sent to
an alternate lab. A number of screening tests were implemented,First. a technique used historically for checking Oash calculationswas used. This consists of plotting (separator gas concentration)/ (separator liquid concentration) for each component on a logscale vs. component true boiling points on a linear scale. If thecompositional analysis is correct and/or thermodynamicequilibrium has heen reached in the separator, then a straighr lineshould result, One such plot is shown in Figure-13, To place thism context, other examples were prepared from offsettingcompositions and which confirmed that nearly straight lines are
normally obtained. None of the plots from the 5 samples from the
subject pool showed the expected linear trend.There were a number of possible sources of error. One N
liquid carry over from the high pressure separator into the gasstream, The latter can be caused hy a faulty de-mister orinadequate separator size. The capacity of the vessel was checkedand was well within design capacity.
In the end it was thought that a CC calibration error was themost likely problem. EOS sensitwitles were run with the two
different compositions and the results did vary somewhat.However. the EOS sensitivity tndlcated changes in tbe FVF curve
of about 5 percent, In the final analysis this level of error wouldbe lost m mmor tuning. If there was an error in compositionmeasurement, there may not k anything wrong with the samplesper se from a PVT perspective.
A CVD test was also attempted at the second lab in awmdowed Ruska cell. A constant composition expansion wasattempted first. These results eventually proved to be identical tothe CCE results provided by the first lab. However, after about2 to 3 days in the cell, the window became obscured by depositsof Mercury Sulphide (HgS), h was no[ possible to obtain further
695
PVT test results.
Age Of SampleAn issue that was brought up at this time was the age of
the sample, Three (3) months was considered old by thesecond lab. However, there is no quantitative data on theshelf life of a high HJS gas sample, One reference wasprovided on low (100 ppm) samples, which will be discussedlater in this paper. The CC analyses did indicate that the HIScontent had dropped slightly. The first lab was of the opinionthat a minor change in HJ should not affect PVT results,
Lab TestingTwo labs were used as well as two samples of five. The
importance of quality control procedures was demonstrated,although the problem discovered was unlikely to have beensufticiendy serimrs to compromise rrbtaining a successful PVTlab test.
Personnel from both labs were, in the opinion of theauthors, extremely knowledgeable. Very good service wasreceived from both labs. And yet no data could be obtainedfrom one sample and the other sample gave quite bizarreresults, despite a number of repetitions. Further, theoffsetting data from Caroline and the Brazeau River areaspanned other laboratories and indicated that the problemsexperienced spanned many reservoirs and a wide variety oflabs, In short. the problems appear to be industry wide ratherthan lab specific.
Once again, investigation of the problems experiencedlead to an ever expanding circle of potentiat problems. Atthis point in time the following areas were targeted for further
investigation:
1. Other experience that applies to sour gas system PVTanalysis, particularly at high concentrations.
2. Other components that might exist in the gas that are not
picked up by standard anaIyses.3. The stability of HIS containing samples.4. Alternate methods of quality control screening which
might exist.
5, API standards plus Alexander and McCain demonstratethe importance of well conditioning. Rate changes couldcause variations in sample compositions.
6. The comparison of compositions and PVT results fromvarious offsets seemed to indicate that PVT lab resultscould be very sensitive to minor changes in heavy endcomposition (chaotic theory of PVT and EOS analysis’?More seriously, statistical quality control - SQC).
All of the above are addressed in the following.
Effect Of Composition On PVT BehaviourThe basic methodology was [O take an existing
characterization and then alter [he compositions of somecomponents using an EOS program. Although EOS programsare not sufficiently accurate to be predictive, past experiencehas shown that they are very usefid for analysing trends.
The effect of various concentrations of HIS on the CVDprocess are shown in Figure-14. The starting concentrationis 28 percent - similar 10 the MDT retrograde condensatesample. As the HIS content increases, the volume of liquiddropout decreases. Hydrogen Sulphide acts similarly toethane, an intermediate, but gaseous component, Thus, moreof the heavy ends are retained in a more sour gas.Eventually, as the H# content approaches half [he startingconcentration of HJ, the system changes from a retrogradecondensate to a liquid (bubble point) system. This is,however. a very large change in H#. Note that the shape ofthe CVD liquid dropout curve has quite a sharp corner near42 percent liquid dropout. The lower the HIS content, the

Page 6 Obtmning PVT Data FOI Very Sour Reservmrs: A Multidisciplinary Approach SPE 35653
sharper the “corner”. Not only is the level of liquid dropoutaffected, but also the dew point. The dew point increases plus orminus 2500 kPa (362.6 psi), with the dew point increasing withH2S content.
The above sensitivity for a cnnsram composition expansion isshown in Figure-15. The dew point moves, however, the overallshape of the curves are similar.
None of these changes are any where near the magnitude ofthat seen in the Nisku P or the Caroline pools. The approach isperhaps somewhat simplistic. For instance, it’ the H# reacts withthe iron in a sample container, FeS and some HI might bereasonably expected as reaction products. Hydrogen is a very lightgas and would have a strong effect on PVT behaviour. On [heother hand, none of the samples indicated increasing HIconcentrations.
Influence of Aromatic ContentThe effect of changing the aromatic content was investigated
by changing the cyclo-hexane pseudo component. There is apronounced sensitivity to this concentration as shown in Figure-16.The relative changes from 7,1 mole percent arc outlined below, aswell as the absohrte changes:
- Absolute Relative10.67 + 3.57 % +50%8.92 + 1.82 % +26%7.10 0.00 % o%5.20 -0.73 % -27%
If the concentration of cyclohexane is incrrdsed the system behavesmore liquid like. In view of the critical temperature and pressure,this is not a surprise.
Irr summary, mirror changes in H# per se will not introducemajor changes in PVT behaviour. The system is sensitive to thearomatic content.
Well Test ModellingThe only way to adequately address possible changes in well
effluent composition is via a compositional simulation.A radial grid was used for the well test sensitivities. An 11
layer system was used vertically based on log analysis. Rate datawas input as a step function to closely match the actual ratehistory, Permeability for the different layers was input based ona core permeability vs. core porosity relationship developed froma limited number of samples. The interpreted permeability fromtbe pressure transient analysis was significantly higher. Althoughthis is, in general, not [be case: many carbonate reservoirs, showthat special core samples selected are skewed in favour of lowpermeability (eg. Swan Hills). Low permeability increases theamount of drawdown into the well, hence this calculation isconsidered conservatwe.
The tirst model was a simulation based on a dew point systemutilizing a PVT characterization from the Nisku P Pool. Initiallyno variations in surface operating conditions were included in themodel, with results as shown in Figure-17. As can be observed,the cleanup rate was roughly double the first well test rate. Aswould be suspected, the GOR predicted on the first rate changedconsiderably due to the high cleanup rates. GORS fromsubsequently modelled rates show increases with higher rates.
m m uM *Clean 1432 decreasingRate 1 1309 increasingRate 2 1444 increasingRate 3 1473 increasingRate 4 1575 increasingExt. 1358 decreasing
The above calculations were based on 3 stage separation withtemperatures and pressures specified as follows:
w Pressure Temperature
Wp1st Stage2nd Stage 150 263rd Stage 101 15
Low Flow RatesThe advantages of low flow rates has been clearly
documented 1314. A sensitivity was therefore prepared withthe well producing at a low stable rate of 28 E3M3/day (1mmscfd). The results are shown in Figure-17. The GOR isvery stable.
Note that other geometries and tltrid compositions willnot provide consistent compositional well effluent. Carisonand Myersi$ show that hydraulic fractures can depressproduced condensate gas ratios. It can be expected thathorizontal wells will show GORtrends intermediate betweenfracced wells and conventional vertical wells (radial flow).
There areother factors to consider in implementirrg lowrates in the field:1, Cleanups are more effective at higher rates, This will
have a long lasting impact on well productivity.2, Wellbore shrggingmayoccuratlowrates. ltistberefore
necessary to maintain rates at levels high enrrughto liftliquids. Latge tubrslars selected for high rates canexacerbate this problem. A (smaller diameter) workstring can be used to help controi this problem.
Very lowtlow rates can beveryhard toachieve in practice.The rate used in the sensitivity of 28 E3M3/day is likelyattainable. Maintaining minimal changes in flow rates willhave a positive effect in reducing compositional variation.
Actual Separator ConditionsData was taken from the well test operator’s notes which
indicate the temperature and pressure ar which the field testwas conducted, as documented in Table-2. The actual welltest was run at higher temperantres than modelling hadassumed above. Production facility conditions vary dependingon ambient conditions, how long the well has been flowed(heated up)aswell as flowrate, There were only two stagesof separation, which wilt also have theeffect ofincreasing theGORS from the model described earlier which assumed 3stage separation.
The simulator predicts a pronounced effect, as shown inFigure-18. This is not surprising since the well fluid basasubstantial intermediate content. One potential disturbingobservation is that the recorded sample temperatures and theseparator/orifice meter temperatures are 35 ‘C different.
The well test was then modelled as a bubble pouttsystem, The results parallel those outlined above.
Compositional VariationsThevariation in GORonly tells part of the story. The
surface production facility conditions control how much of thewell effluent ends up in which sample container (liquid orgas). Obtaining inaccurate recombined composition is thereal objective. GORS are an accurate indication of welleffluent composition only ifsurface facility conditions remainconstant (rarely the case).
In Figrsre-19 the variation in well effluent HIS(recombined liquid and gas) is shown for a dew point (NiskuP) system. The concentration varies in the range of 20,9percent +/- 0,2 percent (plus or minus 1 percent on a relativebasis). The results from the GC analysis or Tutweillertitrations are probably not srrffic ientl y precise to spot thesedifferences. A similar analysis was also performed for an oilwell, Since the results parallel the retrograde gas condensatesystem, a separate discussion has not been included, The
696

SPE 35653 M.R, (Mike) Carlsnn and W B
variations in the FC1 1 pseudo component are plus or minus O. 15percen[ on a molar ccrmposi[itm 2.2 percent (a relative change of’6.8 percent), which is still a relatively small difference. Note thatonly the variation with rates (not separator condition) M shown.The vana[ion of the FC 17 pseudo components concentration isahors[ O. I percent out of 0.73 percent molar composition (a relativechange of 13.7 percent), as shown m Figure-20, which is prohahlyjust noticeable, The concentration of methane in the well eftlueturanges from abnut 56 to 58 percent, a relative range of ahnut 3.5percent.
concentration variations near the end of flow periods havealso been tabulated in Table-3(a) and Table-3(h). For the mostpart the differences in composition would he quite difficult todiscern on a GC analysis.
The following conchtsmns were derived based on well testmocfellirrg:1. There will hc large changes in GOR due [o changes in surface
nperatmg conditions in addition to reservoir effects.2. There will hc compositional changes tha[ are significant
immediately after an abrupt change in production rate.3. The modelling indicates that at the time the reservoir fluid
samples were taken, no significant changes in well eftlucntcnmpnsitinrr should be expected. No[e that sampling processis not instantaneous.
Overall, comptssi[iotral modelling indicates that [he test used shouldnot have caused the changes in PVT results obtained. Themodelling highlights that changes in GOR are not indicative ofwell stahilizatiorr when surface operating conditions vary. Moresophisticated analysis, in which adystments can be made forchmrging surface condl[imrs. to determine composition in the tieldis recommended.
Data ScreeningOne way 10 screen gas condensate data is to overlay CVD and
CCE liquid volumes. Pederson et al lo shows that these two curves
generally overlay for the first 25 percent of pressure depletion.Their example does not represent a highly volatile fluid. The EOSchecking described earlier was used to demonstrate the generalapplicahlllty of this rule to a high dropout liquid,
One mterestitrg item identitiecf during the EOS sensitivitieswas that CCE data, in particular the ROV, proved to he of littleuse in distinguishing between high drnpout dew point and volatileoils systems. Curves from both systems will virtually overlay.
A CCE can offer some significant advantages however, First,it is much simpler to implement than a CVD. The gas in the celldcres not get drawn off in stages, hence, this test is much lesssusceptible to errors, The liquid volume ohserved offers a goodquality control on CVD work done later. It is alsocorrespondingly less expensive, Not all CCE tests are conductedin windowed cells. Based on this project, the author found CCEdata to be of little use uoless Iiqu]d dropout volumes are reported,which requires a windowed cell.
A rule of thumh frrr differentiating volatile oils fromretrograde condensate systems was recommended to the authors ona number of occasions, which originates from McCain16. h statesthat “Laboratory determined compositions of volatile OIISwdl have12.5 to 30 percent heptanes plus. The dividing line betweenvolatile otls and retrograde condensate gases of 12.5 mole percentheptanes plus is fairly definite. When the hepranes plusconcentration ts greater than 12.5 mole percent heptanes plus. [hereservoir fluid is almost always a liquid and exhibits a hubb[epoint. When the heptanes plus concentration is less than 12,5mole percem the reservoir fluid is almos( always a gas and
exhihits a dew point. Any exceptions to this rule normally do notmeet the rules of thumb w!th regard to stock tank oil gravity andcokmr”.
The data upon which the rule of thumh appears to have beendrawn is from McCain and Bridges”. A graph is shown In
(Bruce) Cawston Page 7
Figure-21. The author’s interpretation of the data is slightlydifferent. If the heptanes PIUScontent is fretween 12 and 13.5percent it can go either way.
The heptanes plus mole percent data fi-om the originalMDT, and two of the volatile nil analyses are shown on thisdiagram and have heen plotted against the appropriate GORS.The data clearly falls off the trend. Thus, in the authors’opinion, this conventional rule of thumh should not he usedfor sour systems. There is no indication that McCain et alever intended that their rule of thumb would ever be appliedto very sour systems. The authors cautmn that a generallyusable rule of thumh, could easily he mis-applied.
Storage Life Of Sour GasThe effect of sample age was earlier identified as an
unknown. The issue that immediately springs to mind is theeffect of corroston. Metal cnrrosiort in sour-gas environmentsN an electrochemical processln, which consists nf anodes andcathodes. Metal corrosmrr can he divided into two basicreactmrrs: oxidation and reduction. Oxidation represents thecorrosion of the metal that can occur at the anode. Reductionis the reaction that occurs at rhe cathode. In an acidicsolution, which is of[mr tbtznd in the oil field, the followingreactmns are common.
Fe --> Fe2’ + 2e [oxidatmrr]2H+ + 2e --> HI (gas) [reduction
The oxidation and reduction reactions are dependent on eachother: therefhre. whatever effects one reaction affects theother. That is, if the reduction reaction is increased, theoxidation reaction (corrosion) also increases,
From a PVT point of view, the generation of ironsulphide would reduce tbe molar volume of hydrogensulphide, This molar volume would he nffset hy hydrngengas generated, The latter is a very Ilght gas with a lowcritical temperature and pressure. Hydrogen would thereforehe expected to have a strong effect on phase behaviour.Significant corrosion (FeS) might show up on the measuredHJ content as well as hydrogen gas. The authors expectedthat sample stability would revolve around comparing samplecylinder weights from before sampling and aher discharge,opening cylinders and attempting to weigh precipitated FeSand monitoring for H~ generated. Weighing differences insample cylinder weight is likely very difficult, since they arequi[e heavy in relation to the sttlphur contained.
Rhodes19 work shows very dramatically that very smallamounts of water in sample cylinders accelerates corrosion.Most reservoir samples are saturated with water vapour atreservoir temperature. so condensation ts inevitable. AI thevery least, samples should be saturated at the high pressureseparator conditions.
Influence Of ContainersThe most comprehensive paper on this was hy Price and
Cromer20. They used a GC designed specifically to detect arange of sulphur spec!es, which include CSI, SOI.Methanethicsl, Ethanethiol, Ethylmethyl Sulphide and a hostof other compounds. Their methodology consisted of adding100 ppm of each of the following components: HydrogenSulphide, Carbonyl Sulphide, Ethyl Mercaptan, DimethylDisulphlde and Ethyl Methyl Sulphtde mto a natural gassample. Compositmrt changes were monitored over limeusing a series of different containers,
The results were extremely interesting, some componentconcentrations declined while new products appeared.Cromer and Price Identified a number of potential reactionsthat could result in these various products. The authorsconcluded that silanized glass was the best container.
The author’s interpretatmrr is somewhat different. There
697

Page 8 Obrsining PVT Dats For Very Sosrr Reservn]rs: A Multidisciplinary Approach SPE 35653
are far more serious implications to their tindings. First, since theconcentrations eventually stabilize we conclude that there was achemical equilibrium. In general, chemical equilibria aretemperature and pressure sensirive. If, for exampIe, a perfectbottom hole sample were transferred to a cell, it would benecessary for the cell to stabilize in the area of up to 200 hours (1week), just to re-establish system equilibrium. A GC analysis ofa room temperature sample cylinder would give a completelydifferent composition than the re-equilibrated sample in a PVTcell. Of course, the chief objective is normally to characterizereservoir fluids. Therefore, determining sttlphur compoundconcentrations from a sample container stored at room temperaturecould be very misleading.
Although this work was very helptbl, it does no: appear tohave been continued to higher levels of H2S concentrations. Themix of the 5 sulphur compounds does not likely represent an actualgas sample, which would probably have a larger variety of speciesand a different distribution of concentrations.
Sulphur ChemistryPreliminary research on strlphur chemistry was clone using
overview textszf ~$. The results of this investigation were veryenlightening.
First, sulphur vapour is comprised of a number of differentmolecules ranging from S, up to S8. At low temperature andpressure the vapour is green (SJ, at intermediate temperatures andpressure it is deep cherry red (Sl and S,) and at high temperaturesand pressures it is dark violet (Sl). A graph22 indicating
approximate proportions is shown in Figure-22.Liquid sulphur also shows a variety of species and work has
been done on the equilibrium of various lengths of chains and ringsizes. [n particular liquid sulphur contains polysulphides as wellas dissolved H2S gas.
It seems likely that determining the critical [temperature andpressure could be quite difficult for sulphur since the proportion ofdifferent elemental species (S8 or S6 etc.) changes with temperatureand pressure. This could be solved by using (yet another!) pseudoproperty. The “Pseudo Critical Sulphur Temperature andPressure” could be made a hurction of temperature and pressureand which adjusts for [he proportion of Sttlphur species. At theactual critical point the pseudo and actual properties wouldconverge. This pseudo property could be used (or back calculatedfrom) EOS calculations to predict phase envelopes and other PVTprocesses such as a CVD or CCE lab test.
Chemical EquilibriaA summary of various reactions were found. In the liquid
state, there is an equilibrium between H2S and polystdphidesH$yY. This does not appear to relate to the gas phase based onthe material presented, although there may well be an indirectaffect via sulphur vapmar-sulphur liquid equilibrium.
The reaction of sttlphur and alkanes is discussed. In particularmethane with sulphur resulting in CSI, HIS and HI is described,but at temperatures well above reservoir temperatures. Reactionkinetics and observation indicate that the most likely mechanisminvolves liquid (molten) sulphur on the wall of the reaction vessel.Molten srrlphur contains many free radicals. The later could easilyextract hydrogen from methane to form various products. The rateof reaction was also strongly affected by increased surface area inthe reaction vessel.
Other material details reactions, again at high temperatures,that involve sulphur and olefins.
Gas phase reactions are documented for sulphur and oletins,however, the elemental sulphur was generated by photolysis ofCOS. The carbon monoxide concentration (which is a byproductof COS disassociation) changes and was involved in the reactionand therefore the data is not directly applicable to the problems athand.
Overall, there are many potential reactions. The effectof surfaces is consistent with Cromer and Price’s
observations. Recall also from the geological section that theformation of H2S was catalyzed by carbonate surfaces. Ifthese surfaces are necessary to complete the reactionmechanism, thought should he given to including suchsurfaces in a PVT cell, while attempting to re-es[ablishequilibriums at reservoir temperature and pressure.
Used Sample ContainersInformal discussions with lab personnel indicated that
“used” pressure cylinders which had contained sour gas,could reduce the amount of degradation that could beexpected, Tbe most common explanation is that the H2S isabsorbed into the cracks between metal grains, It would seemlogical that sample cylinders could he “pre-soaked” with sourgases in various concentrations so that containers and samplescould be matched. (Through an industry consortium?),
Given the preceding analysts, it is natural to wonder Ifperhaps the real advantage is that the catalyzing effect uf thesample surface is somehow inhibited. Perhaps a sulphurphobic surface would produce more stability than attemptswith chemically inert surfaces such as teflon. Polishing theinterior of sample containers might also inhibit unwantedreactions if surface area strongly affects the reaction rate.Sample containers are normally evacuated immediately beforesampling. This wnrrld probably decrease the advantagesgained from pre-soaking, ii’ absorption is the underlyingmechanism.
Strlphur SohahifityFurther investigation indicated that It has long been
krrown26 that elemental sulphur is dissolved in sour gases.More recently this work has been extencteff’, This has beendriven by some extremely sour reservoirs, such as found inthe Bearberry area of Alberta. Al[hough the equilibrium andmechanism of this reaction is discussed in some of the sulphurchemistry texts, the more recent work does not appear to haveapproached the problem from this direction.
Roberts and Hyne2* have applied a technique developedby Ziger and Eckert which incorporates van der Waal’s EOSwith aspects of sohtbility parameter theory to formulate asemi-empirical correlation for the volubility of solids in fluidphases. This analysis was based on S,. The material was notextrapolated to the prediction of’ phase behavioral,
Potential Effect Of Sulphur VapourThe elemental strlphur content of the gas could have a
very significant effect on the phase behaviour, ARE was ableto obtain 2 estimates of the cnttcal temperature andpre.-surezu9, The first was 1037.8° C (1310.8 “K or 19@0
F) and 116 atm or 11,757 kPa (1 ,699.4 psi). The second was1041” C (1314 ‘K or 1905.8 “F) and 2077 bars or 20,700Kpa (3002 psi). The critical pressures differ significantly.
Such high values would have the effect of shifting thephase diagram far to the right, The possible saturated sttlphursohsbility was extrapolated from the data of Davis, f-au andHyne. At about 90° C and 27,000 kPa the snhrbility wasestimated to be 0.7 g/m3. The molecular weight nf scdphuris 32.066 and when converted to a molar concentrationamounts to approximately 0,052 mole percent. The data ofKennedy and Wieland places the sulphur content at 7.32 lbssulphur/mmscf (0.12 g/m3) in a mixture of 75.5:24.5 molepercent methane: hydrogen sttlphide. The latter correspondsto 0.009 mole percent sulphur.
Such low contents would seem unlikely to have mucheffect on the phase behaviour, certainly not enough to matchthe corrections required on the MDT sample.
698

SPE 3S653 M.R, (Mike) Carlson and W.B. (Bmce) Cawstrm Page 9
Davis et al used a Hastelloy C-276 high nickel bar stock toprevent corrosion. Kennedy and Wieland do not identi~ whattheir sulphur equilibrium vessel was made from, however, it doescontain 40 and 80 mesh screens - which are likely to be wire.Davis et al over heated the sttlphur until it was molten for a 16hour period. It was ~hen equilibrated at the target temperature forat least 32 hours, Therefore the equilibrium should be approachedfrom an oversaturated condition.
However, as discussed earlier, part of the equilibriummechanisms appears to involve the container surface. Cromer andPrice also show the equilibrium to be affected by storage cylindersurfaces and quite long equilibrium times, up to 200 hours, Asdescribed in the geochemistry section. the generation of HIS isthought m be catalyzed by carbonates, indicating that the reversereaction (generating sulphur) would he simiIarly affected. Finally.these tests were generated with synthetic gases. Much of the datapresented so far would indicate that there are a considerablenumber of subsidiary sulphur compounds that are involved insimultaneous equilibriums, The authors therefore conclude that thetests conducted 10 date may not reflect actual reservoir crmditions.
Sample CycleReservoir engineers are primarily concerned with what IS
happening in the reservoir, h is normally assumed that thereservoir fluid IS in thermodynamic and chemical equilibrium.
To sample this reservoir we have a number of alternatives,The first is to use a downhole sampler, such as an MDT tool.Low flow rates, or more particularly low pressure drawdowns,would give a fluid that is as close to the reservoir fluid conditionas possible. This prnved to bd difficult with the MDT tool.Ideally, the reservoir is undersaturated, as this will make gatheringa single phase sample possible. If, however, the fluid is nearcritical, the vapour and liquid phases will be very similar.Whether the sampler picks up liquid or gas under these conditionsmay not he a major concern, The tool is brought to surface (viawireline). broken down, and the sample section shipped to a Iah.
The sample will he taken into the lab, heated with an electrictape, and then the contents displaced with mercury to anintermediate storage vessel, This allows rapid return of [hednwnhole tool to the service company. The sample is then testedfor composition, a saturation pressure is likely determined, and thecontents then transferred to a PVT cell.
The mher alternative is to sample at surface. This is thes[andard procedure when saturated reservoir fluids are beingsampled. The path of a small volume of sour retrogradecondensate gas (the “buhhle”) will he traced to illustrate potentialchanges that can occur. As the bubble flows from the distant partof the formation, part of the bubble condenses on the way to [hewell, Liquid buildup occurs around the well, the amount andtim!rrg of which depends on Iayermg and well genmetry. Bubblesentering the well contain part gas and part movable liquid. As thebuhhle travels up the wellbore the pressure and temperature drop,resulting in the bubble containing more and mnre hydrocarbonliquid, In some cases the sulphur will start to precipitate nrr thewalls of the tufrmg. Since this is a new well, it is just being testedpriur to putting the well on production, the HIS will start m reactwith the tubulars, with part nf the gas being absorbed between thegrams, Near the surface some methannl may he added (n preventthe well from fieeztng off due In hydrate formation, a commonproblem for sour wells. At surface the gas bubble goes through achoke. which causes a rapid depressurization and further cooling.At this point the bubble enters a high pressure separator where thegas IS separated into separate huhhles of liquid and gas. Wlthorthe separator it is intended that an equilibrium be achieved.Limitations to this objectwe include slugging (from the wellbore)and, as discussed earner, sulphur comprrund equilibriums can berelatively slow. h is from here that most liquid and gas samplesare taken. The high pressure separatnr GOR needs tn be recnrded
in order to accurately recombine the samples in the lab.The samples are received in the lab. A bubble point will
he determined for the liquid sample and checked against therepotted operating conditions of the separator. Compositionsof the liquid and gas are then taken and processed. Arecombination procedure is implemented to combine the twofluids. This requires a number of steps to ensure that theaccurate amounts of each are combined, A sample is thentaken and checked against a mathematical re-combination ofthe liquid and gas. At this point the material is transferred toa PVT cell.
The potential changes in composition were discussedearlier as well as the need for equilibration in cells.
MDT SampleIt is obvious that the process for a downhole sample is
much simpler than for a recombined sample. The servicecompany wants the tool back quickly to be re-used. There isno complex re-combination procedure, The fluid is notexposed to as much material wi[h which to reactor to depositnn.
The MDT sample, discussed at the beginning of thepaper, had over a 40 percent liquid dropout, indicating it wasnear critical, Whether gas or liquid entered the tooldownhole may not be important, since either would becnmpositionally very similar. It is also significant that theMDT sample is the only bottomhole sample ubtained fromany of the surrounding wells.
Non-Reactive CeltsRobinsonw describes a new PVT apparatus that solves
mercury interaction problems. The sample container utilizedwas made from an artificial sapphire and is therefore clearand non-reactive. A piston with tapered edges was utilizedthat allows low liquid dropout volumes to be more accuratelymeasured. There are some limitations to this apparatus. Atpresent it has a lower pressure rating than many steel cellsand can only handle very small sample volumes.
Vagtborg~t solved the problem of Mercury interaction in1954 by using a separating disk with teflon seals for a highlysour oil sample.
Complex Phase BehaviourHeng-Jon Ng et alqz report very interesting results using
the previously described cell, The fluid tested was a mixtureof Methane, Carbon Dioxide and Hydrogen Sulphide with49.88, 9.87 and 40,22 mnle percent concentrationsrespectively. The resultant phase diagram is shown in Figure-24. The system has a total of 3 different critical points.This sample varies from the MDT sample in two importantways, The HIS content of the MDT sample is slightly lower,there are more heavy ends and possibly elemental sulphurvapmsr, The latter would have the effect of expanding thephase diagram quite far to the right, ie, to highertemperatures and pressures. This would also suggest thatperhaps the phase diagram wjth the upturn at lowtemperatures, lack of unique critical point, was far morerealistic than our preconceived (single two phase region)notions. Note that the primary rrhjective of the researchconducted was for use in gas processing facilities at lowtemperatures.
It M worthwhile to consider what approach might havebeen taken, had such behaviour been expected. It N quitelikely that a more sophisticated lab testing program mighthave been designed. Multiple critical points would have beensmtght out, and a wider range of conditions investigated.Finally, the methodology in the EOS matching would havebeen more sophisticated.
699

Page 10 Obraining PVT Data For VeIY Sour Reservoirs: A Multidisciplinary Approach SPE 35653
SummaryA considerable effort was spent identifying which component
or experimental phase caused the widely varying PVT resultsobtained. Such effort is justified on a critical sour well, where re-obtaining the data is very expensive, time consuming, and whichrequires considerable public relations effort. The implications ofthe reservoir model have a substantial impact on planned facilities,development wells and processing options. The cost of PVTanalysis is trivial in comparison to the impact of its results.
A considerable number of potential problems have beenidentified. Not all of these problems can be solved without somefundamental research.
The authors do not pretend to be experts in sulphur chemistry.The petroleum literature that deals with these important issuesappears to be very fragmented and have serious gaps. We havedocumented our experience in an effort to combine a lot ofdisparate references into a single source that covers many of therelevant issues. There are numerous gaps that have not yet beenfilled in. This data may exist, however, there are manyindications that significant research M required.
RecommendationsA suggested well test program has been outlined in the
following:1. Cleanup at high rates. Obtain initial sampIes and composition
after allowing for reasonable stabilization.2. Shut in for buildup. An EOS compositional model can be
generated based on the initial composition. Be particularlycareful on fracced and horizontal wells. Also where theformation is of low permeability and hence have low
bottomhole flowing pressures.3. Flow the well at low rates for an extended period. An EOS
model can be used to filter the effects of changing well andseparator conditions. Allow for deliberate sample and labredundancy. PVT testing should be conducted immediately.
4, Implement a 2 rate isochronal well test. If PVT data takenearher does not yield consistent results, another set of samplescan be obtained from the last rate.
5. Note that turbulent flow can exist on high productivitycarbonate wells. If this is expected, a 4 point test is a betterinvestment, It is possible to analyze such tes[s reliably usinga simulation based welt test analysis. (This did not prove tohe true for the subject well).
6, If slugging occurs it is possible to reverse the rate sequenceson a four point AOF test.
7, If at all possible, take bottomhole samples.8. Look for other sulphur compounds and sulphur itself9. Based on the experience gained on the well site during the test
of the subject well: it is very worthwhile to send the end use(experienced reservoir) engineer to monitor well tests.
10, Co-ordinate with the lab personnel on how very sour Otodswill be tested and handled,
Conclusions1. It was not possible to obtain accurate PVT data using what are
considered as indusmy standard procedures. Obtainingsamples from very sour welfs is not a routbte procedure.
2. Extensive analysis of anomalous data included: offsetcomparisons, sample screening, EOS sensitivities, pressuretransient analysis (not discussed in paper), and detailed welltest compositional modelling. Despite this effort it was notpossible to resolve or explain the observed PVT data.
3. Comparison of lab data in the Caroline and Brazeau Riverareas indicates that there can be considerably different CVDresults than would be considered normal for a single reservoir.
4. Material on sour gas systems is relatively rare within themainstream petroleum literature (CIM and SPE).
5. There is geochemical evidence that suggests that there may be
considerable differences in chemistry related to how thehigh H2S is formed in the reservoir. Depending on theprocess this may yield important clues as to whatassociated products exist. This, in torn, may be a veryusefol guide for EOS characterization.
6. Recent work indicates that with high H# contents,elemental srslphur may be present in gases that are over20 percent sour. Reasonably extensive work ondetermining the carrying capacity of elemental sulphurhas been done.
7, The presence of elemental sulphrsr, which has a highcritical temperature and pressure, should have a strongimpact on the shape of phase envelopes for complexhydrocarbon sys[ems. Our reviews did not uncover anydata on this type of system.
8. There does not appear to be anything to suggest thatreservoirs have to be completely saturated. Elementalsulphur in core probably is indicative of a saturatedreservoir. Otherwise, determining the actual sulphurcontent of the reservoir fluid should be done on areservoir by reservoir basis.
9. Historically, it has been proven that conventional PVTcells, which utilize mercury as a displacing agent areaffected by the formation of HgS precipitates, This willobscure cell windows, preventing liquid dropoutobservation. It will also introduce undesirable reactionproducts, such as hydrogen gas, that will affect PVThehaviour and vessels. Specialized techniques exist tominimize or eliminate this problem which include the useof a separating disk and the use of sapphire cells.Although this clearly increases expense, these labprocedures are necessary,
10 Based on the author’s limited search to date, there seemsto be gaps in the understanding of the fundamentalchemistry of sour systems. The following appears to berequired:i. what reactions will occur and the mechanism of
these reactions, particularly the effects of surfacesas catalysts,
ii. chemical equilibria and kinetic (rate) dataIll. thermodynamic data would allow for the accurate
development of tuning material for EOScalculations.
iv. based on multiple critical points observed utilizingthe most recent cell technology, investigating morecomplex phase behaviour may be required.
11 Well test conditions may have a serious impact on thecomposition of samples obtained. [n particular, recentwork on hydraulically fractured wells, which may beextrapolated to horizontal wells, suggests that “backcorrection” may be necessary to get the true originalreservoir composition. Stabilized conditions arenecessary for good samples.
12 Since sour gas tests are limiterJ in volume, there willlikely be some element of’ compromise betweenrecommendations 3 tfrrough 7.
13 Experience indicates that monitoring wells based on GORalone is very difficult. More sophisticated analysis isrequired to determine stability. On site GCcompositional determination might solve this problem.
14 Data on the offsetting Nisku P Pool suggests that there isconsiderable risk in getting a single successful sample,Deliberate redundancy in sampling, and PVT testingtirture samples is recommended (multiple labs andsamples).
15 Quantitative data on how long sour samples caneffect ively be stored is critical. If the samples cannot bestored, then steps should be taken so that immediate
700
SPE 35653 M.R. (Mike) Carlson and W.B. (Bruce) Cawsmn Page 11
16
16
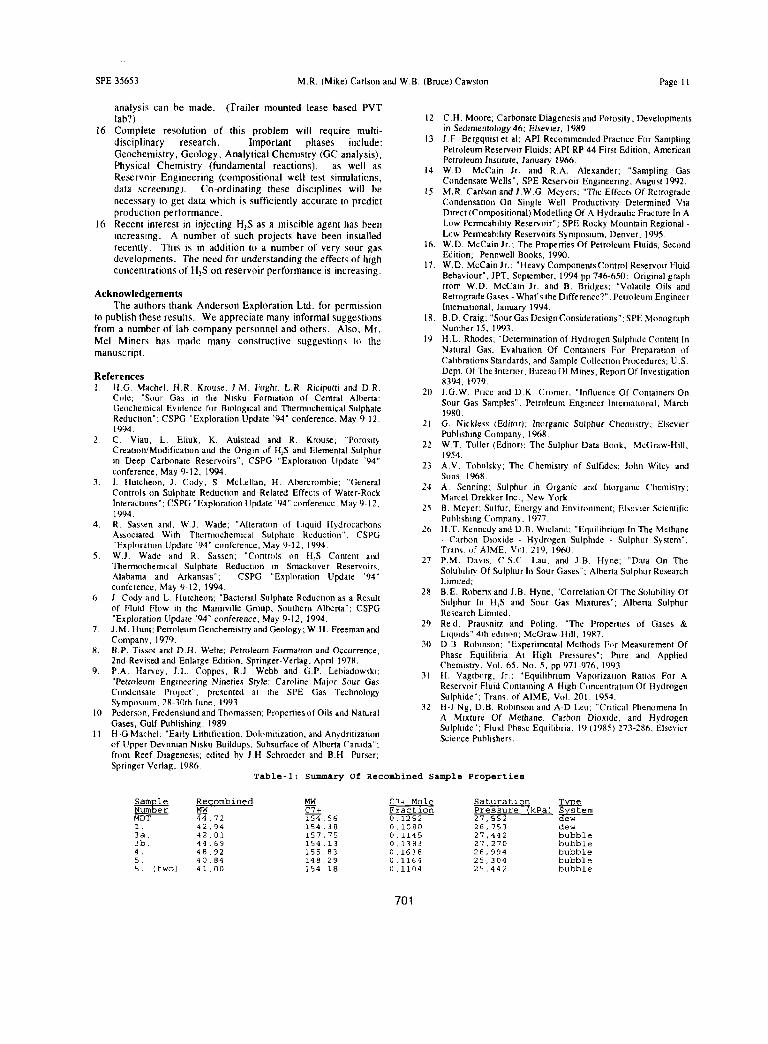
analysis can he made. (Trailer mounted lease based PVTlab?)Complete resolution of this problem will require multi-disciplinary research. Important phases include:Geochemistry, Geology, Analytical Chemistry (GC analysis),Physical Chemistry (fundamental reactions), as well asReservoir Engineering (compositional well test simulations,data screening). Cmorcfinating these disciplines will benecessary 10 get data which is sufficiently accurate to predictproduction performance.Recent interest in injecting HIS as a miscible agent has beenincreasing. A number of such projects have been installedrecently. This is in addilion to a number of very sour gasdevelopments. The need for understanding the effects of highconcentrations of HIS on reservnir performance is increasing,
AcknowledgementsThe authors thank Anderson Exploration Ltd. for permission
topublish these results. Weappreciate many informal suggestionsfroma number oflabcompany personnel andotbers. Also, Mr.Mel Miners has made many constructive suggestions to themanuscript.
References1
2
3.
4,
5
6
7.
8,
9.
10
11
H.G. Mactrcl. HR. Kmuse. J.M. Foght. L.R. Rlciputn and DR.Cole; “Smcr Gas !n the NMICCI Formanrrn of Central Alhmta:
Geochemical Evidence for Blolnglcalarsct Thermochemical Sulphate
Reductmn’’;CSPG “ExplorationU pda[e’94’’c onference,May9-l2,
1994.
C. VrNS, L, Elmk, K. Aulstead and R. Krou.se; “Pomsmy
Creatinn/Mod!ficaoon and the Ongm of H2S and Elemental Sulphur
m Deep Carbonate Reservoirs”; CSPG “Exploraocrn Update ’94”
cmrference. May9-f2. 1994.
I. Hcrtcheon, J. Cody, S, McLellan, H. Afrercromh!e; “General
Commlsnn Sulphate Reducnon and Related Effecrsof Water-Rock
Interactlorrs”, CSPG “Explorafmn Update ’94” conference, May 9.12,
1994.
R. Sassen and, W.J. Wade, “A[teratmn of L!quut Hydmcarhnns
Assoclatect Wtth Thermochemmal Srclphate Reductmn”: CSPG
“Exploranrrn Update ‘94’’ conference, May[}-t2, 1994.
W,J, Wade and R. Sassen; “Controls nn H,S Contem and
Thermochemical Srdphate Reductmn !n Smackover Reservmrs,
Alabama and Arkansas’”: CSPG “Explorauem Update ’94”
crrnference, May +12, 1994.
J. Cody and L. Iiutchenn; “Bactertal Scclphate Reductmnas a Result
of Flu]d Fluw m the Mannville Group, Snuthem Alberta’”; CSPG
“Expkwabo n[Jpdat e’94’’corrference,Ma y9-l2, i994.
J.M. Hum, Petroleum Gcnchem]stV and Geology; W H. Freeman and
Company, 1979.
B P. TISSCICand D.H. W+: Petroleum Fm-matmnarrci Occurrence,
2nd Revised and Enlarge Eduiorr, Sprmger-Verlag, Aprd 197fi
P.A. Harvey, J.L. Coppes. R.J Webb and G.P. Lebladowskl;
“Petmlecrm Errg#rreermg Nlnettes Style: Camlme Major .%ur Gas
Condensate Pn)ject”: presented at lhe SPE Gas Technology
Sympnsmm, 28-30thJune, 1993.
Pedersnrt, Fredenslund and Tbnrnassen; Properties of Oils and Natural
Gases, Gulf Pcrbl]sbmg. 1989.
H-G Machel; “EarlyLNhlficaticrrr, Dolomitlzaticm, and Anydr!nzannn
of (Jpper Devnnian Nisku Buildups, Suhsurfaceof Alberta Canada”;
from Reef Diagenests; edited hy J.H Schrneder and B.H Purser;
Snrrnzer Verlae. 1986.
12
13
14
1$
16
17
18
19
20
21
22
23
24
25
26
27
28
29
30
3]
C.H. Moore; Carbonate Diagermsis and Porosity, Developmentsm Sedlmentology 46; Elsevmr, 1989.
J.F. Bergquwtet al; API Recommended Practicc Frrr Sampling
Petroleum Reservoir FluIds; API RP 44 First Edition, American
Petroleum institute, January 1966,
W.D McCain Jr, and R.A. Alexander: ‘“Sampling Gas
Condensate Wells”, SPE Reservoir Engineering. August 1992,
MR. Carlson and J, W. G. Meyers; “TheEffectsO fRefmgrade
Condensaomt On Single Well Prnducuvlty Determined Vla
Dwect (Companlonal) Modelling Of A Hydracrhc Fracmre In A
Low Pemeah!ll~ Resemoir”; SPERncky Mounram Regional-
Low Pemreahility Reservoirs Symposmm, Denver. 1995,W.D. McCain Jr,; The Propemies Of PetroleumFluids, .%cnnd
Ed]tion; Pennwell Books, 199C,
W.D. McCain Jr.; “HeavyCompmrentsC rnrtmlR eservolrFluld
Behavmur’’, JPT, September, 1994 pp746-65fl: Onglna] graph
from W.D. McCam Jr. and B. Bridges; “Volatde Oils and
Retrograde Gases What’s the Difference?”; Petroleum Engineer
Intemanonal, January 1994.
B.D. Craig; “Sour Gas Des!gn Considerations”: SPE Monograph
Number 15, 1993.
H,L. Rhodes; “Determlna[ion of Hydrogen Sulphlde Cnrttetw In
Natural Gas, Evaluation Of Containers For Preparatmn of
Calibrations Standards, and Sample Collecni-m Procedures; U.S.
Dept. Of The [rrtermr, Bureau Of Mines, Report Of Itsvesugauon
8394.1979.
J.G. W. Pncc and D,K. Cmmer, “Intluencc Of Comamers On
Sour Gas Samples”, Petroleum Engineer Intemaoonal. March1980.
G. Ntckless (Edirur); lrrnrgaruc Srclphur Chemistry; Elsevler
Puhllshmg Company. 1968.
W T. Tuner (FAnnr): The Sulphur Data Brink; McGraw-Hill.
1954.
A.V. Tohnlsky; The Chemistry of Sulfides, John Wiley and
Snns, 1%8.
A Senning: Sulphur ]n Organic and lnnrganlc Chemistry;
MarcelDrekkerInc., Ncw York.
B. Meyer; Sulfur, Energy and Envlronmerrt; Elsev!er Sclen[ific
Puhltshirrg Company. 1977.
H.T. Kennedy and D,B. Wmland; “Equ[llhrmm [n The Methane
Carbon Dmx]de - Hydrogen Sulph!de Sulphur System”,
Tram of AIME, Vol. 219, 1960.
P.M. Dav]s, C,S. C Lau, and J.B. Hyne; “Dat~ On The
Solubd]ty Of Scclphur In Sour Gases”; Alberta Sulphur Research
L]mued;
B.E. Roberts and J.B, Hyne; “Cnrrelatiorr Of The Snhdrdtty Of
Sulphur In HIS and Sour Gas Mixmres”; Alberta Sulphur
Research Limited.
Reid, Prausnitz and Poling; “The Pmpemes of flases &Ltqu!cfs” 4[hedmnn; McGraw. H]ll, 19t?7.
D B Roh!rcsrm; “Experimental Methods For Measurement Of
Phase Equlhhrla At High Pressures”: Pure and AppliedChem]stry, Vol. 6S. No. 5. pp 971-976, 19q3,
H. Vagtborg. Jr ; “Equihhrlum Vaporization Ratios Fnr A
Reservn!r FluKI Contammg A H!gb Concerr[ratmn Of IIydrngen
Scclphlde”; Trans. nf AIME, Vul. 201, 1954.
H-J Ng, D.B. Robmsrm and A-D Lecc. “Critical Phenomena In
A Mlxrure Of Methane, Carhorr Dioxide, and HydrogenSulphlde”; Fluid Phase Equillhrla, 19 ( 198S) 273-286, Elsevier
%lence Publishers
,-Table-l: Summary Of Recombined Sample Properties
w Recombined ~ C7+ Mole Saturatl On~ ~
ZYP&Fractlcm Pressure
MDT 44,72 154.56 0.1252 27,552 “P’) e1. 42.94 154.3B 0.1080 26,7533a. 42.01 157,75 0.1145 27,442 bubble3b. 44,69 154.13 0.1383 27,270 bubble4. 48,92 155. E3 0.1638 26,994 bubble5. 40, B4 148.29 0.1164 25,304 bubble5. (two) 41.00 154.18 0.1104 25,442 bubble
701

Page 12 Obtaining PVT Data For VCIY Sour Reservoirs: A Multidisciplinary Approach
Table-2 : Summaq’ Of Separator Conditions During Production Tasking
SPE 35(153
F1Ow ~ &-od SeDaratOr Separator
w& *&
End Clean 1500 62End #l 1600 56End #2 2550 50End #3 2515 46
95 3223 4235 2869 27
End #4 2210 50 76 33End Ext 1080 60 20 31
Table-3 (a): Well Effluent Compositions - Dew Point Syetem
Ideal Rate 1 Rate 2 Rate 3 Rate 42.6542 3.4875 4.1542 4. B208
57,90 57.20 57.65 58.04 58.1610.92 10.94 10.92 10.91 10.91
Extended
57,8910,9220,94
5.161.882.240.740.23
0.211321,9574
Rate 4End
4.8208
43.848.46
32.612.287,6o3.641,040.54
15,10lighter
Days
clC3H2SFC6C6H6FC11FC17FC27
Input
57.9010.9220.945.161.882.240.740.22
20.94 21.10 20.99 20.905.16 5.29
20.875.20 5.14
1.885.12
1.94 1.90 1,872.23
1.862.40 2.30 2.21 2,19
0.74 0.85 0,78 0.71 0,690.22 0.27 0.25 0.21 0.20
Separator H,S Liquid 0.1904 0.5761 1.4625Separator H,S Gas 22.1118 22.2970 22.4904
1.378822.3828
T8ble-3 (b): Well Effluent Compositions - Bubble Point System
Input Idea L Start #l Rate 1 Rate 2End End
Rate 3End
Days 2.4880 2.6542 3.4875 4.1542
cl 43.11 ‘33.04 41.63 41.99 42.63 43.’348.48
32.722,31
C3 8.50 8.50 8.56 B.55}[,s 32.83
8,5232.85 33.27 33.16
FC6 2.33 2.3332.97
2.43 2.41 2.36C6H6 7.80 7.81 8.20 8.10 7.92FC13 3.78 3.80 4.09 4.01 3.88PC20 1.09 1.09 1.19 1.16 1.12FC38 0.57 0.58 0.63 0.62 0.59
7.703,721.o60.56
C6+ 15.57 15.61 16.54 16,30 15.87heavier heavier heavier heavier
15.35lighter
Constant Composition ExpansionConstant Volume Depletion
30
LAB
Eos
20
In
s
o0 2U 40 Ml m 1(’rl
Lq.kl volume (pcrc..l)
fOgurc-2: EOS Match - MDT CVD TestFigure-l: CVD and CCE Liquid DropoutsMDT Sample
702

SPE 35653 MR. (Mike) Carlson and W.L3. (Bmcc) Cawston Page 13
I
(1.I
0.11I
[I,(MII
11(mull
“’”%S5WYL ‘ ‘ !! I II
II
i
;:’.<+_*}----- .- -- . . :::= :k>— ~ ,
‘1 ‘----- ‘ h–
/- —“.O”&m-@zmmm e
—..—.—. ~~—–---
.,m —...—.—— .,.— —— ———..— . . ...— ——~ ,’ I i:— . .-
--?v-+. mo ‘twati,ti W- * & 9= It-n .-0 la
Figure-3: Phahc Diagram - EOS Match - MDT Sample
XIco c?IC41C5C6Cnclc1c1c1c1c>c> c?c? c:c1?<l’?l 1,)11,2.1{2ClC3 nCnC C7CV ClClClCl ClCl C>C2 Q C? h{,Mc m ()-Cb/
Cm,pi,”,n[
F@src-4: Comparion Of Offsets and MDT Composition
I
(11
(11)1
U,IKII
0.CS301
Ma ! Comparison of Composition
r
J., .,., ,,
~2ccl C21C41C5C6CRcl clcl c1 c1 C2 C2 C2C2 C2 c3LydcYl 1’,11,2,1{2cl C3 UC NC cl C9 c1 cl c1cl cl C2 c1 C2 cl cl hiC hlc DC0- cl#
Flgurc-5: Comparison OfZone and Well
CiJInpunml
Compositions From Same
ml I
w
.!
.!
.!
, !!
“
Figure-6: Comparison Of CVD Rcsulls From N~ku P
703

Page 14 Olm+ining PVT DirM l% Very Sour Rcscrvom: A Mullidlwlplinary Approach SPE 35653
tf )iI
(1) 2 -1 3s0- I 011 ‘ -->
;. \
.1, . . . 6
o/
(’\
011,. \?-(~J } 411,0
(“\
011
1- 311:s
1- 112s
$
O,w ,0 24 68 10 12 14 !9 lB
P,*,. U,, [IJP.)(2) (’II,, 1- so: 1- 211’ –~(’(), I 211,()
(3) so; ,$I 311 s 12111 -.4S” I .111, ()
(4) Ii,s I s“ .-. 11,s, .-” 211 I I s: 1rigurc4k CVD Dropouts From Caroline Pool
/<: , ,/’-’..
(5) [[ )[ J-I- 2sII-~f~[~ jl -t- 2W\ ..\ ,- -“ “Q-
(()) / -. ~s’.,,, I 4s” –, >(,)1311,s
1-O.w
1,,/” /,0s
IJI
,,, / /
/’141 ,/
(7) ,<.-.~-~ - I s’)+ ,.--”~ ‘,...-s11
(8) 2\.‘ “ ‘“+ ““’- “s ‘ “-”
(9) al,, 1- 4s” I 211,()–> 411,s I (“(),
P,...ur. (UP.)
Uigure-9: EOS Malchcs - Caroline PoolFigure-7: Srdphate and Related Chemical Reactions
7
1!
;
/!-. ,’
,’-,.’ —
r-
—w:
—
/’—.
—
—\
I
0.1
z~~ 0,01
30.001
m-)()]
.
P“s#*m [kr.g](rb”,tiq
lrigurc-10: Comparison Of Production Test Cornpositions Figure-l 1: Formation Volume F~ctor - Production TestSample
704

S1’E 35653 M.R, (Mlkc) Carlson and W.D. (Bmcc] CawsIon [hge 15
I “ ....
1-}-I—.
,—____, —1,—11--1—
I I,.. 1>0 km ,$0 ~ ,~ *m +m
1.- sklw.q W4.i (.F)
Dlmcnslonlcss pressure, P,,i, = Pn/Pb
Figure-12: Proportiouutc Shape Of Formation VolumeFactor Curves
r-(,,,,,,,,,,V“tu!,lell.pl,,,<s,lICv[>)v, CWK<,,,,.,l,<2,, l[:s/
Figure-13: .%mplc Screening - Equilil]rium fblio
vs.True Boiling Point
L , w,. w..” v.,h. ,,,,<. p. y“’., /“/“
.4 ,;
4!, ..
!,, .
.,, ,,
,0,,
i,., ,, ——--—..,,., -,-,{,,., ——— -—.— ,— ..r_—_—— –_.
,, ,,,, m ,,,, ,, (,,, ,, ,,,, )!,,,,,(, ,.. ”
Figure-14:
!,, ,,,, ,, ,,” . . . .
e....”.. !,,..,
Sensitivity To Changing
,!b (,.,
1,0. . . . . (w,,
Figure-15: Effect Of Changing [IIZS] On CCE[11,S] On CVD
— .--———I
+R
-— j--f-
:_\___
,, ,...” ,.,,. !.,.., ..-. :,,., .,,,.,
I’I,,”,, r ,,,,,
Figure-16: Effect of Aromatic Content On CVD
705
‘L“L
RAE
—..—.———,-,-,,
Figure-17: EOS Mostcl Of Prosluccd GOR
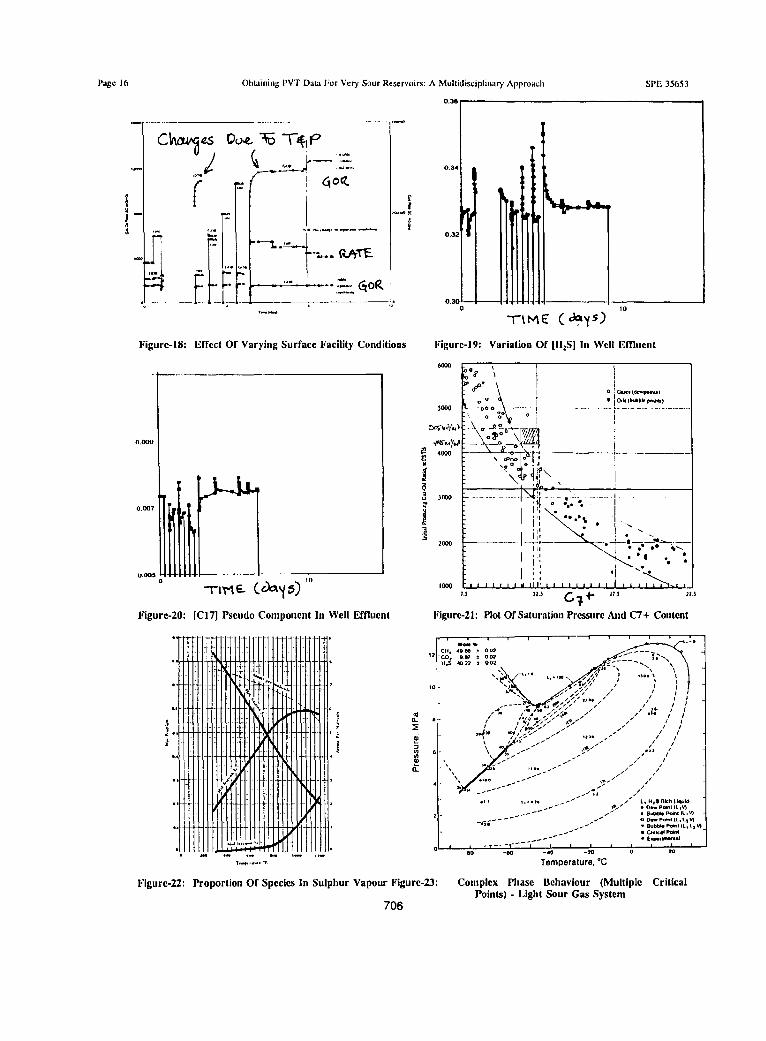
Page 16 Obtaining PVT Dara For VCV Sour Reservoirs: A Multidisciplinary Approach SPE 35653
,-
ckw’$@me% T+,Pv
a! (, L--- ‘::.,-
‘-I!L:f-
“.
1=1 I II
,.,,, . . F.,.-. . -- ,------
8-.
.lt-J-.---L’”“--- (UWE
r.. “m ““
F E .-:;%””@~_ __[,_: —_:... ...—1.
,.”. -
Figure-18: Effect Of Varying Surface Facility Conditions
O.mo
034
032
Iltlh020—0 10
-f\ME (+qslFigure-19: Variirtion Of [112S] In Well ~mucllt
6c00“# ‘\ ~
‘“\i 0 ! Gut. (em”l
Figure-20: [C17] Pseudo Component In Well Efflucnl
! ‘m F ‘- “’l’% .::”*. “- i
F4j1tf11:111t 1111j111i1111h.iL.(
Icml1,$ 11.5 G7 + ‘“ > I
Figure-21: Ilot Of Saturation Pressure And C7 + Content
Figure-22: Proportion Of Spccics In Sulphur Vapour Figure-23: Complex t%asc Uchaviour (Multiple CriticalPoints) - Light Sour Gas Systcm
706