
Observations from field to space: a new integrated high ...
1
Hyperspectral Imaging Laboratory Hyperspectral Imaging Laboratory Hyperspectral Imaging Laboratory Hyperspectral Imaging Laboratory Observations from field to space: a new integrated high-latitude hyperspectral laboratory for surface water and vegetation characterization in Alaska’s Arctic and boreal regions Jordi Cristóbal 1,2 , Marcel Buchhorn 1,3 , Anupma Prakash 1 , Patrick Graham 1 1 Hyperspectral Imaging Laboratory (HyLab), Geophysical Institute (GI), University of Alaska Fairbanks (UAF), 903 Koyukuk Dr., Fairbanks, AK 99775-7320, USA; 2 Institute of Northern Engineering Northern Engineering, University of Alaska Fairbanks (UAF), 306 Tanana Loop, Fairbanks, AK 99775-5910, USA; 3 Alaska Geobotany Center (AGC), Institute of Arctic Biology (IAB), University of Alaska Fairbanks (UAF), 902 N. Koyukuk Dr., Fairbanks, AK 99775-7000, USA; Alaska’s Arctic and boreal regions, largely dominated by tundra and boreal forest, are witnessing unprecedented changes in response to climate warming. However, the intensity of feedbacks between the hydrosphere and vegetation change are not yet well quantified in the Arctic regions. This lends considerable uncertainty to predictions of how much, how fast, and where the Arctic and boreal hydrology and ecology will change. Also unknown is how vegetation change will im- pact water resources and climate dynamics in Arctic and boreal Alas- ka. With a very sparse network of observations (meteorological, flux towers, etc) in the Alaska Arctic and boreal regions, remote sensing is the only technology capable of providing the necessary quantitative measurement for surface water and vegetation monitoring from local to global scales in a feasible economic way. Over the last decades, the University of Alaska Fairbanks (UAF) has become the research hub for high-latitude research. UAFs newly established Hyperspec- tral Imaging Laboratory (HyLab) currently provides field observations, acquisition and processing of multiplatform airborne and satellite multispectral and hyperspectral remote sensing as well as ecologi- cal modelling to help unravel seasonal and spatio-temporal variabil- ity in surface water and energy balances and vegetation biophysi- cal properties from local to global scales Arctic and boreal regions. What is the HyLab? • An NSF funded research facility at the Geophysical Institute (GI), University of Alaska Fairbanks (UAF). • Provides low-cost, in-state field-based and airborne hyper- spectral and thermal data acquisition capabilities. • Supports data acquisition, processing, and analysis for resource exploration and ecological research (see lower box for an overview of our expertises). • Coordinates education, training and public outreach activities related to technique and application of imaging spectroscopy. Would you like to know more? www.hyperspectral.alaska.edu What is hyperspectral imaging? • Also known as Imaging Spectroscopy, it is a remote sens- ing technique where images are acquired in many contigu- ous and narrow spectral regions, so that each pixel con- tains a reflectance spectrum. • Reflectance spectra provide the basis for the discrimina- tion and characterization of different target materials. • Hyperspectral imaging provides a means for detailed map- ping of materials and the derivation of physical, chemical, and biological variables with unprecedented accuracy. image data cube Each pixel contains a unique, continuous reflectance spectrum spectral dimension spatial dimension (swath) spatial dimension (flight line) imaging spectrometer 0 10 20 30 40 50 0,4 0,6 0,8 1,0 1,2 1,4 1,6 1,8 2,0 2,2 2,4 reflectance (%) wavelength (µm) multi-spectral bands e.g. LANDSAT hyper-spectral bands e.g. EnMAP green vegetation spectrum soil spectrum soil vegetation The National Science Foundation (NSF) Major Research Instrumentation (MRI) Program, funded the University of Alaska Fairbanks (UAF), to establish hyperspectral imaging capabilities in the State of Alaska (NSF grant number 1338193). The MRI enables UAF to establish a new capability in airborne hyperspectral imaging that has not previously existed, and inherently opens doors to new basic and applied research, and research training. Surface energy balance research activities are based in part upon work supported by the Alaska NASA EPSCoR Program (projects NNX13AB28A and NNX10AN02A). We also want to acknowl- edge the support of Alaska EPSCoR NSF award #OIA-1208927 and the state of Alaska. Our tools The HySpex instrument • VNIR-1800 and SWIR-384 cameras (400 - 2,500 nm); • pushbroom HS cameras with low stray light levels, low sensitivity to polarization, and low smile and keystone effects; • across track FOV of 17° and 16° respectively that can be increased to 34° and 32° (using a FOV expander). In airborne mode the instrument: • is mounted with a passive vibration dampening to an Aviat Husky A-1B airplane or similar airplanes (Beaver, Bushhawk, etc.); • is connected to an IMAR iTrace RT-F400 IMU/GPS (Inertial Measure- ment Unit / Global Positioning System) unit; • is controlled by a compact, high-performance data acquisition unit (DAU), connected with a 1 terabyte solid state drive and a compact, touch screen flat-panel monitor. In the field configuration: • the two HS cameras are mounted on an automated rotation stage af- fixed to a surveyors-grade tripod; • the horizontal swaths of HS data are possible for targets at a distance of ~3 meters to hundred’s meters; • a rugged, field portable data acquisition unit is used to control the rota- tion stage and cameras during in-situ imaging; • power supply is provided by a generator. The FLIR instrument • FLIR A325sc Infrared Camera (7.5 - 13.0 µm). • HFOV and VFOV of 25° and 18.8°, respectively. The PSR+3500 Spectro-Radiometer • Fast, full-spectrum UV-VIS-NIR measurements (350 - 2,500 nm); • high Resolution Field Portable Spectroradiometer with 512 element Si array and two 256 element extended InGaAs arrays; • various optics ranging from 1° to 25° for reflectance, radiance and irradiance measurments. Field-based operation: • the PSR+ spectro-radiometer is powered by batteries and connected to a rugged PDA which provides GPS, photo tagging, and voice notes; • our self-developed software allows in-field mineral identification and classification; • usage of handheld contact probe allows field measurements on out- crops or mapping open pits even at cloudy conditions. Laboratory operation: • high signal-to-noise ratio for improved reflectance values by using full- range tungsten lamps; • detailed analysis of field samples in order to build Arcitc spectral librar- ies from natural covers. Minerals Oil spills Wildfires Acid mine drainage Wildlife Forestry Taiga Tundra Lakes Terrestrial and Aquatic Ecosystems Terrestrial and Aquatic Ecosystems Natural Resources Natural Resources Forests Permafrost U.S. Fish & Wildlife Service Bush Hawk XP. Photo by J. Cristóbal Pre-flight camera initialization. Photo by J. Cristóbal. Fairbanks Yukon Flats UAF Preparation of the HySpex instrument for an overflight. Photo by J. Cristóbal Imaging spectroscopy for vegetation mapping and analyses Surface energy balance modeling in Arctic and sub-Arctic ecosystems • Establishment of two flux towers in Inerior Alaska’s birch (Caribou Poker Creek Research Watershed, CP- CRW) and black spruce for- ests (University of Alaska Fairbanks, UAF). • Data collection since 2011 • Modeling regional surface energy fluxes in Arctic tun- dra (Imnavait) and Boreal forest (CPCRW and UAF) using a thermal-based remote sensing model (TSEB and DTD). UAF CPCRW • TSEB results in Imanvait AON flux towers from 2008 to 2012. Rn is net ra- diation, LE is latent heat, H is sensible heat and G is soil heat fluxes. LOCAL SCALE TSEB Tower fluxes CAL/VAL REGIONAL SCALE TSEB DTD Input data from flux towers and field work èRs, LST, Ta, wind, LAI Input data from remote sensing (LST, LAI) and reanalysis (Rs, Ta, wind) Surface energy fluxes mapsè RN, H, LE, G Surface energy fluxes plot è RN, H, LE, G
Transcript of Observations from field to space: a new integrated high ...
Hyperspectral Imaging LaboratoryHyperspectral Imaging LaboratoryHyperspectral Imaging LaboratoryHyperspectral Imaging Laboratory
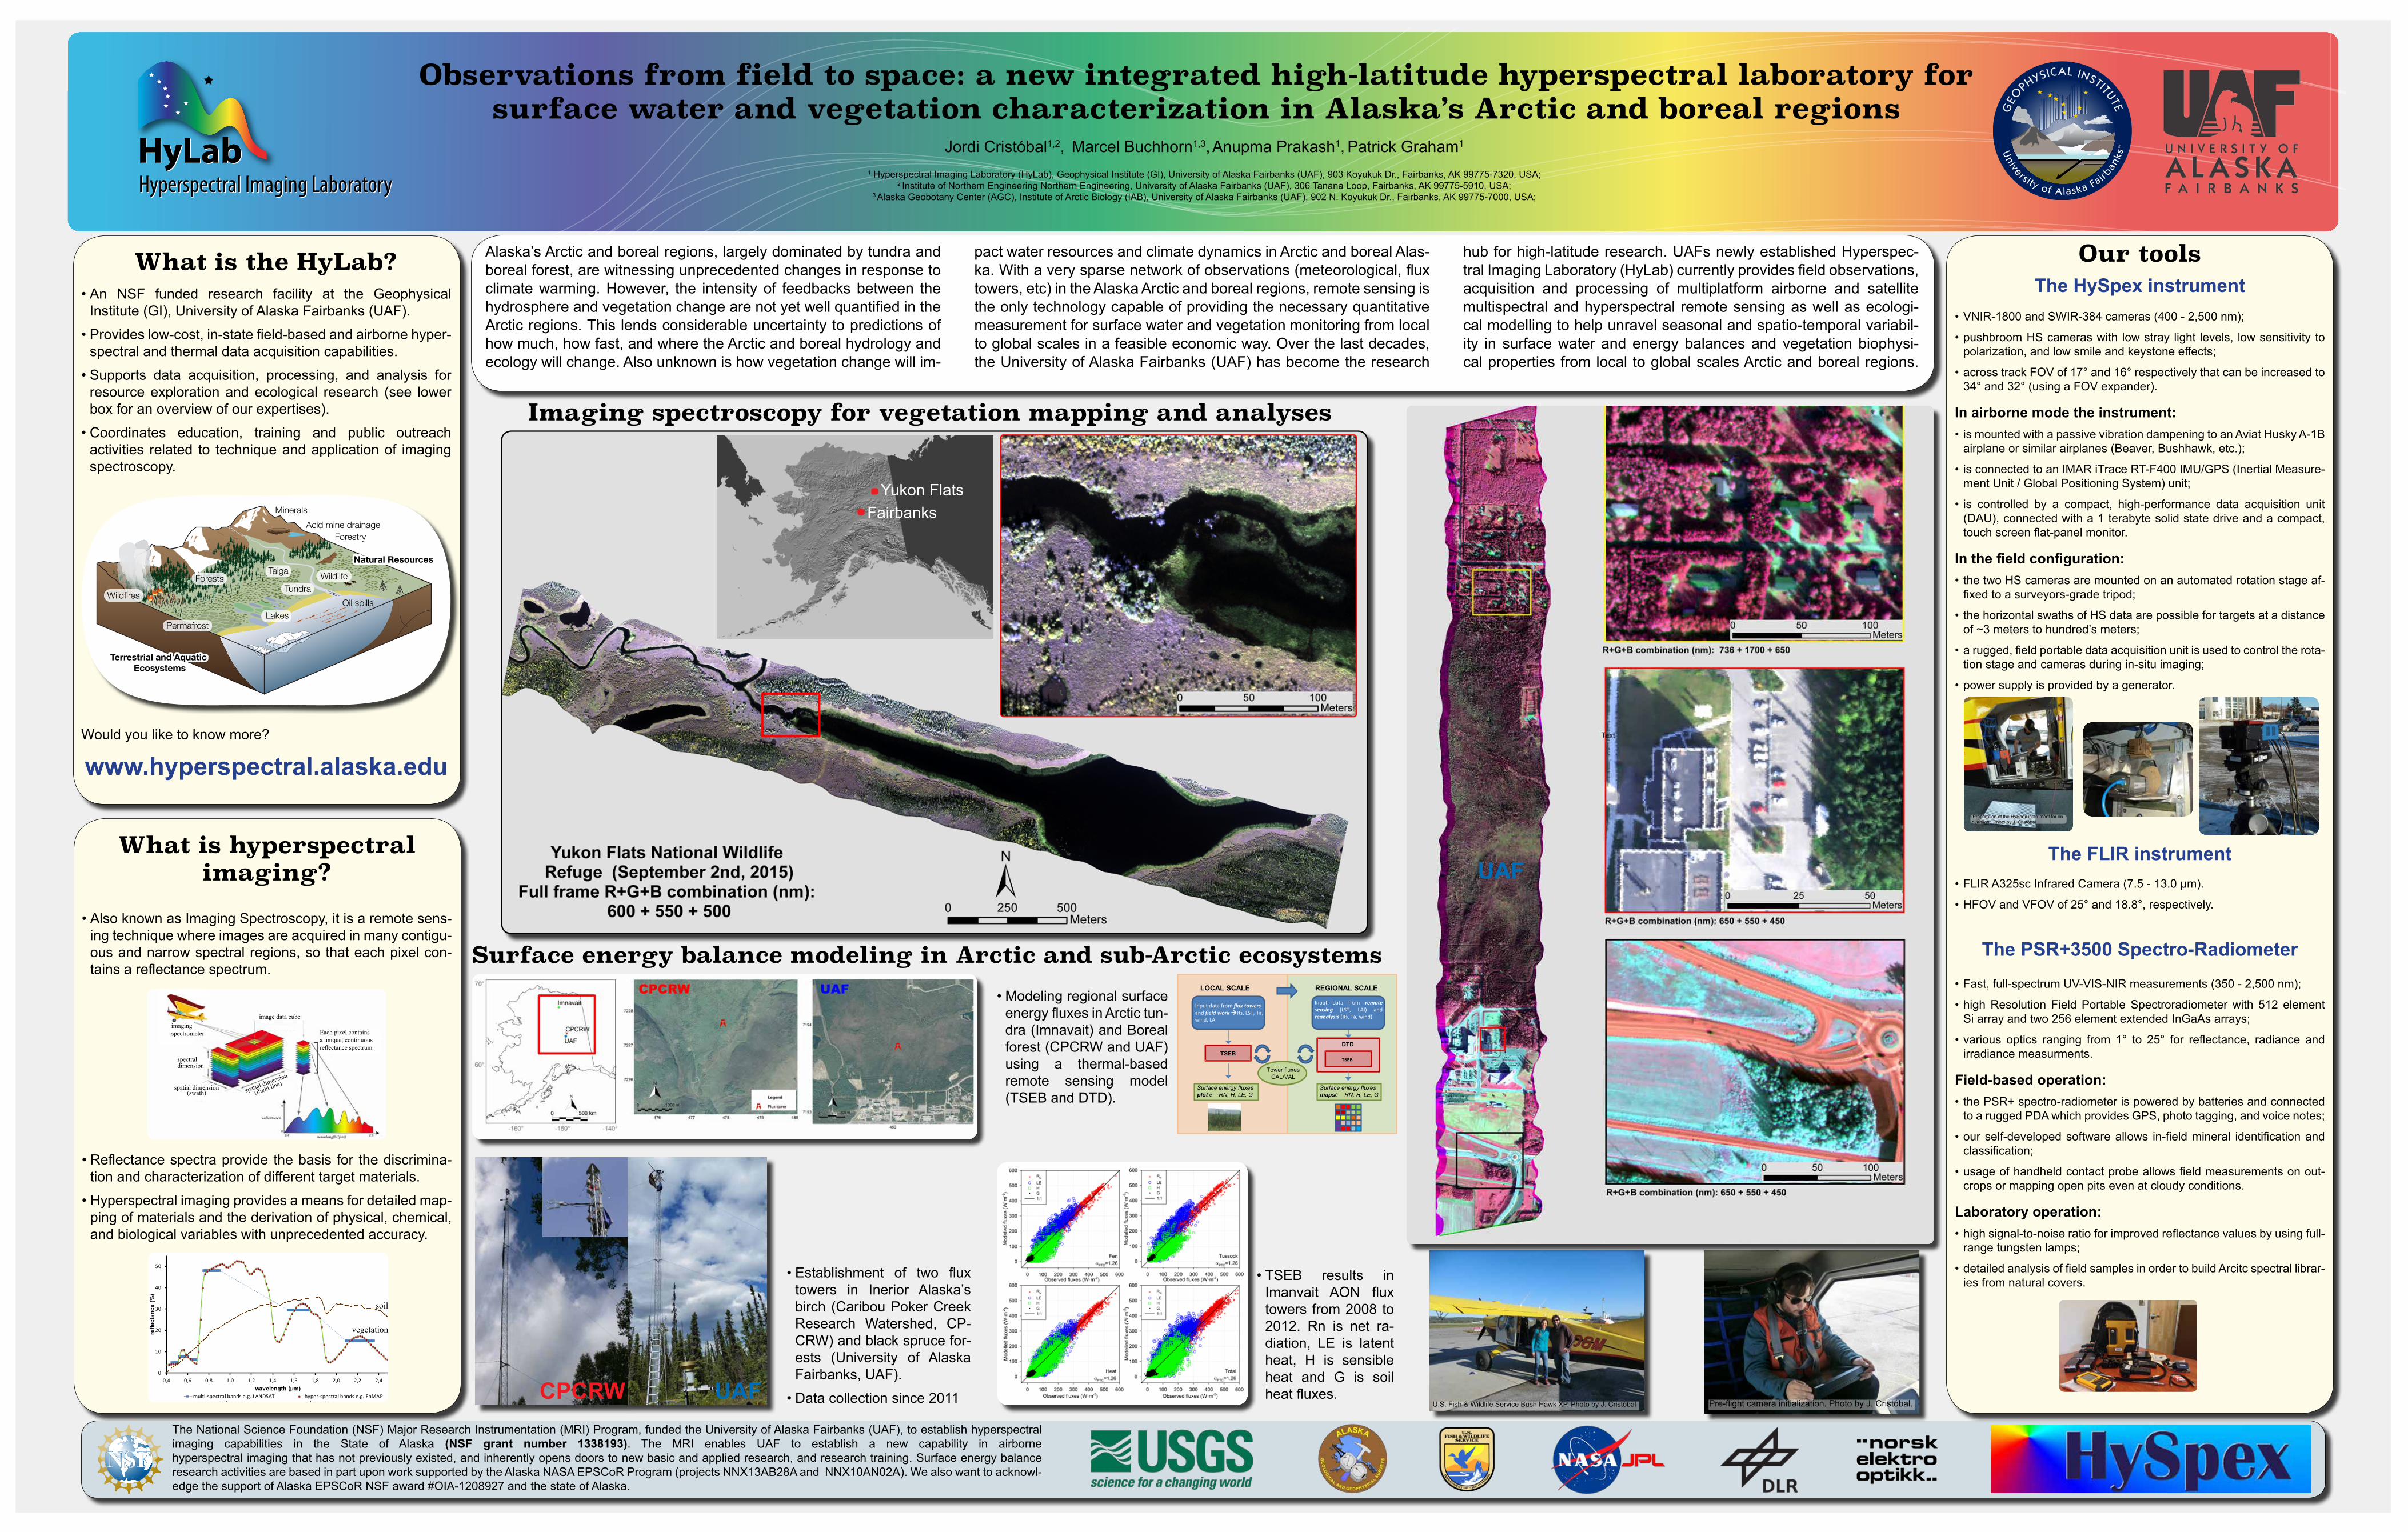
Observations from field to space: a new integrated high-latitude hyperspectral laboratory for surface water and vegetation characterization in Alaska’s Arctic and boreal regions
Jordi Cristóbal1,2, Marcel Buchhorn1,3, Anupma Prakash1, Patrick Graham1
1 Hyperspectral Imaging Laboratory (HyLab), Geophysical Institute (GI), University of Alaska Fairbanks (UAF), 903 Koyukuk Dr., Fairbanks, AK 99775-7320, USA;2 Institute of Northern Engineering Northern Engineering, University of Alaska Fairbanks (UAF), 306 Tanana Loop, Fairbanks, AK 99775-5910, USA;
3 Alaska Geobotany Center (AGC), Institute of Arctic Biology (IAB), University of Alaska Fairbanks (UAF), 902 N. Koyukuk Dr., Fairbanks, AK 99775-7000, USA;
Alaska’s Arctic and boreal regions, largely dominated by tundra and boreal forest, are witnessing unprecedented changes in response to climate warming. However, the intensity of feedbacks between the hydrosphere and vegetation change are not yet well quantified in the Arctic regions. This lends considerable uncertainty to predictions of how much, how fast, and where the Arctic and boreal hydrology and ecology will change. Also unknown is how vegetation change will im-
pact water resources and climate dynamics in Arctic and boreal Alas-ka. With a very sparse network of observations (meteorological, flux towers, etc) in the Alaska Arctic and boreal regions, remote sensing is the only technology capable of providing the necessary quantitative measurement for surface water and vegetation monitoring from local to global scales in a feasible economic way. Over the last decades, the University of Alaska Fairbanks (UAF) has become the research
hub for high-latitude research. UAFs newly established Hyperspec-tral Imaging Laboratory (HyLab) currently provides field observations, acquisition and processing of multiplatform airborne and satellite multispectral and hyperspectral remote sensing as well as ecologi-cal modelling to help unravel seasonal and spatio-temporal variabil-ity in surface water and energy balances and vegetation biophysi-cal properties from local to global scales Arctic and boreal regions.
What is the HyLab?• An NSF funded research facility at the Geophysical
Institute (GI), University of Alaska Fairbanks (UAF).
• Provides low-cost, in-state field-based and airborne hyper-spectral and thermal data acquisition capabilities.
• Supports data acquisition, processing, and analysis for resource exploration and ecological research (see lower box for an overview of our expertises).
• Coordinates education, training and public outreach activities related to technique and application of imaging spectroscopy.
Would you like to know more?
www.hyperspectral.alaska.edu
What is hyperspectral imaging?
• Also known as Imaging Spectroscopy, it is a remote sens-ing technique where images are acquired in many contigu-ous and narrow spectral regions, so that each pixel con-tains a reflectance spectrum.
• Reflectance spectra provide the basis for the discrimina-tion and characterization of different target materials.
• Hyperspectral imaging provides a means for detailed map-ping of materials and the derivation of physical, chemical, and biological variables with unprecedented accuracy.
image data cube
Each pixel contains a unique, continuous reflectance spectrum
spectraldimension
spatial dimension(swath) spatial dimension
(flight line)
imagingspectrometer
0
10
20
30
40
50
0,4 0,6 0,8 1,0 1,2 1,4 1,6 1,8 2,0 2,2 2,4
refle
ctan
ce (%
)
wavelength (µm)multi-spectral bands e.g. LANDSAT hyper-spectral bands e.g. EnMAPgreen vegetation spectrum soil spectrum
soil
vegetation
The National Science Foundation (NSF) Major Research Instrumentation (MRI) Program, funded the University of Alaska Fairbanks (UAF), to establish hyperspectralimaging capabilities in the State of Alaska (NSF grant number 1338193). The MRI enables UAF to establish a new capability in airbornehyperspectral imaging that has not previously existed, and inherently opens doors to new basic and applied research, and research training. Surface energy balance research activities are based in part upon work supported by the Alaska NASA EPSCoR Program (projects NNX13AB28A and NNX10AN02A). We also want to acknowl-edge the support of Alaska EPSCoR NSF award #OIA-1208927 and the state of Alaska.
Our toolsThe HySpex instrument
• VNIR-1800 and SWIR-384 cameras (400 - 2,500 nm);
• pushbroom HS cameras with low stray light levels, low sensitivity to polarization, and low smile and keystone effects;
• across track FOV of 17° and 16° respectively that can be increased to 34° and 32° (using a FOV expander).
In airborne mode the instrument:• is mounted with a passive vibration dampening to an Aviat Husky A-1B
airplane or similar airplanes (Beaver, Bushhawk, etc.);
• is connected to an IMAR iTrace RT-F400 IMU/GPS (Inertial Measure-ment Unit / Global Positioning System) unit;
• is controlled by a compact, high-performance data acquisition unit (DAU), connected with a 1 terabyte solid state drive and a compact, touch screen flat-panel monitor.
In the field configuration:• the two HS cameras are mounted on an automated rotation stage af-
fixed to a surveyors-grade tripod;
• the horizontal swaths of HS data are possible for targets at a distance of ~3 meters to hundred’s meters;
• a rugged, field portable data acquisition unit is used to control the rota-tion stage and cameras during in-situ imaging;
• power supply is provided by a generator.
The FLIR instrument• FLIR A325sc Infrared Camera (7.5 - 13.0 µm).
• HFOV and VFOV of 25° and 18.8°, respectively.
The PSR+3500 Spectro-Radiometer • Fast, full-spectrum UV-VIS-NIR measurements (350 - 2,500 nm);
• high Resolution Field Portable Spectroradiometer with 512 element Si array and two 256 element extended InGaAs arrays;
• various optics ranging from 1° to 25° for reflectance, radiance and irradiance measurments.
Field-based operation:• the PSR+ spectro-radiometer is powered by batteries and connected
to a rugged PDA which provides GPS, photo tagging, and voice notes;
• our self-developed software allows in-field mineral identification and classification;
• usage of handheld contact probe allows field measurements on out-crops or mapping open pits even at cloudy conditions.
Laboratory operation:• high signal-to-noise ratio for improved reflectance values by using full-
range tungsten lamps;
• detailed analysis of field samples in order to build Arcitc spectral librar-ies from natural covers.
Minerals
Oil spillsWildfires
Acid mine drainage
Wildlife
Forestry
Taiga
Tundra
Lakes
Terrestrial and Aquatic Ecosystems
Terrestrial and Aquatic Ecosystems
Natural ResourcesNatural Resources
Forests
Permafrost
U.S. Fish & Wildlife Service Bush Hawk XP. Photo by J. Cristóbal Pre-flight camera initialization. Photo by J. Cristóbal.
FairbanksYukon Flats
UAF
Preparation of the HySpex instrument for an overflight. Photo by J. Cristóbal
Imaging spectroscopy for vegetation mapping and analyses
Surface energy balance modeling in Arctic and sub-Arctic ecosystems
• Establishment of two flux towers in Inerior Alaska’s birch (Caribou Poker Creek Research Watershed, CP-CRW) and black spruce for-ests (University of Alaska Fairbanks, UAF).
• Data collection since 2011
• Modeling regional surface energy fluxes in Arctic tun-dra (Imnavait) and Boreal forest (CPCRW and UAF) using a thermal-based remote sensing model (TSEB and DTD).
UAFCPCRW
• TSEB results in Imanvait AON flux towers from 2008 to 2012. Rn is net ra-diation, LE is latent heat, H is sensible heat and G is soil heat fluxes.
LOCAL SCALE
TSEB
Tower fluxesCAL/VAL
REGIONAL SCALE
TSEB
DTD
Input data from flux towersand field workèRs, LST, Ta, wind, LAI
Input data from remotesensing (LST, LAI) andreanalysis (Rs, Ta, wind)
Surface energy fluxes mapsè RN, H, LE, G
Surface energy fluxes plot è RN, H, LE, G


