
Observational Learning: Evidence from a...
24
Observational Learning: Evidence from a Randomized Natural Field Experiment By Hongbin Cai, Yuyu Chen, and Hanming Fang March 10, 2008 Abstract We report results from a randomized natural eld experiment conducted in a restaurant dining setting to distinguish the observational learning e/ect from the saliency e/ect. We nd that, when customers are given ranking information of the ve most popular dishes, the demand for those dishes increases by 13 to 20 percent. We do not nd a signicant saliency e/ect. We also nd modest evidence that the observational learning e/ects are stronger among infrequent customers, and that dining satisfaction is increased when customers are presented with the information of the top ve dishes, but not when presented with only names of some sample dishes. (JEL D83, C93) Cai and Chen: Guanghua School of Management and IEPR, Peking University, Beijing, China (emails: hb- [email protected], [email protected]); Fang: Department of Economics, Duke University, 213 Social Sciences Building, Box 90097, Durham, NC 27708-0097, and NBER (email: [email protected]). The Institute for Social and Policy Studies (ISPS) at Yale University funded this project. We are most grateful to Donald Green, Director of ISPS, for his important suggestions regarding the experimental design and general guidance about eld experiments. We would also like to thank Paul Dudenhefer, Dean Karlan, Enrico Moretti, Emmanuel Saez, Lan Shi and especially three anonymous referees and Editor Vincent Crawford for helpful comments. Finally, we thank the managers in Mei Zhou Dong Po restaurant chain for their enthusiastic participation and cooperation in this eld experiment. All remaining errors are ours.
Transcript of Observational Learning: Evidence from a...
Observational Learning: Evidence from a Randomized Natural
Field Experiment
By Hongbin Cai, Yuyu Chen, and Hanming Fang�
March 10, 2008
Abstract
We report results from a randomized natural �eld experiment conducted in a restaurant
dining setting to distinguish the observational learning e¤ect from the saliency e¤ect. We �nd
that, when customers are given ranking information of the �ve most popular dishes, the demand
for those dishes increases by 13 to 20 percent. We do not �nd a signi�cant saliency e¤ect. We
also �nd modest evidence that the observational learning e¤ects are stronger among infrequent
customers, and that dining satisfaction is increased when customers are presented with the
information of the top �ve dishes, but not when presented with only names of some sample
dishes. (JEL D83, C93)
�Cai and Chen: Guanghua School of Management and IEPR, Peking University, Beijing, China (emails: hb-
[email protected], [email protected]); Fang: Department of Economics, Duke University, 213 SocialSciences Building, Box 90097, Durham, NC 27708-0097, and NBER (email: [email protected]). The Institute
for Social and Policy Studies (ISPS) at Yale University funded this project. We are most grateful to Donald Green,
Director of ISPS, for his important suggestions regarding the experimental design and general guidance about �eld
experiments. We would also like to thank Paul Dudenhefer, Dean Karlan, Enrico Moretti, Emmanuel Saez, Lan Shi
and especially three anonymous referees and Editor Vincent Crawford for helpful comments. Finally, we thank the
managers in Mei Zhou Dong Po restaurant chain for their enthusiastic participation and cooperation in this �eld
experiment. All remaining errors are ours.
Social learning has attracted increasing attention in the economics literature. The general
concept of social learning encompasses many mechanisms through which individuals may learn
from others. In particular, it includes the mechanism in which individuals learn from each other
through direct (formal or informal) communications; it also includes the mechanism of observational
learning where the behavior of individuals is in�uenced by their observation of other people�s choices
because of the information contained therein.1
Convincing empirical evidence about the importance of observational learning is not only rele-
vant for the theoretical literature in economics, it also has policy implications. The key di¤erence
between direct communications and observational learning as channels of social learning lies in
whether temporal, spatial and social proximity among individuals is important for learning to
occur. Observational learning can take place as long as the underlying decision problems faced
by individuals are similar; in contrast, learning from others via direct communications requires
individuals to be close in time, space and social distance. As a result, if a policy maker wants
to, say, expedite the adoption of an advantageous technology, an information campaign about the
technology�s popularity among other groups of agents will be e¤ective if observational learning is
important, but will not be e¤ective if instead direct communication is the main channel of social
learning.
Despite the intuitive appeal of observational learning, to empirically establish that an individ-
ual�s decisions are a¤ected by the observation of others�choices because of its informational content
is complicated by at least two plausible confounding mechanisms. The �rst is the saliency e¤ect.
The term �saliency� is widely used in the perceptive and cognitive psychology literature to refer
to any aspect of a stimulus that, for whatever reason, stands out from the rest.2 Observing oth-
ers�choices could make those choices more salient than the alternatives. When consumers are not
aware of their entire choice set, the di¤erential salience of the elements in the choice set may a¤ect
the decision-maker�s choices.3 As a result, a consumer may follow others�choices because they are
more salient.4 The second confounding mechanism is the conformity e¤ect, that is, individuals may
adopt the observed choices of others because they want to conform.5
1Albert Bandura (1977) wrote the pioneering book in psychology that started the research on social and obser-
vational learning. Abhijit Banerjee (1992) and Sushil Bikhchandani, David Hirshleifer and Ivo Welch (1992) are
the seminal works in the economics literature on observational learning. Christophe P. Chamley (2004) provides a
textbook treatment of the topic.2See, for example, Douglas L. Medin and Brian H. Ross (1997).3See Jing Li (2006) and David S. Ahn and Haluk Ergin (2007) for decision-theoretical models of unawareness.4Note that saliency e¤ect is also an informational e¤ect. The key di¤erence between observational learning and
saliency e¤ect is that the information is about the characteristics of the choices in the former, while it is about the
choice set itself in the latter.5The classic social psychology experiments documenting conformity in individuals� judgment are reported in
Solomon E. Asch (1951, 1955). Morton Deutsch and Harold B. Gerard (1955) attempted to distinguish conformity
and informational social in�uences on individual judgment. Robert B. Cialdini and Noah J. Goldstein (2004) reviewed
the social in�uence literature in psychology. B. Douglas Bernheim (1994) discussed many conformity experiments
and o¤ered an economic model of conformity.
1
The goal of this paper is to provide direct evidence of observational learning using a randomized
natural �eld experiment in a restaurant dining setting in Beijing, China.6 The restaurant we choose
for our experiment has a thick menu with about 60 hot dishes. In our experimental design, detailed
in Section II, we randomly expose diners to one of three information conditions: in the control
tables, we do not give diners any additional information about the dishes other than what is
contained in the menu; in �ranking treatment�tables, diners are provided with a display with the
names of the �top �ve�dishes sorted by the actual number of plates sold in the previous week; and
in �saliency treatment�tables, diners are provided with a plaque simply listing the names of �ve
�sample dishes.�We analyze how the information conditions a¤ect the choices of customers. The
three information conditions allow us to separately estimate the saliency e¤ect and the observational
learning e¤ect. Note that our experimental design does not directly address the conformity channel.
We would like to argue that the choice of restaurant dining as our experimental setting and the fact
that information provided to the current customers is about the choices of past customers likely
make this channel less important.7 ; 8
To understand why Chinese restaurant dining is an almost ideal setting for our experiments, it
is useful to start with a brief introduction about social customs about dining in China. The most
important and distinctive feature of dining in China is that typically diners at a table share dishes,
and one person is in charge of making the dish selections as well as paying for the whole group�s
bill.9 Sharing the bill or separate billing is not common.10 This fact is crucial because it allows us
to use each dining party, or the table, as the unit of our analysis.
We choose restaurant dining as the setting for our experiment for two main reasons. First, in
order to distinguish observational learning from learning via direct communications, it is crucial
that we be generally con�dent that the subjects are not involved in any direct communications with
others. In a particular outing, diners typically choose dishes without communicating with other
diners other than those at their own table. They are certainly unable to communicate with past
customers; thus we do not have to be concerned about direct communication occurring beyond our
observation.11 Second, for observational learning to take place, it is important that there be some
6See Glenn W. Harrison and John A. List (2004) and List (2007) for surveys and methodological discussions, in-
cluding categorizations, of the surging literature of �eld experiments. A website http://www.fieldexperiments.com
maintained by List provides a useful categorization as well as comprehensive and updated list of papers in this
literature.7As is well-known since Asch (1955), conformity pressure seems to exert the most in�uence when individuals are
forming opinions in the presence and visibility of others.8 It is our maintained assumption that individuals are unlikely to order certain dishes that were popular with other
customers in the past due to conformity motives. We do not yet know of a clean design to separate observational
learning from the conformity e¤ect.9The exception is formal business dining, in which the �host�usually does the ordering and his/her subordinate
pays the bill. We deleted large bills suspected to be formal business dining in our analysis for this reason (see footnote
22 for more details).10The social norm is that friends take turns paying the bills for the group in repeated interactions.11Notice that the conversations that may occur within a table are not an issue because we are using the table as
the unit of our analysis, which is justi�ed by the Chinese dining custom we explained above.
2
commonality in the decision problems of the subjects and others; diners, though with potentially
di¤erent tastes, all care about the common quality of the dishes. Restaurant dining also o¤ers
other advantages. First, because of computerization, it is very easy to obtain information about
diners�choices; second, it is relatively easy to implement randomized treatments in terms of diners�
information set; third, we can observe the treatment e¤ects of information displays on subjects�
choices accurately and instantly; fourth, we can survey on the spot the e¤ect of information displays
on customers�subjective dining experience.12
Our experiment was conducted in a Szechuan restaurant chain �Mei Zhou Dong Po� (MZDP).
MZDP is a restaurant chain with 13 sites in Beijing. Each location has an average of 50 tables; all
locations have identical menus with about 60 hot dishes (and many additional cold dishes); however,
the popularity of dishes varies by locations. The restaurant is medium-scale both in quality and
price, popular for both leisure and ordinary business dining.
We �nd that, depending on the speci�cations, the demand for the top 5 dishes is increased
by an average of about 13 to 20 percent when the top 5 popularity rankings are revealed to the
customers; in contrast, being merely mentioned as some sample dishes does not signi�cantly boost
their demand. Moreover, we �nd some modest evidence that the observational learning e¤ect
is stronger among infrequent customers, and that customers� subjective dining experiences are
improved when presented with the information about the top choices by other consumers, but not
when presented with the names of some sample dishes.
The remainder of the paper is structured as follows. Section I summarizes the related literature;
Section II describes our experimental design; Section III describes the data and two identi�cation
strategies; Section IV presents the results; and Section V concludes.
I. Related Literature
Our paper is mostly related to a paper by Matthew J. Salganik, Peter S. Dodds and Duncan J.
Watts (2006). In an arti�cial music market, subjects (recruited from visitors to a particular website)
are shown a menu of forty-eight songs sorted either randomly or by the number of downloads, and
they are asked to listen to, rate and download as many songs as they wished. Their focus is on
how social in�uence may lead to unpredictable outcomes for popular cultural products. Our paper
di¤ers from theirs in at least two respects. First, their experimental design does not distinguish the
informational content of the download rankings from the saliency e¤ect. Second, conformity e¤ects
are likely more severe in their setting. Social in�uence is an important determinant of the demand
for popular cultural products because shared experience is a major component of the utility from
consuming such goods; in contrast, restaurant dining is a more private experience. Another related
study is by Catherine Tucker and Juanjuan Zhang (2007). They use a �eld experiment on the
internet-portal for wedding service vendors to examine whether popularity rankings for the vendors
in terms of past clicks a¤ect customers�clicking behavior. They are mostly interested in whether
12We indeed conducted a short survey at the end of the meals (see Section II for details).
3
the internet leads to a �long tail�e¤ect, i.e., more customers buy the low-volume products; but they
also attempted to distinguish observational learning from the saliency e¤ect. A major di¤erence
from our paper, however, is that in their experimental design, di¤erent information conditions were
implemented in di¤erent wedding service categories; thus they had to rely on comparisons across
di¤erent service categories to isolate the observational learning e¤ect.
There are also several papers that examined social learning and informational cascades in lab-
oratory settings (for example, Lisa R. Anderson and Charles A. Holt 1997; Bo¼gaçhan Çelen and
Shachar Kariv 2004). Jonathan E. Alevy, Michael S. Haigh and List (2007) compare the behavior
of professional traders from the Chicago Board of Trade and student subjects in arti�cial laboratory
experiments similar to those of Anderson and Holt (1997). These experiments all have very simple
choice sets; thus the saliency of alternatives is not subject to manipulation by the researchers.
There is also a large empirical literature attempting to identify and quantify the e¤ect of social
learning generally on individuals�choices in a variety of contexts. This turns out to be a notoriously
di¢ cult empirical exercise due to the identi�cation problems that have been eloquently described
by Charles Manski (1993, 2000). The main issue is to distinguish social learning from common
unobserved individual characteristics, which Manski (1993) called �the re�ection problem�or �cor-
related e¤ects.�The existing empirical literature addresses this issue using di¤erent strategies with
varying degrees of success.13 One approach is to examine the di¤erent implications of social learn-
ing and common unobservable shock. For example, Conley and Udry (2005) show that pineapple
farmers in Ghana imitate the choices of fertilizer quantity of their �information neighbors�(instead
of �geographical neighbors�) when these neighbors have a good harvest, and move further away
from their decisions when they experience a bad harvest. They argue that this is not due to corre-
lated shock by showing that the choices made on an established crop (maize-cassava intercropping)
for which no learning is necessary do not exhibit the same pattern. A second approach is to exploit
the panel nature of the data to control for the common unobservables using �xed e¤ects under the
assumption that the common unobservables are not time-varying. An example of this approach is
Sorensen (2006) who examine the health plan choices of University of California employees where he
showed that social e¤ects still exist after controlling for department �xed e¤ects. A third and more
recent approach is via randomized experiment where �treatment�(which di¤ers in di¤erent papers)
is randomly assigned to individuals and then behavior of others who are more or less connected to
the treated individuals is measured. For example, Du�o and Saez (2003) randomly assign di¤erent
information sessions about 401k options to individuals and �nd that their 401k participation de-
13An incomplete list of studies of social learning e¤ects includes, in the context of crime (Edward L. Glaeser, Bruce
Sacerdote and José Scheinkman 1996), contraception (Kaivan Munshi and Jacques Myaux 2006), adoption of seeds,
fertilizer and other technologies (Timothy Besley and Anne Case 1994; Andrew D. Foster and Mark R. Rosenzweig
1995; Timothy G. Conley and Christopher Udry 2007; Michael Kremer and Ted Miguel 2003), labor market outcomes
(Patrick Bayer, Stephen L. Ross and Giorgio Topa 2005), retirement saving plan choices (Esther Du�o and Emmanuel
Saez 2002), health insurance plan (Alan T. Sorensen 2006), consumer demand (Markus M. Mobius, Paul Niehaus
and Tanya S. Rosenblat 2005; Enrico Moretti 2008) and voting in sequential primaries (Brian Knight and Nathan
Schi¤ 2007).
4

cisions have signi�cant e¤ects on their coworkers, consistent with their non-experimental evidence
(Du�o and Saez 2002).14 None of the above papers, however, attempts to distinguish observational
learning from other forms of social learning. That is, the literature does not try to ask whether
one�s behavior is impacted by others because he/she observed others�choices only, or whether they
communicated and shared information in a more personal manner.15
II. Experimental Design
Experimental Design. In our experiment, diners are randomly assigned to tables with three
di¤erent information conditions. We �rst describe these information conditions and then explain
the two-stage randomization that we implement in the �eld experiment.
The �rst group of tables are the �control� tables where no additional information about thedishes other than the regular menu is displayed on the tables. The second group are the �rankingtreatment� tables where we place a 19 cm by 12 cm plastic plaque on the table displaying the
names of the �ve most popular dishes sorted by the actual number of plates sold in the previous
week in that location, with the No. 1 dish listed on top. The actual numbers of plates sold are
not displayed. Note that the top 5 rankings may di¤er by locations. The third group of tables
are called the �saliency treatment� tables where we place a same-size plastic plaque on the tabledisplaying the names of �ve sample dishes from the menu, sequenced in a random order.16 In order
to assess whether the saliency e¤ect di¤ers by the popularity of dishes, we choose to include the
names of the actual top 3 dishes at that site (without being revealed as such) together with two
other randomly selected dishes.17
We implemented a two-stage randomization strategy where the �rst-stage randomization was
at the level of restaurant sites, and the second stage was at the level of tables within a site.
Speci�cally, in the �rst stage, we randomly selected 5 locations where tables in each location
were subsequently randomized into control tables and ranking treatment tables; and we randomly
selected 4 other locations where tables in each location were subsequently randomized into control
tables and saliency treatment tables.18
It is useful to comment on our choice of the two-stage randomization described above, instead of
a single-stage randomization at the table level. The key issue for a single-stage randomization at the
table level is that it will lead to the presence of all three information conditions (control, ranking, and
14However, in several other settings, randomized �eld experiments yield results that substantially di¤er from those
that would have been obtained with other econometric methodologies (see, e.g., Kremer and Miguel 2004).15Mobius, Niehaus and Rosenblat (2005) is an exception. They attempt to disentangle social learning in the
strong form (direct information sharing) and the weak form (observational learning). Their experimental treatment,
however, includes both forms of social learning and thus they have to rely on a structural model to disentangle them.16See an online appendix for images of these plastic plaque displays. The information display stayed on the tables
during the whole experiment period.17We do not �nd that the small saliency e¤ect is any stronger for the top 3 dishes. See Section IV.A for detailed
discussions.18We did not use all of the 13 sites because we initially planned on another treatment.
5

Ranking Treatment Locations
(5 Locations)
Saliency Treatment Locations
(4 Locations)
Panel A: Pre-experiment Period
Control Tables No Display No Display
Treatment Tables No Display No Display
Panel B: Experiment Period
Control Tables No Display No Display
Treatment TablesDisplay a plaque showing the names
of the �ve most popular dishes
Display a plaque showing the names
of �ve sample dishes
Table 1: Experimental Design.Notes: The names of the �ve most popular dishes were displayed in the order of their rankings with No. 1 listed �rst;
the actual numbers of plates sold in the previous week were not displayed. The �ve sample dishes always included the
actual top 3 dishes (without being revealed as such) and two other randomly selected dishes. They were displayed in
random order.
saliency treatments) in the same location. This is desirable from the statistical point of view because
it permits the estimation of the di¤erence between the overall ranking treatment e¤ect and the
saliency e¤ect without having to assume that ranking and saliency treatment locations are similar in
unobservable dimensions, an assumption that is necessary for the two-stage randomization strategy
(see Section III for more discussions). However, the presence of three information conditions in
a single location leads to serious practical di¢ culties, as the managers of the restaurant chain
expressed the concern that this would create confusion among waiters and waitresses, as well as in
record keeping. We are also concerned that customers may raise suspicions about the restaurant�s
intention if they found out about the two di¤erent displays in the same location. We adopt the
two-stage randomization strategy due to these practical reasons.
Pre-Experiment Period Data Collection. An important component of our experimental de-
sign is data collection in the week prior to the introduction of any informational treatments. After
randomly selecting the locations for the ranking and saliency treatments (the �rst-stage random-
ization), we randomly assigned tables in each of the selected locations into control and treatment
tables (the second-stage randomization). We then collected data on the diners�choices for each
location for the week of October 16-22, 2006 (which we will call the �pre-experiment period�from
now on), before we implemented the ranking and saliency treatments in the week of October 23-30,
2006 (which we will call the �experiment period�hereafter).19
The data collected during the pre-experiment period serves three separate purposes. First, we
19The restaurants implemented our experiments one day longer than we requested. (In fact, after the experiment,
they adopted ranking information display as part of their regular business strategy.) We used all the data from the
eight-day period in our analysis presented below, but the results do not change at all if we discard the data from the
last day.
6
use the pre-experiment period data from each of the locations to come up with the list of top 5 dishes
for each of the �ve ranking treatment locations, and the top 3 dishes for inclusion in the displays in
the four saliency treatment locations in the experiment period.20 Second, the pre-experiment data
allows us to conduct tests regarding the quality of randomization. Third, the pre-experiment data
allows us to implement a triple-di¤erence estimation strategy of the observational learning e¤ect to
eliminate possible systematic unobservable di¤erences between treatment and control tables. Table
1 summarizes our experimental design.
Post-Dining Survey. We randomly selected about 20 percent of the dining parties in the ex-
periment period to administer a short post-dining survey, where we collected information about
the persons who paid the bill for the whole table.21 In the survey we collected information about
his or her basic demographics, cumulative times of dining visits to MZDP and subjective dining
experience.
III. Data and Identi�cation Strategies
A. Data
For each dining party, the restaurant records a unique bill ID and includes information on the
unique identi�er of the table where the dining party sat, the unique number for each of the dishes
ordered in that bill, as well as their prices, and the total amount spent. The table identi�ers
were compared with our randomization that assigned each table to treatment or control. We only
included bills with non-missing table assignments because otherwise the bill was typically a take-
out bill. We also deleted very large bills which were most likely weddings and company banquets.22
This left us a total of 12,895 bills for analysis. As can be seen in Table 2 below, 7,355 bills were from
the �ve ranking treatment locations, and 5,540 were from the four saliency treatment locations.
B. Descriptive Statistics
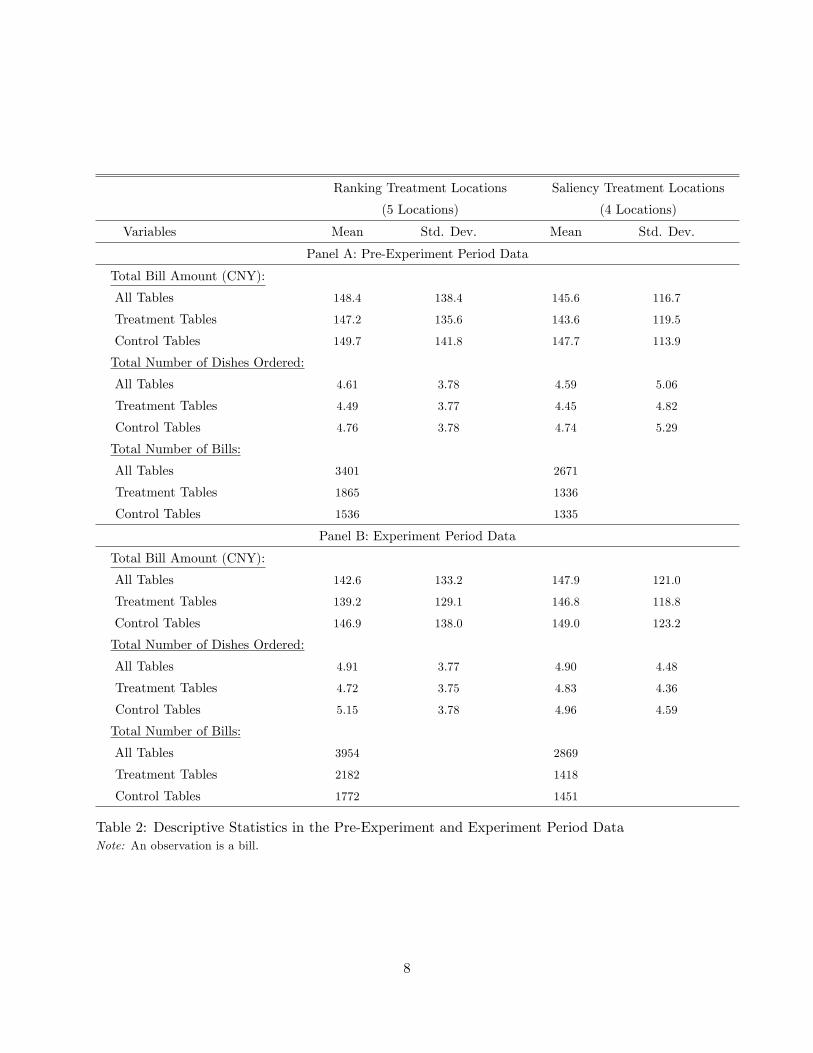
Panel A of Table 2 provides the basic summary statistics of the control and treatment tables in
the pre-experiment period in both the ranking and saliency treatment locations. It shows that our
20The displays were immediately printed and sent to their respective locations, and put on display the next day.21The questionnaire for the post-dining survey is available in the online appendix. It typically took less than a
minute to answer all questions. After the completion of the questionnaires, the tables that were surveyed were given
a box of poker cards and a piece of moon-cake as tokens of appreciation.22After consulting with the restaurant managers, we used 800 CNY (Chinese Yuan) as the cuto¤ above which
the bill was considered large. From a total of 13,302 bills in our data set (including both the pre-experiment and
experiment periods), a total of 407 bills were deleted due to these considerations. The deletion of these large bills only
a¤ects the calculations of the means for dishes ordered and bill amount, but does not at all a¤ect subsequent analysis
of the e¤ect of observational learning on customers�choices. Including these large bills would lead to signi�cantly
larger means for both dishes ordered and the bill amount, inconsistent with what the restaurant managers would
consider as being reasonable.
7
Ranking Treatment Locations
(5 Locations)
Saliency Treatment Locations
(4 Locations)
Variables Mean Std. Dev. Mean Std. Dev.
Panel A: Pre-Experiment Period Data
Total Bill Amount (CNY):
All Tables
Treatment Tables
Control Tables
148.4
147.2
149.7
138.4
135.6
141.8
145.6
143.6
147.7
116.7
119.5
113.9
Total Number of Dishes Ordered:
All Tables
Treatment Tables
Control Tables
4.61
4.49
4.76
3.78
3.77
3.78
4.59
4.45
4.74
5.06
4.82
5.29
Total Number of Bills:
All Tables
Treatment Tables
Control Tables
3401
1865
1536
2671
1336
1335
Panel B: Experiment Period Data
Total Bill Amount (CNY):
All Tables
Treatment Tables
Control Tables
142.6
139.2
146.9
133.2
129.1
138.0
147.9
146.8
149.0
121.0
118.8
123.2
Total Number of Dishes Ordered:
All Tables
Treatment Tables
Control Tables
4.91
4.72
5.15
3.77
3.75
3.78
4.90
4.83
4.96
4.48
4.36
4.59
Total Number of Bills:
All Tables
Treatment Tables
Control Tables
3954
2182
1772
2869
1418
1451
Table 2: Descriptive Statistics in the Pre-Experiment and Experiment Period DataNote: An observation is a bill.
8

experiment achieved reasonable randomization at both the table and site levels, at least in several
important observable dimensions.
First, there are a total of 3401 bills from the �ve ranking treatment locations (for an average
of 97 bills per day in each location), and 2671 bills for the four saliency treatment locations (for
an average of 95 bills per day in each location). Thus, there is only slight di¤erence in business
volumes between the ranking treatment and saliency treatment locations.
Second, in the ranking treatment locations, the average bill amount is about 148 CNY (Chinese
Yuan), with little di¤erence between treatment and control tables (the p-value is 0.58 in a formal
t-test of equality of means); the average total number of dishes ordered is about 4.6, with the
average for the control tables (4.76) being slightly larger than that for the treatment tables (4.49),
with the p-value for the equality of these means being 0.06. The average total bill amount in the
saliency treatment locations is about 146 CNY, again with a negligible di¤erence between treatment
and control tables (the p-value is 0.36). Similarly, the di¤erence in the number of dishes ordered
between control and treatment tables in the pre-experiment period is also small in the saliency
treatment locations
Third, we can also test for the equality of means across ranking treatment and saliency treatment
locations. The p-value for the t-test for the equality of means in the average bill amount across the
two locations is 0.69, and that for the average number of dishes ordered is 0.22. Thus, at least in
the two dimensions we examined, we are quite con�dent that randomization is well implemented
at both the site and table levels.23
Panel B of Table 2 provides some basic descriptive statistics of our experiment period data,
which consists of a total of 6,823 bills. The average daily number of bills per location and the
average bill amount, as well and the average number of dishes ordered per bill, do not seem to
di¤er much between the pre-experiment and experiment periods.
C. Empirical Speci�cations and Identi�cation Strategies
The raw data is organized by bill ID, and records only dishes that were ordered. For every bill
we include in our analysis, we create a dummy variable for each dish on the menu which takes a
value of 1 if at least one plate of that dish was recorded on that bill and 0 otherwise. Thus in our
main analysis below (reported in Tables 3-6), an observation is a bill/dish combination. For each
observation, the dependent variable of interest is whether the dish is ordered in the bill; and the
control variables include whether the dish is a top �ve dish in that location, whether the associated
table is a treatment table, whether a treatment occurred, the total number of dishes ordered in the
bill, and the total amount of the bill. In the most complete speci�cation, we also include dish and
location dummies. We report results from both linear probability (OLS) and Probit speci�cations.
Robust standard errors clustered at the bill ID level are calculated.23That is not to say that there are no di¤erences across locations. As can be seen in Panel A of Table 2, the standard
deviations for both the bill amount and the number of dishes ordered di¤er substantially between the ranking and
saliency treatment locations.
9
We use two identi�cation strategies to estimate the e¤ect of observational learning on consumer
choices. The �rst empirical strategy uses only the data from the experiment period. We compare
the probabilities that top 5 dishes were ordered by the ranking treatment tables and control tables
in ranking treatment locations to estimate the e¤ect of �being displayed as a top 5 dish,� or the
�total ranking treatment�e¤ect (Table 3). We also compare the probabilities that displayed dishes
were ordered by the saliency treatment tables and control tables in the saliency treatment locations
to estimate the saliency e¤ect (Table 4). The di¤erence between the two estimates provides an
unbiased estimate of the pure observational learning e¤ect under the assumption that genuine
randomization was achieved at both the site level and at the table level. We call this the Di¤erence-
in-Di¤erence (DD) estimation strategy.
The second empirical strategy uses data from both the pre-experiment and experiment peri-
ods. Even though Table 2 shows that randomization seems to be well implemented at both the
table and site levels in several observable dimensions, there is always the possibility that there are
systematic unobserved di¤erences between the control and treatment tables and between the rank-
ing and saliency treatment locations. We use the pre-experiment data to deal with the potential
unmeasured di¤erences between the control and treatment tables by implementing one additional
layer of di¤erencing that compares the sales of displayed dishes on the same table between the pre-
experiment and experiment periods. We call this the trip di¤erencing (DDD) estimation strategy
and the results are reported in Tables 5 and 6 below.
IV. Results
A. The E¤ect of Observational Learning on Choices
In this subsection, we present our main �nding that there is a signi�cant observational learning
e¤ect, but a non-signi�cant saliency e¤ect. We present the estimation results from the DD and
DDD empirical strategies separately below, but almost the same magnitude of observation learning
is estimated from the two strategies and from the linear probability and Probit speci�cations.
Speci�cally, we �nd that the knowledge that a particular dish was among the top 5 dishes ordered
by others increased the chance of the dish being ordered by an average ranging from 13 to 20 percent;
but being merely mentioned as some sample dishes did not signi�cantly boost their demand.
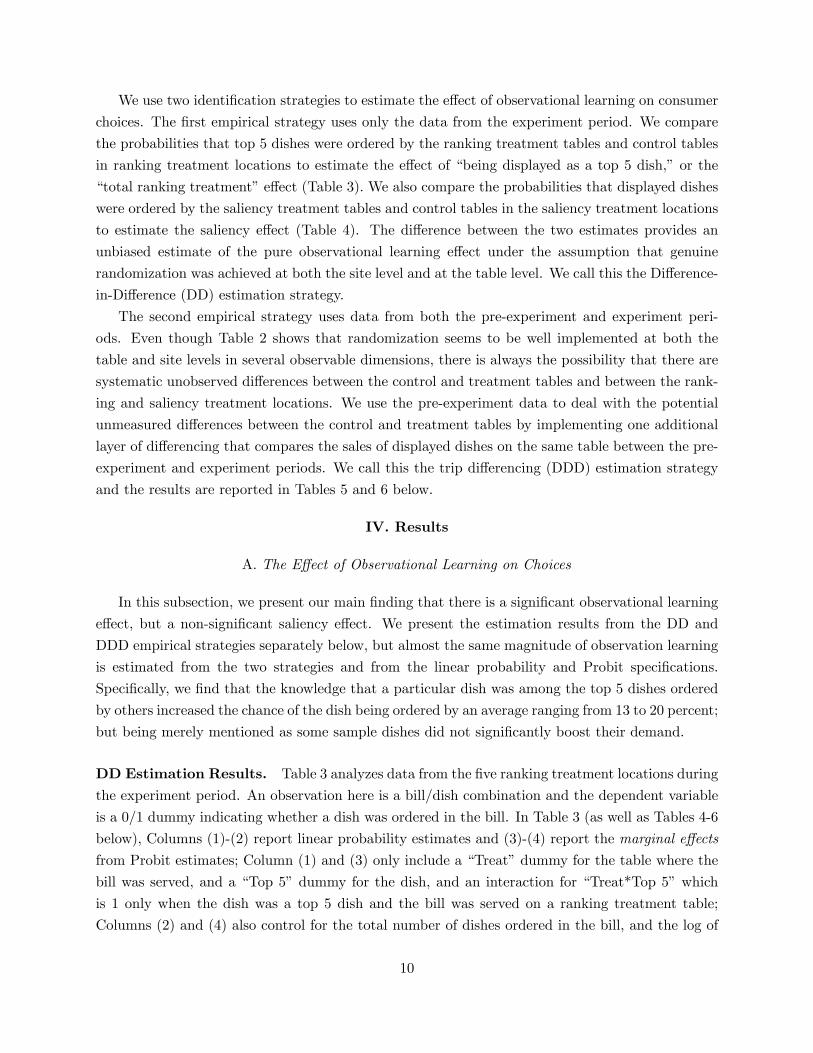
DD Estimation Results. Table 3 analyzes data from the �ve ranking treatment locations during
the experiment period. An observation here is a bill/dish combination and the dependent variable
is a 0/1 dummy indicating whether a dish was ordered in the bill. In Table 3 (as well as Tables 4-6
below), Columns (1)-(2) report linear probability estimates and (3)-(4) report the marginal e¤ects
from Probit estimates; Column (1) and (3) only include a �Treat�dummy for the table where the
bill was served, and a �Top 5�dummy for the dish, and an interaction for �Treat*Top 5�which
is 1 only when the dish was a top 5 dish and the bill was served on a ranking treatment table;
Columns (2) and (4) also control for the total number of dishes ordered in the bill, and the log of
10
(1) (2) (3) (4)
Variables OLS OLS Probit Probit
Treat-0.005
(0.001)***-0.001
(0.0005)�-0.006
(0.001)���-0.002
(0.000)���
Top 50.117
(0.004)***0.138
(0.006)���0.113
(0.004)���0.107
(0.007)���
Treat * Top 50.018
(0.006)***0.021
(0.006)���0.0115
(0.003)���0.0102
(0.002)���
Total Number of Dishes Ordered0.013
(0.000)���0.008
(0.000)���
Log of Total Bill Amount0.00016
(0.00012)
-0.0001
(0.0001)
Constant0.045
(0.001)���-0.026
(0.021)
Dish Dummy No Yes No Yes
Location Dummy No Yes No Yes
Number of Observations 235052 235052 235052 235052
R2 0.02 0.07 0.04 0.13
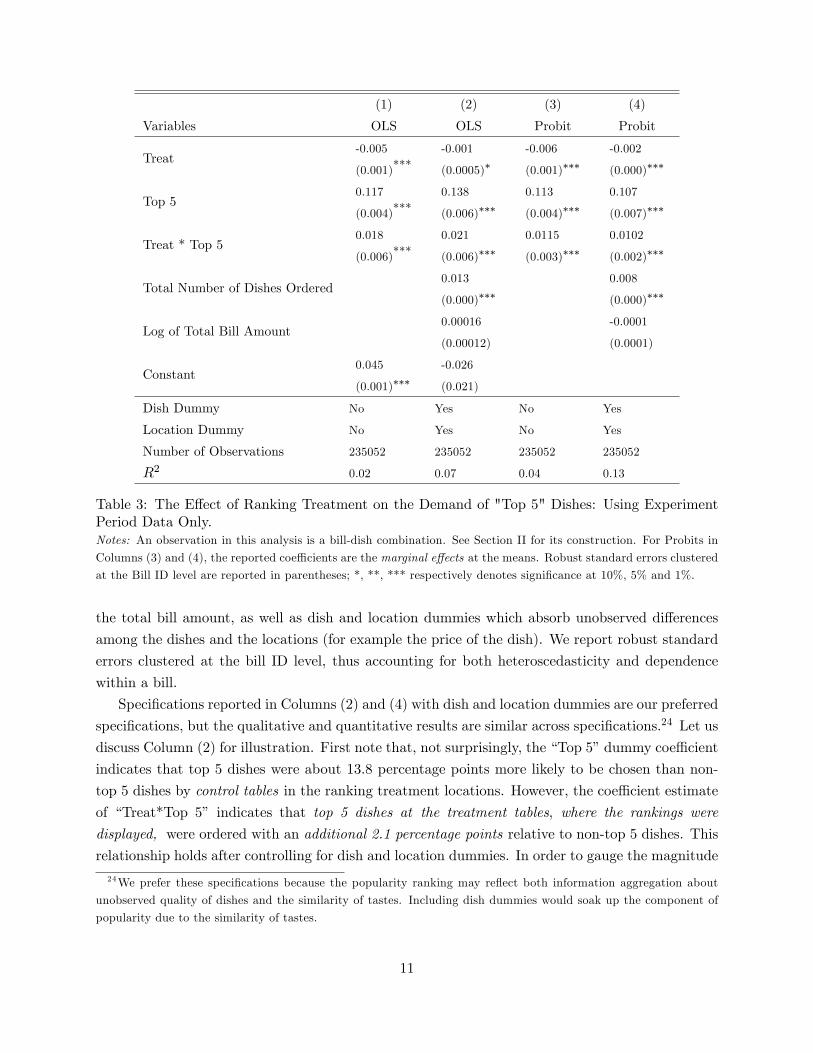
Table 3: The E¤ect of Ranking Treatment on the Demand of "Top 5" Dishes: Using ExperimentPeriod Data Only.Notes: An observation in this analysis is a bill-dish combination. See Section II for its construction. For Probits in
Columns (3) and (4), the reported coe¢ cients are the marginal e¤ects at the means. Robust standard errors clustered
at the Bill ID level are reported in parentheses; *, **, *** respectively denotes signi�cance at 10%, 5% and 1%.
the total bill amount, as well as dish and location dummies which absorb unobserved di¤erences
among the dishes and the locations (for example the price of the dish). We report robust standard
errors clustered at the bill ID level, thus accounting for both heteroscedasticity and dependence
within a bill.
Speci�cations reported in Columns (2) and (4) with dish and location dummies are our preferred
speci�cations, but the qualitative and quantitative results are similar across speci�cations.24 Let us
discuss Column (2) for illustration. First note that, not surprisingly, the �Top 5�dummy coe¢ cient
indicates that top 5 dishes were about 13.8 percentage points more likely to be chosen than non-
top 5 dishes by control tables in the ranking treatment locations. However, the coe¢ cient estimate
of �Treat*Top 5� indicates that top 5 dishes at the treatment tables, where the rankings were
displayed, were ordered with an additional 2.1 percentage points relative to non-top 5 dishes. This
relationship holds after controlling for dish and location dummies. In order to gauge the magnitude
24We prefer these speci�cations because the popularity ranking may re�ect both information aggregation about
unobserved quality of dishes and the similarity of tastes. Including dish dummies would soak up the component of
popularity due to the similarity of tastes.
11
(1) (2) (3) (4)
Variables OLS OLS Probit Probit
Treat0.001
(0.001)
-0.0005
(0.0004)
0.001
(0.0009)
-0.0005
(0.0004)
Displayed0.0754
(0.0038)���0.0679
(0.005)���0.0763
(0.0038)���0.078
(0.008)���
Treat * Displayed0.0077
(0.0056)
0.0076
(0.0056)
0.0026
(0.0025)
0.0022
(0.0021)
Total Number of Dishes Ordered0.0121
(0.0001)���0.0079
(0.0002)���
Log of Total Bill Amount-0.0000
(0.0001)
-0.0002
(0.0001)��
Constant0.0316
(0.0006)���-0.0023
(0.0058)
Dish Dummy No Yes No Yes
Location Dummy No Yes No Yes
Number of Observations 181868 181868 181868 181868
R2 0.01 0.04 0.02 0.11
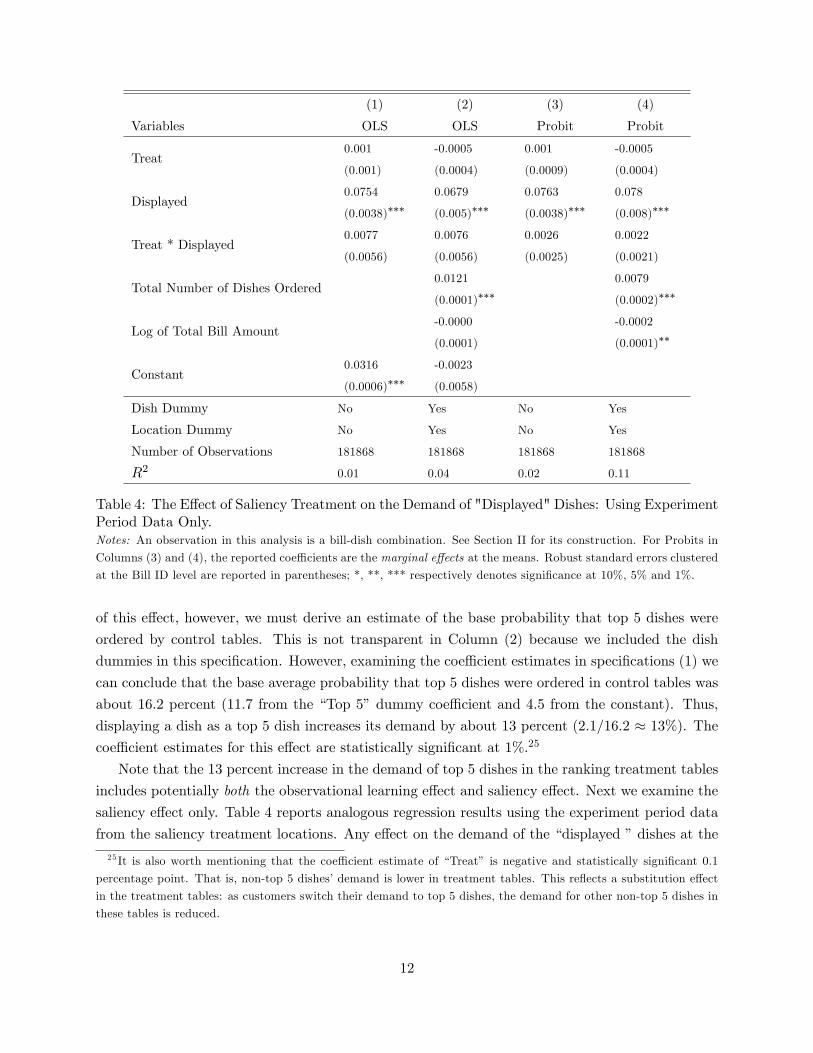
Table 4: The E¤ect of Saliency Treatment on the Demand of "Displayed" Dishes: Using ExperimentPeriod Data Only.Notes: An observation in this analysis is a bill-dish combination. See Section II for its construction. For Probits in
Columns (3) and (4), the reported coe¢ cients are the marginal e¤ects at the means. Robust standard errors clustered
at the Bill ID level are reported in parentheses; *, **, *** respectively denotes signi�cance at 10%, 5% and 1%.
of this e¤ect, however, we must derive an estimate of the base probability that top 5 dishes were
ordered by control tables. This is not transparent in Column (2) because we included the dish
dummies in this speci�cation. However, examining the coe¢ cient estimates in speci�cations (1) we
can conclude that the base average probability that top 5 dishes were ordered in control tables was
about 16.2 percent (11.7 from the �Top 5�dummy coe¢ cient and 4.5 from the constant). Thus,
displaying a dish as a top 5 dish increases its demand by about 13 percent (2.1/16.2 � 13%). Thecoe¢ cient estimates for this e¤ect are statistically signi�cant at 1%.25
Note that the 13 percent increase in the demand of top 5 dishes in the ranking treatment tables
includes potentially both the observational learning e¤ect and saliency e¤ect. Next we examine the
saliency e¤ect only. Table 4 reports analogous regression results using the experiment period data
from the saliency treatment locations. Any e¤ect on the demand of the �displayed �dishes at the
25 It is also worth mentioning that the coe¢ cient estimate of �Treat� is negative and statistically signi�cant 0.1
percentage point. That is, non-top 5 dishes�demand is lower in treatment tables. This re�ects a substitution e¤ect
in the treatment tables: as customers switch their demand to top 5 dishes, the demand for other non-top 5 dishes in
these tables is reduced.
12
treatment tables will be considered as simply the saliency e¤ect. These dishes were displayed with
no information about their popularity.
Note that, because the �ve displayed sample dishes always included the actual top 3 dishes
together with two randomly selected dishes (in a randomly mixed order), the displayed dishes were
7.5 percentage points more likely to be chosen than non-displayed dishes at the control tables
(Row 2 of Table 4). However, the estimate of the key coe¢ cient of interest for the interaction
term �Treat*Displayed�, which measures the saliency e¤ect, is small in magnitude (less than 1
percentage points) and statistically insigni�cant in all speci�cations. Thus we did not �nd any
statistically signi�cant saliency e¤ect.
One possible concern is that the saliency e¤ect was small because the sample dishes being
displayed at the saliency treatment tables are not popular to start with. In our experimental
design, we deliberately included the actual top 3 dishes in each restaurant location in the �ve
sample dishes we displayed in the saliency treatment tables. This feature of the experimental
design allows us to evaluate whether the saliency e¤ect varies by the initial popularity of the
dishes. In particular, we can compare the treatment e¤ects on the demand of Top 3 dishes between
the ranking treatment locations and the saliency treatment locations. In the ranking treatment
locations, we �nd that the demand increase for top 3 dishes when ranking information was displayed
was somewhat more pronounced than that for top 5 dishes on average; speci�cally, the estimated
coe¢ cient of �Treat*Top 3�in an OLS speci�cation identical to Column (2) in Table 3 is 0.032 with a
standard error of 0.008 (and a p-value of close to 0). In the saliency treatment locations, we �nd that
the estimated saliency e¤ect for top 3 dishes that were merely displayed as sample dishes remains
small and statistically insigni�cant; speci�cally, the estimated coe¢ cient of �Treat*Displayed (Top
3)�in an OLS speci�cation identical to Column (2) in Table 4 is 0.01 with a standard error of 0.008
(and a p-value of 0.19).26
To summarize, our �nding in Table 4 indicates that being made salient, i.e., being displayed
on a plaque, does not signi�cantly persuade consumers to order these displayed dishes, even for
those displayed dishes that were in fact top 3 dishes. Thus, at least in our restaurant setting, the
saliency e¤ect is small or almost zero. Under our assumption that the saliency e¤ect in the saliency
treatment locations is an unbiased estimate of the saliency e¤ect in ranking treatment locations
(which is true when randomization at the site level is well implemented), then our �nding in Table
3 of a signi�cant treatment e¤ect is close to the net observational learning e¤ect. Of course, we can
combine the data from the ranking treatment and saliency treatment locations and run complete
regressions with a triple interaction �Treat*Displayed* Ranking Treatment Locations� to obtain
an estimate of the net observational learning e¤ect. To save space we do not report these regression
results here but the magnitude for the coe¢ cient estimate of the above triple interaction is, not
surprisingly, similar to those we found in Table 3 for �Treat*Top 5� and remains statistically
signi�cant at the 1% level.
26All of the un-reported regression results can be found in the online appendix.
13
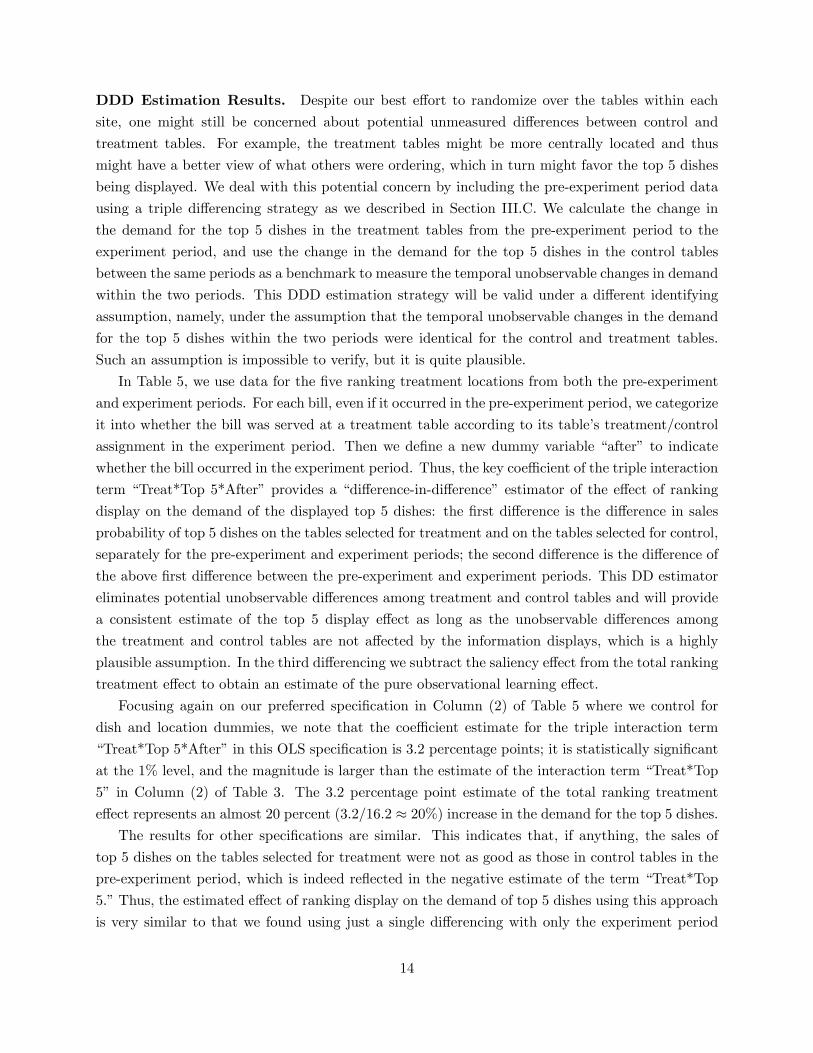
DDD Estimation Results. Despite our best e¤ort to randomize over the tables within each
site, one might still be concerned about potential unmeasured di¤erences between control and
treatment tables. For example, the treatment tables might be more centrally located and thus
might have a better view of what others were ordering, which in turn might favor the top 5 dishes
being displayed. We deal with this potential concern by including the pre-experiment period data
using a triple di¤erencing strategy as we described in Section III.C. We calculate the change in
the demand for the top 5 dishes in the treatment tables from the pre-experiment period to the
experiment period, and use the change in the demand for the top 5 dishes in the control tables
between the same periods as a benchmark to measure the temporal unobservable changes in demand
within the two periods. This DDD estimation strategy will be valid under a di¤erent identifying
assumption, namely, under the assumption that the temporal unobservable changes in the demand
for the top 5 dishes within the two periods were identical for the control and treatment tables.
Such an assumption is impossible to verify, but it is quite plausible.
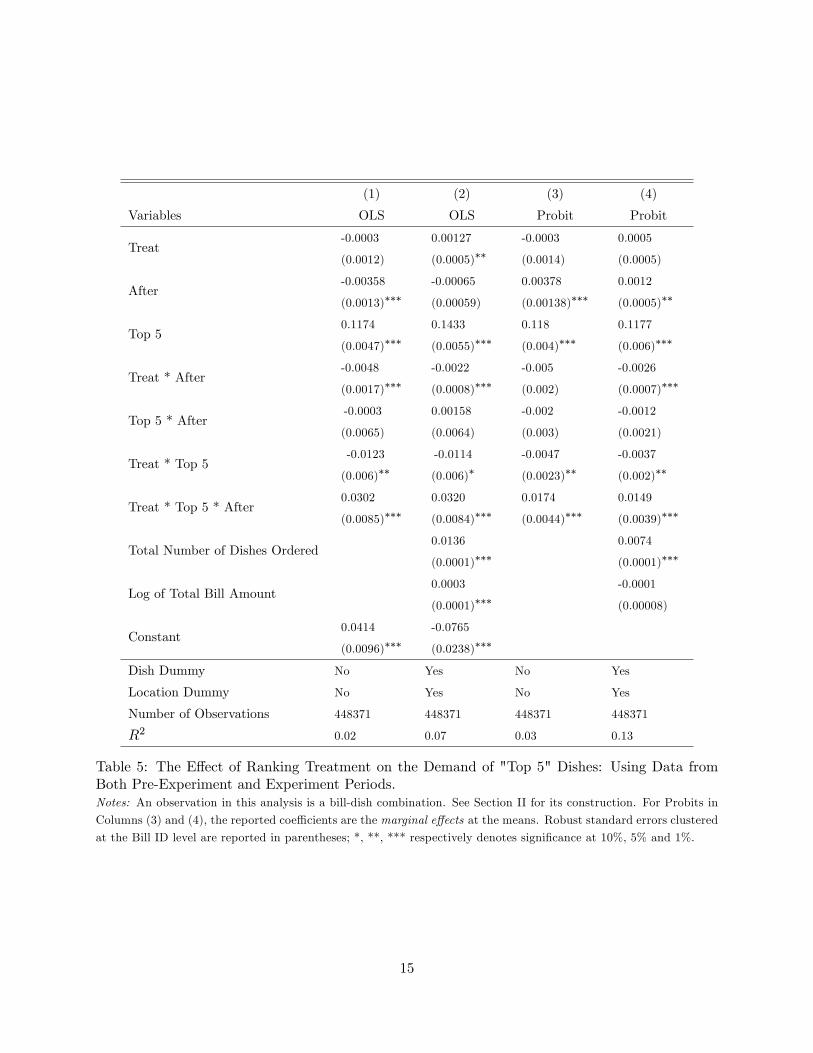
In Table 5, we use data for the �ve ranking treatment locations from both the pre-experiment
and experiment periods. For each bill, even if it occurred in the pre-experiment period, we categorize
it into whether the bill was served at a treatment table according to its table�s treatment/control
assignment in the experiment period. Then we de�ne a new dummy variable �after� to indicate
whether the bill occurred in the experiment period. Thus, the key coe¢ cient of the triple interaction
term �Treat*Top 5*After� provides a �di¤erence-in-di¤erence� estimator of the e¤ect of ranking
display on the demand of the displayed top 5 dishes: the �rst di¤erence is the di¤erence in sales
probability of top 5 dishes on the tables selected for treatment and on the tables selected for control,
separately for the pre-experiment and experiment periods; the second di¤erence is the di¤erence of
the above �rst di¤erence between the pre-experiment and experiment periods. This DD estimator
eliminates potential unobservable di¤erences among treatment and control tables and will provide
a consistent estimate of the top 5 display e¤ect as long as the unobservable di¤erences among
the treatment and control tables are not a¤ected by the information displays, which is a highly
plausible assumption. In the third di¤erencing we subtract the saliency e¤ect from the total ranking
treatment e¤ect to obtain an estimate of the pure observational learning e¤ect.
Focusing again on our preferred speci�cation in Column (2) of Table 5 where we control for
dish and location dummies, we note that the coe¢ cient estimate for the triple interaction term
�Treat*Top 5*After�in this OLS speci�cation is 3.2 percentage points; it is statistically signi�cant
at the 1% level, and the magnitude is larger than the estimate of the interaction term �Treat*Top
5� in Column (2) of Table 3. The 3.2 percentage point estimate of the total ranking treatment
e¤ect represents an almost 20 percent (3.2/16.2 � 20%) increase in the demand for the top 5 dishes.The results for other speci�cations are similar. This indicates that, if anything, the sales of
top 5 dishes on the tables selected for treatment were not as good as those in control tables in the
pre-experiment period, which is indeed re�ected in the negative estimate of the term �Treat*Top
5.�Thus, the estimated e¤ect of ranking display on the demand of top 5 dishes using this approach
is very similar to that we found using just a single di¤erencing with only the experiment period
14
(1) (2) (3) (4)
Variables OLS OLS Probit Probit
Treat-0.0003
(0.0012)
0.00127
(0.0005)��-0.0003
(0.0014)
0.0005
(0.0005)
After-0.00358
(0.0013)���-0.00065
(0.00059)
0.00378
(0.00138)���0.0012
(0.0005)��
Top 50.1174
(0.0047)���0.1433
(0.0055)���0.118
(0.004)���0.1177
(0.006)���
Treat * After-0.0048
(0.0017)���-0.0022
(0.0008)���-0.005
(0.002)
-0.0026
(0.0007)���
Top 5 * After-0.0003
(0.0065)
0.00158
(0.0064)
-0.002
(0.003)
-0.0012
(0.0021)
Treat * Top 5-0.0123
(0.006)��-0.0114
(0.006)�-0.0047
(0.0023)��-0.0037
(0.002)��
Treat * Top 5 * After0.0302
(0.0085)���0.0320
(0.0084)���0.0174
(0.0044)���0.0149
(0.0039)���
Total Number of Dishes Ordered0.0136
(0.0001)���0.0074
(0.0001)���
Log of Total Bill Amount0.0003
(0.0001)���-0.0001
(0.00008)
Constant0.0414
(0.0096)���-0.0765
(0.0238)���
Dish Dummy No Yes No Yes
Location Dummy No Yes No Yes
Number of Observations 448371 448371 448371 448371
R2 0.02 0.07 0.03 0.13
Table 5: The E¤ect of Ranking Treatment on the Demand of "Top 5" Dishes: Using Data fromBoth Pre-Experiment and Experiment Periods.Notes: An observation in this analysis is a bill-dish combination. See Section II for its construction. For Probits in
Columns (3) and (4), the reported coe¢ cients are the marginal e¤ects at the means. Robust standard errors clustered
at the Bill ID level are reported in parentheses; *, **, *** respectively denotes signi�cance at 10%, 5% and 1%.
15
(1) (2) (3) (4)
Variables OLS OLS Probit Probit
Treat-0.001
(0.007)
-0.0006
(0.0004)
-0.0002
(0.0009)
-0.0006
(0.0004)
After-0.0007
(0.0008)
-0.0005
(0.0004)
-0.00075
(0.0009)
-0.0004
(0.0004)
Displayed0.070
(0.0039)���0.0625
(0.0047)���0.0704
(0.004)���0.0685
(0.006)���
Treat * After0.0011
(0.0012)
0.0001
(0.0006)
-0.0012
(0.0013)
0.00009
(0.0006)
Displayed * After0.005
(0.0054)
0.0052
(0.0055)
0.0027
(0.0026)
0.0023
(0.0022)
Treat * Displayed0.0057
(0.0057)
0.0057
(0.0057)
0.0026
(0.0027)
0.0021
(0.0023)
Treat * Displayed * After0.00199
(0.00795)
0.00196
(0.008)
-1.68e-6
(0.00353)
0.00004
(0.0029)
Total Number of Dishes Ordered0.0122
(0.0001)���0.008
(0.0001)���
Log of Total Bill Amount-0.00002
(0.00005)
-0.00017
(0.00005)��
Constant0.0323
(0.0006)���-0.0155
(0.00296)���
Dish Dummy No Yes No Yes
Location Dummy No Yes No Yes
Number of Observations 346649 346649 346649 346649
R2 0.01 0.04 0.02 0.10
Table 6: The E¤ect of Saliency Treatment on the Demand of "Displayed" Dishes: Using Data fromBoth Pre-Experiment and Experiment Periods.Notes: An observation in this analysis is a bill-dish combination. See Section II for its construction. For Probits in
Columns (3) and (4), the reported coe¢ cients are the marginal e¤ects at the means. Robust standard errors clustered
at the Bill ID level are reported in parentheses; *, **, *** respectively denotes signi�cance at 10%, 5% and 1%.
16
data.
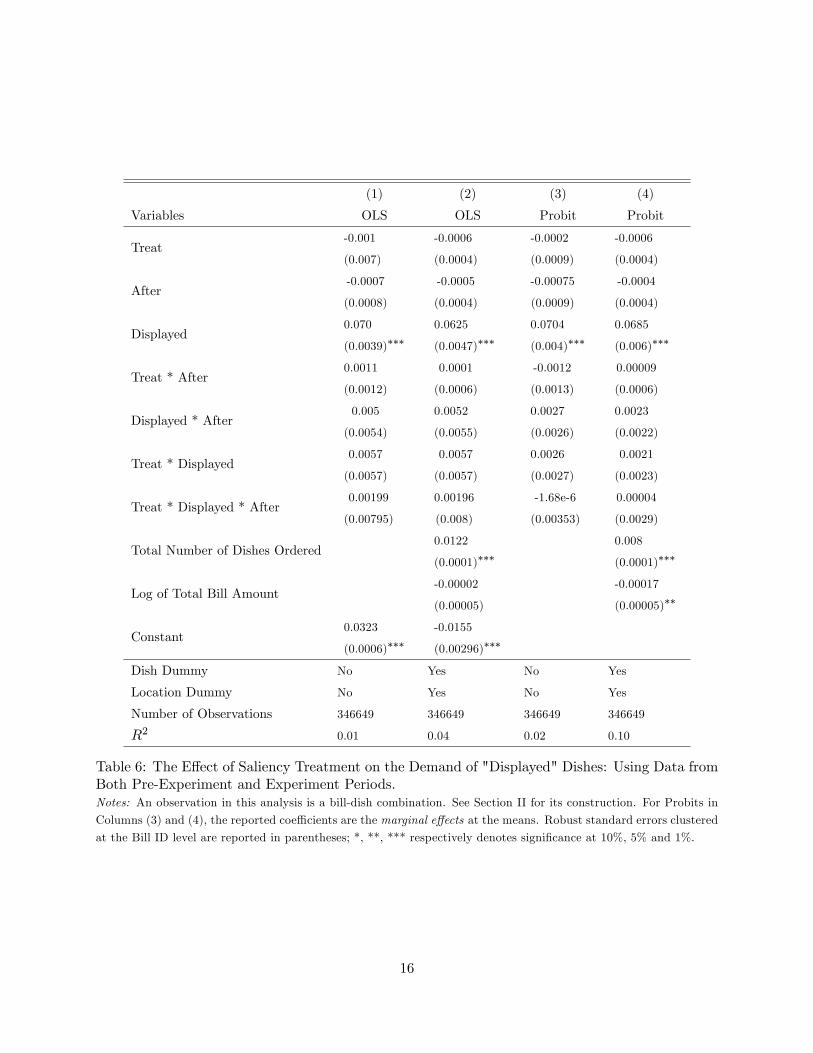
We analogously report the estimate of the saliency e¤ect using the DD estimator and both weeks
of data. In Table 6, the triple interaction �Treat*Displayed*After�is estimated to be positive, but
it is tiny in magnitude and statistically insigni�cant in all speci�cations, thus con�rming that our
previous �nding in Table 4 about the insigni�cant saliency e¤ect on the demand for the displayed
dishes (without information about popularity) is not due to systematic di¤erences between control
and treatment tables in the saliency treatment locations. Taking the di¤erence between the total
ranking treatment e¤ect (the coe¢ cient estimate of �Treat*Top 5*After� in Table 5) and the
saliency e¤ect (the coe¢ cient estimate of �Treat*Displayed*After� in Table 6) would give us the
DDD estimate of the pure observational learning e¤ect. Again, in unreported regressions, we found
the estimate of pure observational learning e¤ect to be substantial and statistically signi�cant.
Summary and A Caveat. To summarize, we �nd that, depending on speci�cations, the demand
for the top 5 dishes was increased by an average of about 13 (Table 3) to 20 percent (Table 5) when
the popularity rankings were revealed to the customers; in contrast, being merely mentioned as some
randomly selected dishes did not signi�cantly boost the demand for these mentioned dishes. In other
words, we �nd that the saliency e¤ect is positive but very small and statistically insigni�cant. Thus
the demand increase for the top 5 dishes in the ranking treatment was mostly due to observational
learning.
Our �nding of signi�cant observational learning has to be understood with an important caveat
that may lead to biased estimates for the observational learning e¤ect and saliency e¤ect. The
caveat is related to the customers�perception of the restaurant�s motivation in putting up these
information displays. Even though in our �eld experiment we used the pre-experiment period data
to come up with the genuine top 5 dishes and displayed them in the ranking treatment locations,
the consumers might be suspicious of whether such rankings were true rankings or were fabricated
by the restaurant to boost sales of these dishes. Such suspicion may dilute the true observational
learning e¤ect on the customer�s demand. Of course, customers might also be suspicious of the
motives of the restaurant regarding the display of �ve sample dishes in the saliency treatment
locations; such suspicion would lead to a downward bias in our estimate of the saliency e¤ect.27
While it is impossible to precisely evaluate the degree of downward biases in the ranking and
saliency treatment locations, it seems to be plausible that the ranking treatment is likely to be met
with more suspicion than the saliency treatment.
B. Additional Results Using the Post-Dining Survey Data
We now report some additional results using the data from the post-dining surveys, which were
collected from about 20% of the bills randomly selected in the experiment period. We merged
this survey data with the dining choice data using the bill ID. We received 644 and 693 surveys
27Such concerns are not new, of course, because they are closely related to �intent to treat�and �compliance� in
the policy evaluation and clinical trial evaluation literatures (see, e.g., James Heckman and Edward Vytlacil 2001).
17
(1) (2) (3) (4)
OLS OLS Probit Probit
Panel A: Ranking Treatment Locations
Treat0.0833
(0.0428)��0.0891
(0.0428)��0.0833
(0.0428)��0.0899
(0.0430)��
Number of Observations 644 640 644 640
R2 0.0074 0.0198 0.0082 0.0213
Panel B: Saliency Treatment Locations
Treat0.0261
(0.0370)
0.0280
(0.0372)
0.0261
(0.0370)
0.0258
(0.0360)
Number of Observations 693 680 693 680
R2 0.0024 0.0118 0.0031 0.0189
Additional Controls No Yes No Yes
Table 7: The E¤ects on Dining Satisfaction: Ranking Treatment vs. Saliency Treatment.Notes: An observation is a bill. The dependent variable is a dummy that takes value 1 if the customer reported "Very
Satis�ed" in the post-dining survey. Only data from the experiment period is used in this analysis. The additiona
controls include dummies of age intervals, college, gender, tourist, and cumulative number of visits. For Probits in
Columns (3) and (4), the reported coe¢ cents are the marginal e¤ects at the mean. Robust standard errors clustered
at the table level are ported in parenthesis. *, ** and ** deotes signi�cance at 10%, 5% and 1% respectively.
respectively for the ranking and saliency treatment locations.28 We ask two questions. First, does
providing information about others�choices (as in the ranking treatment) improve the subjective
dining experience? Second, are infrequent visitors, who had more di¤use priors about the quality
of dishes, more susceptible to the in�uence of others�choices?
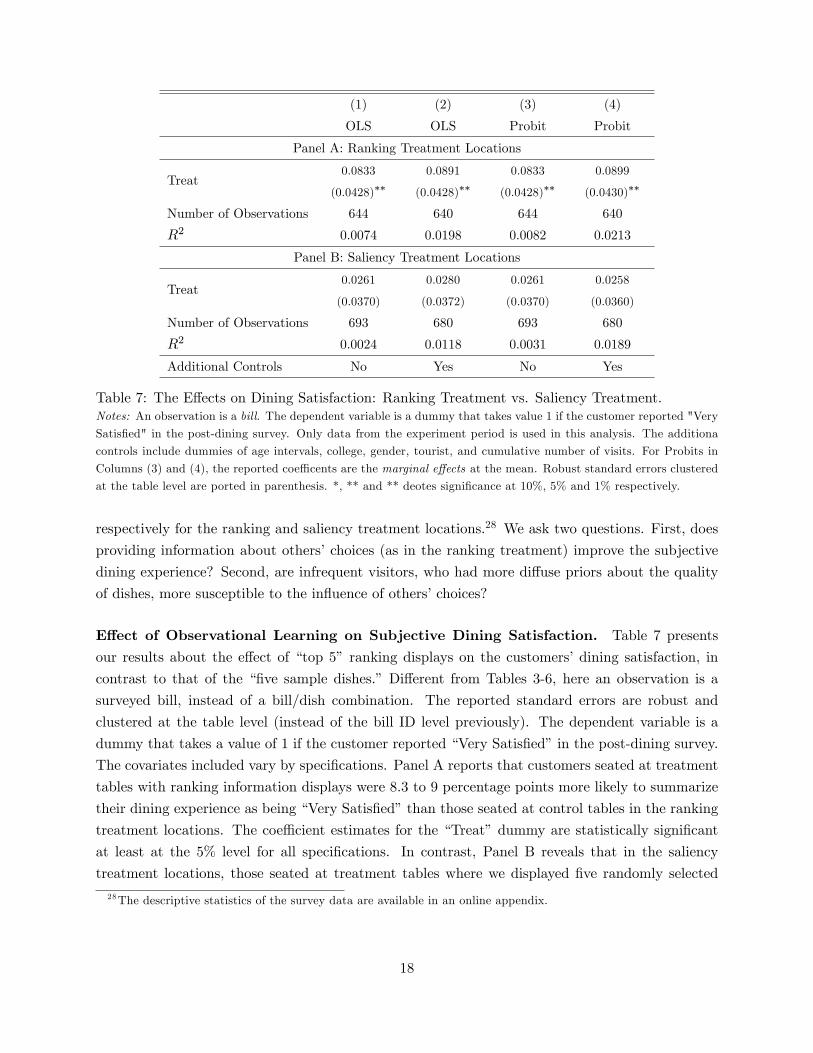
E¤ect of Observational Learning on Subjective Dining Satisfaction. Table 7 presents
our results about the e¤ect of �top 5� ranking displays on the customers�dining satisfaction, in
contrast to that of the ��ve sample dishes.� Di¤erent from Tables 3-6, here an observation is a
surveyed bill, instead of a bill/dish combination. The reported standard errors are robust and
clustered at the table level (instead of the bill ID level previously). The dependent variable is a
dummy that takes a value of 1 if the customer reported �Very Satis�ed�in the post-dining survey.
The covariates included vary by speci�cations. Panel A reports that customers seated at treatment
tables with ranking information displays were 8.3 to 9 percentage points more likely to summarize
their dining experience as being �Very Satis�ed�than those seated at control tables in the ranking
treatment locations. The coe¢ cient estimates for the �Treat�dummy are statistically signi�cant
at least at the 5% level for all speci�cations. In contrast, Panel B reveals that in the saliency
treatment locations, those seated at treatment tables where we displayed �ve randomly selected
28The descriptive statistics of the survey data are available in an online appendix.
18
(1) (2) (3)
Whole Sample Survey Sample Survey Sample
Treat-0.005
(0.001)���-0.006
(0.0057)
-0.005
(0.0059)
Top 50.117
(0.004)���0.122
(0.012)���0.119
(0.013)���
Treat * Top 50.018
(0.006)���0.019
(0.009)��0.0196
(0.009)��
Treat * Top 5 * Frequent-0.0004
(0.0002)��
Constant0.045
(0.001)���0.043
(0.005)���0.043
(0.005)���
Number of Observations 235052 48843 48843
R2 0.021 0.022 0.0223
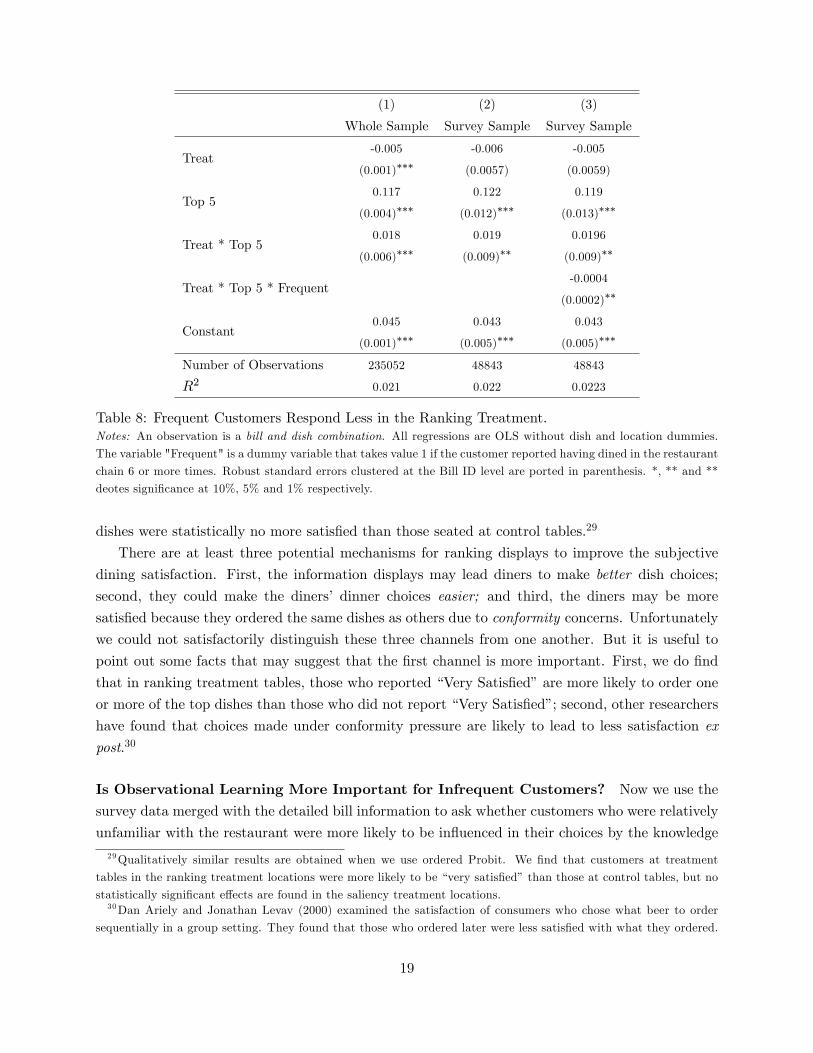
Table 8: Frequent Customers Respond Less in the Ranking Treatment.Notes: An observation is a bill and dish combination. All regressions are OLS without dish and location dummies.
The variable "Frequent" is a dummy variable that takes value 1 if the customer reported having dined in the restaurant
chain 6 or more times. Robust standard errors clustered at the Bill ID level are ported in parenthesis. *, ** and **
deotes signi�cance at 10%, 5% and 1% respectively.
dishes were statistically no more satis�ed than those seated at control tables.29
There are at least three potential mechanisms for ranking displays to improve the subjective
dining satisfaction. First, the information displays may lead diners to make better dish choices;
second, they could make the diners� dinner choices easier; and third, the diners may be more
satis�ed because they ordered the same dishes as others due to conformity concerns. Unfortunately
we could not satisfactorily distinguish these three channels from one another. But it is useful to
point out some facts that may suggest that the �rst channel is more important. First, we do �nd
that in ranking treatment tables, those who reported �Very Satis�ed�are more likely to order one
or more of the top dishes than those who did not report �Very Satis�ed�; second, other researchers
have found that choices made under conformity pressure are likely to lead to less satisfaction ex
post.30
Is Observational Learning More Important for Infrequent Customers? Now we use the
survey data merged with the detailed bill information to ask whether customers who were relatively
unfamiliar with the restaurant were more likely to be in�uenced in their choices by the knowledge
29Qualitatively similar results are obtained when we use ordered Probit. We �nd that customers at treatment
tables in the ranking treatment locations were more likely to be �very satis�ed�than those at control tables, but no
statistically signi�cant e¤ects are found in the saliency treatment locations.30Dan Ariely and Jonathan Levav (2000) examined the satisfaction of consumers who chose what beer to order
sequentially in a group setting. They found that those who ordered later were less satis�ed with what they ordered.
19
of others�choices. In Table 9, an observation is again a bill/dish combination, but this time we
only use the subsample for which we have surveys. We only use data from the ranking treatment
locations in the experiment week, and only report the OLS speci�cations. We �rst de�ne a dummy
variable �frequent�which takes a value of 1 if the survey respondents reported to have visited the
restaurant 6 or more times, and 0 otherwise.31
Column (1) of Table 8 just replicates Column (1) of Table 3 using the whole sample, and Column
(2) shows the result for the subsample with the same speci�cation. As can be seen, the basic
observational learning e¤ect found in Column (1) for the whole sample survives in the subsample,
though the statistical signi�cance drops from 1% to 5%. The key result in Table 8 is Column (3)
where we add an interaction term �Treat*Top 5*Frequent�to allow for the observational learning
e¤ect to di¤er by whether or not the customer was a frequent visitor to the restaurant. The
coe¢ cient estimate is small negative 0.4 percentage point, and is statistically signi�cant at 5%
level. Thus we conclude that the data provides modest support that the choices of frequent visitors
were less a¤ected by the observation of others�choices, consistent with the theoretical predictions
of observational learning models.32
V. Conclusion
In this paper we present results from a randomized natural �eld experiment about the e¤ects of
observational learning on individuals�behavior and subjective well-being in the context of restaurant
dining. Our experimental design aims to distinguish the observational learning e¤ect from the
saliency e¤ect. We �nd that the demand for the top 5 dishes increases by an average of about 13 to
20 percent, depending on the empirical speci�cations, when customers are given ranking information
of the �ve most popular dishes; in contrast, being merely mentioned as some sample dishes does
not signi�cantly boost their demand. We also �nd modest evidence that the observational learning
e¤ect is stronger among infrequent customers. Moreover, we �nd that customers�subjective dining
experiences improve when they are presented with the information about the top choices by other
consumers, but not when presented with the names of some sample dishes.
Our result provides convincing evidence that consumers do learn from the information contained
in the choices of others, thus providing empirical support for the theoretical models of herding and
information cascades (Banerjee 1992; Bikhchandani, Hirshleifer and Welch 1992). Our result also
establishes that observational learning is an important component of social learning; thus it suggests
31We have experimented with alternative ways of creating the �frequent�dummy. We only get modestly signi�cant
estimate for �Treat*Top 5*Frequent� interaction if we de�ne �frequent� according to whether the cumulative visits
are more or less than 6, even though we always get the same negative sign. One possible reason is that 6 visits are
needed in order for a customer to be familiar enough about the menu so as not to be less in�uenced by the ranking
information. Another reason is that using the 6 visit cuto¤ yields su¢ cient numbers of 0 and 1 for the �frequent�
dummy in order to get statistical signi�cance.32We also ran regressions analogous to Column (3) in Table 8 using survey data from the saliency treatment
locations. We found that the point estimate for the coe¢ cient for �Treat*Displayed*Frequent�is negative but almost
negligible in magnitude, and is statistically insigni�cant (with a p-value of 0.89).
20
that policy makers may a¤ect individuals�decisions through information campaigns that release
popularity information about relevant alternatives from other groups of agents. It also provides a
partial explanation for the commonly observed practice of popularity information displays in the
internet business.
Finally, there are several interesting directions for future research. For example, how do we
separate conformity motives from observational learning? Are observational learning e¤ects per-
sistent? How would the e¤ect of observational learning change when pro�t-maximizing sellers, not
third parties, are providing the popularity information? The latter two questions could be poten-
tially addressed if we can track customers exposed to di¤erential information conditions through
customer loyalty cards.
REFERENCES
Ahn, David S., and Haluk Ergin. 2007. �Framing Contingencies.�Unpublished.
Alevy, Jonathan E., Michael S. Haigh, and John A. List. 2007. �Information Cascades: Ev-idence from a Field Experiment with Financial Market Professionals.� Journal of Finance,
62(1): 151-180.
Anderson, Lisa R., and Charles A. Holt. 1997. �Information Cascades in the Laboratory.�American Economic Review, 87(5): 847-862.
Ariely, Dan, and Jonathan Levav. 2000. �Sequential Choice in Group Settings: Taking theRoad Less Traveled and Less Enjoyed.�Journal of Consumer Research, 27(3): 279-290.
Asch, Solomon E. 1951. �E¤ects of Group Pressure upon the Modi�cation and Distortion ofJudgment.�In Groups, Leadership and Men, ed. H. Guetzkow. Pittsburgh: Carnegie Press.
Asch, Solomon E. 1955. �Opinions and Social Pressure.�Scienti�c American, 193(1): 31-35.
Bandura, Albert. 1977. Social Learning Theory. Englewood Cli¤s, NJ: Prentice Hall.
Banerjee, Abhijit. 1992. �A Simple Model of Herd Behavior.�Quarterly Journal of Economics,107(3): 797-817.
Bayer, Patrick, Stephen L. Ross, and Giorgio Topa. 2005. �Place of Work and Place of
Residence: Informal Hiring Networks and Labor Market Outcomes.�NBER Working Paper
No. 11019.
Bernheim, B. Douglas. 1994. �A Theory of Conformity.�Journal of Political Economy, 102(5):841-877.
Besley, Timothy, and Anne Case. 1994. �Di¤usion as a Learning Process: Evidence from
HYV Cotton.�Princeton University Discussion Paper No. 174.
21
Bikhchandani, Sushil, David Hirshleifer, and Ivo Welch. 1992. �A Theory of Fads, Fash-
ion, Customs, and Cultural Change as Information Cascades.�Journal of Political Economy,
100(5): 992-1026.
Bikhchandani, Sushil, David Hirshleifer, and Ivo Welch. 1998. �Learning from the Behav-ior of Others: Conformity, Fads and Information Cascades.� Journal of Economic Perspec-
tives, 12(1): 151-170.
Çelen, Bo¼gaçhan, and Shachar Kariv. 2004. �Distinguishing Informational Cascades from
Herd Behavior in the Laboratory.�American Economic Review, 94(3): 484-498.
Cialdini, Robert B., and Noah J. Goldstein. 2004. �Social In�uence: Compliance and Con-formity.�Annual Review of Psychology, 55: 591-621.
Chamley, Christophe P. 2004. Rational Herds: Economic Methods of Social Learning. Cam-bridge University Press.
Conley, Timothy G., and Christopher Udry. 2007. �Learning About a New Technology:
Pineapples in Ghana.� Economic Growth Center Working Paper 817 (Revised), Yale Uni-
versity.
Deutsch, Morton, and Harold B. Gerard. 1955. �A Study of Normative and Informational
Social In�uences Upon Individual Judgment.� Journal of Abnormal Social Psychology, 51:
629-636.
Du�o, Esther. 2005. �Field Experiments in Development Economics.�in Advances in EconomicTheory and Econometrics, ed. Richard Blundell, Whitney K. Newey, and Torsten Persson.
Cambridge University Press.
Du�o, Esther, and Emmanuel Saez. 2002. �Participation and Investment Decisions in a Re-tirement Plan: The In�uence of Colleagues�Choices.� Journal of Public Economics, 85(1):
121-148.
Du�o, Esther, and Emmanuel Saez. 2003. �The Role of Information and Social Interactionsin Retirement Plan Decisions: Evidence from a Randomized Experiment.�Quarterly Journal
of Economics, 118(3): 815-842.
Foster, Andrew D., and Mark R. Rosenzweig. 1995. �Learning by Doing and Learning fromOthers: Human Capital and Technical Change in Agriculture.�Journal of Political Economy,
103(6): 1176-1209.
Glaeser, Edward L., Bruce Sacerdote, and José Scheinkman. 1996. �Crime and Social In-teractions.�Quarterly Journal of Economics, 111(2): 507-548
22

Harrison, Glenn W., and John A. List. 2004. �Field Experiments.� Journal of Economic
Literature, 42(4): 1009-55.
Heckman, James, and Edward Vytlacil. 2001. �Policy Relevant Treatment E¤ects.�Ameri-can Economic Review, 91(2): 107-111.
Knight, Brian, and Nathan Schi¤. 2007. �Momentum and Social Learning in Presidential Pri-maries.�NBER Working Paper 13637.
Kremer, Michael, and Ted Miguel. 2004. �Networks, Social Learning and Technology Adop-tion: The Case of Deworming Drugs in Kenya.�Econometrica, 72(1): 159-217.
Li, Jing. 2006. �Information Structure with Unawareness.�Unpublished.
List, John. 2007. �Field Experiments: A Bridge Between Lab and Naturally-Occurring Data.�
NBER Working Paper No. 12992.
Manski, Charles. 1993. �Identi�cation of Exogenous Social E¤ects: The Re�ection Problem.�Review of Economics Studies, 60(1): 31-42.
Manski, Charles. 2000. �Economic Analysis of Social Interactions.�Journal of Economic Per-spectives, 14(3): 115-136.
Medin, Douglas L., and Brian H. Ross. 1997. Cognitive Psychology. Second Edition. Hart-cout Brace & Company.
Mobius, Markus M., Paul Niehaus, and Tanya S. Rosenblat. 2005. �Social Learning andConsumer Demand.�unpublished.
Moretti, Enrico. 2008. �Social Learning and Peer E¤ects in Consumption: Evidence from MovieSales.�Unpublished.
Munshi, Kaivan, and Jacques Myaux. 2006. �Social Norms and the Fertility Transition.�
Journal of Development Economics, 80(1):1-38.
Salganik, Matthew J., Peter S. Dodds, and Duncan J. Watts. 2006. �Experimental Studyof Inequality and Unpredictability in an Arti�cial Cultural Market.�Science, 311 (February):
854-856.
Sorensen, Alan T. 2006. �Social Learning and Health Plan Choice.� Rand Journal of Eco-
nomics, 37(4): 929-945.
Tucker, Catherine, and Juanjuan Zhang. 2007. �Long Tail or Steep Tail? A Field Investiga-tion into How Online Popularity Information A¤ects the Distribution of Customer Choices.�
MIT Sloan Working Paper 4655-07.
23