Observational evidence for_a_dark_side_to_ngc5128_globular_cluster_system
21
SUBMITTED TO THE ASTROPHYSICAL J OURNAL Preprint typeset using L A T E X style emulateapj v. 05/12/14 OBSERVATIONAL EVIDENCE FOR A DARK SIDE TO NGC 5128’S GLOBULAR CLUSTER SYSTEM † MATTHEW A. TAYLOR 1,2,? ,THOMAS H. PUZIA 1 ,MATIAS GOMEZ 3 ,KRISTIN A. WOODLEY 4 1 Institute of Astrophysics, Pontificia Universidad Cat´ olica de Chile, Av. Vicu˜ na Mackenna 4860, 7820436 Macul, Santiago, Chile 2 European Southern Observatory, Alonso de Cordova 3107, Vitacura, Santiago, Chile 3 Departamento de Ciencias F´ ısicas, Universidad Andres Bello, Rep´ ublica 220, Santiago, Chile 4 University of California, Santa Cruz, University of California Observatories, 1156 High Street, Santa Cruz, CA 95064, USA Submitted to The Astrophysical Journal ABSTRACT We present a study of the dynamical properties of 125 compact stellar systems (CSSs) in the nearby giant elliptical galaxy NGC 5128, using high-resolution spectra (R ≈ 26 000) obtained with VLT/FLAMES. Our results provide evidence for a new type of star cluster, based on the CSS dynamical mass scaling relations. All radial velocity (v r ) and line-of-sight velocity dispersion (σ los ) measurements are performed with the penalized pixel fitting (ppxf) technique, which provided σ ppxf estimates for 115 targets. The σ ppxf estimates are corrected to the 2D projected half-light radii, σ 1/2 , as well as the cluster cores, σ 0 , accounting for observational/aperture effects and are combined with structural parameters, from high spatial resolution imaging, in order to derive total dynamical masses (M dyn ) for 112 members of NGC5128’s star cluster system. In total, 89 CSSs have dynamical masses measured for the first time along with the corresponding dynamical mass-to-light ratios (Υ dyn V ). We find two distinct sequences in the Υ dyn V -M dyn plane, which are well approximated by power laws of the forms Υ dyn V ∝M 0.33±0.04 dyn and Υ dyn V ∝M 0.79±0.04 dyn . The shallower sequence corresponds to the very bright tail of the globular cluster luminosity function (GCLF), while the steeper relation appears to be populated by a distinct group of objects which require significant dark gravitating components such as central massive black holes and/or exotically concentrated dark matter distributions. This result would suggest that the formation and evolution of these CSSs are markedly different from the “classical” globular clusters in NGC 5128 and the Local Group, despite the fact that these clusters have luminosities similar to the GCLF turn- over magnitude. We include a thorough discussion of myriad factors potentially influencing our measurements. Subject headings: galaxies: individual: (NGC 5128) – galaxies: star clusters: general – galaxies: spectroscopy – galaxies: photometry 1. INTRODUCTION Globular clusters (GCs) are among the oldest stellar sys- tems in the Universe (Krauss & Chaboyer 2003). They have witnessed the earliest stages of star formation and were also present during later epochs of structure formation. Apart from resolved stellar population studies of galaxies, which are re- stricted primarily to the Local Group, extragalactic globular cluster systems (GCSs) provide one of the best probes to investigate the formation and assembly histories of galaxies (Harris 1991; Ashman & Zepf 1998, 2008; Peng et al. 2008; Georgiev et al. 2010). Various avenues of study can be em- ployed to this effect, including the analysis of GCS kinemat- ics, their metallicity distribution functions, chemical enrich- ment histories, age spreads, and/or combinations thereof. At a distance of 3.8 ± 0.1 Mpc, (Harris et al. 2010), corre- sponding to an angular scale of 18.5 pc arcsec -1 , NGC 5128 (a.k.a. Centarus A) is the nearest giant elliptical (gE) galaxy to the Milky Way (MW), yet it is still too far for large scale star-by-star investigations to be technologically feasible. For- tunately, much has been learned about this galaxy from its rich GC system. 564 of its GCs have radial velocity confir- mations, and others have been confirmed, for example, via resolution into individual stars (van den Bergh et al. 1981; Hesser et al. 1984, 1986; Harris et al. 1992; Peng et al. 2004; Woodley et al. 2005; Rejkuba et al. 2007; Beasley et al. 2008; † Based on observations collected under program 081.D-0651 (PI: Ma- tias Gomez) with FLAMES at the Very Large Telescope of the Paranal Ob- servatory in Chile, operated by the European Southern Observatory (ESO). ? ESO Graduate Student Fellow, [email protected] Woodley et al. 2010a). This GC sample, thus, rivals the en- tire population of GCs harbored by the Local Group, despite there being ∼ 600 - 1400 GCs still left to find/confirm in the halo regions of NGC 5128 (Harris et al. 1984, 2002b, 2010, 2012). Notwithstanding this incompleteness, previous studies have already shed much light on the photometric, chemical, and kinematical properties, as well as the past and recent for- mation history of this massive nearby neighbour. GCs are well known to inhabit a narrow range of space de- fined by structural parameters such as half-light, tidal and core radii (r h , r t and r c , respectively), concentration parameter c = log (r t /r c ) (King 1966), velocity dispersion (σ), mass-to- light ratio (Υ), etc. called the “fundamental plane” (Djorgov- ski 1995). Studies of Local Group GCs (e.g. Fusi Pecci et al. 1994; Djorgovski et al. 1997; Holland et al. 1997; McLaugh- lin 2000; Barmby et al. 2002, 2007) have shown that at the high-mass end of the fundamental plane, peculiar GCs such as ωCen and G1, the largest GCs in the MW and M31, begin to emerge. For example, both of these GCs show significant star- to-star [Fe/H] variations and are among the most flattened of Local Group GCs (White & Shawl 1987; Norris & Da Costa 1995; Meylan et al. 2001; Pancino et al. 2002) and at least in the case of ωCen, harbor multiple stellar populations with an extended chemical enrichment history (Piotto 2008a,b). Unlike the Local Group, the sheer size of NGC 5128’s GCS generously samples the high-mass tail (& 10 6 M ) of the globular cluster mass function (GCMF, Harris et al. 1984, 2002a; Martini & Ho 2004; Rejkuba et al. 2007; Taylor et al. 2010). Due to their intense luminosities, these massive GCs
-
Upload
sergio-sacani -
Category
Science
-
view
312 -
download
1
Transcript of Observational evidence for_a_dark_side_to_ngc5128_globular_cluster_system

SUBMITTED TO THE ASTROPHYSICAL JOURNALPreprint typeset using LATEX style emulateapj v. 05/12/14
OBSERVATIONAL EVIDENCE FOR A DARK SIDE TO NGC 5128’S GLOBULAR CLUSTER SYSTEM†
MATTHEW A. TAYLOR1,2,? , THOMAS H. PUZIA1 , MATIAS GOMEZ3 , KRISTIN A. WOODLEY4
1Institute of Astrophysics, Pontificia Universidad Catolica de Chile, Av. Vicuna Mackenna 4860, 7820436 Macul, Santiago, Chile2European Southern Observatory, Alonso de Cordova 3107, Vitacura, Santiago, Chile
3Departamento de Ciencias Fısicas, Universidad Andres Bello, Republica 220, Santiago, Chile4University of California, Santa Cruz, University of California Observatories, 1156 High Street, Santa Cruz, CA 95064, USA
Submitted to The Astrophysical Journal
ABSTRACTWe present a study of the dynamical properties of 125 compact stellar systems (CSSs) in the nearby giant
elliptical galaxy NGC 5128, using high-resolution spectra (R ≈ 26 000) obtained with VLT/FLAMES. Ourresults provide evidence for a new type of star cluster, based on the CSS dynamical mass scaling relations. Allradial velocity (vr) and line-of-sight velocity dispersion (σlos) measurements are performed with the penalizedpixel fitting (ppxf) technique, which provided σppxf estimates for 115 targets. The σppxf estimates are correctedto the 2D projected half-light radii, σ1/2, as well as the cluster cores, σ0, accounting for observational/apertureeffects and are combined with structural parameters, from high spatial resolution imaging, in order to derivetotal dynamical masses (Mdyn) for 112 members of NGC 5128’s star cluster system. In total, 89 CSSs havedynamical masses measured for the first time along with the corresponding dynamical mass-to-light ratios(Υdyn
V ). We find two distinct sequences in the ΥdynV -Mdyn plane, which are well approximated by power
laws of the forms ΥdynV ∝M0.33±0.04
dyn and ΥdynV ∝M0.79±0.04
dyn . The shallower sequence corresponds to thevery bright tail of the globular cluster luminosity function (GCLF), while the steeper relation appears to bepopulated by a distinct group of objects which require significant dark gravitating components such as centralmassive black holes and/or exotically concentrated dark matter distributions. This result would suggest thatthe formation and evolution of these CSSs are markedly different from the “classical” globular clusters inNGC 5128 and the Local Group, despite the fact that these clusters have luminosities similar to the GCLF turn-over magnitude. We include a thorough discussion of myriad factors potentially influencing our measurements.Subject headings: galaxies: individual: (NGC 5128) – galaxies: star clusters: general – galaxies: spectroscopy
– galaxies: photometry
1. INTRODUCTION
Globular clusters (GCs) are among the oldest stellar sys-tems in the Universe (Krauss & Chaboyer 2003). They havewitnessed the earliest stages of star formation and were alsopresent during later epochs of structure formation. Apart fromresolved stellar population studies of galaxies, which are re-stricted primarily to the Local Group, extragalactic globularcluster systems (GCSs) provide one of the best probes toinvestigate the formation and assembly histories of galaxies(Harris 1991; Ashman & Zepf 1998, 2008; Peng et al. 2008;Georgiev et al. 2010). Various avenues of study can be em-ployed to this effect, including the analysis of GCS kinemat-ics, their metallicity distribution functions, chemical enrich-ment histories, age spreads, and/or combinations thereof.
At a distance of 3.8±0.1 Mpc, (Harris et al. 2010), corre-sponding to an angular scale of 18.5 pc arcsec−1, NGC 5128(a.k.a. Centarus A) is the nearest giant elliptical (gE) galaxyto the Milky Way (MW), yet it is still too far for large scalestar-by-star investigations to be technologically feasible. For-tunately, much has been learned about this galaxy from itsrich GC system. 564 of its GCs have radial velocity confir-mations, and others have been confirmed, for example, viaresolution into individual stars (van den Bergh et al. 1981;Hesser et al. 1984, 1986; Harris et al. 1992; Peng et al. 2004;Woodley et al. 2005; Rejkuba et al. 2007; Beasley et al. 2008;
† Based on observations collected under program 081.D-0651 (PI: Ma-tias Gomez) with FLAMES at the Very Large Telescope of the Paranal Ob-servatory in Chile, operated by the European Southern Observatory (ESO).
? ESO Graduate Student Fellow, [email protected]
Woodley et al. 2010a). This GC sample, thus, rivals the en-tire population of GCs harbored by the Local Group, despitethere being ∼ 600−1400 GCs still left to find/confirm in thehalo regions of NGC 5128 (Harris et al. 1984, 2002b, 2010,2012). Notwithstanding this incompleteness, previous studieshave already shed much light on the photometric, chemical,and kinematical properties, as well as the past and recent for-mation history of this massive nearby neighbour.
GCs are well known to inhabit a narrow range of space de-fined by structural parameters such as half-light, tidal and coreradii (rh, rt and rc, respectively), concentration parameterc=log (rt/rc) (King 1966), velocity dispersion (σ), mass-to-light ratio (Υ), etc. called the “fundamental plane” (Djorgov-ski 1995). Studies of Local Group GCs (e.g. Fusi Pecci et al.1994; Djorgovski et al. 1997; Holland et al. 1997; McLaugh-lin 2000; Barmby et al. 2002, 2007) have shown that at thehigh-mass end of the fundamental plane, peculiar GCs such asωCen and G1, the largest GCs in the MW and M31, begin toemerge. For example, both of these GCs show significant star-to-star [Fe/H] variations and are among the most flattened ofLocal Group GCs (White & Shawl 1987; Norris & Da Costa1995; Meylan et al. 2001; Pancino et al. 2002) and at least inthe case of ωCen, harbor multiple stellar populations with anextended chemical enrichment history (Piotto 2008a,b).
Unlike the Local Group, the sheer size of NGC 5128’s GCSgenerously samples the high-mass tail (& 106 M�) of theglobular cluster mass function (GCMF, Harris et al. 1984,2002a; Martini & Ho 2004; Rejkuba et al. 2007; Taylor et al.2010). Due to their intense luminosities, these massive GCs

2 M. A. Taylor et al.
are very accessible observationally, and thus provide excellentprobes to study the formation history of NGC 5128. Many ofthe most massive NGC 5128 GCs show a more rapid chemi-cal enrichment history than Local Group GCs (Colucci et al.2013), and exhibit significantly elevated dynamical mass-to-light ratios (Υdyn
V ) above dynamical masses,Mdyn ' 2 · 106
M� (Taylor et al. 2010). This sharp upturn of ΥdynV is consis-
tent with a trend found by Hasegan et al. (2005) and Mieskeet al. (2006, 2008a) in other extragalactic GCSs, and re-quires either non-equilibrium dynamical states, such as rota-tion or pre-relaxation (Varri & Bertin 2012; Bianchini et al.2013), younger than expected stellar components (e.g. Be-din et al. 2004; Piotto 2008a), exotic top- or bottom-heavystellar initial mass functions (IMFs; e.g. Dabringhausen et al.2008, 2009; Mieske et al. 2008b) or/and a significant contri-bution by non-baryonic matter or massive central black holes(BHs). While there is an ongoing debate whether the lattertwo options are valid for Milky Way GCs (see e.g. Conroy etal. 2011; Ibata et al. 2013; Lutzgendorf et al. 2011; Straderet al. 2012; Lanzoni et al. 2013; Sun et al. 2013; Kruijssen& Lutzgendorf 2013), there is growing evidence for the pres-ence of 105−108M� BHs significantly affecting the dynam-ics of similarly structured, albeit more massive, ultra-compactdwarf galaxies (UCDs; Mieske et al. 2013; Seth et al. 2014).
NGC 5128’s GCS has been shown to follow trends sim-ilar to other giant galaxies. In particular, it has a multi-modal distribution in color and metallicity (e.g. Harris et al.2002b; Peng et al. 2004; Beasley et al. 2008; Woodley et al.2010b), corresponding to at least two and possibly three dis-tinct GC generations. Moreover, the prominent dust-lane andfaint shells in the galaxy surface brightness distribution (Ma-lin et al. 1983), along with a young tidal stream (Peng et al.2002) provide significant evidence for recent merger activityon a kpc scale, while on smaller scales indications of strongtidal forces are seen in the form of extra-tidal light associatedwith individual GCs (Harris et al. 2002a).
Recent models support the notion that the bulk of the starformation leading to massive elliptical galaxies is complete byz≈ 3 (i.e. the first few Gyr of cosmic history), while it takesuntil z < 0.4 before ∼ 80% of the mass is locked up after theaccretion of as many as five massive progenitors (e.g. De Lu-cia et al. 2006; De Lucia & Blaizot 2007; Marchesini et al.2014). Studies based on Hubble Space Telescope (HST) datain the mid- to outer-halo regions of NGC 5128 generally con-cur with this view, in that the majority (∼ 80%) of the stellarpopulation is ancient (&11−12 Gyr) and formed very rapidly,as evidenced by [α/Fe] ratios approaching or exceeding twicesolar values (e.g. Harris et al. 1999; Harris & Harris 2000,2002; Rejkuba et al. 2011). This older population is comple-mented by a significantly younger component, forming on theorder of a few Gyr ago (e.g. Soria et al. 1996; Marleau et al.2000; Rejkuba et al. 2003).
In this paper we use velocity dispersion estimates based onhigh-resolution spectra to derive dynamical masses for a largesample of NGC 5128’s GCS (see e.g., Chilingarian et al. 2011,who carried out similar work on ultra-compact dwarfs in theFornax cluster). We combine the newly derived dynamicalinformation with well-known luminosities from the literatureto probe the baryonic makeup and dynamical configurationsof the CSSs. The results are then used to classify several dis-tinct CSS/GC populations, which are discussed in the contextof likely origins, with potential consequences for GCSs thatsurround other gE galaxies.
This paper is organized as follows. § 2 describes the obser-vations made as well as an outline of the data reduction stepstaken to produce high-quality spectra. § 3 contains informa-tion on the analysis that was undertaken on the new spectro-scopic observations, as well as structural parameter data fromthe literature with which our new measurements were com-bined. § 4 discusses our results by using sizes, masses andmass-to-light ratios of GCs/CSSs to develop several hypothe-ses on the origins of the various cluster sub-populations thatwe find. The main text concludes with § 5, which summarizesour new measurements and results. Following the main text,we present in the appendix multiple detailed tests which ruleout spurious results due to several possible sources includ-ing poor data quality, data analysis biases, fore/backgroundcontamination, target confusion, and others. We adopt theNGC 5128 distance modulus of (m−M)0 = 27.88 ± 0.05mag, corresponding to a distance of 3.8 ± 0.1 Mpc (Harriset al. 2010), as well as the homogenized GC identificationscheme of Woodley et al. (2007) throughout this work.
2. OBSERVATIONS
During five nights in June/July 2008, 123 of the brightestGCs around NGC 5128 were observed using the Fibre LargeArray Multi-Element Spectrograph (FLAMES) instrument atthe Very Large Telescope (VLT) on Cerro Paranal, Chile.FLAMES is a multi-object spectrograph mounted at the Nas-myth A focus of UT2 (Kueyen). The instrument features 132fibres, each with apertures of 1.2′′ diameter, linked to theintermediate-high resolution (7 000≤R≤ 30 000) GIRAFFEspectrograph, with an additional eight 1.0′′ fibres connected tothe high resolution (R≈47 000) UVES spectrograph mountedat the Nasmyth B focus, thus, allowing for simultaneous ob-servations of 139 targets3 over a 25′ diameter field of view.
2.1. Instrumental SetupFLAMES often suffers from one or more broken fibres, and
these observations were no exception. The first night of ob-servations, comprising the first three of eleven 2 400 secondlong observing blocks (OBs), were conducted with the firstof two FLAMES fibre positioner plates, which suffered fromtwo broken fibres, while the last eight OBs used the secondplate, with only a single, but distinct, broken fibre. For thisreason, the total number of targets observed was 138, includ-ing eight fibres fed to UVES, and 130 to GIRAFFE. Unfor-tunately the UVES targets were of too low data quality foruseful measurements to be derived, and so we do not includethem in the present work. From the GIRAFFE fibre budget,13 were allocated to recording the sky contribution to the tar-get signals. These sky fibres were used near the end of the datareduction process to perform an adaptive sky subtraction. Insummary, we obtained spectra of 117 bright GCs using GI-RAFFE in the high resolution (R'25 900) mode, recording asingle ∆λ = 21.3 nm echelle order centred at λ= 525.8 nm,covering the wavelength range 515.2 . λ . 536.5 nm.
Table 1 summarizes our observations. The overall exposuretimes were 26 400 s; however, three GCs (GC 0310, GC 0316and GC 426) inevitably suffered from broken fibres, limitingthe total integration times to 19 200 s, 7 200 s, and 7 200 s, re-spectively. In the case of GC 0058 a single exposure had tobe omitted due to the unfortunate coincidence of a significant
3 In principle 132 GIRAFFE fibres are allocatable, but only 131 are fullycovered on the detector; therefore, the sum of GIRAFFE+UVES availablefibres is 139.

The Dark Side of NGC 5128’s Globular Clusters 3
0.615 0.565 0.515 0.465 0.415 0.365 0.315 0.265 0.215 0.165 0.115
α [+201.0 deg]
-43.219
-43.169
-43.119
-43.069
-43.019
-42.969
-42.919
-42.869
-42.819δ
[deg]
FIG. 1.— Locations of the GIRAFFE fibre placements in relation to the host galaxy, NGC 5128. Grey points show the placement of fibres for “classical” GCs,while blue pentagons and red squares illustrate the positions of DGTO and DSC GCs, respectively (see Figure 6 and corresponding text in Sect. 4.1 for detailson their definition). Green points mark the positions of sky fibres. The light red shaded region shows the approximate extent of the 25′ FLAMES field-of-view,corresponding to ∼ 27.5 kpc at the distance of NGC 5128.
detector defect lying directly in the middle of the Mgb triplet,hence the total integration time for that GC was limited to24 000 s.
The on-sky locations of the GIRAFFE fibres are indica-ted in Figure 1, over-plotted on an archival DSS image4 ofNGC 5128. Overall, the observing conditions were good forthis observing program: The images were taken at airmassvalues ranging between 1.054 and 1.635, under seeing condi-tions in the range 0.48′′ to 1.42′′. For the purpose of correctingour line-of-sight velocity dispersion measurements, based onour final stacked spectra, for aperture and observational ef-fects (see § 3.5), we use the mean seeing value from all 11
4 Based on photographic data obtained using The UK Schmidt Telescope.The UK Schmidt Telescope was operated by the Royal Observatory Edin-burgh, with funding from the UK Science and Engineering Research Council,until 1988 June, and thereafter by the Anglo-Australian Observatory. Origi-nal plate material is copyright c© the Royal Observatory Edinburgh and theAnglo-Australian Observatory. The plates were processed into the presentcompressed digital form with their permission. The Digitized Sky Surveywas produced at the Space Telescope Science Institute under US Governmentgrant NAG W-2166.
OBs of 0.85′′, since all targets were observed simultaneouslyunder identical seeing conditions.
2.2. Basic Data Reduction and CleaningThe basic data reduction steps (bias subtraction, flat field-
ing, and wavelength calibration) were carried out by the GI-RAFFE pipeline5. Separate calibration frame sets were usedfor each of the five nights. The pipeline recipe masterbiascreated the master bias frame from an average of five indi-vidual frames and masterflat produced the master flat froman average of three bias-subtracted flatfields. The fibre local-izations were visually confirmed to be accurate to within 0.5pixels for each of the 11 OBs, less than the suggested 1 pixelmaximum to ensure accuracy. The recipe giwavecalibrationderived the wavelength calibrations. For all five calibrationsets, it was necessary to edit the slit geometry tables in or-der to eliminate ‘jumps’ in the final, re-binned, wavelengthcalibrated arc-lamp spectra – an extra step that is not uncom-
5 http://www.eso.org/sci/software/pipelines

4 M. A. Taylor et al.
TABLE 1STAR CLUSTER OBSERVATIONS
ID α δ R V0 Exp. Time S/N[J2000] [J2000] [mag] [mag] [s]
GC 0028 13 24 28.429 −42 57 52.96 19.65 19.80±0.01 26400 2.87GC 0031 13 24 29.700 −43 02 06.43 19.55 19.75±0.01 26400 1.88GC 0048 13 24 43.586 −42 53 07.22 19.33 19.51±0.01 26400 1.79GC 0050 13 24 44.575 −43 02 47.26 18.90 18.74±0.01 26400 3.75GC 0052 13 24 45.330 −42 59 33.47 18.91 18.98±0.01 26400 5.55GC 0053 13 24 45.754 −43 02 24.50 19.43 19.57±0.01 26400 2.22GC 0054 13 24 46.435 −43 04 11.60 18.64 18.84±0.01 26400 4.65GC 0058 13 24 47.369 −42 57 51.19 19.15 19.41±0.01 24000 2.69GC 0064 13 24 50.072 −43 07 36.23 20.03 20.11±0.02 26400 1.49GC 0065 13 24 50.457 −42 59 48.98 19.68 19.21±0.01 26400 2.17
NOTE. — Summary of the new observations. Cluster identifications are listed in the first column, fol-lowed by the J2000 coordinates, apparent R-band magnitudes used for target acquisitions, de-reddenedapparent V - or r′-band magnitudes (see §3.6), total integration times, and signal-to-noise ratios (S/N,see Sect. 2.2 for a definition). Table 1 is published in its entirety in the electronic edition of the Astro-physical Journal. A portion is shown here for guidance regarding its form and content.
mon. Having performed these steps, the wavelength solutionswere confirmed to be of high-quality by visually checking thatthey were smooth, as well as via the radial velocity errors in-ternal to the re-made slit geometry tables which showed val-ues of RVERR ' 0.003 km s−1. We note that these valuesare meant to confirm the accuracy of giwavecalibration anddo not reflect our final, measured radial velocity uncertainties(see § 3).
Using the final 11 sets of calibration data products, therecipe giscience provided the final, fully calibrated scienceframes from which individual 1D spectra were extracted. Cus-tom PYTHON scripts were used to clean the spectra of nu-merous residual cosmetic defects and to subtract the sky con-tribution from the spectra. To clean the spectra of cosmeticdefects surviving the basic data reduction steps, the spectrawere subjected to a median filtering algorithm and robust κσ-clipping. Each of the extracted spectra were visually inspectedand the parameters of the median/κσ filters were adjusted toremove any significant detector cosmetics, while preservingthe finer details of the spectra. Typically a median filter ofgate size of 75 pixels followed by clipping points outside of4.5σ was sufficient to remove defects.
2.3. Sky SubtractionTo account for the sky contribution to each spectrum, we
used the 13 GIRAFFE fibres dedicated to monitoring thesky contamination. These fibres facilitated uniform samplingacross the field of view (see Figure 1). For each target, the skycontribution was taken to be the average of the three nearestsky fibres, inversely weighted by distance, thereby ensuringthat only the sky nearest to each target was considered. Thefinal sky spectra were determined individually for each of the117 targets and 11 OBs before being directly subtracted fromeach of the 1287 individual target spectra. Only then were thereduced, cleaned, and sky-subtracted spectra co-added to pro-duce the final data set.
2.4. Data Quality AssessmentThe signal-to-noise ratios (S/N) for the final spectra were
calculated considering the main spectral features used to esti-mate the line-of-sight velocity dispersions (see §3.1). Specifi-cally, these features are the Mgb and Fe 5270 Lick indices cen-tred at laboratory wavelengths of 5176.375 A and 5265.650 A,respectively (Burstein et al. 1984; Worthey 1994; Worthey &
Ottaviani 1997). The S/N listed in Table 1 were calculated as,
S/N =1
4
4∑i
siσi
(1)
where si and σi are the mean and standard deviation of theflux over the continuum regions bracing the Mgb and Fe 5270features as defined by 5142.625 A≤ λblue
Mgb,cont≤5161.375 A,5191.375 A ≤ λred
Mgb,cont ≤ 5206.375 A, 5233.150 A ≤λblue
Fe5270,cont ≤ 5248.150 A and 5285.650 A≤ λredFe5270,cont ≤
5318.150 A. Before calculating the S/N, each of the contin-uum definitions were shifted from the laboratory values to ac-count for known GC radial velocities, vr, or if unknown, theywere shifted a posteriori according to our own vr measure-ments (see § 3.1).
3. ANALYSIS
3.1. Penalized Pixel FittingOur line-of-sight velocity dispersion (LOSVD; σ) measure-
ments were carried out using the penalized pixel fitting (ppxf)code (Cappellari & Emsellem 2004). This code parametricallyrecovers the LOSVD of the stars composing a given cluster orgalaxy spectrum by expanding the LOSVD profile as a Gauss-Hermite series. Using reasonable initial guesses for the ra-dial velocity (vr) and σ, the best fitting vr,ppxf , σppxf , andHermite moments h3, and h4 were recovered by fitting thecluster/galaxy spectrum to a library of template stars whichhad its spectral resolution adjusted to that of the FLAMESspectra. The fitting of optimal template spectra along withthe kinematics serves to limit the impact of template mis-matches. An important feature of the ppxf routine is that dur-ing an iterative process, a penalty function derived from theintegrated square deviation of the line profile from the best fit-ting Gaussian is used to minimize the variance of the fit. Thisfeature allows the code to recover the higher order details inhigh S/N spectra, but biases the solution towards a Gaussianwhen S/N is low, as is the case for several objects in our sam-ple. For more details on the ppxf code, we refer to Cappellari& Emsellem (2004)6.
Where possible, the input estimates for vr were quoted fromWoodley et al. (2010a) or Woodley et al. (2007) which are
6 ppxf and the corresponding documentation can be found at: http://www-astro.physics.ox.ac.uk/˜mxc/idl/

The Dark Side of NGC 5128’s Globular Clusters 5
listed in Table 2. For GCs with unavailable vr, we used theIRAF7 task rvcorrect to account for heliocentric velocity cor-rections, and fxcor to estimate vr. These estimates were usedas our initial guesses for ppxf and do not need to be perfectlyaccurate since the σppxf measurements have no significantsensitivity to vr, as long as the initial guess is accurate towithin a few tens of km s−1 (see also Taylor et al. 2010). Themore refined vr,ppxf values were then adopted as our final esti-mates as listed in Table 2 and used for our S/N measurements.
To account for any sensitivity that ppxf may have to theinitial guess for σ which may, for example, result in spurioussolutions, we varied the input σ between 5 and 100 km s−1 insteps of 1 km s−1 for each spectrum. For each fit we used theentire 5 152 . λ/A . 5 365 range, including the Mgb and Fefeatures and all less prominent lines that are present. AllGIRAFFE spectra have a velocity scale of 2.87 km s−1, andwe found an additive 4th degree polynomial adequate for thepurpose of estimating the continua. After varying our initialσ guesses, the adopted vr,ppxf and σppxf values correspond tothe mean of the output sets of vr,ppxf and σppxf after beingκσ-clipped to remove outliers. The ppxf errors were taken asthe mean of the output ppxf errors added in quadrature to onestandard deviation of the κσ-clipped results. While it is toocumbersome to present all of the ppxf fits in the present work,we direct the reader to the online-only appendix8 to accessthe full suite of spectral fits for all targets in this sample andpresent a representative sample in Figure 2.
3.2. Template LibraryThe ppxf code measurements rely on a library of tem-
plate stellar spectra capable of accurately replicating an inte-grated light spectrum when used in combination and Dopplershifted to account for velocity gradients within a stellar pop-ulation. We used a library of high-resolution synthetic spectrafrom the PHOENIX9 collaboration (Husser et al. 2013). Asynthetic spectral library was chosen over observed templatesbecause current high resolution observed spectral librariesdo not cover the wide range of stellar parameters that com-prise complex stellar populations. We therefore used a li-brary of 1 100 PHOENIX spectra covering the stellar param-eter ranges: 0.5 ≤ log g ≤ 4.0, 3 800 ≤ Teff ≤ 6 000 K,−4.0≤ [Fe/H]≤+1.0 dex, and −0.2≤ [α/Fe]≤ +1.2 dex.For [Fe/H]=−4.0 and [Fe/H]=+1.0. The PHOENIX spec-tra are available only for [α/Fe] = 0.0 dex; however, we donot expect that this limitation affects our results significantly.
3.3. Comparison with Previous Results
The accuracy of ppxf when applied to the restricted∼200 AGIRAFFE wavelength coverage was tested by using the GCspectra of Taylor et al. (2010) as a comparison sample sincethey also derived LOSVD estimates in the same manner, butwith much wider spectral coverage. To compare directly, theTaylor et al. spectra were constrained to the GIRAFFE wave-length range, and σppxf estimates were obtained as describedin the following. The input values for vr and σ were fixedat those determined by Taylor et al., and the input σ werevaried around the known values by ±10 km s−1 in steps of 1
7 IRAF is distributed by the National Optical Astronomy Observatory,which is operated by the Association of Universities for Research in Astron-omy, Inc., under cooperative agreement with the National Science Founda-tion.
8 http://cdsarc.u-strasbg.fr/viz-bin/Cat/9 http://phoenix.astro.physik.uni-goettingen.de/
5160 5180 5200 5220 5240 5260 5280 5300Wavelength [
◦A]
0.0
0.5
1.0
1.5
2.0
2.5
3.0
Sm
ooth
ed F
lux (
arb
itra
ry u
nit
s)
GC0140σppxf = 20.75 +/- 3.85 km s−1
vr,ppxf = 600 +/- 4.00 km s−1
χ 2red = 0.632
Ntemps = 8
5160 5180 5200 5220 5240 5260 5280 53001.5
1.0
0.5
0.0
0.5
1.0
1.5
2.0
2.5
Resi
duals
5160 5180 5200 5220 5240 5260 5280 5300Wavelength [
◦A]
0.5
1.0
1.5
2.0
Sm
ooth
ed F
lux (
arb
itra
ry u
nit
s)
GC0165σppxf = 10.48 +/- 1.60 km s−1
vr,ppxf = 692 +/- 1.20 km s−1
χ 2red = 0.108
Ntemps = 8
5160 5180 5200 5220 5240 5260 5280 53001.0
0.5
0.0
0.5
1.0
1.5
Resi
duals
5160 5180 5200 5220 5240 5260 5280 5300Wavelength [
◦A]
0.4
0.6
0.8
1.0
1.2
1.4
1.6
1.8
Sm
ooth
ed F
lux (
arb
itra
ry u
nit
s)
GC0306σppxf = 19.78 +/- 0.60 km s−1
vr,ppxf = 736 +/- 0.50 km s−1
χ 2red = 0.005
Ntemps = 11
5160 5180 5200 5220 5240 5260 5280 53000.5
0.0
0.5
1.0
Resi
duals
FIG. 2.— Examples of the ppxf spectral fits (red lines) from a low-quality(top) to a high-quality spectrum (bottom). The reduced spectra (black lines)have been smoothed with a box size of 8 pixels, representative of the instru-mental FWHM of GIRAFFE. The inset blue plots show the residuals, besidewhich we list some output information for each target. From top to bot-tom this information is the GC identification, our adopted σppxf , vr,ppxf ,reduced χ2, and the number of template spectra used in their calculation.
km s−1. The output values for σ and vr are averaged and plot-ted as a function of input values in Figure 3 for comparison.
The top panel of Figure 3 shows that the agreement forσppxf is generally good, with most of the GCs clusteringaround the unity relation. The results of one GC (GC 0382)are not shown, as our new LOSVD value of 178.77±7.58km s−1 is unlikely to be reliable considering that it impliesa dynamical mass of ∼ 109M� within a half-light radiusof ∼ 2 pc. Given that GC 0382 has three independent vrmeasurements confirming it to be a member of NGC 5128(Woodley et al. 2010a, and the present work), and thus nota fore/background source, we adopt Taylor et al.’s σppxf =14.3 ± 3.2 km s−1 for the rest of the analysis. The few otheroutliers in Figure 3 correspond to the former study’s most un-certain GCs, so we prefer our σppxf estimates since our tem-plate library has a significantly wider range of stellar param-

6 M. A. Taylor et al.
5 10 15 20 25 30 35 40 45 50
σ2010 [km s−1 ]
5
10
15
20
25
30
35
40
45
50
σ201
3 [k
m s−
1]
250 350 450 550 650 750 850
vr,2010 [km s−1 ]
250
350
450
550
650
750
850
v r,2
013
[km
s−
1]
FIG. 3.— Comparison of the ppxf accuracy using the GC sample of Tayloret al. (2010) when the spectral range is restricted to that of the GIRAFFEspectra used in this work. The upper panel shows the σ comparison and thelower panel shows the same for vr . In both panels, the Taylor et al. (2010)results are shown along the x-axes and the new results are shown along they-axes. Unity relations are indicated as dashed lines.
eters and much higher S/N ratio over the wavelength rangeused to estimate vr,ppxf and σppxf . Meanwhile, the bottompanel shows that the agreement in vr,ppxf is excellent, withthe scatter around the unity relation being consistent withthe measurement uncertainties. The significant outlier corre-sponds to GC 0382, which we consider to be unreliable anddefer to any previously derived vr estimates in the literature.
Our new vr,ppxf estimates are listed in column four of Ta-ble 2, compared to literature values listed in column three. Wenote that GC 0218, GC 0219, GC 0228 have vr measured forthe first time (528 ± 1.90 km s−1, 661 ± 2.70 km s−1 and478 ± 19.40 km s−1, respectively), all consistent with the541 km s−1 systemic velocity of NGC 5128 (Woodley et al.2010a). There were 15 GCs for which ppxf was unable to pro-vide vr estimates, including GC 0261 and GC 0315, leavingthem still as vr unconfirmed members of NGC 5128. Thus,Table 2 lists new accurate vr estimates for 125 NGC 5128GCs, including three first-time measurements.
We compare the new vr,ppxf estimates to literature radialvelocities (vr,lit) in Figure 4 where vr,lit and vr,ppxf are shownalong the x- and y-axes, respectively. The Woodley et al.(2007) and Woodley et al. (2010a) catalogues provide themost comprehensive collections of NGC 5128 GC radial ve-locities to date. For the comparison we adopt the weighted-average values listed in Woodley et al. (2010a) where pos-sible. If there exists only a single Woodley et al. (2010a)value measured from an individual spectrum, then we adoptthe Woodley et al. (2007) estimates, unless the former agreessignificantly better with our new measurements. Figure 4shows generally good agreement within the literature uncer-tainties, with a single notable exception being GC 0095. Forthis GC, we prefer the literature measurement of vr,lit =374± 34 km s−1 over our σppxf = 826± 7.8 km s−1 becausevisual inspection of the corresponding Doppler shifts shows
50 150 250 350 450 550 650 750 850
vr,lit [km s−1 ]
50
150
250
350
450
550
650
750
850
v r,p
pxf [
km
s−
1]
FIG. 4.— Comparison between the radial velocities newly estimated byppxf, vr,ppxf to those previously measured from the literature, vr,lit. Thecomparison is generally good, as indicated by the dashed line showing theunity relation. However, our measurements are in most cases of significantlyhigher quality, as illustrated by the vr,ppxf error bars, which for our datasetare often on the order of or smaller than the symbol size.
better agreement with the laboratory wavelengths of the spec-tral absorption features when using the former value. Giventhis discrepancy, and the resulting uncertainty of the derivedσppxf , we drop this object from the analysis. In any other casewhere vr are discrepant we prefer our vr,ppxf due to smalleruncertainties.
Despite obtaining reliable vr estimates for almost all of ourtargets, there were 25 GCs for which we consider σppxf tobe unreliable either due to uncomfortably large error bars,or simply a failure to derive an estimate at all. We thereforedrop these targets from the subsequent analysis and carry onwith the remaining 115 new σppxf estimates, including the re-analyzed Taylor et al. GCs.
3.4. Structural ParametersWe took 2D projected half-light radii, rh, and concentration
parameters, c, from the three sources as listed in Table 3. Themajority of the values listed for rh and c are, where available,from Jordan et al. (2015, in prep.), based on HST data, andare otherwise taken from Gomez et al. (2015, in prep.) basedon IMACS data taken under exceptional seeing (. 0.5′′). De-spite the sub-arcsecond seeing conditions, the marginally re-solved nature of most GCs did not allow for accurate c esti-mates by Gomez et al., so for many, a typical value of 1.48was assigned. Moreover, three extremely small IMACS-basedrh estimates exist where there is no HST imaging available;however, these GCs (GC 0085, 0333, 0429) are not resolvedin the images and thus we drop them from the analysis andcontinue with the remaining 112 CSSs. The re-analyzed clus-ters of Taylor et al. (2010) use the same parameters as in thatpaper, namely those derived in Harris et al. (2002a). For thelatter GCs, the rh errors listed are adopted from the same pa-per. At the time of writing, no errors were available for theGomez et al. and Jordan et al. sizes, so for these clusters weadopt values of 0.43 pc, which is the average size error of the

The Dark Side of NGC 5128’s Globular Clusters 7
Taylor et al. (2010) sample, and while representative for thenew HST measurements, may underestimate the IMACS er-rors. Following Harris et al. (2002a), we assume 0.15 for theerrors on all c, noting that these probably underestimate thetrue IMACS-based measurement errors as well. In any case,although assigning error estimates in this manner is not opti-mal, we do not expect it to affect our main results significantlygiven the dominance of σ on the uncertainties of our dynami-cal mass estimates (see § 3.6).
3.5. Aperture CorrectionsThe σppxf values listed in Table 2, while generally accu-
rate, are not appropriate to use when estimating dynamicalmasses. Several effects, both observational (seeing, target dis-tance, etc.) and instrumental (spectral/spatial resolution, sam-pling, etc.), may conspire to affect how representative thelight entering a given fibre aperture may be of objects simi-lar to massive GCs and UCDs (Mieske et al. 2008a). In ourcase the 1.2′′ diameters of the FLAMES fibres correspond to∼ 22 pc at the distance of NGC 5128, so contributions fromstars outside of the core region may skew the σppxf measure-ments to lower values compared to σ estimates correspondingto smaller radii. Here we describe our approach to correct ourmeasured σppxf estimates to values representing both the GCcore regions (σ0) and σ values within the GC half-light radius(σ1/2).
We used the cluster modeling code of Hilker et al. (2007),described in detail in Mieske et al. (2008a), to correct forany aperture effects and determine estimates of σ0 and σ1/2
based on our measured σppxf . This code uses the basic struc-tural data (in our case rh and c) that defines a cluster’s light-profile to generate a 3D King (1966) stellar density profilefrom which an N-body representation of the cluster is createdin 6D (position, velocity) space. Each simulated particle isconvolved with a Gaussian corresponding to the true seeingFWHM (see § 2) and a light profile is generated from whichthe velocity dispersion profile can be obtained.
Using this code, we modeled each of our clusters with 105
particles and binned them radially in groups of 103. The 3Dvelocity information of each subgroup was used to derive σprofiles according to 〈v〉23D = 3σ2 where 〈v〉23D is the squareof the mean of the 3D velocities. To account for the inherentstochasticity of the modeling, the median of the inner-mostfive subgroups, or 5% of the modeled stellar population, wasadopted as σ0, while all particles inwards of rh were used tocalculate σ1/2 for each GC. This process was repeated threetimes per GC. The first set of models used the measured σppxf ,rh, and c as inputs to provide our adopted σ0 and σ1/2, whilefor the other two iterations we added or subtracted the errorsfor the three quantities in order to maximize or minimize themodeled σ estimates, respectively. We then adopted the dif-ferences between the upper/lower bounds and the output σvalues as the corresponding errors. Table 2 lists the resultingσ0 and σ1/2 estimates including our uncertainties (columns 8and 9), alongside the model velocity dispersions correspond-ing to the FLAMES apertures (σm,ap) and the global values(σm,gl). The accuracy of the code is verified by the very goodagreement between the predicted σppxf and measured σm,apat the fibre aperture size.
3.6. Star Cluster Masses and Mass-to-Light RatiosOne of the most direct methods to estimate the dynami-
cal mass (Mdyn) of a single-component compact stellar sys-tem is by the use of the scalar virial theorem (e.g. Binney
& Tremaine 1987) of the form originally derived by Spitzer(1969),
Mdyn ' 2.53σ2
0rhG
' 1743
(σ2
0
km2 s−2
)(rhpc
)M� (2)
if one assumes a dynamically relaxed cluster, sphericity, andisotropic stellar orbits. While this is among the most com-monly used dynamical mass estimators, it has been shown thatthe “half-mass” (M1/2) or in other words the dynamical masscorresponding to that contained within the 2D projected half-light radius is more robust against stellar velocity dispersionanisotropy. This feature makesM1/2 an overall more robustmass estimator for dispersion supported systems. We estimateM1/2 via the form derived by Wolf et al. (2010),
M1/2 = 4〈σ2
los〉rhG
' 930
(〈σ2
los〉km2 s−2
)(rhpc
)M� (3)
where σlos is the luminosity-weighted LOSVD, in our caseaperture corrected to σ1/2.
Applying Equation 3 to all the GCs with available σ1/2,rh, and c provides M1/2 estimates for a total of 112 ofNGC 5128 star clusters, 89 of which are first-time measure-ments, in particular at faint absolute luminosities (see Sec-tion 4.1 and Figure 7). We find in our star cluster sampleM1/2 estimates ranging from the low-mass end,M1/2,min =
3.7+8.9−3.7 · 104M� (GC 0031), to the highest-mass object,
GC 0365, withM1/2,max = 7.41+0.51−0.63 · 106M�, with a sam-
ple median M1/2 of 3.47·105M�. By assuming that massfollows light, these masses translate into total mass estimatesofMtot,min = 7.4+12.6
−7.4 · 104M� representative of the lowerrange of GC masses,Mtot,max = 1.48+0.72
−0.89 · 107M� consis-tent with UCD masses, and a medianMtot = 6.94· 105M�.
Alternatively, we use σ0 to estimateMdyn via Equation 2.By doing this, we lose the benefit of isotropy independence,but gain freedom from the underlying assumption that massfollows light. Encouragingly, we find very similar masses us-ing either estimator at the low-mass tail of the GC mass distri-bution, withMdyn,min = 7.6+17.7
−7.6 · 104M�, and at the high-est mass with Mdyn,max = 1.53+0.12
−0.15 · 107M� and a me-dian Mdyn of 7.04 · 105M�. Interestingly, for total masseshigher than∼1.0 ·106M� we find that the relative differencebetween the estimators becomes more significant for certainclusters.
Figure 5 shows the relative difference between the total dy-namical masses derived using 2 · M1/2 andMdyn as a func-tion of Mdyn for each GC in our sample. Mdyn essentiallypredicts similar (within∼ 1− 5%) masses for “normal” GCs,(.106M�; typical of Local Group GCs). Above this thresh-old the discrepancy between the two mass estimates becomesmore pronounced for certain clusters, reaching up to ∼ 18%higher Mdyn. Altogether, this comparison suggests that fortypical GC masses, i.e. in the range ∼ 105−106M�, wherecluster masses are completely dominated by baryonic mate-rial,M1/2 is the more robust measure of the total GC mass.Above this mass range, and outside of rh any kinematical trac-ers arising from, e.g. non-equilibrium configurations or/anddark gravitating mass components, may introduce biases inthe mass estimates.
We calculate the dynamical mass-to-light ratios evaluatedwithin the half-light radius (Υ1/2
V ) by dividing 2·M1/2 by the
8 M. A. Taylor et al.
TABLE 2STAR CLUSTER KINEMATICS
ID Rgc vr,lit vr,ppxf σppxf σm,ap σm,gl σ0 σ1/2 Ref.[arcmin] [km s−1] [km s−1] [km s−1] [km s−1] [km s−1] [km s−1] [km s−1]
(1) (2) (3) (4) (5) (6) (7) (8) (9) (10)
GC 0028 11.30 558±97 512±1.80 8.95±2.10 8.97+2.06−2.11 8.60+1.80
−1.92 9.87+2.26−2.25 9.52+2.27
−2.25 1GC 0031 10.63 595±202 552±2.80 3.69±4.35 3.67+4.34
−3.65 3.54+4.05−3.53 4.12+4.77
−4.11 3.94+4.68−3.93 1
GC 0048 11.36 509±15 481±1.10 7.61±1.40 7.62+1.38−1.38 7.08+1.13
−1.18 8.25+1.54−1.52 7.93+1.48
−1.45 1GC 0050 8.03 718±16 732±0.70 10.09±0.90 10.01+0.98
−0.82 9.01+0.71−0.61 10.65+0.82
−0.96 10.08+0.92−0.84 1
GC 0052 7.89 276±59 199±15.25 1.09±51.85 · · · · · · · · · · · · 2GC 0053 7.75 503±17 505±1.00 10.50±1.20 10.55+1.10
−1.28 9.95+0.83−1.03 11.91+1.25
−1.42 11.31+1.29−1.41 1
GC 0054 8.12 736±58 734±1.50 9.31±1.70 9.30+1.72−1.68 8.16+1.36
−1.38 9.60+1.84−1.83 9.23+1.63
−1.75 3GC 0058 8.06 685±43 684±0.80 7.60±1.10 7.61+1.06
−1.11 7.47+0.92−1.03 8.50+1.32
−1.22 8.24+1.23−1.31 2
GC 0064 9.42 594±36 574±2.90 16.29±2.90 16.27+2.89−2.89 15.29+2.40
−2.50 17.79+3.35−2.95 17.08+3.14
−3.06 1GC 0065 6.92 331±47 278±1.30 9.78±1.62 9.78+1.58
−1.64 9.13+1.26−1.37 11.25+1.76
−1.96 10.55+1.71−1.78 2
NOTE. — Kinematical data for the NGC 5128 star clusters. Cols. 1 and 2 list the cluster IDs and projected galacto-centric radii respectively, cols. 3and 4 list radial velocities, and cols. 5-9 list σ measured with ppxf and values which have been aperture-corrected to various cluster radii (see § 3.5for details). Where available, all vr,lit values are taken from Woodley et al. (2010a) corresponding to their “mean” values otherwise we adopt the bestmatches from either Woodley et al. (2007) or the estimates from Woodley et al. (2010a) that are based on individual spectra. Table 2 is published in itsentirety in the electronic edition of the Astrophysical Journal. A portion is shown here for guidance regarding its form and content.References for vr,lit. (1) Woodley et al. (2010a); (2) Woodley et al. (2007), their mean; (3) Woodley et al. (2007), LDSS2; (4) Woodley et al. (2007),VIMOS; (5) Woodley et al. (2007), Hydra.
TABLE 3STAR CLUSTER STRUCTURAL PARAMETERS
ID M1/2 Mdyn Υ1/2 Υdyn rh c Ref.[M�] [M�] [M�/L�] [M�/L�] [pc]
(1) (2) (3) (4) (5) (6) (7) (8)
GC0028 0.25+0.12−0.12 0.50+0.24
−0.24 3.42+1.71−1.70 3.45+1.66
−1.66 2.96±0.43 1.48 1GC0031 0.04+0.09
−0.04 0.08+0.18−0.08 0.49+1.16
−0.48 0.50+1.16−0.49 2.58±0.43 1.48 1
GC0048 0.24+0.09−0.09 0.48+0.19
−0.19 2.50+0.98−0.96 2.54+0.99
−0.98 4.08±0.43 1.65 2GC0050 0.66+0.13
−0.12 1.39+0.23−0.26 3.43+0.68
−0.63 3.59+0.62−0.70 7.03±0.43 1.56 2
GC0052 · · · · · · · · · · · · 1.02±0.43 1.48 1GC0053 0.33+0.09
−0.10 0.68+0.18−0.19 3.61+1.02
−1.08 3.76+1.00−1.09 2.74±0.43 1.83 2
GC0054 0.71+0.25−0.27 1.45+0.56
−0.56 4.04+1.45−1.56 4.10+1.59
−1.59 9.01±0.43 1.65 2GC0058 0.12+0.05
−0.05 0.24+0.09−0.09 1.14+0.43
−0.45 1.14+0.44−0.42 1.89±0.43 1.43 1
GC0064 1.02+0.39−0.39 2.08+0.82
−0.73 18.65+7.24−7.07 18.97+7.52
−6.72 3.77±0.43 1.57 1GC0065 0.28+0.10
−0.11 0.60+0.21−0.23 2.23 +0.81
−0.84 2.38+0.84−0.92 2.71±0.43 1.99 1
NOTE. — Structural parameters and dynamical masses of our GC sample. GC 0082, GC 0107, GC 0214,GC 0219, GC 0236, GC 0262, GC 0274, GC 0417, GC 0418, GC 0420, GC 0439, GC 0435, and GC 0437 arebased on de-reddened r′ band data. Table 3 is published in its entirety in the electronic edition of the Astrophys-ical Journal. A portion is shown here for guidance regarding its form and content.References for rh and c: (1) Gomez et al. (2015, in prep.); (2) Jordan et al. (2015, in prep.); (3) Harris et al.(2002a).
total, de-reddened V -band luminosity, calculated as,
LV = 10−0.4(V0−(m−M)0−MV,�) (4)
where MV,�= 4.83 mag. We also calculate dynamical mass-to-light ratios based on σ0 (Υdyn
V ) by dividing Mdyn byLV . Most of our sample have apparent V -band magnitudesprovided in the Woodley et al. (2007) catalogue (see also ref-erences therein), for which we list the de-reddened values inTable 1. We account for foreground reddening on an individ-ual basis, with no attempt to correct for extinction internal toNGC 5128, by using the Galactic Extinction and ReddeningCalculator10 with the galactic reddening maps of Schlafly &Finkbeiner (2011). Where V -band magnitudes are not avail-able, we list de-reddened r′-band magnitudes from Sinnottet al. (2010). If no photometry in the previously mentioned
10 http://ned.ipac.caltech.edu/forms/calculator.html
filters is available, we base our ΥV estimates on the R-bandmagnitudes from the acquisition images, assuming in all casesa conservative photometric error of 0.1 mag.
We find a large spread in the corresponding Υ1/2V ranging
between 0.49M�L−1V,� for GC 0031 up to 64.47M�L−1
V,� for
GC 0225, with a sample median Υ1/2V of 3.33M�L−1
V,�. Sim-ilarly, we find 0.50 ≤ Υdyn
V ≤ 66.61M�L−1V,� with a slightly
higher median value of 3.44M�L−1V,�. While these results
are smaller by 0.47 and 0.36 M�L−1V,� than the median of
3.8M�L−1V,� found by Taylor et al. (2010) for NGC 5128
GCs, they are notably higher than the median ΥV,dyn of2.2 ± 0.3 for Milky Way (MW) GCs (McLaughlin 2000;McLaughlin & Fall 2008) and ΥV,dyn = 1.37 ± 0.28 forM31 GCs (Strader et al. 2011). This result should perhapsnot be too surprising as our sample is biased toward GCs at

The Dark Side of NGC 5128’s Globular Clusters 9
the bright end of the GC luminosity function (GCLF). Thus,we are most likely not including many GCs with typical Lo-cal Group GC masses so that our sample is biased to GCsabove the ∼ 2 · 106M� threshold where Υdyn
V begins torise dramatically (e.g. Hasegan et al. 2005; Kissler-Patig etal. 2006; Mieske et al. 2006, 2008a; Taylor et al. 2010). Con-versely, our sample includes not only those of Taylor et al.,but many fainter GCs, thus reaching well below the afore-mentioned threshold and biasing our medians toward slightlylower values compared to previous studies.
4. DISCUSSION
Correlations between ΥdynV , Mdyn, and absolute magni-
tude (MV ) can provide important information on the dynamicconfiguration and baryonic makeup of star clusters. To inves-tigate these relations, Υdyn
V is shown as a function of Mdyn
and MV for each of our sample GCs in Figures 6 and 7 re-spectively, with the color shading parametrizing GC rh.
Given that the following discussion hinges strongly on thefeatures seen in Figures 6 and 7 having astrophysical explana-tions, we first considered several systematic effects and per-formed corresponding tests to check whether these could biasour measurements and artificially generate the observed re-sults. The description of these tests, including detailed checksfor data analysis biases, target confusion, correlations withgalactocentric radius (Rgc), and/or insufficient backgroundlight subtraction is provided in the Appendix. In summary,none of the tested effects are likely to explain the observedfeatures in Figure 6 and 7, and thus we consider astrophysicalexplanations in what follows.
4.1. Mdyn vs. ΥdynV Relations
105 106 107
Mdyn
[M¯]
5
0
5
10
15
20
Rela
tive D
iffe
rence
[%
]
FIG. 5.— Relative difference between the traditionally used dynamicalmassMdyn and twice the half-mass, i.e.Mdyn−2·M1/2, as a function ofdynamical mass,Mdyn. If mass follows light, then the total GC mass shouldbe approximated by twiceM1/2, hence, the difference being close to zero(dashed line). Here,Mdyn predicts somewhat higher masses than 2·M1/2
for GCs withMdyn&106M�, indicating that for these clusters, mass maynot strictly follow light and either dark gravitating mass components or non-equilibrium configurations may become necessary to explain the discrepancyin dynamical mass estimates of these clusters.
A number of interesting features shown by Figure 6 regard-ing the mass, size and mass-to-light ratios of our sample GCsare of note. We see a clear bifurcation in the Υdyn
V -Mdyn
relations at Mdyn & 106M�, with two well defined se-quences of GCs showing distinct positive slopes. GCs belowMdyn ≈ 106M� do not seem to follow either of these tworelations, appearing to have mass-to-light ratios in the rangeof∼1−5 with no particularly well defined correlation. In gen-eral, the circular points in Figures 6 and 7 indicate a smoothtransition from GCs with massesMdyn ≈ 105 − 106M� tothose with &106M� that follow the two sequences.
To compare our measurements with similar data of LocalGroup GCs we overplot measurements from McLaughlin &van der Marel (2005) for Milky Way (MW), Large Magel-lanic Cloud (LMC), and Small Magellanic Cloud (SMC) GCs,along with data taken from Strader et al. (2011) for M31GCs. It is important to point out here that while the Straderet al. measurements are based on direct kinematical measure-ments, the same cannot be said for the McLaughlin & van derMarel (2005) data since they are based σ0 estimates extrap-olated from modelled light profiles. Thus, while we use theMcLaughlin & van der Marel data as a large, homogeneouscomparison dataset, a true comparison cannot be made un-til Mdyn measurements can be made for a large sample ofMW GCs based directly on stellar kinematics. With that said,both samples align well with the bulk of our NGC 5128 GCsample but extend to significantly lower masses and fainterluminosities. From the comparison with the majority of theLocal Group GC sample, we conclude that the NGC 5128 GCsub-sample withMdyn.106M� and Υdyn
V .5M�L−1� can
be regarded as “classical” GCs similar to those found in theLocal Group that follow the well-known GC “fundamentalplane” relations (Djorgovski 1995; McLaughlin 2000) wherenon-core-collapse GCs in the MW show almost constant coremass-to-light ratios of ΥV,0 = 1.45M�L
−1� .
It is difficult to establish whether the fundamental plane re-lations strictly hold for the “classical” NGC 5128 sub-sampleas the core surface brightness values of these clusters arenot accessible, even with HST imaging. Even so, it can beseen in the middle panel of Figure 8, which compares themass/light properties of our NGC 5128 sample with the Lo-cal Group GCs that the three distributions show a very simi-lar rise up to Υdyn
V ≈ 2M�L−1� ; above which the NGC 5128
sample dominates. With a MW/SMC/LMC sample that under-represents the peak of the GCLF at LV,� ≈ 2 · 105 L� (seebottom panel of Figure 8), it is beyond the scope of this workto verify whether a larger sample of MW/SMC/LMC GCswould “fill in” the distribution shown by our NGC 5128 sam-ple. The M31 sample, on the other hand, tends toward lowerMdyn, despite sampling a similar luminosity range as ourNGC 5128 data. We thus, for now, consider the NGC 5128GC sub-sample shown by the circular points in Figures 6 and7 to simply represent the GCs that populate the Local Group.
More generally, we note that most NGC 5128 GCs haveΥdynV greater than the median value of MW/SMC/LMC GCs
(ΥdynMW ≈ 2.2M�L
−1� ) and significantly higher values than
for M31 GCs (ΥdynM31≈1.37M�L
−1� ), although the latter may
be due to insufficient aperture corrections for extended GCs(see discussion in Strader et al. 2011). With a median Υdyn
V of3.44M�L−1
� , it is tempting to suggest a fundamental differ-ence between Local Group GCs and those in NGC 5128. We
10 M. A. Taylor et al.
104 105 106 107
Mdyn
[M¯]
10-1
100
101
102
Υdyn
V [M
¯/L¯]
GC0225
GC0217
GC0239
NGC1754
NGC2257
Taylor et al. (2010); α=0.24±0.02
DGTO Sequence; α=0.33±0.04
DSC Sequence; α=0.79±0.04
M31 GCs
MW/SMC/LMC GCs
'Classical' NGC5128 GCs
High ΥdynV NGC5128 GCs
Low ΥdynV NGC5128 GCs
0.30
0.45
0.60
0.75
0.90
1.05
1.20
1.35
log(rh)
[pc]
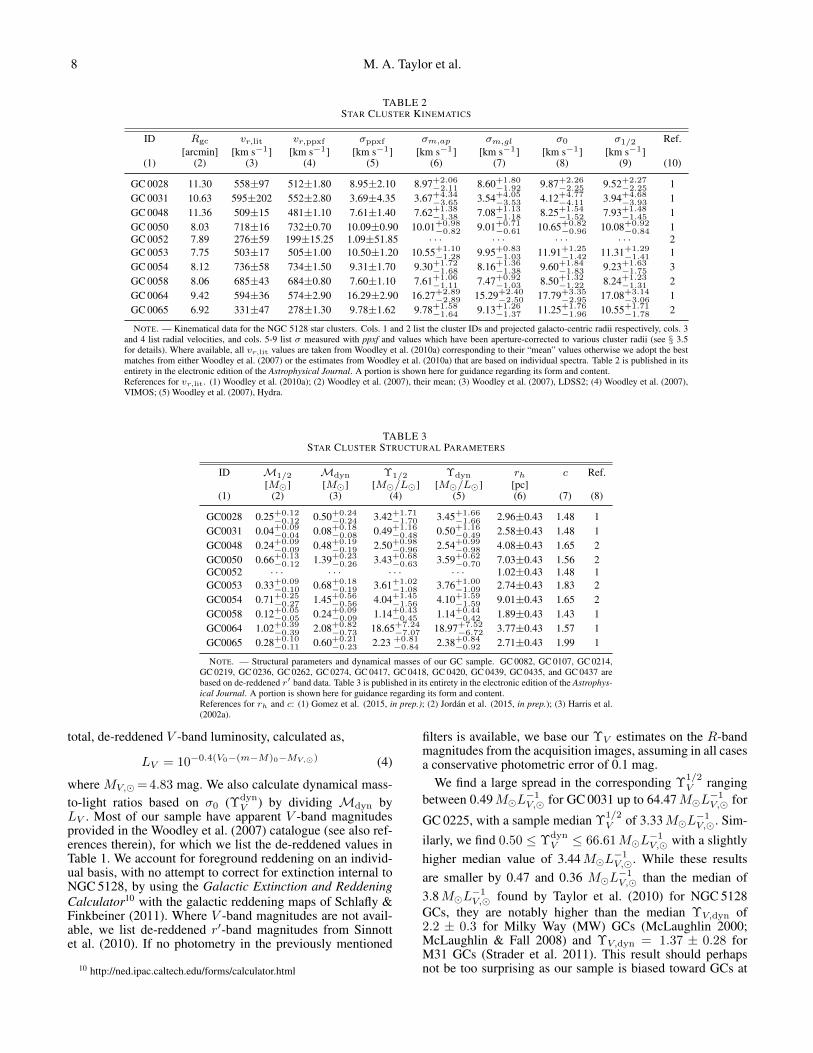
FIG. 6.— ΥdynV as a function ofMdyn, with the color shading indicating the half-light radius of the clusters. Three groups of GCs corresponding to “classical”
GCs, and to the “low-” and “DSC” sequence GCs are indicated by circular, pentagonal, and square symbols, respectively (see legend). The empirical power-law relation of Taylor et al. (2010) is shown by the thin dashed black line, while steeper power-law fits based on the two Υdyn
V branches are shown by thecolored thick dashed lines. The steepest relation (red) is based only on the square points which have been isolated based on their faint absolute magnitudes(MV &−8.5 mag) and high mass-to-light ratios (Υdyn
V ≥6.0M�L−1V,�). Meanwhile, the blue dashed line shows the results of fitting only the pentagonal points
with ΥdynV ≤10.0M�L
−1V,� andMdyn ≥ 2 · 106M�. The solid black line and dark gray shading illustrate the observational limit to our data, while the light
gray shading indicates an approximate lower mass limit for selected GCs in our spectroscopic sample. Several interesting objects that are discussed in the text arelabeled with their catalog numbers. We plot corresponding measurements for Local Group GCs as grey stars (MW/SMC/LMC; taken from McLaughlin & vander Marel 2005) and grey triangles (M31; taken from Strader et al. 2011).
do not strictly support this notion, as a more straight-forwardinterpretation is that we are simply sampling part of theGCMF that is inaccessible in the Local Group due to a dearthof known GCs above 106M�. Indeed, the top panel of Fig-ure 8 demonstrates that the Mdyn distributions of the LocalGroup and NGC 5128 GC samples are very dissimilar; thehighest values are reached by NGC 5128 GCs, followed byM31 and the MW/SMC/LMC. Above Mdyn ≈ 5 · 105M�,the NGC 5128 sample is well represented up to ∼ 107M�,while Local Group GCs are more populous toward the lowertail of the GCMF. Altogether, Figure 8 suggests that theNGC 5128/Local Group GCSs may have fundamentally dif-
ferent GCMFs, given the similarly sampled GCLF (bottompanel), something that can be tested when similar NGC 5128data probing fainter magnitudes becomes available.
Having addressed the main, “classical” body of GCs in Fig-ure 6, we now turn to the two distinct high-Mdyn sequences.In the following we refer to GCs with Υdyn
V & 6 and luminosi-ties fainter than MV = −8.5 mag (see Figure 7) as membersof the “dark star cluster” (DSC) sequence (red dashed line inFigure 6) due to their potential connection to DSCs predictedby theory (see §4.3.2; Banerjee & Kroupa 2011). Those withMdyn & 2 · 106M� and Υdyn
V . 10 that follow the shal-lower Υdyn
V -Mdyn relation (blue dashed line in Figure 6), we

The Dark Side of NGC 5128’s Globular Clusters 11
11109876MV [mag]
10-1
100
101
102
Υdyn
V [M
¯/L¯]
GC0225
GC0217
GC0239
NGC1754
NGC2257
M31 GCs
MW/SMC/LMC GCs
'Classical' NGC5128 GCs
DSC Sequence
DGTO Sequence
0.30
0.45
0.60
0.75
0.90
1.05
1.20
1.35
log(rh)
[pc]
FIG. 7.— ΥdynV as a function ofMV , with cluster half-light radius indicated by the color bar. Symbols are the same as in Fig. 6, with the same objects indicated.
The vertical light-grey line and the shaded zone (MV ≥−7.4 mag) indicate the photometric limit of our spectroscopic sample selection.
refer to as members of the “dwarf-globular transition object”(DGTO) branch, since these objects encroach upon the struc-tural parameter space of the DGTOs reported by Hasegan etal. (2005).
Interestingly, the two objects omitted by these criteria,GC 0217 and GC 0239, lie intermediate between these twosequences and so we refer to them as “intermediate-Υdyn
V ”star clusters (see Figure 6). Their properties may indicate ei-ther an evolutionary connection to one of the sequences, orperhaps represent a separate population that is simply notwell sampled by our data. In terms of structural parameters,the mean rh of the DSC sequence (〈rh〉high = 5.10 pc) ismarginally smaller than that of the DGTO branch (〈rh〉low =6.67 pc), while also smaller in the median (4.01 and 5.59 pc,respectively). Meanwhile, the mean galactocentric radii ofthe two populations are 〈Rgc〉high = 6.97′ and 〈Rgc〉low =9.11′. WELCH 2-sample tests yield that the mean differencesin rh and Rgc are not statistically significant, with p-values of0.27 and 0.15, respectively.
4.2. Properties of the ΥdynV -Mdyn Sequences
To probe the properties of the two ΥdynV -Mdyn sequences,
we fit empirical power-law relations of the form,
ΥdynV ∝Mα
dyn (5)
to approximate the data. In a similar analysis of dispersionsupported CSSs, including a subsample of the GCs consid-ered here, Taylor et al. (2010) found a value of α=0.24±0.02to fit their data, connecting “classical” GCs to more massivesystems like UCDs and dwarf elliptical galaxies. This rela-tion is shown in Figure 6 by the thin dashed black line and istoo shallow to fit either of the Υdyn
V -Mdyn sequences of thepresent GC sample. To better represent the data, we insteadmake an effort to fit power-laws to the sequences individu-ally and find that each is well approximated by distinct, tightrelations as described in the following.
The dashed blue line in Figure 6 shows an approximation tothe DGTO sequence with a power-law slope ofα=0.33±0.04

12 M. A. Taylor et al.
105 106 107
Mdyn
[M¯]
02468
10121416
Num
ber
MW/SMC/LMC (54)NGC 5128 (112)
M31 (163)
5 10 15 20 25
ΥdynV [M¯/L¯]
0
5
10
15
20
25
Num
ber
GC 0140; ΥdynV =31
GC 0225; ΥdynV =67
MW/SMC/LMC (54)NGC 5128 (112)
M31 (163)
105 106
LV [LV,¯]
02468
1012141618
Num
ber
MW/SMC/LMC (54)NGC 5128 (112)
M31 (163)
FIG. 8.— Comparison between the Mdyn (top panel), ΥdynV (middle
panel), and LV (bottom panel) distributions for the NGC 5128 objects ofthe present work (red histograms), and Local Group GCs (MW/SMC/LMC;(blue histograms), and M31; (green histograms)). Opacity has been loweredto show where the distributions overlap. While the MW/SMC/LMC sampleis too small to make strong comparisons to the other two distributions, it isclear that the NGC 5128 sample shows higher medianMdyn and Υdyn
V thanthe M31 sample, despite probing a similar range in LV . The total samplesizes are indicated in parentheses in the legends.
(pentagons in all relevant Figures). This relation fits the dataquite well from the high mass GCs down to∼105M�, whichrepresents a value more typical of Local Group GCs. Mean-while, the DSC sequence (square points in all relevant Fig-ures), shown by the red dashed line in Figure 6 with a steeperslope (α = 0.79 ± 0.04), seems to be created by a funda-mentally different collection of objects. Interestingly, we findtwo LMC GCs (NGC 2257 and NGC 1754, see Figure 6) thatappear to align well with the DSC sequence. While no strongstatements can be made about only two objects, their exclu-sive presence around a currently interacting satellite of theMW marks an interesting starting point to investigate any con-nection to the DSC sequence.
ΥdynV is plotted as a function of MV in Figure 7, which
shows that the DGTO sequence is composed exclusively ofthe brightest GCs of the sample. Thus, the DGTO sequencemay simply be explained by these GCs representing the high-luminosity tail of the GCLF. On the other hand, GCs on theDSC sequence are fainter than DGTO GCs by ∆MV ≈1 mag,making them similar in luminosity to the average GCLF turn-over magnitude found in many GC systems. Furthermore, itcan be seen that the range of rh for the objects on the DSCsequence is not dramatically different from that of the “clas-sical” or DGTO GCs. Collectively, the similarity shown bythese DSC objects in luminosity and size to other GCs inmany GCSs likely explains why they have not been identifiedbefore in other galaxies, as they are only remarkable in theirstellar dynamics properties. Regardless, as this is the first timea clear distinction between two such groups of CSSs has beenmade, this naturally leads to the question of whether these ob-jects should be called GCs at all.
4.3. Possible Origins of the ΥdynV -Mdyn Sequences
Having shown artificial biases to be unlikely drivers of ourresults (see Appendix), the following discusses several astro-physical mechanisms that may generate our observations.
If the DGTO sequence is made up of the brightest “clas-sical” GCs, the Υdyn
V ' 5− 9 values shown by some arestill perplexing in that GCs with Υdyn
V & 5 require addi-tional explanations beyond being the extension of the “clas-sical” GCLF. Effects that can mimic higher than usual Υdyn
Vinclude non-equilibrium dynamical processes (e.g. rotation,pre-relaxation, young stellar populations, tidal disruption) oran exotic IMF. We find several DGTO sequence GCs with el-lipticities, ε & 0.25, indicative of a non-equilibrium dynami-cal state, such as rotation. Other GCs show young (. 8 Gyr)ages (Woodley et al. 2010b), and thus may not be fully re-laxed. Additionally, for four objects on this DGTO sequence(GC 0041, GC 0330, GC 0365, and GC 0378) Harris et al.(2002a) found evidence for extra-tidal light contributing totheir surface-brightness profiles in excess of their King modelfits. For the remainder, the possibility of a particularly bottom-heavy IMF (e.g. Dabringhausen et al. 2008; Mieske et al.2008b) could explain their elevated Υdyn
V estimates.
4.3.1. Globular Cluster Rotation
To probe how non-equilibrium states could explain the el-evated Υdyn
V , we investigate the possible impact of rotationon our mass estimates. Treating the observed Υdyn
V as be-ing strictly the result of the GCs exhibiting a mass excess ata given luminosity with respect to the median Υdyn
MW = 2.2,we calculate for each of our sample GCs the amount of “ex-tra” mass within rh, or ∆M1/2 =
(ΥdynV −Υdyn
MW
)· LV
2 =(ΥdynV −2.2
)· LV
2 . This mass component then needs to beaccounted for by the effects discussed above to explain theelevated Υdyn
V values.Making the naive assumption that ∆M1/2 is entirely due to
rotation, then in the general situation where the rotation axis isaligned at any angle i with respect to the observational plane,stars at rh would require circular velocities of at least,
v sin i'(
∆M1/2G
rh
)1/2
. (6)
To investigate how rotation could explain the ΥdynV esti-
mates, the left panel of Figure 9 shows a comparison betweenv sin i and the average stellar velocity in GCs computed fromthe random stellar motions via σ1/2
√3. The symbols are the
same as in Figures 6 and 7, but with “classical” GCs sim-ply shown as dots. The dashed line in Figure 9 indicates theboundary at which rotation is equal to the random stellar mo-tion component required to be consistent with ∆M1/2. It mustbe acknowledged that the errors bars shown on Figure 9 makeit impossible to definitively discuss the dynamical configu-rations of our sample. On the other hand, the lack of co-mingling between the different groups suggests that the fea-tures seen are probably not solely due to systematic errors,thus they can still be used to make general statements aboutthe populations as wholes, and we proceed with that in mind.
A GC that has a rotation to random motion component ra-tio, v sin i/σ1/2
√3> 1, requires circular velocity speeds that
would destabilize the system if only rotation is to explain its

The Dark Side of NGC 5128’s Globular Clusters 13
10 20 30 40 50 60 70 80 90v sini [km s−1 ]
0
10
20
30
40
50
60
70
80
90
√ 3σ
1/2
[km
s−
1]
Critically Rotating Configurations
Dynam
ically S
tabl
e Con
figur
ations
Unsta
ble
Again
st R
otat
ion
DSC Sequence
DGTO Sequence
Intermediate ΥdynV
"Classical" GCs
105 106 107
M1/2
[M¯]
0.0
0.2
0.4
0.6
0.8
1.0
vsi
ni/√ 3
σ1/
2
DSC Sequence
DGTO Sequence
Intermediate ΥdynV
"Classical" GCs
FIG. 9.— (Left panel): Average measured orbital velocities of cluster stars shown as a function of the minimum circular velocities necessary for rotation aloneto account for the observed mass-to-light ratios. The dashed line represents the critical velocity (assuming sin i = 1, or the maximum observable velocities)at which a) rotation alone is able to explain the elevated Υdyn
V of an object, or/and b) an object of a given mass becomes unstable against rotation, consistentwith a dynamical non-equilibrium state. Symbol shapes are as in Figures 6 and 7, but with the “classical” GCs shown as points and the two intermediate-Υdyn
V GCs (GC 0217 and GC 0239, see Section 4.1) shown as gray symbols. (Right panel): v sin i/√
3σ1/2 as a function of the dynamical half-mass,M1/2,for the same objects. There are correlations for the objects on the DSC and DGTO sequences, with a weaker correlation shown by the “classical” GCs withv sin i/
√3σ1/2&0.2, indicating that GCs become more rotationally supported at higher masses.
∆M1/2. Most DSC objects fall on or below this unity relation.These clusters are generally consistent with non-equilibriumdynamical configurations, and may require at least one othereffect to explain their high Υdyn
V values, e.g. dark gravitatingcomponents. On the other hand, a GC with v sin i/σ1/2
√3<1
can have net angular momentum that can provide a stableconfiguration against rotational breakup. In this case, GCrotation alone can account for their Υdyn
V . Significant errorbars notwithstanding, all of the “classical” GCs along withthose on the DGTO sequence are exclusively consistent withv sin i/σ1/2
√3 < 1. Thus, their elevated Υdyn
V could be ex-plained by rotation without the need to invoke additional com-ponents, bolstering the interpretation that they represent thehigh-luminosity tail of NGC 5128’s GCLF.
As a corollary of the previous exercise, we investigate inthe right panel of Figure 9 whether the ratio v sin i/σ1/2
√3
correlates withM1/2 (see Section 3.6). We find that the DSCand DGTO GC samples appear to exhibit correlations in thisparameter space, hinting at rotational support that increaseswith GC mass. This result concurs with the recent findingsof Kacharov et al. (2014) and Fabricius et al. (2014), whomeasure small but significant rotational speeds in MW GCs.However, given that sin i is likely to be randomly distributedin the range [0..1] (hence, 〈sin i〉 = 2/π), these correlations,if real and due to rotational support alone, should be muchnoisier than what we see in the right panel of Figure 9, andare therefore probably driven by other effects than rotationalone.
4.3.2. Central Massive Black Holes
A potential source of artificially enhancedMdyn values arethe effects of central intermediate-mass black holes (IMBHs;e.g. Safonova & Shastri 2010; Mieske et al. 2013; Leighet al. 2014) of lesser mass, but otherwise not unlike thatfound recently in a UCD (Seth et al. 2014). To estimatethe influence of a putative central compact object we com-pute expected IMBH masses by using our σ0 estimates withthe BH mass vs. velocity dispersion relation, MBH−σ, forCSSs, which is offset from that of pressure supported galac-tic systems (Mieske et al. 2013, their Figure 6). From theMBH−σ relation, assuming that it scales to lower-mass stel-lar systems, we obtain BH masses in the following ranges6.6 · 104 . MBH/M� . 5.0 · 107 for the DGTO GCs,8.5 · 102 . MBH/M� . 2.2 · 106 for the DSC objects,andMBH . 7.6 · 105M� for the combined “classical” andintermediate-Υdyn
V sample.For each GC we integrate the central stellar light pro-
file using our numerical models (see §3.5) until the radiusof the sphere encompasses a stellar mass corresponding to2MBH, assuming the median Υdyn
MW = 2.2. This radius de-fines the IMBH sphere of influence (ri; Merritt 2004). Wethen compute the fraction of the stars within this sphere withrespect to the modeled population falling within our apertures,f(r < ri). In Figure 10, we plot this fraction as a function ofMdyn for our entire sample.
While most of the “classical” and intermediate-ΥdynV GCs
show little dynamical influence by potential IMBHs, there isan upturn in f(r < ri) for GCs with Mdyn & 106M�. Thehigh-mass sub-sample is mostly made up of the DGTO andDSC objects. A MOOD test (Mood 1950) for equal medians(see horizontal lines in Figure 10) provides no evidence for

14 M. A. Taylor et al.
105 106 107
Mdyn [M¯]
0
20
40
60
80
100
f(r<r i
) [%
]
DSC Sequence
DGTO Sequence
Intermediate ΥdynV
"Classical" GCs
FIG. 10.— Fraction of the stellar mass within the sphere of influence of aputative central IMBH, as a function of Mdyn for our entire sample. Theblack dashed line shows the median of the combined DGTO and DSC se-quence GCs, while the red- and blue-dotted lines show the medians for theindividual sub-samples.
a difference in the DGTO and DSC sequence f(r < ri) (p-value=1.00). Specifically, Figure 10 shows a bimodal distri-bution in f(r < ri) for the DSC sequence objects, as 7/17and 8/17 fall either at the ∼ 100% or . 20% levels, respec-tively. Two of these objects show intermediate f(r < ri) '50−60%. For the DGTO sequence GCs there is a smoothertransition from those with little to no influence by a putativeIMBH (7/20) to those which would have the majority of theirstars dynamically dominated by such an object (8/20). Takentogether, the presence of central IMBHs could in principleprovide a plausible explanation for the observed dynamics ofmany objects on both sequences.
We point out that some GCs in the grey shaded region inFigure 10 are identified as X-ray sources, almost all of whichare classified as Low-Mass X-ray Binary (LMXB) hosts fromChandra observations (Liu et al. 2011). 2/17 DSC objects areX-ray sources, compared to 8/20 DGTO GCs. This is in linewith the following argument: given the fainter nature of theDSC objects, they must have fewer stars compared to DGTOclusters at a given Mdyn. With fewer stars providing stel-lar winds/mass-loss, one would generally expect accretiononto an IMBH/LMXB to be less likely compared to DGTOsources.
Given the apparently enigmatic properties of the faint DSCsubsample, it is important to note that BHs dominating theirdynamics might alter our basic assumption of the canoni-cally accepted King (1966) stellar density profile. Spatiallyresolved σ profiles would test the putative central BH sphereof influence and thus the validity of our assumption. Com-pared to a uniformly distributed mass component, a centralIMBH can mimic a dynamical mass as much as 4−5× higherthan the mass of the BH itself (Mieske et al. 2013). Scaling∆M1/2 in this sub-sample down by four then suggests thatBHs of masses 3.9 ·104 .MBH/M� . 1.3 ·106 could plau-sibly provide the σppxf that we observe, as well as the elevated
ΥdynV values. In any case, the lack of a strong correlation in the
f(r<ri) vs.Mdyn plane calls into question whether IMBHswould be the only driver of the two sequences.
Despite the plausibility of single massive central BHs ex-plaining some of our results, the potential connection to DSCspredicted recently by Banerjee & Kroupa (2011) needs to beconsidered. In this scenario, neutron star and BH remnants ofmassive stars gather as a very concentrated central dark sub-cluster. Passages through a strong tidal field act to strip lumi-nous matter from the outskirts, resulting in very high mass-to-light ratios. To be observable, the stellar stripping processmust act on timescales shorter than the self-depletion of darkremnants via encounter-driven mechanisms (e.g. three-bodyinteractions). Banerjee & Kroupa (2011) predict lifetimes ofsuch objects with stellar masses . 105M� orbiting within5 kpc of a MW-like potential to be generally less than 1 Gyr,calling into question the likelihood of observing such a cur-rent population. With that said, we note that given our DSCstellar masses ofM∗ ' 1 − 5 · 105M�, and Rgc & 5 kpc,combined with the predicted correlation between lifetime, andboth M∗ and Rgc, these clusters could plausibly have DSCphases lasting on Gyr timescales. Detailed future modelingwill be critical in determining the plausible parameter spacenecessary for the existence of these objects given the uniquehistory of NGC 5128.
4.3.3. Dark Matter Halos
If central IMBHs are not driving the dynamics of the DSCsequence, then explaining objects with Υdyn
V & 10 becomesvery difficult without requiring a significant amount of darkmatter (DM). It is generally accepted that “classical” GCsare devoid of non-baryonic matter, but this cannot be entirelyruled out (e.g. Moore 1996; Conroy et al. 2011; Sollima et al.2012; Ibata et al. 2013) and may in fact be expected from the-oretical considerations (e.g. Peebles 1984; Saitoh et al. 2006).Having considered and ruled out inflated Υdyn
V values dueto myriad observational/instrumental effects (see Appendix),and/or severely out-of-equilibrium dynamical states (see Sec-tion 4.3.1) due to, e.g., rotation, we now consider the impli-cations of the DSC sequence being due to the onset of DMdomination in low-mass systems (M&105M�).
The red-dashed line in Figure 11 shows the difference inΥdynV between the DGTO and DSC power-law fits as a func-
tion ofMdyn. In other words, this relation shows the amountof DM required to explain the exponentially increasing massexcess compared to “classical” GCs. If dark matter is behindthe DSC objects, then the sharp truncation atMdyn≈105M�hints at a population of increasingly DM dominated structuresin the immediate vicinity of NGC 5128 with masses as low asa few times 105M�.
Recent modeling has shown that in a realistic galaxy clusterpotential, as much as 80-90% of a dwarf galaxy’s DM halomay be stripped before baryonic losses become observable(Smith et al. 2013a). If the DSC objects originate from low-mass halos that have been stripped during their passage(s)through NGC 5128’s potential well, this then implies pro-genitors of Mdyn (and thus Υdyn
V ) ∼ 10× higher than weobserve. This scenario would suggest that at one point intime during the assembly history of NGC 5128 there mayhave been a population of compact, low-luminosity baryonicstructures inside the virial radius of NGC 5128 embeddedwithin extraordinarily compact dark matter halos of 107 .Mdyn/M� . 108 with 100 . Υdyn
V /M�L−1� . 700 (e.g.

The Dark Side of NGC 5128’s Globular Clusters 15
105 106 107
Mdyn
[M¯]
10-1
100
101
102
103
∆Υ
dyn
V [M
¯/L¯]
FIG. 11.— Difference in ΥdynV between the red- and blue-dashed lines in
Figure 6 (red relation), and the observational limit of our data (black rela-tion) as a function of Mdyn. The dominance of the dark gravitating masscomponent exponentially increases above a truncation mass of a few times105M�.
Ricotti 2003).If the above is true, then the truncation of the red-dashed
line in Figure 11 at ∼ 105Mdyn may mark the limit be-low which primordial DM halos have not survived accretionevents onto larger galaxy structures. This result is consistentwith the picture recently put forward in Puzia et al. (2014)where the sizes of outer halo star clusters are truncated bythe abundance of small DM halos (see also Carlberg 2009;Carlberg et al. 2011; Carlberg & Grillmair 2013). In this sce-nario, CSSs of larger masses suffer higher levels of dynamicalfriction than low-mass clusters while moving through the po-tential well of the host galaxy and sink closer in to the centralbody (e.g. Lotz et al. 2001). While sinking, they suffer extraharassing encounters in the more crowded core region, whichact to further truncate their sizes (e.g. Webb et al. 2013). Theabove may be the explanation for why the DSC objects havesizes typical of Milky Way GCs (see Figures 6 and 7, and alsoFigure 16 in Puzia et al. 2014).
4.4. Potential Progenitors of the DSC Sequence GCsFigure 7 shows that with magnitudes of −8.5 . MV .−7.4 mag, the DSC objects are among the intrinsicallyfaintest star clusters of our sample. This range scratches thepeak of the GCLF and begins to infringe upon the realm ofultra-faint dwarf galaxies (UFDs) in the Local Group, whichare thought to be the extension of the dwarf spheroidal (dSph)galaxy population to lower luminosities (MV &−8 mag; e.g.,Willman et al. 2005; Zucker et al. 2006; Belokurov et al. 2007;Zucker et al. 2007; McConnachie et al. 2009; Brown et al.2012). Despite smaller sizes than known Local Group dSphs,the combination of high Υdyn
V and low luminosities shownmay suggest an evolutionary link to a putative population ofdSph- and/or UFD-like, dark-matter dominated dwarf galax-ies. If so, they must have undergone an extremely compactand therefore efficient early star-formation burst before being
tidally stripped of most of their dark-matter halos during sub-sequent interactions with NGC 5128 (e.g. Smith et al. 2013a;Garrison-Kimmel et al. 2014; Sawala et al. 2014).
The fact that we do not observe current tidal features indica-tive of stripping might be due to the surface brightness limitsof available data, but higher (i.e. non-equilibrium) LOSVDsmight still be consistent with theoretical predictions. For in-stance, Smith et al. (2013b) model a dwarf galaxy similarto the UFD UMaII, which with σ = 6.7 km s−1 (implyingΥdynV ≈ 1000; Simon & Geha 2007) is an obvious likely can-
didate for a DSC sequence object progenitor. By subjectingit to tidal forces in a Milky Way-like gravitational potential,these authors successfully reproduced many observed prop-erties (e.g. luminosity, central surface brightness, ellipticity,etc.) of UMaII, and found that the galaxy’s σ can be boostedon timescales of a few Gyr, in particular around the apocen-tre of the orbit. Their modeling showed that “σ boosting” caneasily reproduce UMaII’s σ, and can even reach extreme lev-els of>20 km s−1 when the orbital trajectory is close to beingperpendicular to the disk of the host galaxy. The models there-fore suggest that the extreme Υdyn
V for the DSC objects couldpotentially be explained without requiring large amounts ofDM. While this result, assuming that “σ boosting” scales toa gE galaxy like NGC 5128, might be sufficient to explain ahandful of the DSC clusters, we consider it highly unlikelythat all such clusters can be accounted for, due to the requiredsynchronization of their apocentre passages and current line-of-sight alignments. Note that this mechanism would gener-ally introduce scatter rather than producing the sequences ob-served in Figure 6.
Assuming that “σ boosting” is unable to solely account forthe DSC objects, then the small sizes compared to UFD-likegalaxies call for careful skepticism if DM is the preferred ex-planation. For example, characteristic central DM densitiesfor dwarf galaxies, if canonical halo profiles are assumed, canrange from 0.1M� pc−3 for preferred cored profiles, to asmuch as 60M� pc−3 for cuspy profiles (e.g. Gilmore et al.2007; Tollerud et al. 2011). In this case, the required DMmasses (MDM) of 1.6 · 105 < MDM/M� < 5.4 · 106 andcorresponding densities (ρDM) of 40 < ρDM/M� pc−3 <4.5 · 104 within the DSC cluster half-light radii are at leastthree orders of magnitude higher than those expected from acuspy dwarf galaxy profile, or if cored, they would each needto be embedded in ∼ 1014 − 1015M� halos.
Irrespective of this problem, such high DM densities mightactually give rise to central baryonic concentrations that en-able the formation of IMBHs. This might be realized by trig-gering an extremely dense central stellar environment, leadingto a runaway collisional event that culminates with the forma-tion of a central BH that might continue to grow through theaccretion of binary star and higher-order multiplets.
Given all of these interpretations, it seems just as likelythat a combination of central IMBHs and/or dark stellar rem-nants, cuspier-than-expected DM halos, and/or “σ boosting”could be at work. This conclusion may in fact be the mostreasonable one, given that IMBHs would presumably be ofdwarf galaxy origin given the difficulty in building up such amass in a GC-like structure without just as remarkable earlystar-formation efficiency. Then, the residual DM leftover afterstripping, if cuspy, in combination with “σ boosting”, may besufficient to produce these new objects. This final interpreta-tion would then require both less extreme BH and DM masses,while avoiding the orbital synchronization problem. Regard-

16 M. A. Taylor et al.
less of the mechanism giving rise to them, the emergence ofthe DSC sequence objects is a very unexpected result and callsfor detailed follow-up observations and high spatial resolutionmodeling.
5. SUMMARY & FUTURE OUTLOOK
New high-resolution spectra of compact stellar objectsaround the giant elliptical galaxy NGC 5128 (Centaurus A)were analyzed. We combined these data with a re-analysisof 23 clusters from the literature and used a penalized pixelfitting technique to derive new radial velocities for 125 ob-jects (3 first-time measurements), as well as line-of-sightvelocity dispersions for 112 targets (89 first-time measure-ments). Based on these estimates we derived dynamical massand mass-to-light ratio estimates by combining the new kine-matical information with structural parameters (mostly ob-tained from HST imaging) and photometric measurementsfrom the literature.
We briefly summarize our results as follows:
• At intermediate GC masses (105 .Mdyn/M� . 106) wefind the expected population of “classical” GCs, with noanomalous kinematical results. These GCs resemble thoseof the Local Group in every way, albeit being slightlybrighter than average due to our sample selection bias.
• At the high-mass end (Mdyn & 106M�), we find at leasttwo distinct star-cluster populations in the Υdyn
V -Mdyn
plane which are well approximated by power-laws of theform Υdyn
V ∝Mαdyn.
– The “DGTO sequence” is comprised of objects withMdyn & 2 · 106M� and Υdyn
V . 10M�L−1� and
is well described by a power-law with a slope α =0.33± 0.04.
– The “DSC sequence” objects have Mdyn similar tothe DGTO sequence clusters, but with a significantlysteeper power-law slope, α = 0.79± 0.04. More-over, the faint magnitudes (MV & −8.5 mag) leadto anomalously high (Υdyn
V ≥ 6M�L−1� ) mass-to-
light ratios. We point out that at least two LMC GCs(NGC 1754 and NGC 2257) also appear to follow thisrelation.
Despite being among the brightest clusters of our sample,some DGTO sequence objects show relatively high mass-to-light ratios in the range 5 . Υdyn
V /M�L−1� . 10, which
require explanation if a non-baryonic mass component is tobe avoided. We find that extreme rotation and/or dynamicallyout of equilibrium configurations can explain their kinemat-ics as well as indications of higher levels of rotational sup-port with increasingMdyn. Plausible alternative and/or con-current explanations also include particularly top- or bottom-heavy IMFs, or the dynamical influence of central IMBHs.Altogether we consider that these objects represent the verybright tail of the GCLF which is well represented aroundNGC 5128, but poorly populated in the Local Group.
While the DGTO sequence has a fairly pedestrian expla-nation, the 6 . Υdyn
V /M�L−1� . 70 values of the DSC se-
quence objects are much more difficult to reconcile with theDGTO branch scenarios, save for a small subset. We investi-gated in detail (see Appendix, for details) the potential impact
of observational, low S/N, and/or instrumental effects on arti-ficially inflating the DSC values, and found that astrophysicalexplanations are required.
For most of these objects the average stellar velocities (vis-a-vis the observed σ0 values) do not appear to be high enoughfor extreme rotation to explain their dynamics, and if theywere, then the clusters would be unstable against rotationalbreak-up. Moreover, it is highly unlikely that all clusterswould have their rotation axes aligned with the plane of thesky (assuming sin i ∈ U [0, 1]), as would be needed to repro-duce and minimize the scatter in the observed Υdyn
V vs.Mdyn
relation. Combined with the difficulty in explaining a mech-anism that would impart and maintain the necessary angu-lar momentum for such large rotational velocities, we thusconsider extreme rotation/significantly out-of-equilibrium dy-namical configurations insufficient and unlikely to explaintheir properties.
We considered the plausibility of central IMBHs and acentral accumulation of dark stellar remnants, consisting ofstellar-mass BHs and neutron stars, to be driving the extremedynamics of the DSC clusters. If they exist, then putative cen-tral IMBHs and remnant population can plausibly influenceenough of the stars in many of the DSC clusters to providean explanation for their velocity dispersion measurements. Infact, if our assumed canonical structural profiles were suffi-ciently perturbed by an IMBH’s presence and/or stellar rem-nant population, then this explanation requires even less mas-sive IMBHs to become plausible. With that said, given thatthe IMBH + stellar remnant interpretation can only accountfor the dynamics of ∼ 50% of these objects, this is unlikelyto explain the emergence of the DSC sequence.
If central IMBHs and stellar remnant populations are notthe only cause of the elevated Υdyn
V , then the possibility ofsignificant dark matter mass components must be considered,despite the wide acceptance that “classical” GCs are devoidof DM. This result would have important implications for GCformation models and early structure formation, and indicatethat not all extragalactic star clusters are genuine GCs. Moreimportantly, the presence of such amounts of DM in the DSCsequence objects would imply that they represent the lowestmass primordial dark matter halos that have survived accre-tion onto larger-scale structures to the present day. In otherwords, there may still exist a large reservoir of 105M�-scaledark matter halos surviving in relative isolation in the universetoday, at least around relatively quiescent larger dark matterhalos like NGC 5128. Moreover, if these objects are strippedof formerly more massive dark matter halos, presumably asformer dwarf galaxies, this would imply the presence of a sig-nificant collection of objects with 107 .Mdyn/M� . 108,and 100 . Υdyn
V /M�L−1� . 1000 in the relatively recent
past of NGC 5128.This interpretation is not without its serious problems. For
example, with the above properties, central (∼ 10 pc) DMmasses/densities on the order of∼103× larger than canonicalDM halo profiles would be required; a scenario that cannotbe reconciled with any current theoretical framework. Giventhe improbability that such massive central BHs, exotic andultra-concentrated DM halos, or extremely out-of-equilibriumdynamical configurations can individually explain the proper-ties of the DSC sequence objects, it seems perhaps most likelythat a mixed bag of such factors may be at play behind this re-sult, although it is puzzling how a combination of these phys-ical mechanisms would conspire to generate a relatively sharp

The Dark Side of NGC 5128’s Globular Clusters 17
ΥdynV vs.Mdyn relation.It remains to be seen if similar objects exist in the star clus-
ter systems of other galaxies, but verification of these resultswill be difficult for more distant systems due to their intrinsiclow luminosities. Nonetheless, detailed chemical abundancestudies of these objects will shed light on the origins (e.g. pri-mordial or not, simple or multi-generational stellar popula-tions, etc.) of both DGTO and DSC clusters. While the prox-imity of NGC 5128 provides the possibility to study the in-ternal dynamics and stellar populations of its CSSs, the dis-tance approaches the limits of what is currently feasible withtoday’s instrumentation on 8-10m class telescopes. Nonethe-less, large-scale, complete studies of the chemo-dynamicsof GCs in the Local Group, and of giant galaxies within∼ 5 Mpc, will help reveal the true nature of this enigmaticnew type of compact stellar systems.
We wish to thank Andres Jordan for providing us with
rh measurements based on Hubble Space Telescope observa-tions prior to publication, and Tim-Oliver Husser for his helpwith the latest version of the PHOENIX library. We thankRoberto Munoz, Mia Bovill, Jincheng Yu, Simon Angel,Rory Smith, Graeme Candlish, Steffen Mieske, and PavelKroupa for fruitful discussions and comments that servedto improve the manuscript. We also extend our gratitude tothe anonymous referee for constructive criticisms that sig-nificantly improved this work. This research was supportedby FONDECYT Regular Project Grant (No. 1121005) andBASAL Center for Astrophysics and Associated Technolo-gies (PFB-06). M.A.T. acknowledges the financial supportthrough an excellence grant from the “Vicerrectorıa de Inves-tigacion” and the Institute of Astrophysics Graduate SchoolFund at Pontificia Universidad Catolica de Chile and theEuropean Southern Observatory Graduate Student Fellow-ship program. M.G. acknowledges financial support throughProject “Nucleo de Astronomia”, Universidad Andres Bello.
Facilities: Very Large Telescope:Kueyen (FLAMES), HST(ACS), Magellan:Baade (IMACS).
APPENDIX
TESTING FOR POTENTIAL DATA ANALYSIS BIASES
We investigated the potential of erroneous literature measurements giving rise to the DSC sequence in Figure 6, and find thatone object may be explained by discrepancies found in the literature. For GC 0225, we took the apparent magnitude V = 19.93mag from the Woodley et al. (2007) catalogue, which is 2.86 magnitudes fainter than in the discovery publication of Holland etal. (1999). We do not attempt to explain this discrepancy, but note that if the brighter measurement is used, it leads to Υdyn
V afactor of ∼14 lower, bringing it more in line with the DGTO sequence. Additionally, Mieske et al. (2013) note an inconsistencyin the size measured by Holland et al. (1999), suggesting that rh is ∼ 3.8× smaller than originally estimated. The smaller sizewould naturally lower Υdyn
V by the same factor, bringing it more in line with the two intermediate (but still & 10) ΥdynV clusters. If
GC 0225 is both brighter and smaller, then its ΥdynV would approach one. Eliminating it from the power-law fit results in virtually
the same slope (α=0.78±0.06), with slightly larger scatter.We also tested for various data reduction effects that may artificially give rise to the DGTO and DSC sequences. For example,
a straight-forward explanation is that in performing the convolutions to estimate σppxf , the ppxf code may have “jumped” overthe targeted Mgb and Fe 5270 spectral features and based the kinematics on the wrong combination of spectral lines due to therelatively low-S/N of some spectra. This explanation would require an error on vr,ppxf of &100 km s−1 which Figure 4 indicatesis not present in our data. Still, given that multiple vr measurements can be found in the literature for many of our sample GCs,we individually investigated the DSC sequence objects to search for any literature vr estimates that are discrepant by & 100 kms−1. We found only three such clusters (GC 0115, GC 0225, and GC 0437 by ∆vr,max =142, 93, and 110 km s−1, respectively),noting that they each fall within the error bars of at least one literature value. Nonetheless, even if all of three GCs are omittedfrom the fit shown in Figure 6, the relation again does not change significantly (α=0.78±0.06).
TESTING FOR TARGET CONFUSION
The significant luminosity difference between the DGTO and DSC sequence GCs calls for investigations into whether thebifurcation is due to observational effects. In general, it is unlikely that any contamination of the sampled GC flux by othersources would produce two such relations, instead of just increased scatter. However, to address this issue we have visuallyinspected all available archival HST imaging data for any potential contamination of the DSC sequence GCs and found noindications for any target confusion due to foreground starlight, background galaxies, or enhanced surface brightness fluctuationsof the surrounding galaxy light for each GC.
TESTING FOR SPURIOUS RESULTS DUE TO NOISY SPECTRA
The well-defined DSC relation could be due to the observational limit of our data. The solid black line shown in Figure 6 showswhere GCs with MV = −7.4 mag (the faintest measured objects in our sample) would lie. Objects to the left are inaccessible toour survey, and the nearly parallel alignment of this line to the DSC sequence suggests that the small scatter may be an artifact ofthis limit. Indeed, the left panel of Figure 12 shows σppxf as a function of MV for our entire sample with symbols as in Figure 6,but GCs with unreliable σppxf shown as open grey circles, and the inset histogram showing the MV distribution of GCs forwhich ppxf could not derive a σppxf estimate. It can be seen that most objects with poor/unavailable σppxf encroach upon theluminosities of the DSC sequence. These objects are possibly “classical” GCs with absorption features too narrow for GIRAFFEto resolve, and/or for ppxf to accurately measure through the noise, whereas DSC objects have features sufficiently broadened tobe measurable. This effect would give the false impression that almost all objects of MV &−8.0 mag seem to have anomalouslyhigh Υdyn
V . In fact, the objects on the DSC sequence (red squares) show a trend of higher luminosity with larger σppxf , contrary

18 M. A. Taylor et al.
11.511.010.510.09.59.08.58.07.5MV [mag]
0
10
20
30
40
50
60
70
80
σppxf
DSC Sequence
DGTO Sequence
"Classical" GCs
Unreliable σppxf
11.511.010.510.09.59.08.58.07.50
1
2
3
0 1 2 3 4 5
Noise Factor20
10
0
10
20
30
(σnoi
sy -
σppxf) [km
s−
1]
0.2
0.0
0.2
0.4
0.6
0.8
1.0
1.2
log(∆σ
noi
sy)
[km
s−
1]
FIG. 12.— (Left panel): σppxf values as a function of MV , with brightness increasing to the right. Symbol shapes are as in Figure 6, with the addition ofobjects for which σppxf could not be estimated (grey inset histogram) or which we considered unreliable (open grey circles). (Right panel): Difference betweenvelocity dispersion measured on spectra with artificially added noise, σnoisy, and our measurements, σppxf , as a function of the amount of noise added in unitsof the standard deviation of the original spectra. The errors of the σnoisy measurements are shown on a logarithmic scale, parametrized by the color shadingto illustrate the increased uncertainties as more noise is added. If poor-quality spectra were the cause of the DSC sequence, an upturn of the σnoisy−σppxfdifference would be expected towards larger noise factors; however, the symmetric increase in spread to both negative and positive σnoisy−σppxf values clearlyrules out this possibility.
to the expectation if noise were “washing-out” the finer spectral details used to estimate σppxf .Since the DSC sequence objects are among the faintest objects in our sample (see Figure 7), an obvious point of concern
is that their spectra are among the noisiest. We therefore performed the following test to check against the potential of noise“washing out” some of the finer spectral details used to estimate σppxf , thus tricking the code into estimating systematicallywider dispersions. We took four DGTO sequence GCs (GC 0106, GC 0277, GC 0306 and GC 0310; chosen to cover a reasonableluminosity range), artificially added varying levels of noise, and repeated the σppxf measurements. For each GC we added noise,pixel by pixel, by randomly drawing from a N(0, n · σspec) distribution where σspec is the flux dispersion intrinsic to eachspectrum, and n is drawn from U(0, 5) distributions. This procedure decreases the spectral S/N by a factor 1/n. Repeating thisprocess 100 times for each GC then builds a picture of how well behaved the ppxf code is for increasingly noisy spectra. The rightpanel of Figure 12 shows the results of this exercise for all four GCs and it is clear that even for large amounts of noise, the pointscluster well around the adopted σppxf values, with increased dispersion bracketing the nominal values accompanied by largererrors. If sudden “jumps” in σppxf due to noisy spectra were the cause of the elevated Υdyn
V shown by the DSC sequence, then itwould be expected that the points in Figure 12 would tend towards higher σnoisy estimates with stronger amplified noise. No hintof such asymmetric trend is seen in the plot, and we conclude that the DSC sequence is not artificially created by poor qualityspectra.
TESTING FOR CORRELATIONS WITH GALACTOCENTRIC RADIUS AND AZIMUTHAL ANGLE
In searching for the origins of the structures found in Figure 6, in particular the bifurcation at highMdyn, we test whether anycorrelation of the measured σppxf with spatial distribution might give deeper insight into our results. For the following, we notethat we are using the raw σppxf measurement directly obtained from the spectra without subsequent correction for GC light profilesampling. We plot in Figure 13 σppxf as functions of galactocentric radius (Rgc; left panel), and azimuthal angle (Φ; right panel),where 0◦ corresponds to north and Φ increases clockwise. We find no indications for any σppxf -Rgc or σppxf -Φ correlations forour GC sample. More importantly, we find no such correlations for either of the GC sub-samples, in particular for the DSC GCs(red squares). We conclude that systematic variations in σppxf as a function of spatial distribution are not responsible for thebifurcation in the Υdyn
V -Mdyn relation.
TESTING FOR GALAXY SURFACE BRIGHTNESS CONTAMINATION
Here we investigate the fractional flux from NGC 5128’s diffuse galaxy light component that enters each fibre together withthe GC light. We consider the potential impact of such fibre contamination, which could potentially lead the ppxf code to predictartificially high σppxf values. However, if this was the case, one would expect that the associated error bars would reflect thisuncertainty (given full error propagation), and/or that the elevated Υdyn
V values required to explain the DSC sequence (see §4.2)would either tend towards higher values with decreasing luminosity, which is not seen in our data (see Figure 7 and 11), or that

The Dark Side of NGC 5128’s Globular Clusters 19
5 10 15 20 25
Rgc [kpc]0
10
20
30
40
50
σppxf [
km
s−
1]
DSC Sequence
DGTO Sequence
Intermediate ΥdynV
"Classical" GCs
50 100 150 200 250 300 350
Φ [deg]0
10
20
30
40
50
σppxf [
km
s−
1]
DSC Sequence
DGTO Sequence
Intermediate ΥdynV
"Classical" GCs
FIG. 13.— (Left panel): Raw σppxf measurement shown as a function of galactocentric radius, Rgc, with symbols as in Figures 6 and 7. (Right panel): Sameas in the left panel, but showing σppxf as a function of azimuthal angle, with 0◦ corresponding to North and increasing clockwise (see also Figure 1). No obviouscorrelations between σppxf , Rgc, or Φ are seen, effectively ruling out the possibility of systematic variations of σppxf with spatial distribution giving rise to theDGTO or DSC sequences.
105 106 107
Mdyn
[M¯]
100
101
102
Υdyn
V [M
¯/L
¯]
'Classical' GCsDSC Sequence
DGTO Sequence 20.1
20.4
20.7
21.0
21.3
21.6
21.9
22.2
µC
enA [m
ag /
arc
sec−
2]
105 106 107
Mdyn
[M¯]
100
101
102
Υdyn
V [M
¯/L
¯]
'Classical' GCsDSC Sequence
DGTO Sequence
0.00
0.25
0.50
0.75
1.00
1.25
1.50
1.75
log(f
(LC
enA))
[%
]
FIG. 14.— ΥdynV -Mdyn plane as in Figure 6, but now in the left panel with the local NGC 5128 surface brightness parametrizing the data point color, and in
the right panel with the decadal logarithm of the fractional NGC 5128 galaxy light contribution to each of the sampled GC fluxes, before sky subtraction.
there would be a vanishing or no ΥdynV -Mdyn correlation at all. As can be seen in Figure 6, the DSC sequence is consistent with
the individual error bars, which themselves are dominated by the fully propagated uncertainties on σ.Given that our background light SED modeling and subsequent subtraction from each fibre is not a localized process (see§ 2.3), visual inspection of the sky+background subtracted GC spectra indicated that they should not be significantly affectedby residual galaxy light contamination. To be sure, we explicitly calculated the expected residuals by comparing the differencebetween the flux of NGC 5128 at the location of each target and our final sky estimates to the flux of our final target spectra. Theresults suggested that residual components due to diffuse galaxy light is for all GCs <4%, and in most cases near the 1% level,with the expected trend toward lower residuals with increasing Rgc. We then tested for the maximal effects of these residualson the DSC sequence objects by adding the signal from the nearest sky fibre to the final, reduced target spectra at flux levelsbetween 1% and 90% of the object flux and re-measuring σppxf . The results showed that below ∼ 20 %, the effect on σppxf was

20 M. A. Taylor et al.
negligible, above which σppxf monotonically growing with increased sky contamination, as one would expect.In any case, we plot in the left panel of Figure 14 the Υdyn
V -Mdyn plane, as in Figure 6, but parametrize the data pointcolor this time with the local surface brightness of NGC 5128 at each GC location. We obtain the surface brightness valuesfrom the profiles measured as part of the Carnegie-Irvine Galaxy Survey (CGS; see Ho et al. 2011; Li et al. 2011). No obviouscorrelations with local surface brightness values are found that would drive the bifurcation in the Υdyn
V -Mdyn relation. Wecontinue by using the surface brightness profile for NGC 5128 to compute the fractional background flux, f(LCenA), enteringeach fibre with the GC fluxes. The right panel of Figure 14 shows the results, with color parameterized by log f(LCenA) beforeany sky+background subtraction is performed. Several results are shown: 1) The “classical” and DGTO sequence GCs revealthe expected correlation between GC mass (i.e. luminosity) and f(LCenA) with a decreasing f(LCenA) sequence from ∼ 30%for the low-mass GCs to negligible fractions for the highest-mass clusters; 2) GCs on the DSC sequence show on average largerf(LCenA) than GCs on the DGTO sequence as expected from the trends seen in Figure 7, which shows that DSC GCs haveluminosities of −8.5 . MV . −7.5 mag; 3) The DSC sequence GCs show no correlation between f(LCenA) and Υdyn
V orMdyn, in contrast to the expectation if the Υdyn
V -Mdyn sequences were created by insufficient background light subtraction.While Figure 14 illustrates fibre contamination before any sky modeling and subtraction was carried out, we performed
one final test to check for the worst effect that insufficient background subtraction could have. We first identified higher-S/N GCs with σppxf equivalent to that which would give a “normal” Υdyn
V for a DSC sequence cluster. For example, giventhe DSC GC 0324’s σppxf,GC 0324 = 24.89 km s−1 and Υdyn
V,GC 0324 = 14.07M� L−1� , we identified the DGTO GC 0050 with
σppxf,GC 0050 = 10.09 km s−1, which would give ΥdynV,GC 0324 = 2.31M� L
−1� . Using three such combinations, we scaled the
individual spectra of the bright GC, pre-sky subtraction, to the flux level of the fainter cluster, and added the nearest sky fibre’ssignal. Performing the sky subtraction as before (see § 2.3) with the next three closest fibres then simulated the noise levels of thefaint GC, but preserved the spectral details of the brighter. Measuring σppxf on the degraded spectrum was, at worst, consistentwith our adopted measurements, and even led to a slightly lower σppxf for two of the experiments. We conclude that improperbackground subtraction is thus very unlikely to inflate our σppxf measurements of the DSC sequence objects.
REFERENCES
Ashman, K. M., & Zepf, S. E. 1998, Globular Cluster Systems (Cambridge,UK; New York : Cambridge University Press)
Ashman, K. M., & Zepf, S. E. 2008, Globular Cluster Systems, (Cambridge,UK: Cambridge University Press)
Banerjee, S., & Kroupa, P. 2011, ApJ, 741, L12Barmby, P., Holland, S.T., & Huchra, J.P. 2002, AJ, 123, 1937Barmby, P., McLaughlin, D.E., Harris, W.E., Harris, G.L., & Forbes, D.A.
2007, AJ, 133, 2764Beasley, M.A., Bridges, T., Peng, E., et al. 2008, MNRAS, 386, 1443Bedin, L.R., Piotto, G., Anderson, J., et al. 2004, ApJ, 605, 125Belokurov, V., Zucker, D. B., Evans, N. W., et al. 2007, ApJ, 654, 897Bianchini, P., Varri, A. L., Bertin, G., & Zocchi, A. 2013, ApJ, 772, 67Binney, J., & Tremaine, S. (ed.) 2008, Galactic Dynamics (2nd ed.;
Princeton, NJ: Princeton Univ. Press)Brown, T. M., Tumlinson, J., Geha, M., et al. 2012, ApJ, 753, L21Burstein, D., Faber, S. M., Gaskell, C. M., & Krumm, N. M. 1984, ApJ, 287,
586Cappellari, M., & Emsellem, E. 2004, PASP, 116, 138Carlberg, R. G. 2009, ApJ, 705, L223Carlberg, R. G., Richer, H. B., McConnachie, A. W., et al. 2011, ApJ, 731,
124Carlberg, R. G., & Grillmair, C. J. 2013, ApJ, 768, 171Chilingarian, I. V., Mieske, S., Hilker, M., & Infante, L. 2011, MNRAS,
412, 1627Colucci, J. E., Duran, M. F., Bernstein, R.A., & McWilliam, A. 2013, ApJ,
773, L36Conroy, C., Loeb, A., & Spergel, D. N. 2011, ApJ, 741, 72Dabringhausen, J., Hilker, M., & Kroupa, P. 2008, MNRAS, 386, 864Dabringhausen, J., Kroupa, P., & Baumgardt, H. 2009, MNRAS, 394, 1529Davies B., Figer, D. F., Kudritzki, R. P., et al. 2007, ApJ, 671, 781De Lucia, G., Springel, V., White, S. D. M., Croton, D., & Kauffmann, G.
2006, MNRAS, 366, 499De Lucia, G., & Blaizot, J. 2007, MNRAS, 375, 2Djorgovski, S. 1995, ApJ, 438, L29Djorgovski, S. G., Gal, R. R., McCarthy, J. K., et al. 1997, ApJ, 474, L19Fabricius, M. H., Noyola, E., Rukdee, S., et al. 2014, ApJ, 787, L26Figer D. F., McLean, I. S., & Morris, M. 1999, ApJ, 514, 202Fusi Pecci, F., Battistini, P., Bendinelli, O., et al. 1994, A&A, 284, 349Garrison-Kimmel, S., Boylan-Kolchin, M., Bullock, J. S., & Kirby, E. N.
2014, MNRAS, 444, 222Georgiev, I. Y., Puzia, T. H., Goudfrooij, P., & Hilker, M. 2010, MNRAS,
406, 1967
Gieles, M., Portegies Zwart, S. F., Baumgardt, H., et al. 2006, MNRAS, 371,793
Gilmore, G., Wilkinson, M. I., Wyse, R. F. G., et al. 2007, ApJ, 663, 948Gnedin, O. Y., & Ostriker, J. P. 1997, ApJ, 474, 223Gualandris, A., & Merritt, D. 2008, ApJ, 678, 780Harayama Y., Eisenhauer, F., & Martins, F. 2008, ApJ, 675, 1319Harris, G. L. H., Hesser, J. E., Harris, H. C. & Curry, P. J. 1984, ApJ, 287,
175Harris, W. E. 1991, ARA&A, 29, 543Harris, G. L. H., Geisler, D., Harris, H. C., & Hesser, J.E. 1992, AJ, 104, 613Harris, G. L. H., Harris, W. E., & Poole, G. B. 1999, AJ, 117, 855Harris, G. L. H., & Harris, W. E. 2000, AJ, 120, 2423Harris, W. E., & Harris, G. L. H. 2002, AJ, 123, 3108Harris, W. E., Harris, G. L. H., Holland, S. T., & McLaughlin, D. E. 2002a,
AJ, 124, 1435Harris, G. L. H., Geisler, D., Harris, W. E., & Hesser, J. E. 2002b, in IAU
Symp. 207, Extragalactic Star Clusters, ed. D. P. Geisler, E. K. Grebel, &D. Minniti (San Francisco, CA: ASP), 309
Harris, G. L. H., Rejkuba, M., & Harris, W. E. 2010, PASA, 27, 457Harris, G. L. H., Gomez, M., Harris, W. E., et al. 2012, AJ, 143, 84Hasegan, M., Jordan, A., Cote, P., et al. 2005, ApJ, 627, 203Hesser, J. E., Harris, H. C., van den Bergh, S., & Harris, G. L. H. 1984, AJ,
276, 491Hesser, J. E., Harris, H. C., & Harris, G. L. H. 1986, ApJ, 303, L51Hilker, M., Baumgardt, H., Infante, L., et al. 2007, A&A, 463, 119Ho, L. C., Li, Z.-Y., Barth, A. J., Seigar, M. S., & Peng, C. Y. 2011, ApJS,
197, 21Holland, S., Fahlman, G. G., & Richer, H. B. 1997, AJ, 114, 1488Holland, S., Cote, P., & Hesser, J. E. 1999, A&A, 348, 418Husser, T.-O., von Berg, S. W., Dreizler, S., et al. 2013, A&A, 553, 6Ibata, R., Nipoti, C., Sollima, A., et al. 2013, MNRAS, 428, 3648Kacharov, N., Bianchini, P., Koch, A., et al. 2014, A&A, 567, 69King, I. R. 1966, AJ, 71, 64Kissler-Patig, M., Jordan, A., & Bastian, N. 2006, A&A, 448, 1031Komossa, S., & Merritt, D. 2008, ApJ, 689, L89Koss, M., Blecha, L., Mushotzky, R., et al. 2014, MNRAS, 445, 515Krauss, L. M., & Chaboyer, B. 2003, Science, 299, 65Kruijssen, J. M. D. & Lutzgendorf, N. 2013, MNRAS, 434, L41Lanzoni, B., Mucciarelli, A., Origlia, L., et al. 2013, ApJ, 769, 107Leigh, N. W. C., Lutzgendorf, N., Geller, A. M., et al. 2014, MNRAS, 444,
29Liu, J., et al. 2011, ApJS, 192, 10LLi, Z.-Y., Ho, L. C., Barth, A. J., & Peng, C. Y. 2011, ApJS, 197, 22

The Dark Side of NGC 5128’s Globular Clusters 21
Lotz, J. M., Telford, R., Ferguson, H. C., et al. 2001, ApJ, 552, 572Lutzgendorf, N., Kissler-Patig, M., Noyola, E., et al. 2011, A&A, 533,
AA36Madau, P. & Quataert, E. 2004, ApJ, 606, L17Malin, D. R., Quinn, P. J., & Graham, J. A 1983, ApJ, 272, L5Marchesini, D., Muzzin, A., Stefanon, M., et al. 2014, arXiv:1402.0003v1Marleau, F. R., Graham, J. R., Liu, M. C., & Charlot, S. 2000, AJ, 120, 1779Martini, P., & Ho, L. C. 2004, ApJ, 610, 233McConnachie, A. W., Irwin, M. J., Ibata, R. A., et al. 2009, Nature, 461, 66McLaughlin, D. E. 2000, ApJ, 539, 618McLaughlin, D. E., & van der Marel, R. P. 2005, ApJS, 161, 304McLaughlin, D. E., & Fall, S. M. 2008, ApJ, 679, 1272Merritt, D. 2004, Coevolution of Black Holes and Galaxies, Vol. 1
(Cambridge, UK: Cambridge Univ. Press)Merritt, D., Milosavljevic, M., Favata, M., Hughes, S. A., & Holz, D. E.
2004, ApJ, 607, L9Merritt, D., Schnittman, J. D., & Komossa, S. 2009, ApJ, 699, 1690Meylan, G., Sarajedini, A., Jablonka, P., et al. 2001, AJ, 122, 830Mieske, S., Hlker, M., Infante, L., & Jordan, A. 2006, AJ, 131, 2442Mieske, S., Hilker, M., Jordan, A., et al. 2008, A&A, 487, 921Mieske, S., & Kroupa, P. 2008, ApJ, 677, 276Mieske, S., Frank, M. J., Baumgardt, H., et al. 2013, A&A, 558, 14Mood, A. M. 1950, Introduction to the Theory of Statistics (McGraw-Hill),
394-399Moore, B. 1996, ApJ, 461, L13Norris, J. E., & Da Costa, G. S. 1995, A&A, 447, 680Pancino, E., Pasquini, L., Hill, V., Ferraro, F. R., & Bellazzini, M. 2002,
ApJ, 568, L101Peebles, P. J. E. 1984, ApJ, 277, 470Peng, E. W., Ford, H. C., Freeman, K. C., & White, R. L. 2002, AJ, 124,
3144Peng, E. W., Ford, H. C., & Freeman, K. C. 2004, ApJ, 602, 705Peng, E. W., Jordan, A., Cote, P., et al. 2008, ApJ, 681, 197Pfalzner S. 2009, A&A, 498, L37Piotto, G. 2008, Mem. Soc. Astron. Ital., 79, 334Piotto, G. 2008, in IAU Symp. 246, Dynamical Evolution of Dense Stellar
Systems Proceedings, ed. Vesperini, E., Giersz, M., & Sills, A.(Cambridge, UK: Cambridge Univ. Press), 258
Portegies Zwart, S. F., McMillan, S. L. W., & Gieles, M. 2010, ARA&A, 48,431
Puzia, T. H., Paolillo, M., Goudfrooij, P., et al. 2014, ApJ, 786, 78Rashkov, V., & Madau, P. 2014, ApJ, 780, 187
Rejkuba, M., Minniti, D., Silva, D., & Bedding, T. 2003, A&A, 411, 351Rejkuba, M., Dubath, P., Minniti, D., & Meylan, G. 2007, A&A, 469, 147Rejkuba, M., Harris, W. E., Greggio, L., & Harris, G. L. H. 2011, A&A,
526, A123Ricotti, M. 2003, MNRAS, 344, 1237Safonova, M., & Shastri, P. 2010, Ap&SS, 325, 47Saitoh, T. R., Koda, J., Okamoto, T., Wada, K., & Habe, A. 2006, ApJ, 640,
22Sawala, T., Frenk, C. S., Fattahi, A., et al. 2014, arXiv:1406.6362Schlafly, E. F., & Finkbeiner, D. P. 2011, ApJ, 737, 103Seth, A., van den Bosch, R., Mieske, S., et al. 2014, Nature, 513, 398Simon, J. D., & Geha, M. 2007, ApJ, 670, 313Sinnott, B., Hou, A., Anderson, R., Harris, W. E., & Woodley, K. 2010, AJ,
140, 2101Smith, R., Sanchez-Janssen, R., Fellhauer, M., et al. 2013, MNRAS, 429,
1066Smith, R., Fellhauer, M., Candlish, G. N., et al. 2013, MNRAS, 433, 2529Sollima, A., Bellazzini, M., & Lee, J.-W. 2012, ApJ, 755, 156Soria, R., Mould, J. R., Watson, A. M., et al. 1996, ApJ, 465, 79Spitzer, L., Jr. 1969, ApJ, 158, L139Strader, J., Caldwell, N., & Seth, A. 2011, AJ, 142, 8Strader, J., Chomiuk, L., Maccarone, T. J., et al. 2012, ApJ, 750, L27Sun, M.-Y., Jin, Y.-L., Gu, W.-M., et al. 2013, ApJ, 776, 118Taylor, M. A., Puzia, T. H., Harris, G. L. H., et al. 2010, ApJ, 712, 119Tollerud, E. J., Bullock, J. S., Graves, G. G., & Wolf, J. 2011, ApJ, 726, 108van den Bergh, S., Hesser, J. E., & Harris, G. L. H 1981, AJ, 86, 24Varri, A. L., & Bertin, G. 2012, A&A, 540, A94Webb, J. J., Harris, W. E., Sills, A., & Hurley, J. R. 2013, ApJ, 764, 124White, R. E., & Shawl, S. J. 1987, ApJ, 317, 246Willman, B., Blanton, M. R., West, A. A., et al. 2005, AJ, 129, 2692Wolf, J., Martinez, G. D., Bullock, J. S., et al. 2010, MNRAS, 406, 1220Woodley, K. A., Harris, W. E., & Harris, G. L. H. 2005, AJ, 129, 2654Woodley, K. A., Harris, W. E., Beasley, M. A., et al. 2007, AJ, 134, 494Woodley, K. A., Gomez, M., Harris, W. E., Geisler, D., & Harris, G. L. H.
2010, AJ, 139, 1871Woodley, K. A., Harris, W. E., Puzia, T. H., et al. 2010, ApJ, 708, 1335Worthey, G., 1994, ApJS, 95, 107Worthey, G., & Ottaviani, D. L. 1997, ApJS, 111, 377Zucker, D. B., Belokurov, V., Evans, N. W., et al. 2006, ApJ, 650, L41Zucker, D. B., Kniazev, A. Y., Martınez-Delgado, D., et al. 2007, ApJ, 659,
L21