Observation of aerosol size distribution and new particle formation at
17
Atmos. Chem. Phys., 12, 9923–9939, 2012 www.atmos-chem-phys.net/12/9923/2012/ doi:10.5194/acp-12-9923-2012 © Author(s) 2012. CC Attribution 3.0 License. Atmospheric Chemistry and Physics Observation of aerosol size distribution and new particle formation at a mountain site in subtropical Hong Kong H. Guo 1 , D. W. Wang 1 , K. Cheung 1 , Z. H. Ling 1 , C. K. Chan 2 , and X. H. Yao 3 1 Air Quality Studies, Department of Civil and Environmental Engineering, The Hong Kong Polytechnic University, Hong Kong, China 2 Division of Environment and Department of Chemical and Biomolecular Engineering, The Hong Kong University of Science and Technology, Hong Kong, China 3 Key Lab of Marine Environmental Science and Ecology, Ministry of Education, Ocean University of China, Qingdao, China Correspondence to: H. Guo ([email protected]) Received: 28 March 2012 – Published in Atmos. Chem. Phys. Discuss.: 10 May 2012 Revised: 10 October 2012 – Accepted: 10 October 2012 – Published: 30 October 2012 Abstract. In order to investigate the formation and growth processes of nucleation mode particles, and to quantify the particle number (PN) concentration and size distributions in Hong Kong, an intensive field measurement was con- ducted from 25 October to 29 November in 2010 near the mountain summit of Tai Mo Shan, a suburban site approx- imately the geographical centre of the New Territories in Hong Kong. Based on observations of the particle size dis- tribution, new particle formation (NPF) events were found on 12 out of 35 days with the estimated formation rate J 5.5 from 0.97 to 10.2 cm -3 s -1 , and the average growth rates from 1.5 to 8.4 nm h -1 . The events usually began at 10:00– 11:00 LT characterized by the occurrence of a nucleation mode with a peak diameter of 6–10 nm. Solar radiation, wind speed, sulfur dioxide (SO 2 ) and ozone (O 3 ) concentrations were on average higher, whereas temperature, relative hu- midity and daytime nitrogen dioxide (NO 2 ) concentration were lower on NPF days than on non-NPF days. Back tra- jectory analysis suggested that in majority of the NPF event days, the air masses originated from the northwest to north- east directions. The concentrations of gaseous sulfuric acid (SA) showed good power-law relationship with formation rates, with exponents ranging from 1 to 2. The result sug- gests that the cluster activation theory and kinetic nucle- ation could potentially explain the observed NPF events in this mountainous atmosphere of Hong Kong. Meanwhile, in these NPF events, the contribution of sulfuric acid va- por to particle growth rate (GR 5.5-25 ) ranged from 9.2 to 52.5 % with an average of 26 %. Measurement-based cal- culated oxidation rates of monoterpenes (i.e. α-pinene, β - pinene, myrcene and limonene) by O 3 positively correlated with the GR 5.5-25 (R = 0.80, p< 0.05). The observed asso- ciations of the estimated formation rate J 5.5 and the growth rate GR 5.5-25 with gaseous sulfuric acid and volatile organic compounds (VOCs) suggested the critical roles of sulfuric acid and biogenic VOCs (e.g. α-pinene and β -pinene) in these NPF events. 1 Introduction The formation and growth of atmospheric aerosols has re- cently received increasing attention as a potentially impor- tant source of aerosol particles affecting climate and hu- man health (e.g. Penner et al., 2004; Kovats and Haines, 2005; Davidson et al., 2005). The freshly formed aerosols become climatically important when they are able to grow to sizes of 50nm and larger. Particles in this size range can act as cloud condensation nuclei (CCN), significantly increasing the indirect radiative effect of clouds (e.g. Mc- Murry et al., 2011). Moreover, due to their nanometer-scale size, the newly formed particles can penetrate into the cili- ated and alveolar sections of the lung and even bloodstream (Oberd¨ orster et al., 2005), contributing to negative health ef- fects. Consequently, advancing our understanding on the for- mation and growth processes of these new particles in the atmosphere has become critically important. Published by Copernicus Publications on behalf of the European Geosciences Union.
Transcript of Observation of aerosol size distribution and new particle formation at

Atmos. Chem. Phys., 12, 9923–9939, 2012www.atmos-chem-phys.net/12/9923/2012/doi:10.5194/acp-12-9923-2012© Author(s) 2012. CC Attribution 3.0 License.
AtmosphericChemistry
and Physics
Observation of aerosol size distribution and new particleformation at a mountain site in subtropical Hong Kong
H. Guo1, D. W. Wang1, K. Cheung1, Z. H. Ling 1, C. K. Chan2, and X. H. Yao3
1Air Quality Studies, Department of Civil and Environmental Engineering, The Hong Kong Polytechnic University,Hong Kong, China2Division of Environment and Department of Chemical and Biomolecular Engineering, The Hong Kong University ofScience and Technology, Hong Kong, China3Key Lab of Marine Environmental Science and Ecology, Ministry of Education, Ocean University of China, Qingdao, China
Correspondence to:H. Guo ([email protected])
Received: 28 March 2012 – Published in Atmos. Chem. Phys. Discuss.: 10 May 2012Revised: 10 October 2012 – Accepted: 10 October 2012 – Published: 30 October 2012
Abstract. In order to investigate the formation and growthprocesses of nucleation mode particles, and to quantify theparticle number (PN) concentration and size distributionsin Hong Kong, an intensive field measurement was con-ducted from 25 October to 29 November in 2010 near themountain summit of Tai Mo Shan, a suburban site approx-imately the geographical centre of the New Territories inHong Kong. Based on observations of the particle size dis-tribution, new particle formation (NPF) events were foundon 12 out of 35 days with the estimated formation rateJ5.5from 0.97 to 10.2 cm−3 s−1, and the average growth ratesfrom 1.5 to 8.4 nm h−1. The events usually began at 10:00–11:00 LT characterized by the occurrence of a nucleationmode with a peak diameter of 6–10 nm. Solar radiation, windspeed, sulfur dioxide (SO2) and ozone (O3) concentrationswere on average higher, whereas temperature, relative hu-midity and daytime nitrogen dioxide (NO2) concentrationwere lower on NPF days than on non-NPF days. Back tra-jectory analysis suggested that in majority of the NPF eventdays, the air masses originated from the northwest to north-east directions. The concentrations of gaseous sulfuric acid(SA) showed good power-law relationship with formationrates, with exponents ranging from 1 to 2. The result sug-gests that the cluster activation theory and kinetic nucle-ation could potentially explain the observed NPF events inthis mountainous atmosphere of Hong Kong. Meanwhile,in these NPF events, the contribution of sulfuric acid va-por to particle growth rate (GR5.5−25) ranged from 9.2 to52.5 % with an average of 26 %. Measurement-based cal-
culated oxidation rates of monoterpenes (i.e.α-pinene,β-pinene, myrcene and limonene) by O3 positively correlatedwith the GR5.5−25 (R = 0.80,p < 0.05). The observed asso-ciations of the estimated formation rateJ5.5 and the growthrate GR5.5−25 with gaseous sulfuric acid and volatile organiccompounds (VOCs) suggested the critical roles of sulfuricacid and biogenic VOCs (e.g.α-pinene andβ-pinene) inthese NPF events.
1 Introduction
The formation and growth of atmospheric aerosols has re-cently received increasing attention as a potentially impor-tant source of aerosol particles affecting climate and hu-man health (e.g. Penner et al., 2004; Kovats and Haines,2005; Davidson et al., 2005). The freshly formed aerosolsbecome climatically important when they are able to growto sizes of 50 nm and larger. Particles in this size rangecan act as cloud condensation nuclei (CCN), significantlyincreasing the indirect radiative effect of clouds (e.g. Mc-Murry et al., 2011). Moreover, due to their nanometer-scalesize, the newly formed particles can penetrate into the cili-ated and alveolar sections of the lung and even bloodstream(Oberdorster et al., 2005), contributing to negative health ef-fects. Consequently, advancing our understanding on the for-mation and growth processes of these new particles in theatmosphere has become critically important.
Published by Copernicus Publications on behalf of the European Geosciences Union.

9924 H. Guo et al.: Observation of aerosol size distribution and new particle formation
To date, numerous measurements have been conducted indifferent locations to study the size distribution of submi-crometer particles and new particle formation (NPF) pro-cesses, including clean areas, i.e. free troposphere (e.g. We-ber et al., 2001), boreal forests (e.g. Vehkamaki et al., 2004;Dal Maso et al., 2007; Asmi et al., 2011), coastal rural ar-eas (e.g. Lee et al., 2008), high mountain-top (e.g. Gannet etal., 2011), Antarctic/Arctic areas (e.g. Park et al., 2004); andpolluted urban areas, i.e. Atlanta (Woo et al., 2001), Pitts-burgh (Stanier et al., 2004a, b), Birmingham, UK (Alam etal., 2003), Mexico City (Dunn et al., 2004), East St. Louis(Qian et al., 2007), and Brisbane (Guo et al., 2008; Cheung etal., 2011). Generally, NPF events are much more frequentlyobserved in rural/remote areas than in urban locations. InChina, the field measurements for particle size distributionwere carried out in several cities and regions in recent years.Short-term intensive studies on NPF were performed in Bei-jing (Yue et al., 2009), Pearl River Delta (PRD) (Liu et al.,2008), Yangtze River Delta (YRD) (Gao et al., 2009) andHong Kong (Yao et al., 2010). Moreover, a couple of long-term continuous measurements were conducted in Beijing(e.g. Wu et al., 2008; Shen et al., 2011) and a remote moun-tain site, Mt. Waliguan (Kivekas et al., 2009).
A variety of formation mechanisms have been suggestedfor atmospheric aerosols (Kulmala et al., 2000). Generally,the formation of nucleation mode particle requires two pro-cesses: the nucleation of stable atmospheric clusters (1–3 nm) and the growth of these clusters into observable sizes(> 3 nm). Altogether, the driving force for nucleation and thegrowth of freshly formed particles is the sufficiently highconcentration of condensational vapors, such as sulfuric acidand possibly other organic compounds with a low saturationvapor pressure formed by photochemical oxidation reaction.Sulfuric acid has been found to be a key compound in at-mospheric nucleation in many studies (Kulmala et al., 2006;Riipinen et al., 2007; Sipila et al., 2010). Also recent study(e.g. Kerminen et al., 2010) found that some organic acidsproduced from monoterpene oxidation can nucleate with sul-furic acid to form very stable clusters. However, for particlegrowth, observations suggest that the contribution of sulfu-ric acid to particle growth is typically from a few percentsto some tens of percents of the observed particle growthrate (Boy et al., 2005; Nieminen et al., 2010; Riipinen etal., 2011), while organics with a very low saturation vaporpressure (Tunved et al., 2006; Jimenez et al., 2009) can beconsidered as the most probable candidates of the vapors re-sponsible for the fraction of nucleation mode growth that isnot explained by sulfuric acid. For example, boreal forest ob-servations in Finland indicated a connection between nucle-ation mode growth and ambient concentrations of monoter-penes (Laaksonen et al., 2008). In Hong Kong, no study hasbeen undertaken to study the characteristics of NPF events.The potential mechanisms and compounds participating inatmospheric NPF and growth in this region have remainedunclear. Therefore, it is important to enrich the database of
particle number size distribution, and to investigate the NPFand growth processes in this urban area.
In this study, an intensive field measurement was con-ducted from 25 October to 29 November in 2010 near thesummit of Mt. Tai Mo Shan (TMS; 640 m a.s.l). The PN sizedistributions were characterized and the NPF events wereclassified based on their strength and growth of geometricmean diameter (GMD). Moreover, the favorable meteorolog-ical conditions and possible mechanisms for the nucleationand growth of new particles were discussed by analyzingconcurrently-observed meteorological parameters, gaseouspollutants, major hydrocarbons (e.g. isoprene,α-/β-pinenes,myrcene, limonene and aromatics), and carbonyl compoundsi.e. formaldehyde, acetaldehyde and acetone.
2 Methodology
2.1 The topography and climate of Hong Kong
Hong Kong (22◦15′ N, 114◦10′ E) is a coastal city located inthe PRD region with a total land area of 1104 km2 and a pop-ulation of 7 million, surrounded by the South China Sea onthe east, south, and west, and borders the Guangdong city ofShenzhen to the north over the Shenzhen River. The high-est elevation in the territory is at TMS (957 m a.s.l.). Due toHong Kong’s special geographical location and complex at-mospheric conditions, Hong Kong climate can be affected bysome severe weather phenomena, i.e. tropical cyclones andstrong winter monsoon. Generally the dry monsoon seasoncovers September, October and November when the northand northeast synoptic winds from inland PRD and easternChina coast dominate.
2.2 The sampling site
Mt. TMS is claimed to be Hong Kong’s most misty areadue to the high daily cloud coverage. The highest point onMt. TMS is occupied by a Hong Kong Observatory weatherradar station. Our monitoring site was located at the waist ofMt. TMS near the mountain summit (22.405◦ N, 114.118◦ E,about 640 m a.s.l.) (see Fig. 1).
Surrounding the foot of the mountain are urban centerswith a population of 2.23 million. The straight distances be-tween the mountain summit and the urban centers at the footare about 5–10 km. Farther to the south are the urban centersof the partial New Territory, Kowloon peninsula and HongKong Island. To the southwest is the newly-developed resi-dential area of Tung Chung, the international airport and theSouth China Sea. To the west are the Tuen Mun residentialareas and to the south is the South China Sea. To the northand northeast are the city clusters of the inland PRD region.The prevailing north/northeast synoptic winds in October–November bring polluted air on some days and clean air onsome other days from inland PRD and eastern China coastto the sampling site, depending on the weather conditions at
Atmos. Chem. Phys., 12, 9923–9939, 2012 www.atmos-chem-phys.net/12/9923/2012/
H. Guo et al.: Observation of aerosol size distribution and new particle formation 9925
5
November bring polluted air on some days and clean air on some other days from inland PRD and eastern China coast to the sampling 83
site, depending on the weather conditions at upwind locations. In addition, because of its unique topography, mountain-valley breezes 84
and sea-land breezes are frequently observed at TMS. These mesoscale circulations enhance the interaction of polluted urban air and 85
the mountain air. 86
87
Figure 1 Locations of Hong Kong and the TMS sampling site. 88
89
2.3 Measurement techniques 90
Particle size distributions in the range of 5.5 to 350 nm were continuously measured by a Scanning Mobility Particle Sizer (SMPS, 91
model 5.400, GRIMM, Germany) and a Condensation Particle Counter (CPC, model 5.400, GRIMM, Germany) system with 44 size 92
bins at 4-min scan intervals. The SMPS was equipped with a nano-differential mobility analyzer (DMA), which separated poly-93
Fig. 1.Locations of Hong Kong and the TMS sampling site.
upwind locations. In addition, because of its unique topog-raphy, mountain-valley breezes and sea-land breezes are fre-quently observed at TMS. These mesoscale circulations en-hance the interaction of polluted urban air and the mountainair.
2.3 Measurement techniques
Particle size distributions in the range of 5.5 to 350 nm werecontinuously measured by a Scanning Mobility Particle Sizer(SMPS, model 5.400, GRIMM, Germany) and a Conden-sation Particle Counter (CPC, model 5.400, GRIMM, Ger-many) system with 44 size bins at 4-min scan intervals. TheSMPS was equipped with a nano-differential mobility ana-lyzer (DMA), which separated poly-disperse particles intoselected mono-disperse particles according to the electricalmobility of the particles, a function of their size. Then theCPC counted the number concentration of mono-disperseparticles by laser light scattering. A sample air flow rateof 0.3 l min−1 was fixed for the set of SMPS + CPC with asheath air flow rate of 3.0 l min−1. In order to control the rel-ative humidity (RH) during sampling campaign, the aerosolsamples taken from ambient air have been dried with a 0.6 mlong diffusion silica gel drier (GRIMM) before entering thesampling system. Meanwhile, the sheath air in DMA wasdried with a sheath-air dryer (GRIMM). To minimize the par-ticle loss, ambient aerosols were drawn into the SMPS + CPCsystem through a 1 m long flexible and conductive tube withan inner diameter of 0.8 cm. Due to significant diffusion lossof particles with size below 10 nm and diffusion broadeningeffect in the transfer function, it is important to understandthe efficiency (or penetration rate) of the DMA for the accu-
rate measurement of airborne particles. An experimental sys-tem determining the aerosol losses in the DMA and the cali-bration of the SMPS was established and discussed in Wanget al. (2012). In addition, since the Grimm CPC is not widelyused, the discrepancy between Grimm CPC and TSI CPC re-ported by Schlatter (2006) was used to compare our resultswith other studies. The CPC counting efficiency and particlediffusion losses in the tubing were taken into account in thedata analysis.
To understand the relationships among newly formed par-ticles and trace gases, ambient ozone (O3), carbon monox-ide (CO), sulfur dioxide (SO2) and nitric oxide (NO) con-centrations were monitored. O3 was measured using a com-mercial UV photometric instrument (Advanced Pollution In-strumentation (API), Model 400E) with a detection limit of0.6 ppbv. Sulfur dioxide (SO2) was measured by pulsed UVfluorescence (API, model 100E) that has a detection limitof 0.4 ppbv. Trace level CO analyzer was measured with agas filter correlation, non-dispersive infrared analyzer (API,Model 300EU). Oxides of nitrogen (NO-NO2-NOx) were de-tected with an API-Teledyne Model 200E analyzer utilizingchemiluminesence with a detection limit of 0.4 ppbv. A datalogger (Environmental Systems Corporation, Model 8832)was used to control the zero/span calibration and to collect1-s data, which were averaged to 1-min values. Detailed de-scription was given in Guo et al. (2012). To investigate thepotential associations of individual VOCs and carbonyl com-pounds with NPF and particle growth, non-methane hydro-carbons (NMHCs) and carbonyl samples were collected onO3 episode days (O3 ≥ 90 ppbv), based on the prediction ofmeteorological conditions and the review of the PN con-centrations on previous days, which were usually related to
www.atmos-chem-phys.net/12/9923/2012/ Atmos. Chem. Phys., 12, 9923–9939, 2012
9926 H. Guo et al.: Observation of aerosol size distribution and new particle formation
strong solar radiation, cool and dry air, and low number con-centrations of pre-existing large size particles.
Ambient VOC samples were collected using cleaned andevacuated 2-l electro-polished stainless steel canisters. Aflow-controlling device was used to collect 1-h integratedsamples. Hourly samples were consecutively collected from09:00 to 16:00 with additional samples collected at 00:00,03:00, 07:00, 18:00 and 21:00 per day. Finally, 91 VOC sam-ples were collected at TMS on the eight days. The detailedanalytical systems and the quality control and assurance forVOC analyses are described in Guo et al. (2009).
Carbonyl samples were collected on the same samplingdays using the silica cartridges impregnated with acidi-fied 2,4-dinitrophenylhydrazine (DNPH). Air samples weredrawn through the cartridge at a flow rate of 0.8–0.9 l min−1
for 120 min (2 h); the flow rate through the cartridges wasmonitored with a rotameter which was calibrated before andafter each sampling. An O3 scrubber was connected to the in-let of the DNPH-silica cartridge to prevent interference fromO3. During these sampling days, carbonyls samples wereconsecutively collected from 07:00 to 21:00 every two hourswith additional samples collected at 00:00 and 03:00. Finally,70 carbonyl samples were collected during this sampling pe-riod. All cartridges were stored in a refrigerator at 4◦C af-ter sampling. The sampled carbonyl cartridges were elutedslowly with 2 ml of acetonitrile into a 2-ml volumetric flask.A 20-µl aliquot was injected into the high performance liquidchromatography (HPLC) system through an auto-sampler.The operating conditions of the HPLC and the quality controland detection limit for carbonyl compounds are also providedin Guo et al. (2009).
The meteorological conditions were continuously moni-tored using a mini-weather station (Vantage Pro TM & Van-tage Pro 2 – TM Weather Stations, Davis Instruments), whichconsists of two components: a sleekly designed integratedsensor suite (ISS) to measure outdoor weather conditions,and a data-receiving console to receive the weather datawirelessly. The weather station was placed on the rooftopof a building at the TMS site. Temperature, relative humid-ity, solar radiation, UV light, wind speed and direction wererecorded during the sampling period.
2.4 Data processing and analysis
Typically, the sizes of submicrometer particles are catego-rized into three modes: a nucleation mode, representing quitenewly formed particles; Aitken and accumulation modes,representing aged particles. In this study, we divided the sizedistribution into 5.5–10 (nucleation mode,Nnuc), 10–100(Aitken mode,NAit ), and 100–350 nm (accumulation mode,Nacc). The PN concentrations in nucleation mode, Aitkenmode, and accumulation mode were calculated with a 95 %confidence level (p < 0.05). The correlation coefficients andp-values between the different tested parameters were calcu-lated.
2.4.1 Definition of particle formation event
In this study, NPF events were classified into three groups(Classes Ia, Ib and II) according to the classification schemedeveloped by Dal Maso et al. (2005), following the criteriathat the particle mode must start in the distinct nucleationmode size and the particle mode must show signs of growthwith a time span of hours. Class I presents the days when theformation and growth rate are determined with a good confi-dence level. Class I is divided into Class Ia and Ib. The ClassIa event has clear and strong particle formation with little orno pre-existing particles, while a Class Ib event is any otherClass I event where the particle formation and growth ratestill can be determined. A Class II event represents the eventwhere the accuracy of formation rate calculation is question-able due to data fluctuation even though the banana shapesare still observable. Days with no particle formation observedare classified as non-NPF event days, due to the absence ofparticles in nucleation mode size range.
2.4.2 Calculation of formation rate (J5.5), growth rate(GR5.5−25) and condensational sink (CS)
In this study, 5.5 nm particle formation rate (FR,J5.5) wasrepresented and quantified by the following equation (Sihtoet al., 2006), taking into account the coagulation losses andgrowth losses:
J5.5 =dN5.5−10
dt+ CoagSdp=7nm · N5.5−10
+1
4.5nmGR5.5−10 · N5.5−10 (1)
where,J5.5 is the formation rate of new particles into themeasurable range of above 5.5 nm. The coagulation loss forthe interval 5.5–10 nm was approximated by a term repre-senting loss of 7 nm sized particles (7 nm is approximatelythe geometric mean of 5.5 and 10 nm) with the concentrationof N5.5−10. The third term represents the loss due to conden-sation out of the 5.5–10 nm size range. Here the observedgrowth rate (GR) in the size range of 5.5–10 nm was quanti-fied using the “mode fitting” method (Dal Maso et al., 2005).As only one line fitting is done for each particle formationevent, this method assumes the growth rate to be constantthroughout the event.
The evolution of modal geometric mean diameters (GMD)(Dal Maso et al., 2005) in a size range of 5.5–25 nm for eachsize distribution with a 4-min resolution was used to examineparticle growth processes:
GR5.5−25 =1GMD
1t(2)
The condensation sink (CS) of newly formed particles, pre-sented as the loss rate of molecules onto existing parti-cles, was estimated by integrating over the aerosol size
Atmos. Chem. Phys., 12, 9923–9939, 2012 www.atmos-chem-phys.net/12/9923/2012/
H. Guo et al.: Observation of aerosol size distribution and new particle formation 9927
distribution as follows (Kulmala et al., 2005):
CS= 2πD
∫DpβM(Dp)n(Dp)dDp
= 2πD∑
i
βMiDpiNi (3)
where D is the diffusion coefficient of the condensingvapour,βM is the transitional regime correction factor,Dpi isthe particle diameter in size classi, andNi is the PN concen-tration in the respective size class. For the particle diameterDpi used in the Eq. (3), the measured dry size spectra wereconverted to wet size spectra by particle growth factor (GF)according to ambient relative humidity (Laakso et al, 2004).
2.4.3 Contribution of sulfuric acid (SA)
To investigate the contribution of sulfuric acid (SA) vapor onthe particle formation and growth, a predictive proxy basedon global solar radiation, SO2 concentration, condensationsink and relative humidity was used to estimate sulfuric acidconcentrations (Mikkonen et al., 2011):
QSA = 8.21× 10⁻³· k · Radiation· [SO2]
0.62
·(CS· RH)−0.13 (4)
where,QSA (cm−3 s−1) is the source rate of SA, andk is aconstant value 1.035.
2.4.4 Contribution of Biogenic VOCs
Recent studies found that the growth rates of newly formedparticles had positive correlations with monoterpene concen-trations and their oxidation rates by O3 not by OH radical(Yli-Juuti et al., 2011; Hao et al., 2011). The production ratesof oxidation products of monoterpenes by O3 in these NPFevents were calculated from measured monoterpene (i.e.α-/β-pinenes, myrcene, and limonene) and O3 concentrations(Yli-Juuti et al., 2011):
[OR]O3 = kO3 · [O3] · [Monoterpene] (5)
where the rate constant kO3 = 1.4× 10⁻¹⁷ cm3
molecules−1 s−1.
3 Results and discussion
3.1 Classification of the new particle formation eventsand ozone pollution events
Supplement Fig. S1a shows the temporal variations of PNsize distribution (5.5–350 nm), trace gases (SO2, NO, COand O3) and meteorological conditions (solar radiation,T ,RH and wind) during these NPF events in October andNovember 2010. According to the classification scheme de-veloped by Dal Maso et al. (2005), the typical Class Ia eventsoccurred on 27, 28, 29 October and 1 November 2010 at
TMS. The examples of Class Ib included 30 October, 2, 8 and9 November 2010. On 31 October, 11, 12 and 26 November,Class II events were observed. Figure S1b shows the averagediurnal variations of particle number size distribution in NPFevents and non-NPF events.
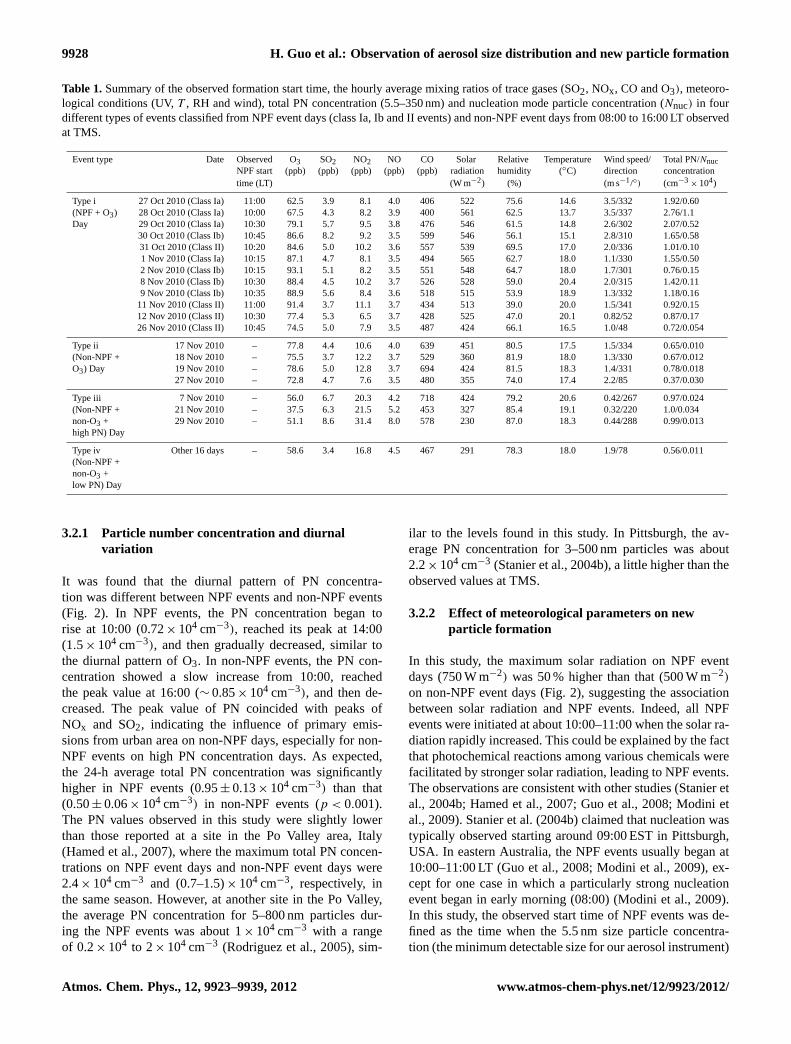
Previous studies indicated that air pollution caused by ul-trafine particulate matter and O3 in the atmosphere of HongKong is severe (e.g. Wang et al., 2005; Guo et al., 2009). Itis well-known that both biogenic and anthropogenic VOCstogether with nitrogen oxides (NOx) are important precur-sors of surface-level O3, and the oxidation products of pho-tochemical reaction may play a key role in determining thespatial and temporal features of the nucleation events. Hence,NPF events likely occur along with photochemical O3 pro-duction. In this study, all the NPF events indeed occurredon the O3 episode days, while a few non-NPF events werealso observed on O3 episode days. Based on the levels ofparticle number and/or O3 collected from 25 October to29 November, four different types of events were classifiedfrom the NPF and non-NPF events throughout the 35 sam-pling days. Table 1 summarizes the four different types ofevents including (i) (12 days): all NPF events (class Ia, Iband II events) on O3 episode days (maximum hourly O3mixing ratio ≥ 90 ppbv); (ii) (4 days): non-NPF events onO3 episode days; (iii) (3 days): non-NPF events on non-O3episode days with high particle number concentrations (PNconcentration≥ 104 cm−3 with a maximum hourly O3 mix-ing ratio≤ 90 ppbv), and (iv) (16 days): non-NPF events onnon-O3 episode days with low PN concentrations (PN con-centration≤ 104 cm−3). The hourly average O3 mixing ratio,nucleation mode particle and total PN concentrations in thesize range of 5.5–350 nm from 08:00 to 16:00 LT were higheron most NPF event days (Type i) than on non-NPF eventdays with O3 episodes (Type ii). Different from Types i and iievents, the elevated PN concentration in Type iii events wasprobably attributed to primary emissions from local sources,i.e. vehicle emissions. The detailed discussion is shown inSect. 3.2.
3.2 Comparison of NPF days and non-NPF days
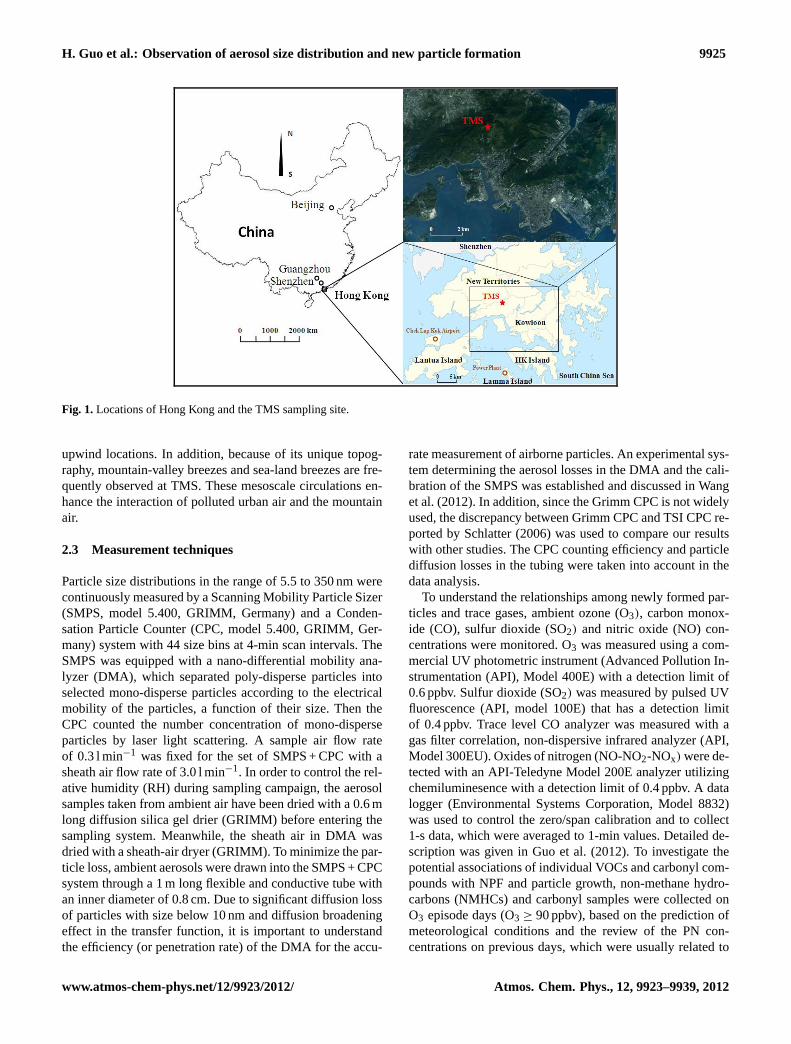
To find out the favorable conditions for the NPF events, com-parison of different parameters (i.e. meteorological condi-tions and gas phase concentrations) between NPF days andnon-NPF days was made. Here the non-NPF days includednon-NPF events on O3 episode days (Type ii), and on non-O3 episode days with both high and low PN concentrations(Types iii and iv). Figure 2 shows the average diurnal varia-tions of total PN concentration, SO2, NOx, CO, O3 and me-teorological conditions (solar radiation, RH,T and wind roseplots) during NPF event days and non-NPF event days overthe whole sampling period at TMS, respectively.
www.atmos-chem-phys.net/12/9923/2012/ Atmos. Chem. Phys., 12, 9923–9939, 2012
9928 H. Guo et al.: Observation of aerosol size distribution and new particle formation
Table 1.Summary of the observed formation start time, the hourly average mixing ratios of trace gases (SO2, NOx, CO and O3), meteoro-logical conditions (UV,T , RH and wind), total PN concentration (5.5–350 nm) and nucleation mode particle concentration (Nnuc) in fourdifferent types of events classified from NPF event days (class Ia, Ib and II events) and non-NPF event days from 08:00 to 16:00 LT observedat TMS.
Event type Date Observed O3 SO2 NO2 NO CO Solar Relative Temperature Wind speed/ Total PN/NnucNPF start (ppb) (ppb) (ppb) (ppb) (ppb) radiation humidity (◦C) direction concentrationtime (LT) (W m−2) (%) (m s−1/◦) (cm−3
× 104)
Type i 27 Oct 2010 (Class Ia) 11:00 62.5 3.9 8.1 4.0 406 522 75.6 14.6 3.5/332 1.92/0.60(NPF + O3) 28 Oct 2010 (Class Ia) 10:00 67.5 4.3 8.2 3.9 400 561 62.5 13.7 3.5/337 2.76/1.1Day 29 Oct 2010 (Class Ia) 10:30 79.1 5.7 9.5 3.8 476 546 61.5 14.8 2.6/302 2.07/0.52
30 Oct 2010 (Class Ib) 10:45 86.6 8.2 9.2 3.5 599 546 56.1 15.1 2.8/310 1.65/0.5831 Oct 2010 (Class II) 10:20 84.6 5.0 10.2 3.6 557 539 69.5 17.0 2.0/336 1.01/0.101 Nov 2010 (Class Ia) 10:15 87.1 4.7 8.1 3.5 494 565 62.7 18.0 1.1/330 1.55/0.502 Nov 2010 (Class Ib) 10:15 93.1 5.1 8.2 3.5 551 548 64.7 18.0 1.7/301 0.76/0.158 Nov 2010 (Class Ib) 10:30 88.4 4.5 10.2 3.7 526 528 59.0 20.4 2.0/315 1.42/0.119 Nov 2010 (Class Ib) 10:35 88.9 5.6 8.4 3.6 518 515 53.9 18.9 1.3/332 1.18/0.16
11 Nov 2010 (Class II) 11:00 91.4 3.7 11.1 3.7 434 513 39.0 20.0 1.5/341 0.92/0.1512 Nov 2010 (Class II) 10:30 77.4 5.3 6.5 3.7 428 525 47.0 20.1 0.82/52 0.87/0.1726 Nov 2010 (Class II) 10:45 74.5 5.0 7.9 3.5 487 424 66.1 16.5 1.0/48 0.72/0.054
Type ii 17 Nov 2010 – 77.8 4.4 10.6 4.0 639 451 80.5 17.5 1.5/334 0.65/0.010(Non-NPF + 18 Nov 2010 – 75.5 3.7 12.2 3.7 529 360 81.9 18.0 1.3/330 0.67/0.012O3) Day 19 Nov 2010 – 78.6 5.0 12.8 3.7 694 424 81.5 18.3 1.4/331 0.78/0.018
27 Nov 2010 – 72.8 4.7 7.6 3.5 480 355 74.0 17.4 2.2/85 0.37/0.030
Type iii 7 Nov 2010 – 56.0 6.7 20.3 4.2 718 424 79.2 20.6 0.42/267 0.97/0.024(Non-NPF + 21 Nov 2010 – 37.5 6.3 21.5 5.2 453 327 85.4 19.1 0.32/220 1.0/0.034non-O3 + 29 Nov 2010 – 51.1 8.6 31.4 8.0 578 230 87.0 18.3 0.44/288 0.99/0.013high PN) Day
Type iv Other 16 days – 58.6 3.4 16.8 4.5 467 291 78.3 18.0 1.9/78 0.56/0.011(Non-NPF +non-O3 +low PN) Day
3.2.1 Particle number concentration and diurnalvariation
It was found that the diurnal pattern of PN concentra-tion was different between NPF events and non-NPF events(Fig. 2). In NPF events, the PN concentration began torise at 10:00 (0.72× 104 cm−3), reached its peak at 14:00(1.5× 104 cm−3), and then gradually decreased, similar tothe diurnal pattern of O3. In non-NPF events, the PN con-centration showed a slow increase from 10:00, reachedthe peak value at 16:00 (∼ 0.85× 104 cm−3), and then de-creased. The peak value of PN coincided with peaks ofNOx and SO2, indicating the influence of primary emis-sions from urban area on non-NPF days, especially for non-NPF events on high PN concentration days. As expected,the 24-h average total PN concentration was significantlyhigher in NPF events (0.95± 0.13× 104 cm−3) than that(0.50± 0.06× 104 cm−3) in non-NPF events (p < 0.001).The PN values observed in this study were slightly lowerthan those reported at a site in the Po Valley area, Italy(Hamed et al., 2007), where the maximum total PN concen-trations on NPF event days and non-NPF event days were2.4× 104 cm−3 and (0.7–1.5)× 104 cm−3, respectively, inthe same season. However, at another site in the Po Valley,the average PN concentration for 5–800 nm particles dur-ing the NPF events was about 1× 104 cm−3 with a rangeof 0.2× 10⁴ to 2× 104 cm−3 (Rodriguez et al., 2005), sim-
ilar to the levels found in this study. In Pittsburgh, the av-erage PN concentration for 3–500 nm particles was about2.2× 104 cm−3 (Stanier et al., 2004b), a little higher than theobserved values at TMS.
3.2.2 Effect of meteorological parameters on newparticle formation
In this study, the maximum solar radiation on NPF eventdays (750 W m−2) was 50 % higher than that (500 W m−2)
on non-NPF event days (Fig. 2), suggesting the associationbetween solar radiation and NPF events. Indeed, all NPFevents were initiated at about 10:00–11:00 when the solar ra-diation rapidly increased. This could be explained by the factthat photochemical reactions among various chemicals werefacilitated by stronger solar radiation, leading to NPF events.The observations are consistent with other studies (Stanier etal., 2004b; Hamed et al., 2007; Guo et al., 2008; Modini etal., 2009). Stanier et al. (2004b) claimed that nucleation wastypically observed starting around 09:00 EST in Pittsburgh,USA. In eastern Australia, the NPF events usually began at10:00–11:00 LT (Guo et al., 2008; Modini et al., 2009), ex-cept for one case in which a particularly strong nucleationevent began in early morning (08:00) (Modini et al., 2009).In this study, the observed start time of NPF events was de-fined as the time when the 5.5 nm size particle concentra-tion (the minimum detectable size for our aerosol instrument)
Atmos. Chem. Phys., 12, 9923–9939, 2012 www.atmos-chem-phys.net/12/9923/2012/

H. Guo et al.: Observation of aerosol size distribution and new particle formation 9929
15
220
Figure 2 Average diurnal variations of total PN concentration, trace gases (SO2, NOx, CO and O3) and meteorological conditions 221
(solar radiation, RH, T and wind) during NPF event days and non-NPF event days over the whole sampling period at the TMS site. 222
Fig. 2. Average diurnal variations of total PN concentration, trace gases (SO2, NOx, CO and O3) and meteorological conditions (solarradiation, RH,T and wind) during NPF event days and non-NPF event days over the whole sampling period at the TMS site.
remarkably increased. Since it takes time for newly formedparticles (about 1 nm in diameter) to grow into 5.5 nm, thereal start time of these NPF events could be earlier than theobserved start time, and the time lag varies under different at-mospheric conditions. The fitted time lag was defined in thisstudy using the time series of the formation rate of 5.5 nmparticles and the sulfuric acid concentration in each NPFevent (Riipinen et al., 2011) (see Table 2). Based on the ob-served start time and the fitted time lag for each NPF event,the estimated start time of these NPF events were rangedfrom 09:50 to 10:40 LT during this sampling session.
Interestingly, the average temperature was slightly lowerin the NPF events than that in the non-NPF events (Fig. 2),similar to those observed at different locations in Finland(Boy and Kulmala, 2002; Komppula et al., 2003; Vehkamakiet al., 2004) and in summer in Italy (Hamed et al., 2007).Contrarily, higher temperatures have been associated with
the nucleation events in east and south Germany (Birmili andWiednsohler, 2000; Birmili et al., 2003), and in spring, au-tumn and winter in Italy (Hamed et al., 2007). By investigat-ing the fraction of GR explained by maximum sulfuric acidcondensation in this study (detailed in Sect. 3.3.2), higherfractions (21–57 %) of sulfuric acid contribution to GR wasfound in the NPF events at lower temperature (13.7–18◦C),while lower fractions (9.2–22 %) was determined in the NPFevents with higher temperature (18.9–20.4◦C), in line withthe findings of Kurten et al. (2007) who found that in theatmosphere, the majority of sulfuric acid molecules preferto bind with water molecules under low temperature condi-tions. The result suggests that the lower temperature at thestart time of the NPF events may enhance the nucleation ofsulfuric acid with water vapor.
The RH on average was lower on NPF event days than onnon-NPF event days (Fig. 2). Low RH, frequently down to
www.atmos-chem-phys.net/12/9923/2012/ Atmos. Chem. Phys., 12, 9923–9939, 2012

9930 H. Guo et al.: Observation of aerosol size distribution and new particle formation
Table 2.Particle formation rate (J5.5), growth rate (GR), minimum and maximum condensation sink (CS), sulfuric acid (SA) vapor concen-tration (Csa), the SA vapor needed for 1 nm h−1 particle size growth (Co), fractional contribution of SA vapor to particle growth (FC), fittedtime delay (1t) and the exponent (nJ5.5) for the correlation ofJ5.5 with sulfuric acid for each NPF event day covering 06:00–18:00 LT withp-value of the t-test.
Date J5.5 GR CS Csa Co FC 1t nJ5.5 R
(cm−3 s−1) (nm h−1) (s−1) (× 106 cm−3) (× 106 cm−3) (%) (h) p-value
Class Ia
27 Oct 2010 5.9 5.4 0.021–0.062 12.3 10.7 21.3 0.4 1.0 0.60,p < 0.0528 Oct 2010 6.9 3.0 0.021–0.053 12.5 11.0 37.9 0.8 1.1 0.70,p < 0.00129 Oct 2010 3.6 4.0 0.025–0.062 11.7 11.0 26.6 0.2 1.0 0.61,p < 0.051 Nov 2010 6.0 5.0 0.023–0.033 7.77 10.9 14.3 0.4 1.3 0.77,p < 0.01
Class Ib
30 Oct 2010 2.6 1.5 0.031–0.055 9.40 11.1 56.5 0.4 1.1 0.69,p < 0.052 Nov 2010 1.8 2.7 0.021–0.024 9.72 10.9 33.0 0.6 1.4 0.77,p < 0.058 Nov 2010 1.7 4.5 0.018–0.046 9.14 11.0 18.5 0.2 1.0 0.72,p < 0.059 Nov 2010 2.2 3.0 0.014–0.026 7.52 11.4 22.0 0.2 1.2 0.73,p < 0.01
Class II
31 Oct 2010 1.1 1.8 0.024–0.030 8.92 11.0 45.1 0.6 1.1 0.74,p < 0.0511 Nov 2010 1.5 8.4 0.008–0.041 8.76 11.3 9.2 0.4 1.1 0.69,p < 0.0512 Nov 2010 1.0 4.6 0.016–0.031 6.20 12.0 11.2 0.2 1.2 0.78,p < 0.0126 Nov 2010 1.0 2.4 0.010–0.024 6.09 10.8 23.5 0.4 1.3 0.49,p < 0.05
near 50 % (at noon hours), was observed during nucleationevents, similar to the RH levels in the Po Valley area, Italy(Hamed et al., 2007), and in clean areas in Hyytiala station,Finland (Boy and Kulmala, 2002). This is a strong indicationthat the NPF is favored under low RH. This could be partlyexplained by the fact that lower RH days usually have lessclouds causing more solar radiation and subsequently pro-ducing more OH radicals to form more condensable vapors(Hamed et al., 2007). Another possible reason could be thatat high RH, condensation sink increased due to hygroscopicgrowth of the pre-existing particles, which inhibited the nu-cleation (Hamed et al., 2011).
During the NPF event days, the wind was mainly fromthe north direction, while east winds were more frequentlyobserved on the non-NPF event days (Fig. 2). To investi-gate the transport pathways of the air masses arriving atthe TMS site during the sampling period, we analyzed backtrajectories for NPF days and non-NPF days. The analysiswas done by using HYSPLIT 4 (Hybrid Single-Particle La-grangian Integrated Trajectory) model developed by NOAAAir Resource Laboratory (ARL) (Draxler and Hess, 1998).Back trajectories arriving at 10:00 with 1000 m arrival heightwere calculated one day backward in time. Figure S2 showsthe position of the air parcel at 24-h back in time for NPFand non-NPF days, respectively. The air masses were clas-sified into three major categories on the NPF days: (i) airmasses originated from inland China (track 1, accountingfor 56 % of the total trajectories); (ii) air masses origi-nated from Yangtze River Delta with a faster movement than
track 1 (track 2, 32 %); and (iii) air masses originated fromthe South China Sea with a very slow movement (track 3,12 %). The track 1 mainly occurred at daytime hours onNPF event days, and the average mixing ratios of SO2, O3,CO andNnuc concentrations at TMS were 4.9 ppbv, 87 ppbv,480 ppbv and 0.52× 104 cm−3, respectively. The air in track1 had the highest O3 mixing ratio andNnuc concentration,followed by the air in track 3 (74 ppbv for O3, p < 0.001and 0.36× 104 cm−3 for Nnuc, p < 0.05) and air in track 2(66 ppbv for O3, p < 0.001 and 0.17× 104 cm−3 for Nnuc,p < 0.001), indicating that air masses originated from track1 were favorable to the NPF events. On the other hand, therewere two types of air masses classified on non-NPF days:(i) track 1 originated from eastern China coast with a slowmovement, accounting for 92 % of the total air masses; and(ii) track 2 originated from western Pacific Ocean and ar-rived at TMS with a much faster movement, accounting for8 % of the total air masses. The average mixing ratios of SO2,O3 andNnuc concentration in track 1 were 4.0 ppbv, 87 ppbv,and 0.05× 104 cm−3, respectively, while they were 3.6 ppbv,56 ppbv, and 0.02× 104 cm−3, respectively in track 2. Thehigher O3 (87 ppbv) and CO (640 ppbv) values in track 1 airwere mainly due to regional transport from eastern China. Incontrast, low SO2 (3.6 ppbv), CO (421 ppbv), O3 (56 ppbv)and high RH (83 %) levels in track 2 were caused by thestrong winds originated from western Pacific Ocean, whichbrought clean marine air and scattered rain to the samplingsite. The back trajectory results are consistent with the roseplot analysis which found that air masses associated with
Atmos. Chem. Phys., 12, 9923–9939, 2012 www.atmos-chem-phys.net/12/9923/2012/
H. Guo et al.: Observation of aerosol size distribution and new particle formation 9931
NPF events were mainly from northwestern to northeasterndirections.
3.2.3 Effect of gas concentrations on new particleformation
The hourly average O3 mixing ratios were higher on NPFevent days than the corresponding values on non-NPF eventdays during daytime hours (i.e. 10:00–18:00 LT) (Fig. 2).Also, the diurnal pattern of O3 mixing ratio was consistentwith that of PN concentration on the NPF event days, sug-gesting that O3 and NPF had similar sources or formationmechanisms, most likely the photochemical reactions amongthe precursors (i.e. VOCs, NOx and SO2) of O3 and NPF. Assuch, O3 could also be an important indicator for nucleationevent occurrences. In addition, O3 could be the precursor ofNPF as it is responsible for the formation of condensablespecies via direct reactions with VOCs, and indirect gener-ation of other oxidants (i.e. OH and HO2) upon photolysis.
All the hourly average SO2 mixing ratios were higher onthe NPF event days than on the non-NPF event days, exceptfor the values at 08:00 LT and 16:00 LT, which were likely re-lated to primary emissions. The average mixing ratio on NPFevent days and non-NPF event days was 5.2± 0.2 ppbv and4.2± 2.5 ppbv, respectively. The large variations of the SO2mixing ratio on non-NPF event days were caused by somehigh SO2 levels observed on non-NPF days with high PNconcentrations (Type iii) (Table 1), due to regional transportand/or local emissions. When the non-NPF days with highPN concentrations (Type iii) were excluded from the totalnon-NPF event days, the average SO2 mixing ratio on non-NPF days became 4.2±0.4 ppbv, lower than that on the NPFevent days. For NPF events, SO2 is needed for the produc-tion of sulfuric acid, which participates in the nucleation andgrowth of stable nm-sized clusters. The higher SO2 foundin the NPF events implied that SO2 might be favorable tothe nucleation. However, by comparing the SO2 levels in theNPF events (Type i) with those in the non-NPF events withhigh PN concentrations (Type iii), we found that the averageSO2 mixing ratio in non-NPF events with high PN concen-tration (Type iii) was higher than that in NPF events (Type i)(Table 1,p < 0.05), indicating that only a high SO2 level wasnot sufficient for NPF. Other factors such as less pre-existinglarge particles and strong solar radiations (see Table 1) werealso required.
It was found that the average daytime NOx value (11±1.3 ppbv, daytime NO2: 7.1± 0.8 ppbv) was lower on NPFevent days than that (14± 1.6 ppbv, daytime NO2: 9.2±
1.5 ppbv,p < 0.001) on non-NPF event days during the pro-cess of formation and growth (Fig. 2). The stronger solar ra-diation on NPF event days than on non-NPF event days wasprobably one of the reasons for the lower NO2 levels on theNPF event days. The increase in solar radiation would pro-mote the decay of NO2 mixing ratios via the complex photo-chemical reactions, consistent with the negative correlation
(R = −0.86, p < 0.001) between the daytime NO2 valuesand solar radiation on the NPF event days. On non-NPF eventdays, the daytime NO2 mixing ratios were higher than thecorresponding hourly values on the NPF event days, and hada peak at 18:00 LT, suggesting the possible influence of pri-mary emissions transported to the site from the region and/orlocal urban areas via mesoscale recirculation.
3.3 Characteristics of new particle formation andgrowth
Table 2 shows the formation rate, growth rate and condensa-tion sink of each NPF and growth event observed at TMS.The correlations of particle formation rate, growth rate andcondensation sink with meteorological parameters, inorganictrace gas concentrations (O3, SO2, NOx and CO), biogenicVOCs (BVOCs), anthropogenic VOCs (AVOCs), and car-bonyl compounds are presented in Table 3. The correlationsof sulfuric acid and the VOC oxidation products with the for-mation rate and growth rate for each NPF event were partic-ularly investigated in this section.
In this study, the formation rate (FR) at 5.5 nm was esti-mated from the increase of 5.5–10 nm PN concentration be-tween the event start time and the time when the PN concen-tration exhibited a maximum during the NPF event. Basedon the calculations, the FR values varied between 0.044and 10.2 cm−3 s−1. The estimated average FR for Class Iaevent was about 5.6 cm−3 s−1, higher than that of Class Ib(4.2 cm−3 s−1) and Class II (1.1 cm−3 s−1), indicating highFRs of nucleation mode particles in rural areas like the TMSsite. The average growth rate (GR) for the nucleation eventswas calculated by the slope of GMD against time during theperiod of particle growth from 5.5 to 25 nm. By computation,the GRs of Class Ia events observed at TMS were from 3.0 to5.4 nm h−1 (average 4.4 nm h−1), while the GRs of Class Ibevents ranged from 1.5 to 4.5 nm h−1 (average 2.9 nm h−1),and from 1.8 to 8.4 nm h−1 (average 4.3 nm h−1) for ClassII events, all in line with the range of new particle growthrates observed in rural/suburban locations i.e. 1–10 nm h−1
(Kulmala et al., 2004a).
3.3.1 Case study-typical new particle formation andgrowth event at TMS
In order to give a visible picture of NPF and growth pro-cesses from the beginning to the end, one Class Ia NPF eventintensively occurred on 28 October 2010 was selected for thecase study. New particle formation event (nucleation mode)on 28 October was clearly observed after raining on 27 Oc-tober, in line with the fact that nucleation events often occurafter a sharp decrease in concentrations of pre-existing par-ticles with large surface area (Guo et al., 2008; Liu et al.,2008). The minimum temperature of 12.5 degrees recordedon 28 October was the lowest in October since 1988. TheNFP started when the wind speed increased to a maximum
www.atmos-chem-phys.net/12/9923/2012/ Atmos. Chem. Phys., 12, 9923–9939, 2012

9932 H. Guo et al.: Observation of aerosol size distribution and new particle formation
Table 3.Linear correlations of gaseous pollutants, metrological parameters, CS, BVOCs, AVOCs and carbonyls with the FR, GR and CS forall NPF events observed during the sampling campaign. The data points for gaseous pollutants, metrological parameters and CS are 72; forVOCs and carbonyls are 32. The p-values for all the correlations are below 0.05.
Parameter
Gaseous pollutants Metrological parameters CS BVOCs AVOC Carbonyls
R R R R R R R R R R R R R R R
(O3) (SO2) (NOx) (CO) (Radia- (RH) (T ) (CS) (Isoprene) (Mono- ([MT* (Aro- (Form- (Acet- (Ace-tion) terpenes) O3]) matics) aldehyde) aldehyde) tone)
FR −0.54 0.62 −0.22 −0.45 0.54 −0.40 −0.62 −0.56 −0.40 0.57 0.35 −0.42 −0.26 −0.56 −0.10GR 0.51 −0.33 −0.26 −0.61 0.64 −0.48 0.41 0.51 −0.38 0.82 0.80 −0.50 −0.40 −0.45 −0.25CS −0.48 0.62 0.70 0.44 0.62 0.45 −0.56 – 0.72 0.35 0.20 0.22 −0.10 0.16 0.35
* Monoterpenes include:α-Pinene,β-Pinene, Myrcene and Limonene. Aromatics include: Benzene, Toluene,m-xylene,p-xylene,o-xylene, 2-ethyltoluene, 3-ethyltoluene,4-thyltoluene, 1,3,5-trimethylbenzene, 1,2,4-trimethylbenzene and 1,2,3-trimethylbenzene.
23
370
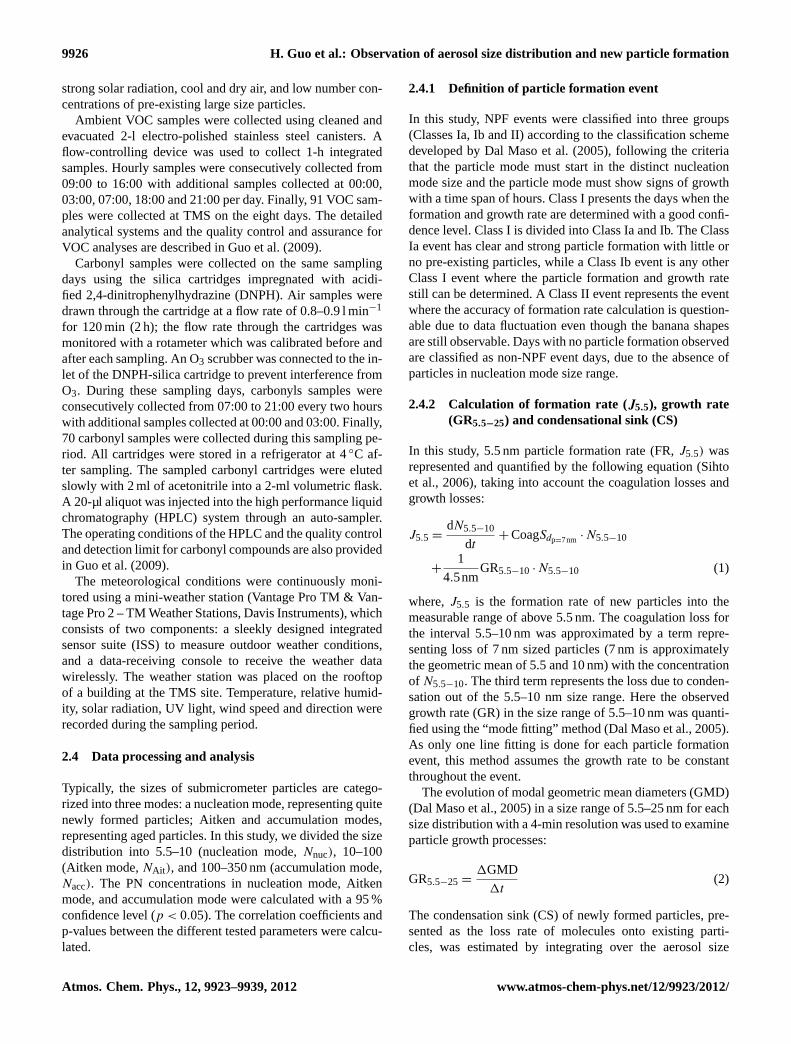
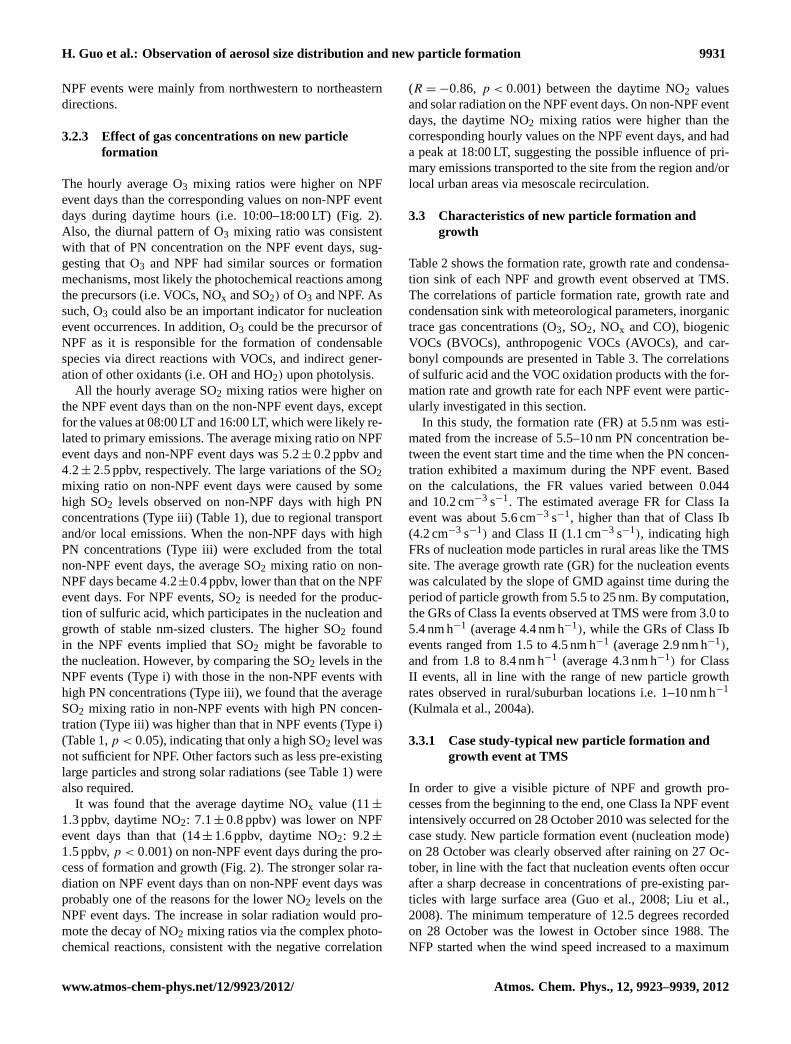
Figure 3 Contour plots of the average diurnal variations of particle size distribution, the meteorological conditions and the 371
concentrations of airborne pollutants on 28 October 2010 at TMS. From top to bottom, the parameters are: (i) Particle size distribution; 372 (ii) Wind direction and speed (iii) Solar radiation; (iv) Temperature and relative humidity; (v) Number concentrations of Aitken mode 373
and accumulation mode particles; (vi) Number concentration of nucleation mode particles and condensation sink, (vii) NO and SO2; 374 (viii) O3 and CO. 375
Fig. 3. Contour plots of the average diurnal variations of particle size distribution, the meteorological conditions and the concentrations ofairborne pollutants on 28 October 2010 at TMS. From top to bottom, the parameters are: (i) Particle size distribution; (ii) Wind directionand speed (iii) Solar radiation; (iv) Temperature and relative humidity; (v) Number concentrations of Aitken mode and accumulation modeparticles; (vi) Number concentration of nucleation mode particles and condensation sink, (vii) NO and SO2; (viii) O3 and CO.
value (i.e. 5.26 m s−1) (09:00 LT). At the same time, slow in-crease in SO2, decrease in CO (see Fig. 3), and rise of the cal-culated boundary layer height were observed (Fig. S3), indi-cating that these variations accompanied with the NPF werelikely a result of breakup of the morning inversion that mixedSO2-enriched and CO-depleted air from aloft and dilutedthe accumulated urban emissions (Q. Zhang et al., 2004).As shown in Fig. 3, the nucleation mode appeared in themeasurement range at about 10:00 LT and increased substan-
tially with an observable growth rate (3.0 nm h−1). The nu-cleation mode particle concentration (Nnuc) increased rapidlyfrom ∼ 0.13× 104 cm−3 to ∼ 2.4× 104 cm−3 at noon withan average formation rate (J5.5) of 6.9 cm−3 s−1. Since theconcentration of around 0.2–1× 106 cm−3 of < 5 nm par-ticles is needed to induce a growth rate of 1 nm h−1 byself-coagulation (Kulmala et al., 2004b), the initial nucle-ation mode particle concentration of< 3× 104 cm−3 in thisevent indicated that self-coagulation only made a minor
Atmos. Chem. Phys., 12, 9923–9939, 2012 www.atmos-chem-phys.net/12/9923/2012/

H. Guo et al.: Observation of aerosol size distribution and new particle formation 9933
contribution to the particle growth. After 14:00, the GR de-creased whereas the CS increased from 0.021 to 0.053 s−1,suggesting the increase in large surface area particles mighthave scavenged potential condensable vapors responsible forparticle growth. After 16:00, the total PN concentration de-creased gradually to the background at 22:00. Additionally,correlation ofNnuc with secondary pollutant O3 (R = 0.70,p < 0.001) was much higher than that with primary pol-lutants i.e. SO2 (R = 0.17, p < 0.01), CO (R = 0.06, p <
0.01) and NO (R = 0.23,p < 0.01), suggesting that the NPFevent was likely associated with the photochemical forma-tion via VOC oxidation processes, rather than direct emis-sions from urban sources.
Given that the transformation from gas-phase pollutantsto nucleation mode particles requires sufficient time, theremay be a delay between the measured gaseous pollutants i.e.SO2 and the formation of nucleation mode particles. Indeed,a much better correlation between H2SO4 proxy andJ5.5with 0.8-h time lag was found (see Table 2), suggesting thepossible involvement of H2SO4 vapor or/and SO2 oxidationproducts in this nucleation event. More detailed discussion isgiven in Sect. 3.3.2.
The variations of organic aerosol precursors i.e. VOCs andcarbonyls were preliminarily investigated on 28 October. Theconcentrations of BVOC and AVOC species i.e. the potentialprecursors of secondary organic aerosols (SOA), started toincrease at∼ 07:00 LT, reached the maxima at∼ 13:00 LT(i.e. BVOCs: isoprene 96 pptv,α-pinene 24 pptv,β-pinene6 pptv, myrcene 5 pptv and limonene 329 pptv; and AVOCs:propene 510 pptv, toluene 6079 pptv, ethyltoluenes 180 pptvand triethylbenzenes 246 pptv). The start time for the in-crease in VOC species (07:00 LT) were about 3 h earlier thanthe time when the 5.5 nm nucleation mode particles started toincrease (10:00 LT). It is noteworthy that there is a time delaybefore a VOC turns to condensable species that could pro-mote particle to grow to the detectable size of 5.5 nm for theinstrument. The delayed time depends on the production rateof the condensational vapor from VOCs and on the growthrate of the particle from cluster into 5.5 nm. It is known thatthe oxidation products of BVOCs and AVOCs have a poten-tial contribution to the NPF and growth (Griffin et al., 1999;Kulmala et al., 2004a; Hatch et al., 2011). In this event, itwas found that the concentrations of the measured BVOCsversusNnuc showed a power-law relation with a power expo-nent between 1 and 3, similar to all other NPF events foundin this study (see Fig. S4). The results suggest the associa-tion of BVOCs with the NPF. Indeed, direct evidence on theparticipation of organic vapors in the nucleation process hasbeen obtained in laboratory experiments (e.g. R. Zhang et al.,2004) and field measurements (e.g. Paasonen et al., 2010).More detailed discussion about the characteristics of contri-bution of VOCs on the growth rate is given in Sect. 3.3.3.
25
2018161412108
Ln (SA proxy)
-10
-8
-6
-4
-2
0
2
4
Ln
(J
5.5
)
-10
-8
-6
-4
-2
0
2
4
-10
-8
-6
-4
-2
0
2
4
-10
-8
-6
-4
-2
0
2
4
Data points
Fitted line: Y=1.254 X-21.68 Line with slope 1 Line with slope 2
392
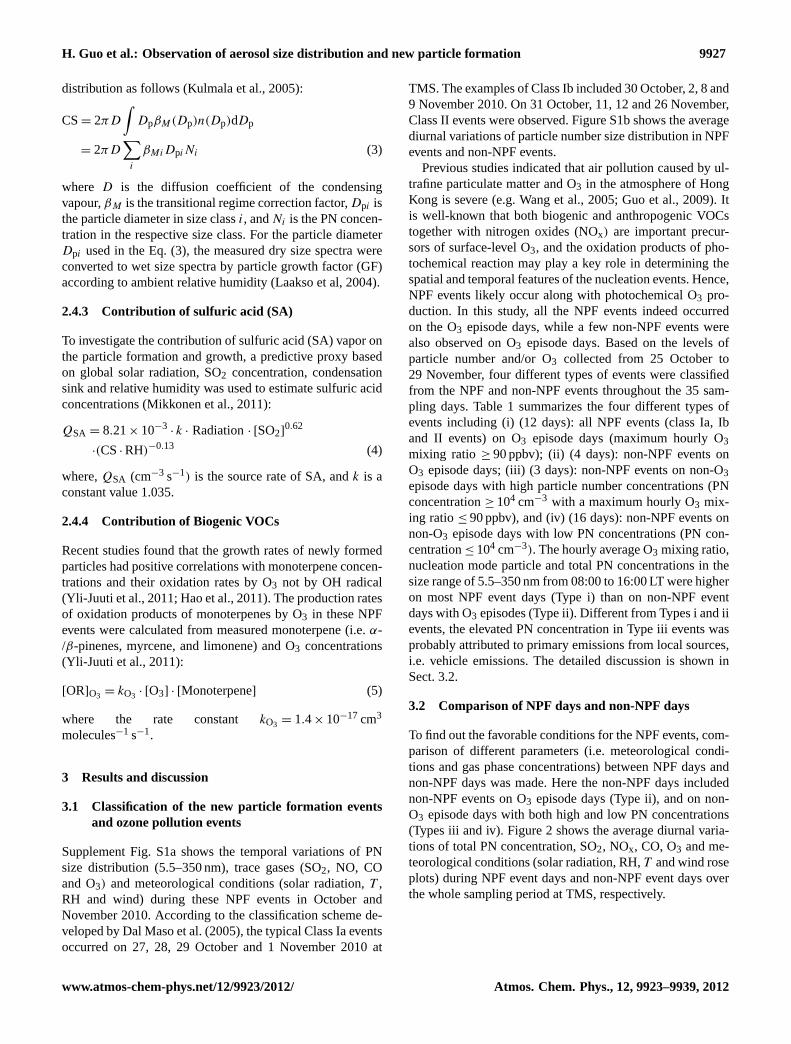
Figure 4 The logarithm of formation rate J5.5 estimated from particle measurements versus the logarithm of the sulfuric acid proxy (4 393
minutes averages) during the nucleation events from 0600~1600 LT. Sulfuric acid proxy concentrations have been delayed by the 394
fitted time lags. Lines with slopes 1 and 2 (corresponding to values 1 and 2 in the exponent nJ5.5) are also shown. 395
396
Apart from the connection with particle nucleation, the H2SO4 vapor has also been found to take part in the particle growth. 397
Weber et al. (1997) estimated the growth rate of nucleation mode particles from the time taken between the increase in gas phase 398
sulfuric acid concentration and the increase in 3 nm particle concentrations. The observed growth rates of 1–2 nm h-1
were 399
Fig. 4.The logarithm of formation rateJ5.5 estimated from particlemeasurements versus the logarithm of the sulfuric acid proxy (4 minaverages) during the nucleation events from 06:00–16:00 LT. Sulfu-ric acid proxy concentrations have been delayed by the fitted timelags. Lines with slopes 1 and 2 (corresponding to values 1 and 2 inthe exponentnJ5.5) are also shown.
3.3.2 Sulfuric acid vapor
The real nucleation rate (Jreal) and the particle growth rateare both expected to be positively correlated with “non-volatile” vapor concentrations (Kulmala et al., 2004). As al-ready discussed in Sect. 3.2, we are unable to measureJrealdue to instrumental limitation. Nonetheless, it would be use-ful to study the relationship between measured gaseous com-pounds and the calculatedJ5.5. In this study,J5.5 had posi-tive relationships with gas phase SO2 and solar radiation (Ta-ble 3). Since the product of ultraviolet radiation and SO2 (i.e.UV × SO2) can be used as a surrogate parameter for H2SO4production (Petaja et al., 2009), the positive relationships ofJ5.5 with SO2 and solar radiation suggested that concentra-tion of sulfuric acid had a contribution to the nucleation modeparticle (5.5 nm) formation. Figure 4 shows a plot of the esti-mated particle formation rateJ5.5 vs. the sulfuric acid proxycalculated by Eq. (4) (in logarithmic scale). The sulfuric acidproxy concentrations here had been delayed by the fitted timelags for each NPF event ranging from 0.2–0.8 h. Moderatecorrelation coefficientsR ranging from 0.49 to 0.78 with allp < 0.05 were observed (see Fig. 4 and Table 2). Severalstudies have analyzed the slope of log (H2SO4) vs. log (J3)
because this could in principle reveal the number of sulfu-ric acid molecules required for a critical, thermodynamicallystable cluster as well as give hints on the acting nucleationmechanism. These studies have observed slopes between 1and 2 (i.e. exponentnJ3 between 1 and 2) (Weber et al., 1999;Kulmala et al., 2006; Sihto et al., 2006; Kuang et al., 2008).As shown in Fig. 4 and Table 2, the optimal fitted line had a
www.atmos-chem-phys.net/12/9923/2012/ Atmos. Chem. Phys., 12, 9923–9939, 2012

9934 H. Guo et al.: Observation of aerosol size distribution and new particle formation
slope of about 1.3 and the exponentnJ5.5 for all NPF eventsnever exceeded 2 in this study, indicating reasonable con-sistency with earlier studies. The results suggested that theactivation of stable clusters and/or kinetic nucleation werepossibly the mechanisms for atmospheric particle formation.
Apart from the connection with particle nucleation, theH2SO4 vapor has also been found to take part in the parti-cle growth. Weber et al. (1997) estimated the growth rate ofnucleation mode particles from the time taken between theincrease in gas phase sulfuric acid concentration and the in-crease in 3 nm particle concentrations. The observed growthrates of 1–2 nm h−1 were approximately ten times faster thanthose calculated assuming condensational growth caused bysulfuric acid and water. In our calculations, we determinedthe observed growth rates from the SMPS data plots in thebeginning of the event. Table 2 gives the fraction of sul-furic acid contribution to GR during each nucleation event,where the measured GR, estimated sulfuric acid concentra-tion (Csa) and the sulfuric acid concentration needed for GRof 1 nm h−1 (Co) considering the influence of relative hu-midity (Nieminen et al., 2010) in each nucleation event areshown. The fraction contribution (FC) of sulfuric acid to GRin all NPF events ranged from 9.2 to 52.5 %, showing largevariations of sulfuric acid contribution to the observed GRduring these NPF event days. Meanwhile, no direct corre-lation between observed GR and sulfuric acid concentrationwas found, indicating that the condensation of sulfuric acidvapor for particle growth was influenced by the atmosphericconditions i.e. solar radiation, water vapor and backgroundPN concentration.
To further investigate the key atmospheric conditions be-hind the nucleation events, we utilized the parameterizationapproach described by Stanier et al. (2004b), who suggestedthat favorable conditions for nucleation can be describedusing a product of UV radiation and sulfuric dioxide (itsincrease indicates increase of sulfuric acid concentration),and the condensation sink. Figure 5 shows scatter plot ofUV × SO2 versus CS during the NPF events (red dots) andnon-NPF events (blue dots) at TMS. For most of the NPFevent days, the data points lay to the right of the diagonal line.The threshold (line) was calculated according to the model-based correlations in Pirjola et al. (1999) under the ground-level conditions. This model was designed to predict the re-quired H2SO4 production rates for nucleation and growth asa function of CS, RH and temperature. The lower right re-gion indicated more favorable conditions to nucleation thanupper left region. As expected, the relatively low CS val-ues on NPF days compared to those on non-NPF days werethe favorable conditions for nucleation at this site. When theUV × SO2 product increased and the CS values decreased,the nucleation events were likely observed. The criterion ofStanier et al. (2004b) indicates that low enough CS valueis needed together with high enough sulfuric acid produc-tion, in agreement with our findings that SO2, solar radiationand CS inverse have positive relationships with FR (Table 3).
27
at a background site in Kong Hong was 7.5 ppbv in October and 11 ppbv in November, respectively, suggesting that the SO2 422
background concentration in the PRD region was abundant for the required SO2 in nucleation events. Hence, low enough CS value and 423
strong UV radiation are favorable conditions or even more important factors for NPF occurrence at this sampling site. 424
5
6
7
8
90.01
2
3
4
5
6
7
8
90.1
2
0.01 0.1 1 10 100
0.001
2
3
4
5
6
78
0.01
2
3
4
5
6
78
0.1
2
0.01 0.1 1 10 100
UV*SO2( Wm-2
ppbv )
5
6
7
8
90.01
2
3
4
5
6
7
8
90.1
2
CS
(s
-1)
2
3
4
5
6
7
89
0.01
2
3
4
5
6
7
89
0.1
2
NPF events
Non-NPF events
425
Figure 5 Scatter plot of UV×SO2 versus condensation sink during the NPF events (red dots) and non-NPF events (blue dots). 426
Condensational sink (y axis-left) is plotted against the product of ultraviolet light intensity and SO2 concentration (x axis). Four-427 minute averaged values are plotted from the event start time to the event end time on NPF event days. On non-NPF event days, a time 428
range from 0800 to 1600LT is applied. 429
Fig. 5. Scatter plot of UV× SO2 versus condensation sink duringthe NPF events (red dots) and non-NPF events (blue dots). Con-densational sink (y-axis-left) is plotted against the product of ultra-violet light intensity and SO2 concentration (x-axis). Four-minuteaveraged values are plotted from the event start time to the eventend time on NPF event days. On non-NPF event days, a time rangefrom 08:00 to 16:00 LT is applied.
At TMS, the NPF events occurred with SO2 mixing ratiosranged from 4.0–5.5 ppbv during the sampling period (Octo-ber/November). Wang et al. (2005) reported that the monthlyaverage mixing ratio of SO2 from August 2001 to December2002 at a background site in Kong Hong was 7.5 ppbv in Oc-tober and 11 ppbv in November, respectively, suggesting thatthe SO2 background concentration in the PRD region wasabundant for the required SO2 in nucleation events. Hence,low enough CS value and strong UV radiation are favorableconditions or even more important factors for NPF occur-rence at this sampling site.
3.3.3 VOCs
Studies have demonstrated that many BVOC species, i.e. iso-prene and monoterpenes, and some AVOCs such as toluenecould make contributions to the formation of secondary or-ganic aerosol in the atmosphere (e.g. Fu and Kawamura,2011; Kamens et al., 2011). In this study, it was found thatmonoterpenes along with O3, solar radiation and tempera-ture were positively correlated with GR, while other VOCsspecies, i.e. isoprene, aromatics and carbonyls includingformaldehyde, acetaldehyde and acetone showed poor andnegative relationships with GR (Table 3). However, the anal-ysis on the correlations of isoprene with total PN concentra-tions and nucleation mode PN concentrations on NPF eventdays and non-NPF event days indicated that isoprene had
Atmos. Chem. Phys., 12, 9923–9939, 2012 www.atmos-chem-phys.net/12/9923/2012/

H. Guo et al.: Observation of aerosol size distribution and new particle formation 9935
linear correlations with PN and power-law correlations withNnuc on both NPF event days (RPN = 0.82 andRNnuc = 0.71,p < 0.001) and on non-NPF event days (RPN = 0.70 andRNnuc = 0.75,p < 0.001), suggesting that isoprene might benot a critical parameter for NPF. Instead, the negative corre-lations of isoprene with FR (R = −0.40, p < 0.05) and GR(R = −0.38,p < 0.05) implied that the increase in isoprenemight have a negative effect on NPF. Indeed, a recent cham-ber study found that large isoprene emission could suppressbiogenic NPF (Kiendler-Scharr et al., 2009). They claim thatNPF rate depends on the concentrations of OH radical whichcould react with BVOCs to form particles. Due to the strongreactivity of isoprene with OH radicals, OH concentrationsare significantly constrained in the presence of isoprene.Moreover, the oxidation products from the reaction betweenisoprene and OH radical do not contribute to the nucleationprocess due to their high volatility (Kiendler-Scharr et al.,2009). Therefore, the increased isoprene emission would in-hibit the reaction of non-isoprene VOCs with OH radicalswhich could produce condensational organic vapors. Previ-ous studies indicate that condensable organics might be im-portant in speeding up the growth of newly formed molecu-lar clusters (e.g. Kerminen et al., 2004). The growth rates of7–20 nm particles showed positive correlation with monoter-pene concentrations and their oxidation rate by O3 (Yli-Juutiet al., 2011). To investigate the contributions of monoter-penes and their oxidation products to the nucleation modeparticle growth, the measured monoterpenes concentrationand the estimated oxidation products rate of monoterpenesby O3, i.e. [MT*O3] were plotted against the GR of par-ticles during the event hours, i.e. 08:00–16:00 LT in eightNPF events. The linear correlation coefficients are shownin Table 3. The results indicated that the GR of 5.5–25 nmparticles had good correlations with monoterpene concen-trations (R = 0.82, p < 0.05), and the measurement-basedcalculated [MT*O3] (R = 0.80, p < 0.05), suggesting thatmonoterpenes and their oxidation products could be impor-tant in driving the growth of freshly nucleated particles in thismountain area. Indeed, Bonn and Moorgat (2002) found thatlarge organic acids formed fromα-pinene ozonolysis possi-bly participated in biogenic nucleation and growth.
4 Conclusions
Particle number size distributions were measured at a subur-ban site near the mountain summit of TMS from October toNovember 2010. The NPF events were observed on 12 outof 35 days at TMS based on the evolution of particle sizedistributions andNnuc concentrations. Diurnal variations ofair pollutants and meteorological parameters suggested thatparticle nucleation and growth events were associated withcool and dry air from the PRD region caused by the win-ter monsoon. The mean values of the growth and forma-tion rates of the nucleation mode particles were 4.2 nm h−1
and 3.0 cm−3 s−1, respectively. Wind speed, solar radiation,O3 and SO2 concentrations were all on average higher onNPF events days than on non-NPF event days. In contrast,temperature, relative humidity and daytime NO2 concentra-tions were higher on non-NPF event days than on NPF eventdays. Backward trajectory analyses and wind roses showedthat north to northeast winds were prevailing during the NPFevents while east winds dominated on the non-NPF eventdays.
It was found that the formation rate of 5.5 nm particle hada power-law dependence on sulfuric acid concentration (withtime lag 1tJ5.5), with the typical power between 1 and 2,and the contribution of sulfuric acid vapor to the particlegrowth rate ranged from 9.2 % to 52.5 % on these NPF eventdays. The examination of various nucleation parameters re-vealed that high sulfuric acid production with low condensa-tion sink could be indicators of the occurrence of a potentialNPF event. Moreover, based on the correlations of GR withambient concentrations of BVOCs and their oxidation prod-ucts, i.e. condensable organics, we found that monoterpenesseemed to be the most important BVOC species related to theGR of particles on the NPF event days.
Supplementary material related to this article isavailable online at:http://www.atmos-chem-phys.net/12/9923/2012/acp-12-9923-2012-supplement.pdf.
Acknowledgements.This project is supported by the Environ-ment and Conservation Fund (ECF) of the Hong Kong SpecialAdministrative Region (ECF 20/2008), and the Research GrantCouncil (RGC) of the Hong Kong Special Administrative Region(PolyU5179/09E).
Edited by: V.-M. Kerminen
References
Alam, A., Shi, J. P., and Harrison, R. M.: Observations of new par-ticle formation in urban air, J. Geophys. Res., 108, 4093–4107,2003.
Asmi, E., Kivekas, N., Kerminen, V.-M., Komppula, M., Hyvarinen,A.-P., Hatakka, J., Viisanen, Y., and Lihavainen, H.: Secondarynew particle formation in Northern Finland Pallas site betweenthe years 2000 and 2010, Atmos. Chem. Phys., 11, 12959–12972,doi:10.5194/acp-11-12959-2011, 2011.
Birmili, W. and Wiedensohler, A.: New particle formation in thecontinental boundary layer: Meteorological and gas phase pa-rameter influence, Geophys. Res. Lett., 27, 3325–3328, 2000.
Birmili, W., Berresheim, H., Plass-Dulmer, C., Elste, T., Gilge,S., Wiedensohler, A., and Uhrner, U.: The Hohenpeissenbergaerosol formation experiment (HAFEX): a long-term studyincluding size-resolved aerosol, H2SO4, OH, and monoter-penes measurements, Atmos. Chem. Phys., 3, 361–376,doi:10.5194/acp-3-361-2003, 2003.
www.atmos-chem-phys.net/12/9923/2012/ Atmos. Chem. Phys., 12, 9923–9939, 2012

9936 H. Guo et al.: Observation of aerosol size distribution and new particle formation
Bonn, B. and Moorgat, G. K.: New particle formation during a- andb-pinene oxidation by O3, OH and NO3, and the influence ofwater vapour: particle size distribution studies, Atmos. Chem.Phys., 2, 183–196,doi:10.5194/acp-2-183-2002, 2002.
Boy, M. and Kulmala, M.: Nucleation events in the continentalboundary layer: Influence of physical and meteorological param-eters, Atmos. Chem. Phys., 2, 1–16,doi:10.5194/acp-2-1-2002,2002.
Boy, M., Kulmala, M., Ruuskanen, T. M., Pihlatie, M., Reissell,A., Aalto, P. P., Keronen, P., Dal Maso, M., Hellen, H., Hakola,H., Jansson, R., Hanke, M., and Arnold, F.: Sulphuric acid clo-sure and contribution to nucleation mode particle growth, Atmos.Chem. Phys., 5, 863–878,doi:10.5194/acp-5-863-2005, 2005.
Cheung, H. C., Morawska, L., and Ristovski, Z. D.: Observationof new particle formation in subtropical urban environment, At-mos. Chem. Phys., 11, 3823–3833,doi:10.5194/acp-11-3823-2011, 2011.
Dal Maso, M., Kulmala, M., Riipinen, I., Wagner, R., Hussein, T.,Aalto, P. P., and Lehtinen, K. E. J.: Formation and growth of freshatmospheric aerosols eight years of aerosol size distribution datafrom SMEAR II, Hyytiala, Finland, Boreal Environ. Res., 10,323–336, 2005.
Dal Maso, M., Sogacheva, L., Aalto, P. P., Riipinen, I., Komp-pula, M., Tunved, P., Korhonen, L., Suur-Uski, V., Hirsikko, A.,Kurten, T., Kerminen, V.-M., Lihavainen, H., Viisanen, Y., Hans-son, H.-C., and Kulmala, M.: Aerosol size distribution measure-ments at four Nordic field stations: identification, analysis andtrajectory analysis of new particle formation bursts, Tellus, 59B,350–361, 2007.
Davidson, C. I., Phalen, R. F., and Solomon, P. A.: Airborne partic-ular matter and human health: a review, Aerosol Sci. Technol.,39, 737–749, 2005.
Draxler, R. R. and Hess, G. D.: An overview of the HYSPLIT4modelling system for trajectories, dispersion and deposition,Aust. Meteorol. Meg., 47, 295–308, 1998.
Dunn, M. J., Jimenez, J.-L., Baumgardner, D., Castro, T., Mc-Murry, P. H., and Smith, J. N.: Measurements of MexicoCity nanoparticle size distributions: observations of new par-ticle formation and growth, Geophys. Res. Lett., 31, L10102,doi:10.1029/2004GL019483, 2004.
Fu, P. Q. and Kawamura, K.: Diurnal variations of polar organictracers in summer forest aerosols: a case study of a Quercus andPicea mixed forest in Hokkaido, Japan, Geochem. J., 45, 297–308, 2011.
Gannet, H., Douglas, H. L., Galina, C., Randolph, D. B., and Chris-tine, W.: Persistent daily new particle formation at a mountain-top location, Atmos. Environ., 45, 4111–4115, 2011.
Gao, J., Wang, T., Zhou, X. H., Wu, W. S., and Wang, W. X.: Mea-surement of aerosol number size distributions in the YangtzeRiver delta in China: Formation and growth of particles underpolluted conditions, Atmos. Environ., 43, 829–836, 2009.
Griffin, R. J., Cocker III, D. R., Flagan, R. C., and Seinfeld, J. H.:Organic aerosol formation from the oxidation of biogenic hydro-carbons, J. Geophys. Res., 104, 3555–3567, 1999.
Guo, H., Ding, A. J., Morawska, L., He, C. R., Ayoko, G. A., Li, Y.-S., and Hung, W.-T.: Size distribution and new particle formationin subtropical Eastern Australia, Environ. Chem., 5, 382–390,2008.
Guo, H., Jiang, F., Cheng, H. R., Simpson, I. J., Wang, X. M., Ding,A. J., Wang, T. J., Saunders, S. M., Wang, T., Lam, S. H. M.,Blake, D. R., Zhang, Y. L., and Xie, M.: Concurrent observa-tions of air pollutants at two sites in the Pearl River Delta and theimplication of regional transport, Atmos. Chem. Phys., 9, 7343–7360,doi:10.5194/acp-9-7343-2009, 2009.
Guo, H., Ling, Z. H., Simpson, I. J., Blake, D. R., and Wang, D. W.:Observations of isoprene, methacrolein (MAC) and methyl vinylketone (MVK) at a mountain site in Hong Kong, J. Geophys.Res., 117, D19303,doi:10.1029/2012JD017750, 2012.
Hamed, A., Joutsensaari, J., Mikkonen, S., Sogacheva, L., DalMaso, M., Kulmala, M., Cavalli, F., Fuzzi, S., Facchini, M. C.,Decesari, S., Mircea, M., Lehtinen, K. E. J., and Laaksonen,A.: Nucleation and growth of new particles in Po Valley, Italy,Atmos. Chem. Phys., 7, 355–376,doi:10.5194/acp-7-355-2007,2007.
Hamed, A., Korhonen, H., Sihto, S.-L., Joutsensaari, J., Jarvinen,H., Petaja, T., Arnold, F., Nieminen, T., Kulmala, M., Smith, J.N., Lehtinen, K. E. J., and Laaksonen, A.: The role of relativehumidity in continental new particle formation, J. Geophys. Res.,116, D03202,doi:10.1029/2010JD014186, 2011.
Hao, L. Q., Romakkaniemi, S., Yli-Pirila, P., Joutsensaari, J., Ko-rtelainen, A., Kroll, J. H., Miettinen, P., Vaattovaara, P., Tiitta, P.,Jaatinen, A., Kajos, M. K., Holopainen, J. K., Heijari, J., Rinne,J., Kulmala, M., Worsnop, D. R., Smith, J. N., and Laaksonen,A.: Mass yields of secondary organic aerosols from the oxida-tion of α-pinene and real plant emissions, Atmos. Chem. Phys.,11, 1367–1378,doi:10.5194/acp-11-1367-2011, 2011.
Hatch, L. E., Creamean, J. M., Ault, A. P., Surratt, J. D., Chan, M.N., Seinfeld, Y., and Prather, K. A.: Measurements of isoprene-derived organosulfates in ambient aerosols by aerosol time-of-flight mass spectrometry – part 1: single particle atmosphericobservations in atlanta, Environ. Sci. Technol., 45, 5105–5111,2011.
Jimenez, J. L., Canagaratna, M. R., Donahue, N. M., Prevot, A. S.H., Zhang, Q., Kroll, J. H., DeCarlo, P. F., Allan, J. D., Coe,H., Ng, N. L., Aiken, A. C., Docherty, K. S., Ulbrich, I. M.,Grieshop, A. P., Robinson, A. L., Duplissy, J., Smith, J. D., Wil-son, K. R., Lanz, V. A., Hueglin, C., Sun, Y. L., Tian, J., Laak-sonen, A., Raatikainen, T., Rautiainen, J., Vaattovaara, P., Ehn,M., Kulmala, M., Tomlinson, J. M., Collins, D. R., Cubison, M.J., Dunlea, E. J., Huffman, J. A., Onasch, T. B., Alfarra, M. R.,Williams, P. I., Bower, K., Kondo, Y., Schneider, J., Drewnick,F., Borrmann, S., Weimer, S., Demerjian, K., Salcedo, D., Cot-trell, L., Griffin, R., Takami, A., Miyoshi, T., Hatakeyama, S.,Shimono, A., Sun, J. Y., Zhang, Y. M., Dzepina, K., Kimmel, J.R., Sueper, D., Jayne, J. T., Herndon, S. C., Trimborn, A. M.,Williams, L. R., Wood, E. C., Middlebrook, A. M., Kolb, C.E., Baltensperger, U., and Worsnop, D. R.: Evolution of organicaerosols in the atmosphere, Science, 326, 1525–1529, 2009.
Kamens, R. M., Zhang, H., Chen, E. H., Zhou, Y., Parikh, H. M.,Wilson, R. L., Galloway, K. E., and Rosen, E. P.: Secondary or-ganic aerosol formation from toluene in an atmospheric hydro-carbon mixture: water and particle seed effects, Atmos. Environ.,45, 2324–2334, 2011.
Kerminen, V. M., Lehtinen, K. E. J., Anttila, T., and Kulmala, M.:Dynamics of atmospheric nucleation mode particles: a timescaleanalysis, Tellus B, 56, 135–146, 2004.
Atmos. Chem. Phys., 12, 9923–9939, 2012 www.atmos-chem-phys.net/12/9923/2012/

H. Guo et al.: Observation of aerosol size distribution and new particle formation 9937
Kerminen, V.-M., Petaja, T., Manninen, H. E., Paasonen, P., Niem-inen, T., Sipila, M., Junninen, H., Ehn, M., Gagne, S., Laakso,L., Riipinen, I., Vehkamaki, H., Kurten, T., Ortega, I. K., DalMaso, M., Brus, D., Hyvarinen, A., Lihavainen, H., Leppa, J.,Lehtinen, K. E. J., Mirme, A., Mirme, S., Horrak, U., Berndt,T., Stratmann, F., Birmili, W., Wiedensohler, A., Metzger, A.,Dommen, J., Baltensperger, U., Kiendler-Scharr, A., Mentel, T.F., Wildt, J., Winkler, P. M., Wagner, P. E., Petzold, A., Minikin,A., Plass-Dulmer, C., Poschl, U., Laaksonen, A., and Kulmala,M.: Atmospheric nucleation: highlights of the EUCAARI projectand future directions, Atmos. Chem. Phys., 10, 10829–10848,doi:10.5194/acp-10-10829-2010, 2010.
Kiendler-Scharr, A., Wildt, J., DalMaso, M., Hohaus, T., Kleist, E.,Mentel, T. F., Tillmann, R., Uerlings, R., Schurr, U., and Wah-ner, A.: New particle formation in forests inhibited by isopreneemissions, Nature, 461, 381–384, 2009.
Kivekas, N., Sun, J., Zhan, M., Kerminen, V.-M., Hyvarinen, A.,Komppula, M., Viisanen, Y., Hong, N., Zhang, Y., Kulmala, M.,Zhang, X.-C., Deli-Geer, and Lihavainen, H.: Long term parti-cle size distribution measurements at Mount Waliguan, a high-altitude site in inland China, Atmos. Chem. Phys., 9, 5461–5474,doi:10.5194/acp-9-5461-2009, 2009.
Komppula, M., Dal Maso, M., Lihavainen, H., Aalto, P. P., Kul-mala, M., and Viisanen, Y.: Comparison of new particle forma-tion events at two locations in northern Finland, Boreal Environ.Res., 8, 395–404, 2003.
Kovats, R. S. and Haines, A.: Global climate change and health:recent findings and future steps, Can. Med. Assoc. J., 172, 501–502, 2005.
Kuang, C., McMurry, P. H., McCormick, A. V., and Eisele, F. L.:Dependence of nucleation rates on sulfuric acid vapor concen-tration in diverse atmospheric locations, J. Geophys. Res., 113,D10209,doi:10.1029/2007jd009253, 2008.
Kulmala, M., Pirjola, L., and Makela, J. M.: Stable sulphate clustersas a source of new atmospheric particles, Nature, 404, 66–69,2000.
Kulmala, M., Vehkamaki, H., Petaja, T., Dal Maso, M., Lauri, A.,Kerminen, V. M., Birmili, W., and McMurry, P. H.: Formationand growth rates of ultrafine atmospheric particles: A review ofobservations, J. Aerosol Sci., 35, 143–176, 2004a.
Kulmala, M., Laakso, L., Lehtinen, K. E. J., Riipinen, I., Dal Maso,M., Anttila, T., Kerminen, V.-M., Horrak, U., Vana, M., and Tam-met, H.: Initial steps of aerosol growth, Atmos. Chem. Phys., 4,2553–2560,doi:10.5194/acp-4-2553-2004, 2004b.
Kulmala, M., Petaja, T., Monkkonen, P., Koponen, I. K., Dal Maso,M., Aalto, P. P., Lehtinen, K. E. J., and Kerminen, V.-M.: On thegrowth of nucleation mode particles: source rates of condensablevapor in polluted and clean environments, Atmos. Chem. Phys.,5, 409–416,doi:10.5194/acp-5-409-2005, 2005.
Kulmala, M., Lehtinen, K. E. J., and Laaksonen, A.: Cluster activa-tion theory as an explanation of the linear dependence betweenformation rate of 3nm particles and sulphuric acid concentration,Atmos. Chem. Phys., 6, 787–793,doi:10.5194/acp-6-787-2006,2006.
Kurten, T., Noppel, M., Vehkamaki, H., Salonen, M., and Kulmala,M.: Quantum chemical studies of hydrate formation of H2SO4and HSO−4 , Boreal Environ. Res., 12, 431–453, 2007.
Laakso, L., Petaja, T., Lehtinen, K. E. J., Kulmala, M., Paatero, J.,Horrak, U., Tammet, H., and Joutsensaari, J.: Ion production ratein a boreal forest based on ion, particle and radiation measure-ments, Atmos. Chem. Phys., 4, 1933–1943,doi:10.5194/acp-4-1933-2004, 2004.
Laaksonen, A., Kulmala, M., O’Dowd, C. D., Joutsensaari, J., Vaat-tovaara, P., Mikkonen, S., Lehtinen, K. E. J., Sogacheva, L., DalMaso, M., Aalto, P., Petaja, T., Sogachev, A., Yoon, Y. J., Li-havainen, H., Nilsson, D., Facchini, M. C., Cavalli, F., Fuzzi, S.,Hoffmann, T., Arnold, F., Hanke, M., Sellegri, K., Umann, B.,Junkermann, W., Coe, H., Allan, J. D., Alfarra, M. R., Worsnop,D. R., Riekkola, M.-L., Hyotylainen, T., and Viisanen, Y.: Therole of VOC oxidation products in continental new particle for-mation, Atmos. Chem. Phys., 8, 2657–2665,doi:10.5194/acp-8-2657-2008, 2008.
Lee, Y., Lee, H., Kim, M., Choi, C. Y., and Kim, J.: Characteris-tics of particle formation events in the coastal region of Korea in2005, Atmos. Environ., 42, 3729–3739, 2008.
Liu, S., Hu, M., Wu, Z. J., Wehner, B., Wiedensohler. A., andCheng, Y. F.: Aerosol number size distribution and new parti-cle formation at a rural/coastal site in Pearl River Delta (PRD) ofChina, Atmos. Environ., 25, 6275–6283, 2008.
McMurry, P. H., Kuang, C. A., Smith, J. N., Zhao, J., and Eisele,F.: Atmospheric New Particle Formation: Physical and ChemicalMeasurements, Aerosol Measurement, John Wiley & Sons, Inc.,681–695, 2011.
Mikkonen, S., Korhonen, H., Romakkaniemi, S., Smith, J. N., Jout-sensaari, J., Lehtinen, K. E. J., Hamed, A., Breider, T. J., Bir-mili, W., Spindler, G., Plass-Duelmer, C., Facchini, M. C., andLaaksonen, A.: Meteorological and trace gas factors affecting thenumber concentration of atmospheric Aitken (Dp = 50 nm) par-ticles in the continental boundary layer: parameterization using amultivariate mixed effects model, Geosci. Model Dev., 4, 1–13,doi:10.5194/gmd-4-1-2011, 2011.
Modini, R. L., Ristovski, Z. D., Johnson, G. R., He, C., Surawski,N., Morawska, L., Suni, T., and Kulmala, M.: New particle for-mation and growth at a remote, sub-tropical coastal location, At-mos. Chem. Phys., 9, 7607–7621,doi:10.5194/acp-9-7607-2009,2009.
Nieminen, T., Lehtinen, K. E. J., and Kulmala, M.: Sub-10 nm par-ticle growth by vapor condensation – effects of vapor moleculesize and particle thermal speed, Atmos. Chem. Phys., 10, 9773–9779,doi:10.5194/acp-10-9773-2010, 2010.
Oberdorster, G., Oberdorster, E., and Oberdorster, J.: Nanotoxicol-ogy: an emerging discipline evolving from studies of ultrafineparticles, Environ. Health Perspect., 113, 823–839, 2005.
Paasonen, P., Nieminen, T., Asmi, E., Manninen, H. E., Petaja,T., Plass-Dulmer, C., Flentje, H., Birmili, W., Wiedensohler, A.,Horrak, U., Metzger, A., Hamed, A., Laaksonen, A., Facchini,M. C., Kerminen, V.-M., and Kulmala, M.: On the roles of sul-phuric acid and low-volatility organic vapours in the initial stepsof atmospheric new particle formation, Atmos. Chem. Phys., 10,11223–11242,doi:10.5194/acp-10-11223-2010, 2010.
Park, J., Sakurai, H., Vollmers, K., and McMurry, P.: Aerosol sizedistributions measured at the South Pole during ISCAT, Atmos.Environ., 38, 5493–5500, 2004.
www.atmos-chem-phys.net/12/9923/2012/ Atmos. Chem. Phys., 12, 9923–9939, 2012

9938 H. Guo et al.: Observation of aerosol size distribution and new particle formation
Penner, J. E., Dong, X., and Chen, Y.: Observational evidence ofa change in radiative forcing due to the indirect aerosol effect,Nature, 427, 231–234, 2004.
Petaja, T., Mauldin, III, R. L., Kosciuch, E., McGrath, J., Niem-inen, T., Paasonen, P., Boy, M., Adamov, A., Kotiaho, T., andKulmala, M.: Sulfuric acid and OH concentrations in a borealforest site, Atmos. Chem. Phys., 9, 7435–7448,doi:10.5194/acp-9-7435-2009, 2009.
Pirjola, L., Kulmala, M., Wilck, M., Bischoff, A., Stratmann, F., andOtto, E.: Formation of sulphuric acid aerosols and cloud conden-sation nuclei: an expression for significant nucleation and modelcomparison, J. Aerosol Sci., 30, 1079–1094,doi:10.1016/S0021-8502(98)00776-9, 1999.
Qian, S., Sakurai, H., and McMurry, P. H.: Characteristics of re-gional nucleation events in urban East St. Louis, Atmos. Envi-ron., 41, 4119–4127, 2007.
Riipinen, I., Sihto, S.-L., Kulmala, M., Arnold, F., Dal Maso, M.,Birmili, W., Saarnio, K., Teinila, K., Kerminen, V.-M., Laak-sonen, A., and Lehtinen, K. E. J.: Connections between atmo-spheric sulphuric acid and new particle formation during QUESTIII–IV campaigns in Heidelberg and Hyytiala, Atmos. Chem.Phys., 7, 1899–1914,doi:10.5194/acp-7-1899-2007, 2007.
Riipinen, I., Pierce, J. R., Yli-Juuti, T., Nieminen, T., Hakkinen,S., Ehn, M., Junninen, H., Lehtipalo, K., Petaja, T., Slowik, J.,Chang, R., Shantz, N. C., Abbatt, J., Leaitch, W. R., Kerminen,V.-M., Worsnop, D. R., Pandis, S. N., Donahue, N. M., and Kul-mala, M.: Organic condensation: a vital link connecting aerosolformation to cloud condensation nuclei (CCN) concentrations,Atmos. Chem. Phys., 11, 3865–3878,doi:10.5194/acp-11-3865-2011, 2011.
Rodriguez, S., Van Dingenen, R., Putaud, J.-P., Martins-Dos Santos,S., and Roselli, D.: Nucleation and growth of new particles inthe rural atmosphere of Northern Italy -relationship to air qualitymonitoring, Atmos. Environ., 39, 6734–6746, 2005.
Schlatter, J.: Comparison of Grimm and TSI Condensation ParticleCounters, 10 ETH-Conference on Combustion Generated Parti-cles, 21–23 August 2006.
Shen, X. J., Sun, J. Y., Zhang, Y. M., Wehner, B., Nowak, A.,Tuch, T., Zhang, X. C., Wang, T. T., Zhou, H. G., Zhang, X.L., Dong, F., Birmili, W., and Wiedensohler, A.: First long-termstudy of particle number size distributions and new particle for-mation events of regional aerosol in the North China Plain, At-mos. Chem. Phys., 11, 1565–1580,doi:10.5194/acp-11-1565-2011, 2011.
Sihto, S.-L., Kulmala, M., Kerminen, V.-M., Dal Maso, M., Petaja,T., Riipinen, I., Korhonen, H., Arnold, F., Janson, R., Boy, M.,Laaksonen, A., and Lehtinen, K. E. J.: Atmospheric sulphuricacid and aerosol formation: implications from atmospheric mea-surements for nucleation and early growth mechanisms, At-mos. Chem. Phys., 6, 4079–4091,doi:10.5194/acp-6-4079-2006,2006.
Sipila, M., Berndt, T., Petaja, T., Brus, D., Vanhanen, J., Strat-mann, F., Patokoski, J., Mauldin III, R. L., Hyvarinen, A.-P.,Lihavainen, H., and Kulmala, M.: The role of sulfuric acid inatmospheric nucleation, Science, 327, 1243–1246, 2010.
Stanier, C. O., Khlystov, A. Y., and Pandis, S. N.: Ambient aerosolsize distributions and number concentrations measured duringthe Pittsburgh Air Quality Study (PAQS), Atmos. Environ., 38,3275–3284, 2004a.
Stanier, C. O., Khlystov, A. Y., and Pandis, S. N.: Nucleation eventsduring the Pittsburgh Air Quality Study: description and rela-tion to key meteorological, gas phase, and aerosol parameters,Aerosol Sci. Technol., 38, 253–264, 2004b.
Tunved, P., Hansson, H.-C., Kerminen, V.-M., Strom, J., Dal Maso,M., Lihavainen, H., Viisanen, Y., Aalto, P. P., Komppula, M., andKulmala, M.: High natural aerosol loading over boreal forests,Science, 312, 261–263, 2006.
Vehkamaki, H., Dal Maso, M., Hussein, T., Flanagan, R.,Hyvarinen, A., Lauros, J., Merikanto, P., Monkkonen, M., Pih-latie, K., Salminen, K., Sogacheva, L., Thum, T., Ruuskanen, T.M., Keronen, P., Aalto, P. P., Hari, P., Lehtinen, K. E. J., Rannik,U., and Kulmala, M.: Atmospheric particle formation events atVarrio measurement station in Finnish Lapland 1998–2002, At-mos. Chem. Phys., 4, 2015-2023,doi:10.5194/acp-4-2015-2004,2004.
Wang, D. W., Guo, H., and Chan, C. K.: Measuring Ambient AcidicUltrafine Particles Using Iron Nanofilm Detectors: Method De-velopment, Aerosol Sci. Technol., 46, 521–532, 2012.
Wang, T., Guo, H., Blake, D. R., Kwok, Y. H., Simpson, I. J., and Li,Y. S.: Measurements of trace gases in the inflow of South ChinaSea background air and outflow of regional pollution at Tai O,southern China, J. Atmos. Chem., 52, 295–317, 2005.
Weber, R. J., Marti, J. J., McMurry, P. H., Eisele, F. L., Tanner, D.J., and Jefferson, A.: Measurements of new particle formationand ultrafine particle growth rates at a clean continental site, J.Geophys. Res., 102, 4375–4385,doi:10.1029/96JD03656, 1997.
Weber, R. J., McMurry, P. H., Mauldlin, R. L., Tanner, D. J., Eisele,F. L., Clarke, A. D., and Kapustin, V. N.: New particle forma-tion in the remote troposphere: A comparison of observations atvarious sites, Geophys. Res. Lett., 26, 307–310, 1999.
Weber, R. J., Moore, K., Kapustin, V., Clarke, A., Mauldin, R. L.,Kosciuch, E., Cantrell, C., Eisele, F., Anderson, B., and Thorn-hill, L.: Nucleation in the equatorial Pacific during PEM-TropicsB: enhanced boundary layer H2SO4 with no particle production,J. Geophys. Res., 106, 32767–32776, 2001
Woo, K. S., Chen, D. R., Pui, D. Y. H., and McMurry, P. H.: Mea-surement of Atlanta aerosol size distributions: Observations ofultrafine particle events, Aerosol Sci. Technol., 34, 75–87, 2001.
Wu, Z. J., Hu, M., Lin, P., Liu, S., Wehner, B., and Wiedensohler,A.: Particle number size distribution in the urban atmosphere ofBeijing, China, Atmos. Environ., 42, 7967–7980, 2008.
Yao, X., Choi, M. Y., Lau, N. T., Arthur Lau, P. S., Chan, C. K., andFang, M.: Growth and Shrinkage of New Particles in the Atmo-sphere in Hong Kong, Aerosol Sci. Technol., 44, 639–650, 2010.
Yue, D. L., Hu, M., Wu, Z. J., Wang, Z. B., Guo, S., Wehner, B.,Nowak, A., Achtert, P., Wiedensohler, A., Jung, J. S., Kim, Y. J.,and Liu, S. H.: Characteristics of aerosol size distributions andnew particle formation in the summer in Beijing, J. Geophys.Res., 114, D00G12,doi:10.1029/2008JD010894, 2009.
Yli-Juuti, T., Nieminen, T., Hirsikko, A., Aalto, P. P., Asmi, E.,Horrak, U., Manninen, H. E., Patokoski, J., Dal Maso, M.,Petaja, T., Rinne, J., Kulmala, M., and Riipinen, I.: Growthrates of nucleation mode particles in Hyytiala during 2003–2009: variation with particle size, season, data analysis methodand ambient conditions, Atmos. Chem. Phys., 11, 12865–12886,doi:10.5194/acp-11-12865-2011, 2011.
Atmos. Chem. Phys., 12, 9923–9939, 2012 www.atmos-chem-phys.net/12/9923/2012/

H. Guo et al.: Observation of aerosol size distribution and new particle formation 9939
Zhang, Q., Stanier, C. O., Canagaratna, M. R., Jayne, J., Worsnop,D. R., Pandis, S. N., and Jimenez, J. L.: Insight into the chemistryof new particle formation and growth events in Pittsburg basedon aerosol mass spectrometry, Environ. Sci. Technol., 38, 4797–4809, 2004.
Zhang, R., Suh, I., Zhao, J., Zhang, D., Fortner, E. C., Tie, X.,Molina, L. T., and Molina, M. J.: Atmospheric New particleformation enhanced by organic acids, Science, 304, 1487–1490,2004.
www.atmos-chem-phys.net/12/9923/2012/ Atmos. Chem. Phys., 12, 9923–9939, 2012