Objective Measurement of Simulator Sickness and …€¦ · Objective Measurement of Simulator...
14
Objective Measurement of Simulator Sickness and the Role of Visual-Vestibular Conflict Situations R.J.V. Bertin(1), C. Collet(2), S. Espié(3), W. Graf(1) (1) Lab. Physiologie de la Perception et de l’Action, CNRS-Collège de France, 11 Place Marcelin Berthelot, 75005 Paris, France; (2) UFR STAPS, Université Lyon 1, 69622 Villeurbanne, France; (3) URE Modélisations, Simulations et Simulateurs de Conduite, INRETS, 94114 Arcueil, France. Abstract Driving simulators are becoming more and more important: for research and development purposes, but also for education, training and even for recreation. We have conducted a series of studies on a problem that often occurs with driving simulators: simulator sickness. This phenomenon closely resembles the classically experienced motion sickness and can make a user abort a simulator run within minutes. We present an experiment in which we studied the psychophysical reactions of subjects and recorded their neurovegetative activity, to improve understanding of the underlying causes of simulator sickness. The ultimate goal is to develop an objective measure for monitoring simulator users, so that sickness can be detected before it is perceived by the subject. We used a fixed-base simulator, mimicking an urban circuit with many sharp turns and traffic lights. Subjects were asked to indicate continuously their discomfort on a visual-analog scale. We studied 33 normal volunteers (19 became sick). Sickness correlated strongly with anxiety. The subjective discomfort readings correlated well with simultaneous neurovegetative data (especially skin resistance and temperature) and with a symptom scoring test administered after the experiment. There was no clear indication of an age or gender effect. We also present some evidence that more factors may cause simulator sickness than just a visual-vestibular conflict situation (anxiety, nauseating odours, etc.). Supported by the European Union (QLK6-CT-2002-00151: EUROKINESIS). 280
Transcript of Objective Measurement of Simulator Sickness and …€¦ · Objective Measurement of Simulator...

Objective Measurement of Simulator Sickness and the Role of Visual-Vestibular
Conflict Situations
R.J.V. Bertin(1), C. Collet(2), S. Espié(3), W. Graf(1)
(1) Lab. Physiologie de la Perception et de l’Action, CNRS-Collège de France, 11 Place Marcelin Berthelot, 75005 Paris, France;
(2) UFR STAPS, Université Lyon 1, 69622 Villeurbanne, France;
(3) URE Modélisations, Simulations et Simulateurs de Conduite, INRETS, 94114 Arcueil, France.
Abstract
Driving simulators are becoming more and more important: for research and development purposes, but also for education, training and even for recreation. We have conducted a series of studies on a problem that often occurs with driving simulators: simulator sickness. This phenomenon closely resembles the classically experienced motion sickness and can make a user abort a simulator run within minutes. We present an experiment in which we studied the psychophysical reactions of subjects and recorded their neurovegetative activity, to improve understanding of the underlying causes of simulator sickness. The ultimate goal is to develop an objective measure for monitoring simulator users, so that sickness can be detected before it is perceived by the subject. We used a fixed-base simulator, mimicking an urban circuit with many sharp turns and traffic lights. Subjects were asked to indicate continuously their discomfort on a visual-analog scale. We studied 33 normal volunteers (19 became sick). Sickness correlated strongly with anxiety. The subjective discomfort readings correlated well with simultaneous neurovegetative data (especially skin resistance and temperature) and with a symptom scoring test administered after the experiment. There was no clear indication of an age or gender effect. We also present some evidence that more factors may cause simulator sickness than just a visual-vestibular conflict situation (anxiety, nauseating odours, etc.). Supported by the European Union (QLK6-CT-2002-00151: EUROKINESIS).
280

DSC 2005 North America - Orlando - November 2005
Introduction
Driving simulators are increasingly used for research and development purposes as it is generally safer to evaluate new design or control principles in a simulated/virtual situa-tion than in real life. The fact that drivers can experience various and even extreme road conditions in a realistic but risk-free setting also makes these simulators appealing tools for educational and training purposes. A problem that occurs frequently, and with all driving simulators, is simulator sickness (see Wertheim, 1999, for a review addressing most aspects). This phenomenon closely resembles the motion sickness classically experienced in for instance cars or boats. It can make a user quit a simulator run within minutes, and it can even cause discomfort for up to several days (Ungs, 1989). Estimates of simulator sickness incidence vary widely. One industry source cited 5%-30%, with 30% the acceptable upper limit. Kennedy reports 88% in one study (2001). In practice, and depending on the simulator, the simulated envi-ronment, the driving task and the driver population, simulator sickness can probably oc-cur from almost never (<5% of the subjects) to almost always (>95%). This is not only a considerable nuisance to the subjects, it is also likely to interfere with the intended goal for which the simulator is used: incomplete training in educational applications, incom-plete or invalid data in research applications, etc. It is therefore common practice to prevent simulator sickness from occurring. Consider-able effort has been spent to design questionnaires which predict simulator sickness sus-ceptibility in individuals, which allows to filter participants "at the door" (Kennedy et al., 1992; Wertheim, 1999 for an overview of the various tests, or Kennedy, 2001). Such tests, and the fact that habituation occurs (Kennedy et al., 1987; Sharma & Aparna, 1997) allow one to compile populations of test pilots. This solution is often used but it is evi-dent that such an approach is not viable for general public training purposes, or for re-search purposes. If driving simulators are to be useful in these contexts, almost every-body should be able to use them without negative side-effects, including novices. Also, one does not want to bias (in a largely unknown way!) a population sample in research applications by filtering on a side-effect of the sensory information that is an inextricable component of the research protocol. A reliable method to monitor drivers' state of dis-comfort in real time and without interference with the "simulator task" would be a valu-able tool to help prevent sickness and, where relevant, could also help drivers to adapt quicker to simulator use (e.g. in training situations). We stress the real time and the no interference aspects: good and validated means of assessing simulator sickness exist, most notably Kennedy's SSQ (1993), but they are questionnaires which hardly respond to the aforementioned requirements. It is commonly accepted that classical motion sickness is caused by inter-sensory con-flict: persons who have lost vestibular function are seldom, if ever, sensitive to motion sickness (Wertheim, 1999; Collet et al., 2000). It is probably assumed that simulator sickness too is caused by inter-sensory (visual-vestibular) conflict. To our knowledge, this has never been demonstrated clearly, by showing a lack of susceptibility in vestibu-lar-loss patients.
281

DSC 2005 North America - Orlando - November 2005
Classical motion sickness is accompanied by a stress response that can be measured through activity of the autonomic nervous system (ANS). For a review, see Money et al., 1996. To our knowledge, ANS activity related to simulator sickness has not yet been studied. If a stress response also occurs during simulator sickness, then it is reasonable to expect that it might be detectable from typical chances in ANS activity, and maybe even before the sickness becomes incapacitating. Stress can be detected quite reliably from easily recordable parameters of ANS activity, which make good candidates for an on-line monitoring system of subjects' well/ill-being. In this study, we attempt to quantify simulator sickness in a large, representative (age, gender) population, and to understand better the mechanisms causing it. Our ultimate goal is to develop a method for 'on line' monitoring and prediction of oncoming sickness before it becomes incapacitating. We describe here a first step towards this goal, correlat-ing subjective (psychophysical) ill-being indications provided by the subject with simul-taneously recorded autonomic nervous system (ANS) activity and anxiety estimates. We also present a tentative first answer to the question if simulator sickness is (largely) caused by visual-vestibular conflict by comparing sickness incidence in vestibular loss patients with the incidence in healthy controls.
Methods
In order to provoke simulator sickness, we selected an urban environment for the main driving task. It contained a multitude of sharp turns (90° or more) and many traffic lights, requiring drivers to stop and restart often. We also used large field of view (150°, three screens) in order to maximise optokinetic stimulation. Subjects. We present data from a total of three experimental sessions, performed in September and December 2003 and in April 2005. A total of 51 healthy volunteers participated, 28 males (session sep2003: 16; dec2003: 7; apr2005: 5) aged 24-65y and 23 females (sep2003: 7; dec2003: 3; apr2005: 13) aged 23-66y. To date, we have been able to recruit 6 vestibular loss patients, 4 males (29-71y) and 2 females (25 and 29y). Patients were well adapted to their handicap, and led reasonably active and normal lives. All participants had normal or corrected-to-normal vision, had an active, healthy lifestyle, did not take medication that could have affected the results, and were at least reasonably experienced drivers. Experimental set-up. We used the fixed-base driving simulator (SIM2 class) available at the Institut National de Recherche sur les Transports et leur Securité (INRETS) in Arcueil near Paris (Espié, 1999: see figure 1). This simulator provides a frontal field of view of around 150° (three screens) and contains a real car with most controls operative. Linear acceleration is simu-lated by tilting of the virtual observer (up/down movement in the projected image). There is power steering with force-feedback on the wheel. The visual was generated by an SGI Onyx II in the first sessions (30Hz refresh) and by three PCs running Linux in the third session (identical software). To provide comparable visual stimulation using the PCs, re-fresh frequency was limited to 25Hz (projected at 75Hz) and computational load was in-creased to simulate a slower CPU. Transport delays (the time between a driver command and the corresponding change in the projected image) were comparable in both systems,
282

DSC 2005 North America - Orlando - November 2005
since they were limited by the imaging refresh frequency. Driving data (speed and steer-ing commands) were recorded at 30Hz or 25Hz. Physiological data were recorded using commercially available sensors connected to a recording system developed at the Université Claude Bernard Lyon (Dittmar et al., 1995). We recorded the following parameters of ANS activity. The skin potential (SP), measured with three electrodes on the left fore-arm. SP is thought to be a result of local differences in ionic concentrations, neuro-transmitters and correlates with cutaneous blood flow. The skin resistance (SR) was measured with 2 electrodes, one of the left in-dex finger and one on the left middle finger. SR depends on local transpiration and thus reflects the activity of sweat glands. The skin temperature (ST) was measured using a sensor placed on palm of the left hand. ST is a function of cutaneous blood flow. We also recorded the instantaneous heart rate (HR) with electrodes placed on the chest. The three cutaneous parameters are all under sympathetic control, meaning that there is increased activation with increasing stress. As a result, skin potential increases. Skin resistance, on the contrary, decreases (corresponding to increased cold sweating). Skin temperature also decreases (corresponding to decreased skin blood flow: pallor). Heart rate is controlled by both the sympathetic and the parasympathetic branches of the ANS, which have oppo-site effects. Increased stress (sympathetic activation) would tend to increase heart rate (and decrease its variability), whereas increased parasympathetic activation would tend to decrease it (and increase the variability). Data were recorded at 10Hz. The main psychophysical variable recorded was a subjective estimate of discomfort, the sickness score, indicated on visual analog scale displayed continuously in the far low frontal visual field. Subjects indicated their condition on line with a cursor on 10 stops between "all is fine" and "I'm about to vomit". Such a measure has been shown to corre-late well with more detailed questionnaires such as Kennedy's (1993) SSQ (Wertheim, 1999) but hardly interferes with the driving task. The sickness cursor was controlled by command levers on the steering column; it was recorded together with the driving data. In addition, motion sickness susceptibility was assessed with a Motion Sickness Ques-tionnaire (MSQ) quantifying the incidence and severity of various forms of motion sick-ness over the last 5 years, taken during the initial interviews. State anxiety was assessed three times during the session using Spielberger's STAI; the trait test assessing base level anxiety was taken immediately after the MSQ. Finally, a symptom severity questionnaire (SENSICK; 22 items on a 0-4 scale) was administered immediately after the experimen-tal session. All tests were French language versions that had been validated. Experimental procedure. An experimental session started with the aforementioned MSQ and STAI questionnaires and a brief medical examination to evaluate vestibular and oculomotor function: see fig-ure 2. The driving session was divided into three parts. An initial period (5-10min.) of rural highway driving allowed subjects to familiarise with the simulator, and allowed us to obtain reference physiological activity levels. To minimise the likelihood of simulator sickness developing, this part was done using only the central screen, in an environment requiring very little turning and speed changes. After this, the subject took the first of the STAI state anxiety tests, and received instructions for the next driving sequence. This se-quence consisted of two session parts (R1, R2) of approximately 15 minutes of explor-
283
DSC 2005 North America - Orlando - November 2005
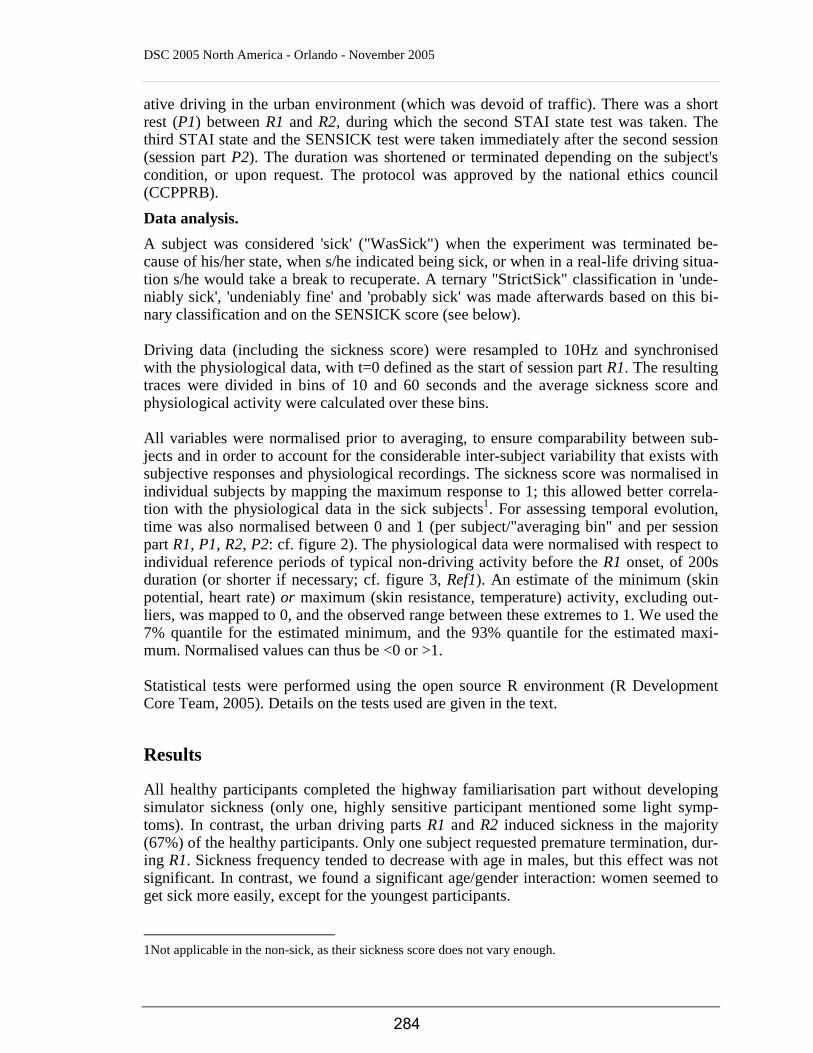
ative driving in the urban environment (which was devoid of traffic). There was a short rest (P1) between R1 and R2, during which the second STAI state test was taken. The third STAI state and the SENSICK test were taken immediately after the second session (session part P2). The duration was shortened or terminated depending on the subject's condition, or upon request. The protocol was approved by the national ethics council (CCPPRB). Data analysis. A subject was considered 'sick' ("WasSick") when the experiment was terminated be-cause of his/her state, when s/he indicated being sick, or when in a real-life driving situa-tion s/he would take a break to recuperate. A ternary "StrictSick" classification in 'unde-niably sick', 'undeniably fine' and 'probably sick' was made afterwards based on this bi-nary classification and on the SENSICK score (see below). Driving data (including the sickness score) were resampled to 10Hz and synchronised with the physiological data, with t=0 defined as the start of session part R1. The resulting traces were divided in bins of 10 and 60 seconds and the average sickness score and physiological activity were calculated over these bins. All variables were normalised prior to averaging, to ensure comparability between sub-jects and in order to account for the considerable inter-subject variability that exists with subjective responses and physiological recordings. The sickness score was normalised in individual subjects by mapping the maximum response to 1; this allowed better correla-tion with the physiological data in the sick subjects1. For assessing temporal evolution, time was also normalised between 0 and 1 (per subject/"averaging bin" and per session part R1, P1, R2, P2: cf. figure 2). The physiological data were normalised with respect to individual reference periods of typical non-driving activity before the R1 onset, of 200s duration (or shorter if necessary; cf. figure 3, Ref1). An estimate of the minimum (skin potential, heart rate) or maximum (skin resistance, temperature) activity, excluding out-liers, was mapped to 0, and the observed range between these extremes to 1. We used the 7% quantile for the estimated minimum, and the 93% quantile for the estimated maxi-mum. Normalised values can thus be <0 or >1. Statistical tests were performed using the open source R environment (R Development Core Team, 2005). Details on the tests used are given in the text.
Results
All healthy participants completed the highway familiarisation part without developing simulator sickness (only one, highly sensitive participant mentioned some light symp-toms). In contrast, the urban driving parts R1 and R2 induced sickness in the majority (67%) of the healthy participants. Only one subject requested premature termination, dur-ing R1. Sickness frequency tended to decrease with age in males, but this effect was not significant. In contrast, we found a significant age/gender interaction: women seemed to get sick more easily, except for the youngest participants.
1Not applicable in the non-sick, as their sickness score does not vary enough.
284

DSC 2005 North America - Orlando - November 2005
The reported sickness score increased in time, and significantly more so in the sick sub-jects than in the non-sick, even after normalisation (two-way ANOVA on the normalised sickness score, R1+R2; time*WasSick interaction F(5,223)=7.206 p<<0.001). Figure 4 shows the average normalised sickness score for the sick subjects, for session parts R1, P1, R2 and P2, for each of the three sessions. Notice how the score increased during driv-ing, and decreased again at standstill (P1, P2). The average normalised sickness score over these four session parts is significantly different at approximately 0.16 in the non-sick, and 0.48 in the sick (t test; t=-20.0 df=1250.7 p ≈ 0). Psychophysiological results Scores on the SENSICK test ranged from 0 to 52 (of 88 maximum), with a minimum score of 8 in the subjects who where classified sick immediately after the experimental session. We defined our more objective StrictSick criterion based on these observations. Sick subjects with a score superior to 12 were considered "undeniably sick", whereas non-sick subjects with a score inferior to 7 were considered "undeniably fine". All the others were classified as "probably sick". As expected, the score on the MSQ was higher in the sick than in the non-sick subjects (ANOVA, F(1,47)=11.517 p≈0.001). It is however not a very good predictor of absence of simulator sickness. We expressed the anxiety increase as a contrast ( (STAI3-STAI1) / (STAI3 + STAI1) ; a fairly standard way of comparing differences corrected for absolute values). This increase was significantly higher in the sick than in the non-sick (ANOVA, F(1,47)=11.37 p<<0.005). STAI anxiety was not an objective predictor of simulator sickness, however, since no differences were found between the sick and the non-sick before the onset of R1. Driving data observations Keeping a straight course is a known problem for novice drivers, especially in a fixed-base simulator. Small course deviations are detected (visually) too late, and over-corrected, leading to an increasing slalom effect which increases optokinetic stimulation and thus may aggravate sickness. We quantified the effect as follows. Voluntary turns were identified from the steering command using an automatic threshold (the mean steer-ing command plus or minus its standard deviation over the full recording), and sup-pressed. We tested for differences in the standard deviation of the resulting signal for all 10s bins where the average driving speed was not zero. We indeed found that sick sub-jects from the sep2003 and the dec2003 sessions slalom more at the onset of the first ur-ban circuit (ANOVA over only those samples from R1 with normalised time <0.1: F(1,29)=9.614 p<<0.005). The difference becomes barely significant when the apr2005 session is included2. There are no differences in average driving speed. Physiological data Significant differences in activation can be found in all four physiological variables we recorded, most clearly in the skin resistance and in the skin temperature. The activations 2When apr2005 is excluded, slaloming is also significantly higher in female than in male drivers. This is
probably a sample effect.
285

DSC 2005 North America - Orlando - November 2005
are typical for orthosympathetic (hyper)activation: increase in skin potential and heart rate, decreasing skin resistance and skin temperature. Figure 3 shows the original simula-tor and physiological data for one subject. Clear reactions to the nauseogenic driving task can be seen in all traces (not all are typical reactions as just described). We used Student's t tests to compare the average normalised values in R1 and R2 in the sick vs. the non-sick, and ANOVA and linear fits (R's robust linear regression, rlm) to check for temporal evo-lution and correlations with the sickness score. We will focus here on the skin resistance and skin temperature, as they show the clearest pattern and are easy to record. Skin resistance (SR) Skin resistance was lower in the sick than in the non-sick subjects (t=3.55 p<0.0005). It remained approximately constant in time in the non-sick, and decreased significantly in time in the sick (ANOVA: F(5,90)=15.08 p<<0.001, significantly negative slope of the linear model for the sick: p<<0.001; time*WasSick interaction: F(5,140)=4.121 p<0.005). The decrease was strongest in R1: the resistance remains low in R2. There is a significant correlation (decrease) of SR with increasing sickness score (ANOVA; R1: F(5,52)=7.81 p<<0.001; R2: F(5,41)=6.73 p<<0.001). Skin temperature (ST) Skin temperature was lower in the sick than in the non-sick subjects (t=9.01 p<<0.001). Temperature remained approximately constant in the non-sick, and decreased in time in the sick (ANOVA, F(5,205)=8.310 p<<0.001; significantly negative slope of the linear model for the sick: p<<0.001; time*WasSick: F(5,205)=2.842 p<0.05). There is significant correlation (decrease) between ST and the sickness score: see figure 5. The temperature decrease is visible even in P1, where the sickness score decreases in time. All effects are significant: ANOVA p<0.01 and highly significantly negative linear model slopes. Patients: the effect of visual-vestibular conflict If simulator sickness is provoked by an inter-sensory, visual-vestibular conflict situation, than vestibular loss patients should be much less sensitive to it, just as they are to classi-cal motion sickness. We tested this hypothesis in a population of 6 patients, 3 males and 3 females (we have physiological data for only half of them). Of these, one became unde-niably sick and terminated the experiment, with a high SENSICK score and a typical anxiety increase. Two others also classified as sick according to our criteria (one "unde-niably sick", one "probably sick"), but did not show the anxiety increase. The sample is too small to make statistically valid statements, and we therefore did not analyse the little physiological data we have (3 patients only). But based on these results, we would have to reject the hypothesis that visual-vestibular conflict in a (driving) simulator is the only (or main) cause of simulator sickness.
Discussion
We studied an undesirable side-effect of driving a driving simulator: simulator sickness. We used a fixed-base simulator, and a simulated urban environment. Such environments correspond to very common driving situations but are also well known to be nauseous
286

DSC 2005 North America - Orlando - November 2005
when used in driving simulators (driving simulator studies focus mainly on non-urban settings, or "straight" urban ones). As expected, the majority of our subjects (60%-78%) developed a more or less severe form of simulator sickness. Fortunately, emesis was pro-voked in only one subject, but a considerable number reported that they had felt affected for a day or more after participating. The simple MSQ history questionnaire predicted quite well if a subject would likely be sick, but unfortunately not if a subject would likely not be sick. It is thus not reliable enough for excluding all susceptible subjects. There is a strong correlation in our data between simulator sickness occurring, and the anxiety increase during the experiment. Anxiety does not appear to be a predictor, however: the initial level is not correlated with sickness. It is interesting to note that the anxiety increase tended to be higher in those with the lower MSQ scores than in those with the higher scores: experience with motion sickness thus seems to reduce its stressfulness. Finally, the subjective sickness score indi-cated by the subjects was a good indicator, even if some subjects tended to underestimate. Our data suggest that the sickness score may increase to 0.2 – 0.3 (normalised, stop 1 or 2) in non-sick subjects, probably indicating general uneasiness due to car con-trol/behaviour issues. In our sick subjects, it reached that value much quicker, remaining at it for a short while, and then started to increase sharply. This happened after just short of 5 minutes on average. One of the questions that we intended to study was the extent to which simulator sickness is caused by a visual-vestibular conflict, as classical motion sickness. If so, vestibular-loss patients should not be sensitive to it, or at least significantly less (cf. Wertheim, 1999). Six patients participated, of whom three became sick. The sample size is too small to make statistically acceptable conclusions, and not all patients may have been equally well adapted to their handicap. But our results, notably the fact that one life-long, well-adapted patient became undeniably sick, strongly suggest that visual-vestibular conflict (lack of inertial information, in our case) is not the main (nor a necessary) cause of simu-lator sickness. During post-experimental interviews, most subjects complained about the hard-to-support optokinetic stimulation during turns, coupled with the steering which was perceived as overly sensitive. There are indications that odours aggravated the situation for a number of subjects (a highway passes next to the simulator's building; a fuel tank is located just outside, warm plastics in the car gave off smells). The ANS activations that we found in reaction to developing simulator sickness are com-parable to those found in a similar study by Min et al. (2004): decrease in skin resistance and temperature, and increase in skin potential and instantaneous heart rate. In contrast to that study, our results are clearer and significant, because we accounted for the consider-able inter-subject variation that exists with this kind of recording. These reaction patterns suggest that simulator sickness is accompanied by a form of orthosympathetic activation. The reactions are easy to detect in the skin resistance and temperature. They are also pre-sent in the other parameters, skin potential and heart rate. However, some processing is necessary to separate the tell-tale increase from long-term drift effects, which can be done only "post-hoc". Also, there are indications that heart rate may not be a reliable measure of motion sickness (Mullen et al., 1998). Therefore, heart rate and skin potential seem less suitable for on-line monitoring of subject (dis)comfort. Motion sickness symptoms, especially nausea, pallor and sweating, are often taken as an indication of vagal malaise
287

DSC 2005 North America - Orlando - November 2005
(a strong parasympathetic reaction): our data indicate that this is likely not the case. Note also that these results are different from those obtained on patients suffering from vertigo induced by inter-sensory conflict due to vestibular dysfunction (Collet et al., 2000). We expected to find some age and/or gender differences in sickness incidence. Longer driving experience may make elderly people more sensitive to simulator imperfections (leading to higher sickness incidence), and altered sensory function may also increase or on the contrary decrease sensitivity. In the male participants, the incidence seems to de-crease with age, whereas in the female population it remains constant (and possibly less in the youngest women). We cannot make any more definite conclusions, as to date there have been relatively few elderly participants (11 of 55 and older). Furthermore, more than half of the elderly and the females subjects participated in the apr2005 session in which the visual had also been changed: we cannot separate age/gender effects from ef-fects caused by the hardware change between this and the other sessions. This question will have to be addressed in a follow-up study. One of our goals in this study was to evaluate if it is possible to monitor participants' state of discomfort on line, using parameters of ANS activity, and especially if sickness can be detected in advance, before it becomes incapacitating. Monitoring the physiological re-cordings during the experimental sessions, it was indeed often possible to see typical ac-tivations before the reported sickness started to increase. The aggregate results support this observation: skin resistance starts decreasing in those who will be sick well before the sickness score starts increasing rapidly (see above). Skin temperature also decreases sharply before that time, but tends to increase in those who will not be sick (signalling relaxation, after a slight initial decrease). Additional analyses in a larger population are required to validate and quantify these preliminary observations. In summary, our study shows once again that simulator sickness is a problem to be reck-oned with. It can affect a majority of (novice) subjects, even if they have no task other than to drive around to explore an urban environment and thus can cope with discomfort as they like. First results obtained from vestibular-loss patients suggest that it may well be not enough to provide sufficiently realistic inertial (vestibular) feedback. It appears to be possible, however, to monitor participants on line, and detect oncoming sickness in time from typical physiological changes that occur before reported sickness starts in-creasing.
References
Collet, C., Vernet-Maury, E., Miniconi, P., Chanel, J., and Dittmar, A. (2000). Autonomic nervous system ac-tivity associated with postural disturbances in patients with perilymphatic fistula: sympathetic or vagal ori-gin. Brain Res Bull 53, 33-43.
Dittmar, A., Rada, H., Delhomme, G., Vernet-Maury, E., Collet, C., Roure, R., Unterreiner, R., Robini, M. and Delemer, C. (1995). A multi-sensor system for the non-invasive measurement of the activity of the auto-nomic nervous system. Sensors and Actuators, 26-27, 461-464.
Espié, S. (1999). Vehicle-driven simulator versus traffic-driven simulator: the INRETS approach. Driving Simulator Conference 99 (DSC'99) proceedings, Paris, France.
Kennedy, R.S., Berbaum, K.S., Williams, M.C., Brannan, J. and Welch, R.B. (1987). Transfer of perceptual-motor training and the space adaptation syndrome. Aviat Space Environ Med 58(9 Pt 2), A29-33.
288

DSC 2005 North America - Orlando - November 2005
Kennedy, R.S., Fowlkes, J.E., Berbaum, K.S. and Lilienthal, M.G. (1992). Use of a motion sickness history questionnaire for prediction of simulator sickness. Aviat Space Environ Med 63(7): 588-593.
Kennedy, R.S., Lane, N.E., Berbaum, K.S. and Lilienthal, M.G. (1993). Simulator sickness questionnaire: an enhanced method for quantifying simulator sickness. Int J Aviat Psychol 3(3), 203-220.
Kennedy, R.S., Lane, N.E. and Grizzard, M.C. (2001). Use of a motion history questionnaire to predict simula-tor sickness. Driving Simulator Conference 2001 (SC2001) proceedings, Sophia Antipolis, France.
Min, B. C., Chung, S. C., Min, Y. K., and Sakamoto, K. (2004). Psychophysiological evaluation of simulator sickness evoked by a graphic simulator. Appl Ergon 35, 549-556.
Money, K.E., Lackner, J.R. and Cheung, R.S.K. (1996). The autonomic nervous system and motion sickness. In: Vestibular autonomic regulation. B.J. Yates and A.D. Miller. Boca Raton, Florida, CRC Press.
Mullen, T. J., Berger, R. D., Oman, C. M., and Cohen, R. J. (1998). Human heart rate variability relation is unchanged dur-ing motion sickness. J Vestib Res 8, 95-105.
R Development Core Team (2005). R: A language and environment for statistical computing. R Foundation for Statistical Computing, Vienna, Austria. ISBN 3-900051-07-0, URL http://www.R-project.org
Sharma, K. and Aparna (1997). Prevalence and correlates of susceptibility to motion sickness. Acta Genet Med Gemellol (Roma) 46(2), 105-121.
Ungs, T.J. (1989). Simulator induced syndrome: evidence for long-term aftereffects. Aviat Space Environ Med 60(3): 252-255.
Wertheim, A.H. (1999).The assessment of aftereffects of real and simulated self motion: motion sickness and other symptoms. TNO-report TM-99-A074.
Acknowledgements
Supported by the European Union (QLK6-CT-2002-00151: EUROKINESIS).
289
DSC 2005 North America - Orlando - November 2005
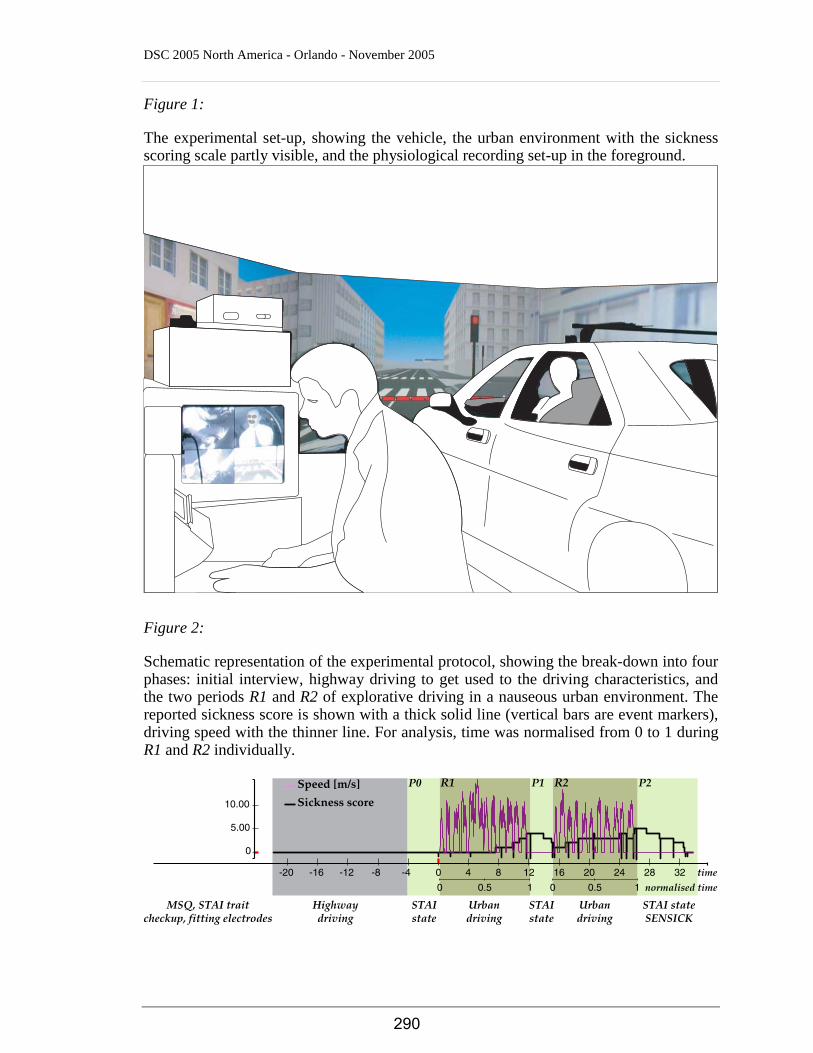
Figure 1:
The experimental set-up, showing the vehicle, the urban environment with the sickness scoring scale partly visible, and the physiological recording set-up in the foreground.
Figure 2:
Schematic representation of the experimental protocol, showing the break-down into four phases: initial interview, highway driving to get used to the driving characteristics, and the two periods R1 and R2 of explorative driving in a nauseous urban environment. The reported sickness score is shown with a thick solid line (vertical bars are event markers), driving speed with the thinner line. For analysis, time was normalised from 0 to 1 during R1 and R2 individually.
0
5.00
10.00
-20 -16 -12 -8 -4 0 4 8 12 16 20 24 28 32 time
P0
Highwaydriving
MSQ, STAI traitcheckup, fitting electrodes
STAIstate
STAIstate
STAI stateSENSICK
Urbandriving
Urbandriving
P1 P2
0 0.5 1 10 0.5 normalised time
290

DSC 2005 North America - Orlando - November 2005
Figure 3:
Example of the combined driving, sickness and physiological data for one subject, show-ing the reported sickness score and driving speed as in figure 2, the skin potential, skin resistance, skin temperature and instantaneous heart rate. Reactions to driving (and being at rest between driving sessions) can clearly be seen.
0
5.00
10.00
-20 -16 -12 -8 -4 0 4 8 12 16 20 24 28 32
-20 -16 -12 -8 -4 0 4 8 12 16 20 24 28 32
-20 -16 -12 -8 -4 0 4 8 12 16 20 24 28 32
-20 -16 -12 -8 -4 0 4 8 12 16 20 24 28 32
-20 -16 -12 -8 -4 0 4 8 12 16 20 24 28 32
-10.00
-5.00
0
12.00
14.00
16.00
18.00
30.50
31.00
31.50
50.0060.0070.0080.0090.00
Ref
1
Ref
2
291

DSC 2005 North America - Orlando - November 2005
Figure 4:
Overview of the temporal evolution of the reported sickness score per session and per session part, in the sick subjects. As expected, sickness increases while driving, and de-creases while at rest. Box-and-whisker displays show the distribution median (solid dots), quartiles (bars), flanks (whiskers) and outliers (open dots); the thick solid red line indi-cates the mean and the thin solid red line a loess (piecewise linear) fit to the individual data.
Normalised Sickness score
normalised time
0.0
0.2
0.4
0.6
0.8
1.0
0.0
0.2
0.2 0.4 0.6 0.8 10 0.2 0.4 0.6 0.8 10 0.2 0.4 0.6 0.8 10 0.2 0.4 0.6 0.8 10
0.4
0.6
0.8
1.0
0.0
0.2
0.4
0.6
0.8
1.0
SessionPart: R1Session: sep2003
SessionPart: P1Session: sep2003
SessionPart: R2Session: sep2003
SessionPart: P2Session: sep2003
SessionPart: R1Session: dec2003
SessionPart: P1Session: dec2003
SessionPart: R2Session: dec2003
SessionPart: P2Session: dec2003
SessionPart: R1Session: apr2005
SessionPart: P1Session: apr2005
SessionPart: R2Session: apr2005
SessionPart: P2Session: apr2005
292

DSC 2005 North America - Orlando - November 2005
Figure 5:
Average normalised skin temperature in the sick subjects as a function of the reported sickness, during driving parts R1 and R2 and the rest period P1 between them. There is a clear negative correlation in all cases, indicating orthosympathetic hyper-activation. Box-and-whisker display as in figure 4. The straight blue solid line indicates the robust linear fit to the individual data, the dashed lines the 95% confidence interval of that fit.
−5
0
rlm: −0.824 x + −1.57 (p≈0)
SessionPart: R1
rlm: −1.23 x + −0.087 (p≈0)
SessionPart: P1
rlm: −1.16 x + −0.834 (p≈0)
SessionPart: R2
0.8 10.60.40.20 0.8 10.60.40.20 0.8 10.60.40.20
Skin temperature (mean, normalised)
normalised Sickness score
293