
Objective Indicators of the Life Cycle Evolution of ...
17
MAY 2003 909 EVANS AND HART q 2003 American Meteorological Society Objective Indicators of the Life Cycle Evolution of Extratropical Transition for Atlantic Tropical Cyclones JENNI L. EVANS AND ROBERT E. HART Department of Meteorology, The Pennsylvania State University, University Park, Pennsylvania (Manuscript received 28 August 2001, in final form 14 June 2002) ABSTRACT Forty-six percent of Atlantic tropical storms undergo a process of extratropical transition (ET) in which the storm evolves from a tropical cyclone to a baroclinic system. In this paper, the structural evolution of a base set of 61 Atlantic tropical cyclones that underwent extratropical transition between 1979 and 1993 is examined. Objective indicators for the onset and completion of transition are empirically determined using National Hur- ricane Center (NHC) best-track data, ECMWF 1.12583 1.1258 reanalyses, and operational NCEP Aviation Model (AVN) and U.S. Navy Operational Global Atmospheric Prediction System (NOGAPS) numerical analyses. An independent set of storms from 1998 to 2001 are used to provide a preliminary evaluation of the proposed onset and completion diagnostics. Extratropical transition onset is declared when the storm becomes consistently asymmetric, as measured by the 900–600-hPa thickness asymmetry centered on the storm track. Completion of the ET process is identified using a measure of the thermal wind over the same layer. These diagnostics are consistent with the definitions of tropical and baroclinic cyclones and are readily calculable using operational analyses. Comparisons of these objective measures of ET timing with more detailed three-dimensional analyses and NHC classifications show good agreement. 1. Introduction No universally accepted definition of extratropical transition of tropical cyclones [(ET)] presently exists (Malmquist 1999) yet, on average, 46% of Atlantic trop- ical storms (Hart and Evans 2001), 27% of western North Pacific storms (Klein et al. 2000), and 10% of storms in western Australian waters (Foley and Han- strum 1994) undergo ET. Forecasters must rely on sub- jective assessments of asymmetry of the storm’s cloud shield and its passage over colder water to discern the onset and completion of transition, yet weakening or recurving storms may also exhibit these characteristics (L. Avila 1999, personal communication). In this paper, we propose objective diagnostics to mark both the onset and completion of ET and evaluate these using an in- dependent group of storms. First, we review the existing literature to provide a perspective on likely fruitful choices for diagnostics of extratropically transitioning storm structure. Tropical storms that undergo ET evolve from systems with compact wind fields and relatively symmetric rain- fall patterns to highly asymmetric systems moving at 10 m s 21 or more, in which the peak wind speeds are Corresponding author address: Prof. Jenni L. Evans, Dept. of Me- teorology, The Pennsylvania State University, 503 Walker Bldg., Uni- versity Park, PA 16802-5013. E-mail: [email protected] usually much reduced, but the area of gale or storm force winds is often vastly increased (e.g., DiMego and Bosart 1982a,b; Foley and Hanstrum 1994; Harr and Elsberry 2000; Hart and Evans 2002, manuscript sub- mitted to Mon. Wea. Rev., hereafter HAE; Klein et al. 2000; Sekioka 1956a,b; Thorncroft and Jones 2000). The damaging winds and rains in an extratropically tran- sitioned storm are typically on opposite sides of the storms and a heavy rain belt extends over vast regions (e.g., Atallah 2001; Bosart et al. 2001). Additionally, extreme ocean waves generated by ET systems in the North Atlantic provide challenges for Canadian mari- time forecasts (Bowyer 2000; MacAfee and Bowyer 2000a,b). In summary, a storm undergoing ET will exhibit an increasingly asymmetric thermal field in response to its interaction with the baroclinic midlatitude environment and will develop a cold-core structure, traceable through its thermal wind profile. Consequences of these structure changes include intense rainfall and extreme ocean waves, but the storm structure changes described sug- gest straightforward ET diagnostics based on height/ thickness fields. After a brief discussion in section 2 of the data used, expected storm structure changes are re- viewed in section 3. The new ET onset/completion di- agnostics will be presented and examined in section 4 using a sample of 61 Atlantic storms (1979–93). An independent assessment of these diagnostics is provided
Transcript of Objective Indicators of the Life Cycle Evolution of ...

MAY 2003 909E V A N S A N D H A R T
q 2003 American Meteorological Society
Objective Indicators of the Life Cycle Evolution of Extratropical Transition forAtlantic Tropical Cyclones
JENNI L. EVANS AND ROBERT E. HART
Department of Meteorology, The Pennsylvania State University, University Park, Pennsylvania
(Manuscript received 28 August 2001, in final form 14 June 2002)
ABSTRACT
Forty-six percent of Atlantic tropical storms undergo a process of extratropical transition (ET) in which thestorm evolves from a tropical cyclone to a baroclinic system. In this paper, the structural evolution of a baseset of 61 Atlantic tropical cyclones that underwent extratropical transition between 1979 and 1993 is examined.Objective indicators for the onset and completion of transition are empirically determined using National Hur-ricane Center (NHC) best-track data, ECMWF 1.1258 3 1.1258 reanalyses, and operational NCEP AviationModel (AVN) and U.S. Navy Operational Global Atmospheric Prediction System (NOGAPS) numerical analyses.An independent set of storms from 1998 to 2001 are used to provide a preliminary evaluation of the proposedonset and completion diagnostics.
Extratropical transition onset is declared when the storm becomes consistently asymmetric, as measured bythe 900–600-hPa thickness asymmetry centered on the storm track. Completion of the ET process is identifiedusing a measure of the thermal wind over the same layer. These diagnostics are consistent with the definitionsof tropical and baroclinic cyclones and are readily calculable using operational analyses. Comparisons of theseobjective measures of ET timing with more detailed three-dimensional analyses and NHC classifications showgood agreement.
1. Introduction
No universally accepted definition of extratropicaltransition of tropical cyclones [(ET)] presently exists(Malmquist 1999) yet, on average, 46% of Atlantic trop-ical storms (Hart and Evans 2001), 27% of westernNorth Pacific storms (Klein et al. 2000), and 10% ofstorms in western Australian waters (Foley and Han-strum 1994) undergo ET. Forecasters must rely on sub-jective assessments of asymmetry of the storm’s cloudshield and its passage over colder water to discern theonset and completion of transition, yet weakening orrecurving storms may also exhibit these characteristics(L. Avila 1999, personal communication). In this paper,we propose objective diagnostics to mark both the onsetand completion of ET and evaluate these using an in-dependent group of storms. First, we review the existingliterature to provide a perspective on likely fruitfulchoices for diagnostics of extratropically transitioningstorm structure.
Tropical storms that undergo ET evolve from systemswith compact wind fields and relatively symmetric rain-fall patterns to highly asymmetric systems moving at10 m s21 or more, in which the peak wind speeds are
Corresponding author address: Prof. Jenni L. Evans, Dept. of Me-teorology, The Pennsylvania State University, 503 Walker Bldg., Uni-versity Park, PA 16802-5013.E-mail: [email protected]
usually much reduced, but the area of gale or stormforce winds is often vastly increased (e.g., DiMego andBosart 1982a,b; Foley and Hanstrum 1994; Harr andElsberry 2000; Hart and Evans 2002, manuscript sub-mitted to Mon. Wea. Rev., hereafter HAE; Klein et al.2000; Sekioka 1956a,b; Thorncroft and Jones 2000).The damaging winds and rains in an extratropically tran-sitioned storm are typically on opposite sides of thestorms and a heavy rain belt extends over vast regions(e.g., Atallah 2001; Bosart et al. 2001). Additionally,extreme ocean waves generated by ET systems in theNorth Atlantic provide challenges for Canadian mari-time forecasts (Bowyer 2000; MacAfee and Bowyer2000a,b).
In summary, a storm undergoing ET will exhibit anincreasingly asymmetric thermal field in response to itsinteraction with the baroclinic midlatitude environmentand will develop a cold-core structure, traceable throughits thermal wind profile. Consequences of these structurechanges include intense rainfall and extreme oceanwaves, but the storm structure changes described sug-gest straightforward ET diagnostics based on height/thickness fields. After a brief discussion in section 2 ofthe data used, expected storm structure changes are re-viewed in section 3. The new ET onset/completion di-agnostics will be presented and examined in section 4using a sample of 61 Atlantic storms (1979–93). Anindependent assessment of these diagnostics is provided

910 VOLUME 131M O N T H L Y W E A T H E R R E V I E W
FIG. 1. Tracks of all extratropically transitioning Atlantic tropical storms from the 1990s. Thelocation of transition for each storm, as determined by NHC, is marked with a dot. Note the widerange of latitudes over which ET can occur.
in section 5, where they are tested for several ET casesfrom the 1998–2001 Atlantic hurricane seasons. Finally,a summary and evaluation of these diagnostics as fore-cast tools is given in section 6.
2. Data sources and analysis techniques
Sixty-one Atlantic tropical cyclones from the 15-yrperiod 1979–93 form the dependent dataset for thisstudy; all of these storms had been declared by the Na-tional Hurricane Center (NHC) to have undergone ET.Position, intensity, and cyclone stage for these storms,as well as for an independent dataset from the 1998–2001 seasons are obtained from the NHC best-trackdata.
Figure 1 is a map of the tracks of transitioning At-lantic storms from the 1990s, illustrating the recurvingnature of the storm tracks and the wide range of latitudesover which ET occurs.
a. Global datasets (reanalyses and operational)
The European Centre for Medium-Range WeatherForecasts (ECMWF) reanalysis dataset (Gibson et al.1997) provides numerically consistent analyses of thestorms and their environment, free of synthetic (‘‘bo-gused’’) tropical cyclone vortices. The high-resolutionanalyses used here span the 15-yr period of interest(1979–93) and have 1.1258 3 1.1258 resolution on 31vertical levels. This resolution is sufficient to capture
the broadscale storm evolution during ET [Hart andEvans (2001), hereafter HE2001]; we used only the 2.58for HE2001] and for analyses of tropical cyclones (Mol-inari and Vollaro 1989, 1990). Basin-scale analyses ofsurface pressure, winds, vorticity, potential vorticity(PV), equivalent potential temperature (uE), and otherfields provide a fundamental description of the evolvingstorm structure and environment. Reynolds’ weekly av-eraged sea surface temperature (SST) fields (Reynoldsand Smith 1995) provide 1.08 3 1.08 real-time spatialdistributions of Atlantic SST for each storm.
Analyses of the independent set of storms from the1998–2001 seasons were performed using 18 3 18 anal-yses from both the National Centers for EnvironmentalPrediction (NCEP) Aviation Model (AVN; Kanamitsu1989) and the U.S. Navy Operational Global Atmo-spheric Prediction System (NOGAPS; Hogan and Ros-mond 1991) operational global models. Hence the op-erational analyses available for this study have com-parable resolution to the ECMWF reanalyses.
b. Definitions used in this paper
The NHC definition of a ‘‘transitioning tropical cy-clone,’’ or simply ET, refers to a storm that transitionsfrom tropical to extratropical at some point in its life-time: prior to the NHC transition point, the storm is inits tropical phase (TC), after the storm becomes moreasymmetric (based on the satellite signature) NHC de-clares transition and the storm is in its extratropical

MAY 2003 911E V A N S A N D H A R T
←
FIG. 2. Hurricane Floyd (1999) GOES-8 infrared satellite imagery:(a) 0015 UTC 14 Sep (b) 1225 UTC 16 Sep, (c) 1225 UTC 17 Sep,and (d) 0015 UTC 19 Sep.
phase (ET). In this study, the onset of extratropical tran-sition is defined when the storm asymmetry increasesabove an empirically determined threshold; completionof extratropical transition is defined based on the ther-mal wind.
3. Storm structural changes expected during ET
The seasonal and synoptic contexts for North AtlanticET are briefly summarized here and contrasted with thesituations in other basins. The evolution of the stormstructure through ET described here provides inspirationfor the objective ET onset and completion diagnosticsproposed in section 4.
a. Seasonality and typical synoptic setup
Atlantic tropical storms that undergo extratropicaltransition occur predominantly in the months August–October. At least two-thirds of transitioning storms formeast of the Caribbean Islands, many as far as the CapeVerde Islands, and recurve ahead of a midlatitude troughinto the westerlies (HE2001). Storms forming in theGulf of Mexico cross the southeast United States,emerging over the Gulf Stream to be swept up into thewesterlies (HE2001). Horizontal and vertical windshears experienced by the storm in the midlatitude bar-oclinic zone are strong compared to the tropical envi-ronment. Midlatitude SSTs are significantly cooler than268C, although many ET storms track along the edgeof the North Atlantic current until after ET is completed,remaining over relatively warm SST for the typical ETlatitudes north of 458–508N in the North Atlantic. Thelongest-lived storms prior to recurvature (in their ‘‘trop-ical phase’’) are the most likely to survive recurvature,transitioning and even reintensifying at high latitudes(HE2001). The case of Hurricane Floyd (1999) at thetime it was declared ET by NHC (Pasch et al. 1999) ispresented in Fig. 2 (see also section 5a). A significanttrough is upstream of the major hurricane (Figs. 2a and3a), which will eventually introduce a thermal gradientacross a cyclone that is initially devoid of significanthorizontal thermal gradients. This sudden increase inthermal gradient across the tropical cyclone (and theassociated wind shear) is often the first sign of the lossof tropical characteristics and the start of extratropicaltransition. This is further supported by the wind asym-metries documented in such transitioning systems (e.g.,DiMego and Bosart 1982a,b; Thorncroft and Jones2000).

912 VOLUME 131M O N T H L Y W E A T H E R R E V I E W
FIG. 3. Hurricane Floyd (1999): 325-K isentropic PV (shaded at 1, 2, and 3 PVU) and 1000–5000-hPa thickness(contoured every 30 m) at (a) 0000 UTC 14 Sep, (b) 1200 UTC 16 Sep, (c) 1200 UTC 17 Sep, and (d) 0000 UTC19 Sep. Analyses are from NOGAPS 18 3 18 initialization fields.
b. Storm system evolution
A tropical cyclone is defined as a nonfrontal, warm-cored cyclone with origins in the Tropics (Elsberry1995). Such a definition implies a relatively symmetricsteady-state tropical cyclone in gradient wind balance.As a storm proceeds out of the Tropics, its changingenvironment induces major structural changes in thestorm. The low-level shear and strong convergence as-sociated with a tropical cyclone advancing into the mid-latitudes concentrates the lower-tropospheric tempera-ture gradients locally, leading to a sharp contrast be-tween the warm, tropical air mass and the cooler, mid-latitude air. This sharpening contrast between meanwarm and cool background environments may lead toeither the destruction or extratropical transition of thetropical cyclone moving into the region. Snapshots ofthe synoptic situation of the transitioning HurricaneFloyd (1999) at ET onset and completion are plotted inFig. 3: in Fig. 3b a midlatitude trough (PV $ 1 PVU5 1026 m2 K s21 kg21) is evident approaching the sym-metric Floyd; the transitioned storm in Fig. 3c is largerand more asymmetric than its tropical seed. These sys-tem changes are briefly reviewed here.
1) ONSET
As a storm commences ET (i.e., begins to take onnontropical characteristics) it becomes decreasinglysymmetric. Analyses of the set of 61 Atlantic stormsused here reveal that this decrease in symmetry resultsfrom the low-level frontogenesis described above. Thisis in agreement with the diagnostics of Harr and Els-berry (2000) and Klein et al. (2000) who describe low-level frontogenesis as an indicator of ET for westernNorth Pacific systems; Foley and Hanstrum (1994) alsodescribe interaction with a midlatitude trough and sub-sequent frontogenesis as key stages in the evolution ofthe western Australian ET cases they document. Thisincreasing asymmetry is key in detecting the onset oftransition, but is not unique to transitioning systems, sofurther evidence of the progression of ET is necessarybefore the storm is classified as ‘‘transitioned.’’ Manytropical cyclones may start extratropical transition, butnever complete the process into a fully cold-core cy-clone.
2) EVOLUTION AND ET COMPLETION
After the lower-tropospheric wind and thermal fieldasymmetries become evident in the storm, the system

MAY 2003 913E V A N S A N D H A R T
must continue to evolve midlatitude storm character-istics, or it will not be considered to have completedET. As such, declaration of the ‘‘time of ET’’ for a givenstorm requires a completion measure as well. In orderfor a tropical storm to complete ET, it must developmidlatitude storm characteristics, in particular the de-velopment of a cold-core thermal wind structure (geo-strophic wind speed increasing with height). This char-acterization of ET completion differs from Klein et al.’s(2000) definition for western North Pacific storms inthat it does not require that the storm reintensify (interms of pressure). While the majority of ET cases inthe Atlantic do reintensify after ET begins (HE2001),in agreement with the traditional approach used NHC,we do not require a storm to reintensify in order toclassify it as having undergone ET. Further, the rapidlyevolving background pressure field (Hart 1999) duringextratropical transition may indicate that a cyclone isintensifying despite the slowly rising minimum MSLP.Thus we rely on fundamental structural change to in-dicate transition, not necessarily intensity change.
4. Diagnostics suggested from ET life cycle
Development of an objective definition of extratrop-ical transition has the potential to be a useful forecasttool and to ensure consistency across regions of re-sponsibility. Hence, guided by the storm structural evo-lution outlined in section 3, objective diagnostics forthe characterization of ET onset and completion are pro-posed here and empirically defined threshold values forthese are explained.
a. Defining ET bounds
Transitioning tropical storms, decaying storms, orstorms undergoing transient interactions with other sys-tems may all become asymmetric. Indeed, both transi-tioning and decaying tropical storms will exhibit aweakening warm-core signature; however, a tropicalstorm that has completed ET must, by definition, havestructure akin to a midlatitude storm. Thus, ET com-pletion must be distinguished by an unambiguous char-acteristic of midlatitude storms. From hydrostatic im-plications, changes in the warm-core strength at all lev-els impact the height field in the lower troposphere(Hirschberg and Fritsch 1993). While the warm-corealoft may weaken or disappear, a thermal wind measureof structure will still indicate an overall warm-corestructure in the lower troposphere if the thermal anom-aly in the midtroposphere remains warm core. Thus, byfocusing on the thermal wind in the lower troposphere,we apply a more stringent criterion on transition com-pletion than by focusing on the upper-troposphere ther-mal wind. From a thermal wind perspective, the uppertroposphere usually becomes cold core prior to the lowertroposphere. The lower troposphere is defined here asthe 900–600-hPa layer. Finally, these diagnostics will
be most readily applied to model output and so mustbe amenable to use of gridded data using predefinedatmospheric layers and must be readily calculable.
The practicality of the ET diagnostics proposed belowis demonstrated, first on the dataset of 61 storms fromwhich they were defined and then (in section 5) on anindependent set of storms from the 2000 and 2001 sea-sons.
b. Definition of transition onset
The definition of a tropical cyclone as a nonfrontal,warm-cored cyclone with origins in the Tropics (Elsberry1995) implies a relatively symmetric steady-state vortexin gradient wind balance. Indeed, when the thickness fieldaround a tropical storm is examined, it is found to beclose to circular symmetry even in an evolving system(Fig. 4a; see below). Decreasing symmetry is a key in-dicator that ET may have begun. As the tropical stormapproaches the midlatitude baroclinic zone, low-levelfrontogenesis sets up in response to the increasing SSTgradients and interactions with midlatitude weather fea-tures. For a transitioning Atlantic tropical cyclone mov-ing into the westerlies, cooler environmental air will beto its left (north) and warmer, tropical air will be to itsright (south), and the low-level frontogenesis describedabove can be characterized as a shift to a sustained asym-metry in the thickness field in the region of the storm.Hence, a natural indicator of storm symmetry (for anytropical or extratropical system) is the storm-relativeright minus left asymmetry in the thickness field:
B 5 h[(Z 2 Z ) 2 (Z 2 Z ) ], (1)600 900 R 600 900 L
where the overbar indicates the areal mean over thesemicircle with respect to storm motion and h indicatesthe hemisphere [1 5 Northern Hemisphere (NH), 215 Southern Hemisphere (SH)]. However, a horizontalscale over which to measure this asymmetry must bedetermined.
An appropriate radius for B would be one that in-cludes the convergent circulation of the tropical cyclone,but does not extend into other systems that are not yetinfluencing the tropical cyclone. Accordingly, the radiusfor B was chosen to be consistent with the average radiusover which cyclonic, convergent inflow was observedfor tropical cyclones: 48–68 (Frank 1977a). Inspectionof the PV fields in Fig. 3 reveals that the storm signatureis confined well inside 500-km radius in both tropicaland extratropical phases. Exploration of the completedependent dataset of 61 storms and dozens of midlati-tude systems confirms that the 500-km radius is a rea-sonable horizontal area to use to describe the storm/environment evolution (Hart 2003, hereafter HAR). TheET onset is defined according to
B . 10 m,
where the 10-m threshold is justified below.

914 VOLUME 131M O N T H L Y W E A T H E R R E V I E W
FIG. 4. Scatterplot of storm motion direction (toward) and ET onsetdiagnostic, B, for (a) tropical storms prior to their peak intensity and(b) storms after their peak tropical intensity. Storms moving towardthe north through northeast (i.e., during and after recurvature) havethe highest degree of asymmetry (larger values of B) and variability.
FIG. 5. Distribution of cyclone phase/intensity vs B for (a) tropicalstorms prior to their peak intensity and (b) storms after their peaktropical intensity. The 10-m threshold for distinguishing tropical en-vironments from marginal frontal environments is illustrated well bythe distribution for category 3 and greater hurricanes as compared toother cyclone types and intensities. The x axis represents cyclonephase and intensity: x 5 extratropical, TD 5 tropical depression, TS5 tropical storm, 1–5 Saffir–Simpson hurricane scale. The questionmark indicates that no best-track data were available for the cyclone.
Scatterplots of storm heading (movement toward)versus B (the 900–600-hPa thickness asymmetry) forthe 61-storm dependent sample are presented in Fig. 4for storms (a) prior to peak tropical intensity and (b)after peak tropical intensity, as recorded in the NHCbest tracks. As expected, this measure of storm structureindicates a generally high degree of symmetry with littlevariability for purely tropical storms (Fig. 4a). For per-fect symmetry B 5 0, however, both small-scale tran-sient storm asymmetries, cyclone tracking uncertainties,and data analysis uncertainties require that this thresholdbe relaxed. Comparison of Figs. 4 and 5 provides jus-tification for an empirically determined threshold of B5 10 m to distinguish between purely tropical storms(which rarely exceed this threshold; Fig. 4a, TCs ofcategory 3 and above on the Saffir–Simpson hurricanescale). The few ‘‘tropical phase’’ cases in which B ,210 m (implying a warm poleward and cold equator-ward asymmetry) are weak tropical storms that are like-ly not well resolved by the analyses or where the track-ing was slightly off.
This B . 10 m symmetry diagnostic has proven tobe very robust. This diagnostic failed in only one weak,open-ocean case (Tropical Storm Allison 1989) out of41 cases in 10 yr. A check on the statistical significance
of the differences between the two storm samples rep-resented in Figs. 3a and 3b (Student’s t test) reveals thatthe mean and median B values for the two samples aresignificantly different to 99% confidence for all cyclonephases except category 3–5 hurricanes.
c. Detection of transition completion
An unambiguous and distinguishing characteristics ofa midlatitude storm is its cold-cored structure, so wedefine ET completion as thermal wind corresponding toa cold-cored thermal wind field. The determination ofcold-versus warm-core vertical structure is the distinc-tion of whether the magnitude of the cyclone isobaricheight gradient (ZMAX 2 ZMIN within a 500-km radiusof the surface cyclone center, proportional to the geo-strophic wind magnitude) increases (cold core) or de-creases (warm core) with height (Fig. 6). This funda-mental difference of thermal wind structure betweentropical and extratropical cyclones was exploited to di-

MAY 2003 915E V A N S A N D H A R T
FIG. 6. The warm-to-cold-core evolution during the extratropical transition of Hurricane Floyd(1999). (a) Time–height cross section of ZMAX–ZMIN (m) as interpreted by the 18 3 18 NOGAPSanalyses. Vertical profiles of ZMAX–ZMIN between 600 and 900 hPa at three times are given for (b)tropical phase at 1200 UTC 14 Sep, (c) hybrid phase nearing transition completion at 0000 UTC17 Sep, and (d) extratropical phase at 0000 UTC 19 Sep.
FIG. 7. Comparison of NHC best-track transition times with thetiming of the 2 | | diagnostic of transition completion proposedLVT
here for 38 transitioning cyclones between 1979 and 1993. Althoughthe spread of timing difference extends from 272 to 148 h, themajority of cases (20/38) agree within 66 h.
agnose the cold-versus warm-core cyclone evolutionand, ultimately, ET completion. The thermal wind mea-sure of cyclone structure is thus
600 hPa](Z 2 Z )MAX MIN L5 2V . (2)T)] lnp 900 hPa
A warm-cored system will have 2 . 0, implying aLVT
larger perturbation at 900 hPa compared with 600 hPa,a positive value of the thermal wind, and a strongernear-surface wind (Fig. 6b). Hence, completion of ex-tratropical transition is indicated when first becomesLVT
negative (soon after Fig. 6c).While the sample of 61 storms studied here were all
classified by NHC as having undergone extratropicaltransition, many storms that begin transition decay be-fore becoming a truly extratropical system, so this di-agnostic inevitably shows more variability than the on-set measure, yet it still provides useful guidance andconsistency with NHC best tracks for over 60% of the61 cases tested. This is demonstrated in Fig. 7, in whichthe ET completion times based on this diagnostic arecompared to the ET times declared by NHC; negativevalues indicate that the objective timing leads the NHCdeclaration. There is good agreement (transition timingwithin 66 h) in just over 50% of the cases, with thetimings differing by more than 48 h for only two storms

916 VOLUME 131M O N T H L Y W E A T H E R R E V I E W
FIG. 8. Frequency distribution of extratropical transition periodlength, i.e., the time elapsed after B 5 10 m until 2 | | , 0. ThisLVT
figure represents the 34 of 61 transitioning cyclones available withinthe 1979–93 period of ECMWF reanalyses that had unambiguousdetectable signals in both diagnostics, which allowed calculation ofthe transition period length.
(Fig. 7). The mean time difference for objective dec-laration of transition compared to the NHC best tracksis 28.3 h, indicating that the objective timing is some-what earlier than the NHC.
d. Summary of objective diagnostics for ET onset andcompletion
Based on the diagnostics outlined above, we can ob-jectively define extratropical transition onset and com-pletion as follows:
• onset of extratropical transition is marked by sus-tained thickness asymmetry of .10 m between 900and 600 hPa;
• this transition onset corresponds to low-level fronto-genesis (e.g., Harr and Elsberry 2000);
• transition is completed when vertical storm structurecorresponds to a cold-cored vortex (2 | | , 0 im-LVT
plying positive thermal wind) reflecting maximumwinds aloft;
• by using the geostrophic wind magnitude profile be-tween 900 and 600 hPa over the storm for the com-pletion diagnostic, both extratropical transition timingdiagnostics can be calculated from the height field;and
• the changes in the symmetry and thermal wind shearare measured over a radius of 500 km centered on thestorm, rather than at a point, consistent with the extentof the cyclone vortex system diagnosed by Frank(1977a,b).
Using the lower-tropospheric thickness asymmetryand sign of the wind shear to define onset and comple-tion of transition, the mean length of the transition pe-riod is found to be just under 1.5 days (Fig. 8). A distinctsubset of six cases (of the 61 storms) transitioned overopen ocean in the absence of strong trough interactionand could be tracked through 4 or more days beforecompleting transition (Fig. 8). With these cases re-moved, the mean and median transition times are re-duced to 18.4 and 12 h, respectively.
5. Mapping the transition life cycle
As shown in HAR, the diagnostics above (parametersB and 2 | | ) define a cyclone phase space (exampleLVT
given in Fig. 9). The full life cycle of a cyclone isdefined through the trajectory through the phase dia-gram, with time moving forward as one moves alongthe trajectory, from the labels A–Z. Here, A and Z arenot necessarily the formation and decay locations of thestorm, but represent the start and end of the cyclone lifecycle resolvable within the available dataset and its geo-graphic boundaries. The shading of the markers corre-sponds to the intensity of the cyclone (minimum centralpressure in hPa): the weakest storms (.1010 hPa) arewhite, and solid black are the most intense (,970 hPa).The size of the cyclone (taken as the mean radius of
the 925 hPa gale force wind field area) is representedby the size of the solid circle marker along the phasetrajectory (largest shown in Fig. 9 is approximately 600km). The track of the cyclone is plotted in the inset,with the date marked at the 0000 UTC positions.
a. Graphical summary of storm evolution through ET
The evolution of Hurricane Floyd (1999) from intensetropical cyclone into an extratropical cyclone is shownhere through phase analysis (Fig. 9) as a typical exampleof extratropical transition. The life cycle of Floyd inFig. 9 begins on 9 September, 1 day after tropical cy-clogenesis (Lawrence et al. 2001). Through 15 Septem-ber, Floyd undergoes classic symmetric warm-core de-velopment, and at peak tropical intensity on 15 Septem-ber 1999. Evaluation of the objective ET diagnosticsusing the 18 resolution AVN and NOGAPS analysesaround this time show Floyd with (B ø 0, 2 | | øLVT
1125) (Fig. 9a) and (B ø 0, 2 | | ø 1250) (Fig.LVT
9b), respectively. That is, both operational global mod-els are resolving a symmetric cyclone with a strongwarm-core signature.
A strong trough approaches the landfalling cycloneover North Carolina on 16 September (Figs. 2 and 3),and Floyd begins its evolution to an extratropical cy-clone. This initiation is marked as B first exceeds 10 m,early on 16 September. During 16 September the cy-clone has become a frontal warm-core cyclone (hybrid),having characteristics of both tropical and extratropicalcyclones that are apparent in satellite imagery anima-tions (Fig. 2). At 1200 UTC 17 September, 2 | | firstLVT

MAY 2003 917E V A N S A N D H A R T
FIG. 9. Hurricane Floyd (1999) ET as represented within cyclone phase space: (a) 18 AVN analysesand (b) 18 NOGAPS analyses. The ordinate indicates the storm symmetry (B) while the abscissa is ameasure of the cold-/warm-core structure of the system (rhs of diagram corresponds to 2 | | . 0LVT
for warm core). Time moves forward from A and Z, the start and end of the cyclone life cycle resolvablewithin the available dataset and its geographic boundaries. The size of the cyclone (mean radius ofthe 925-hPa gale force wind region) corresponds to the size of the solid circles along the phase trajectory(largest shown is approximately 600 km). Circle shading corresponds to the intensity of the cyclone,with white for the weakest storms (.1010 hPa) and solid black for the most intense (,970 hPa). Thetrack of the cyclone is plotted in the inset, with the date marked at the 0000 UTC positions.

918 VOLUME 131M O N T H L Y W E A T H E R R E V I E W
becomes negative (Figs. 6 and 9), indicating that Floydhas acquired a cold-core structure, completing extra-tropical transition just prior to landfall in Canada ataround 1600 UTC. This timing is identical to the officialNHC declaration of extratropical transition given in thetropical cyclone best-track dataset (available online athttp://www.nhc.noaa.gov/1999floyd.html). Thereafter,the cyclone intensifies its thermally asymmetric, cold-core structure through 20 September (Fig. 9), ultimatelymerging with another preexisting extratropical cyclonebeyond 20 September (not shown).
Floyd (1999) represents a case where extratropicaltransition occurs relatively quickly, with a hybrid cy-clone phase (frontal warm core; upper-right quadrant inFig. 9) of approximately 24 h, compared to the meantransition period of 33.4 h identified in Fig. 8.
b. Analyses of a sample of storms from the 1998–2001 seasons and Australia
The objective diagnostics of extratropical transitiononset (B . 10) and completion (2 | | , 0) describedLVT
above were developed on a subjective dataset of 61storm cases from the period 1979–93 using the ECMWF1.1258 reanalysis data. To demonstrate the wider appli-cability of these cases, an independent set of 16 Atlantictropical cyclones from 1998 through 2001 is examinedhere using 18 AVN and NOGAPS operational analyses.The NOGAPS analyses include a tropical cyclone bogusin all 4 yr. The AVN included a bogus during 1998–2000, but not in 2001. Diagnosis of the warm-core phaseof Erin (2001) illustrates that, while the presence of acyclone bogus in the numerical model initial conditionsusually produces a stronger warm-core signal, it is notalways the case: the AVN does not include a bogus (Fig.10a), yet the analyses of Erin are stronger in the AVNthan the NOGAPS analyses (Fig. 10b) during the trop-ical phase of Erin (2001).
Four representative trajectories of extratropical tran-sition within the cyclone phase space are shown in Figs.9–12. Hurricanes Floyd (1999; section 5a and Fig. 9)and Erin (2001; Fig. 10) are representative cases of thepath to extratropical transition exhibited by intense trop-ical cyclones: both storms develop a strong warm corebefore the transition process begins, exist as a stronghybrid cyclone for at least a day, and then intensifyslightly after transition completion. However, while thisis arguably the best-documented path to transition, itdoes not apply to the majority of the transition cases.Such a trajectory requires fortuitous timing: the devel-opment of a strong warm core that recurves ahead ofan amplifying trough, the relative trough and tropicalstorm locations must be such that constructive inter-action between the two systems can produce extratrop-ical transition before the shear inherent in this environ-ment destroys the tropical cyclone, and the strong warm-core signature enhances the baroclinicity in the extra-
tropical redevelopment phase of the storm evolution(HAE).
Gordon (2000; Fig. 11) represents a case of extra-tropical transition where landfall has limited the warm-core intensification of the tropical system prior to thestart of extratropical transition. Although the cycloneeventually recurves and interacts constructively with amidlatitude trough, the limited warm-core strength lim-its the degree of potential baroclinic development. Asa result, extratropical transition occurs rapidly, and Gor-don exists as a hybrid cyclone for less than a day. Afterextratropical transition, the cyclone quickly occludesand weakens since the atmospheric conditions intro-duced to the trough by the weak TC are not sufficientfor significant baroclinic development.
The final Atlantic case of Gabrielle (2001; Fig. 12)illustrates the most complex type of extratropical tran-sition. This is a case in which a tropical cyclone interactswith a trough while moving along the northern wall ofthe Gulf Stream. The result is a dramatic competitionof forcing: the trough is driving cold-core developmentof the cyclone, while the Gulf Stream, through surfacefluxes, evaporation, and latent heat release, is modulat-ing the cold-core development. Hence, the trough andthe strong gradient of SST are simultaneously producingforcings on the cyclone that dramatically increase itsdegree of asymmetry. The result is a tropical cyclonethat exists as a hybrid cyclone for an extended periodof time. Indeed, in the case of Gabrielle, the storm existsas a hybrid cyclone for the majority of its lifetime (Fig.12). As illustrated by the NOGAPS analysis (Fig. 12b),the maximum asymmetry associated with Gabrielle oc-curs on 20 September, when the cyclone is still warmcore. Although the AVN analysis (Fig. 12a) has a lessintense hybrid signal, the trajectory is qualitatively quitesimilar. On 21 September Gabrielle moves north of theGulf Stream and the trough interaction dominates theevolution, leading to extratropical transition completionand occlusion. This trajectory of extratropical transitionoften produces cyclones that are the most difficult toforecast since the dramatic interaction between atmo-spheric and oceanic forcing is difficult to simulate with-in numerical models.
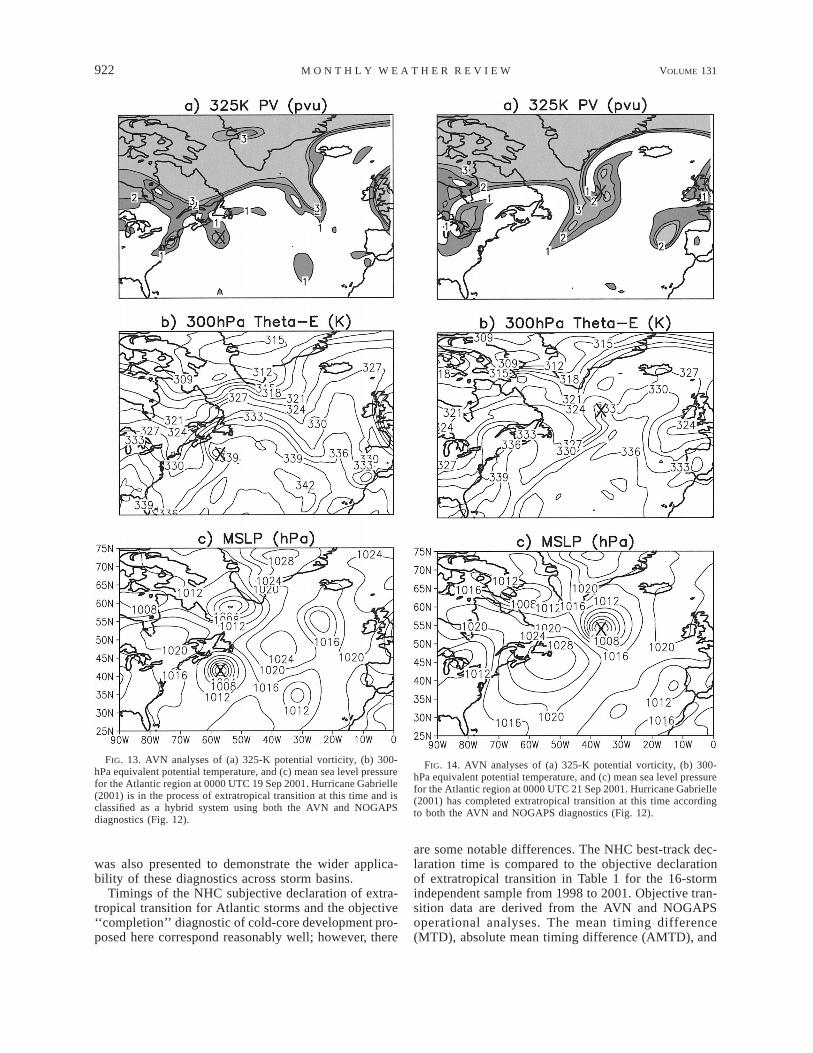
While the diagnosis of extratropical transition com-pletion for Gabrielle (2001) differs by 2 days betweenthe AVN and NOGAPS analyses shown in Fig. 12, itis for cyclones such as this that the phase diagram di-agnostics can provide additional insight over conven-tional analyses into the model-forecast cyclone evolu-tion. For example, AVN analyses of potential vorticity,equivalent potential temperature, and sea level pressurefor 19 September (Fig. 13) and 21 September (Fig. 14),do not provide a consistent picture of the phase (tropical,extratropical, or hybrid) of Gabrielle. This lack of aconsistent picture is also true of the NOGAPS analyses(not shown).
Finally, to demonstrate that these analyses are notbasin specific, we include the analysis of severe Tropical

MAY 2003 919E V A N S A N D H A R T
FIG. 10. Phase space diagnostic for Hurricane Erin (2001) using (a) 18 AVN analyses and (b) 18NOGAPS analyses. Symbols are as in Fig. 9.
Cyclone Vance (1999) from the Australian region.Vance formed in the Coral Sea to the northeast of Aus-tralia and tracked along the northern coast to the SouthIndian Ocean as it gradually intensified. By 1200 UTC16 March 1999, Vance was just to the west of the TopEnd over SSTs around 308C. Over the next 5 days,
Vance continued to intensify, becoming a category 5tropical cyclone at about 1600 UTC on 20 March.Vance’s track largely paralleled the coast, until it tooka sharp turn at about 1200 UTC on 22 March, cominginland north of Shark Bay (Fig. 15; see inset). SevereTropical Cyclone Vance had the highest recorded wind

920 VOLUME 131M O N T H L Y W E A T H E R R E V I E W
FIG. 11. Phase space diagnostic for Hurricane Gordon (2000) using (a) 18 AVN analyses and (b) 18NOGAPS analyses. Symbols are as in Fig. 9.
gust for the Australian mainland of 267 km h21 (74 ms21) recorded at the Learmonth Meteorological Office,shortly before 1200 LST on 21 March 1999 (see colorimages at the Bureau of Meteorology Website: http://www.bom.gov.au/info/cyclone/vancez.shtml). Typicalof the ‘‘captured’’ transition class identified by Foley
and Hanstrum (1994), Vance tracked rapidly southeast-ward, emerging into the Great Australian Bight at 1800UTC on 23 March as it completed extratropical tran-sition (Fig. 15). Vance reintensified as an extratropicalcyclone for the following 24 h as it traversed eastwardacross the sub 208C waters of the Great Australian Bight.

MAY 2003 921E V A N S A N D H A R T
FIG. 12. Phase space diagnostic for Hurricane Gabrielle (2001) using (a) 18 AVN analyses and (b)18 NOGAPS analyses. Symbols are as in Fig. 9.
6. Forecast issues and concluding summary
Objective definitions for the onset (B . 10 m) andcompletion (2 | | , 0) of the extratropical transitionLVT
of a tropical cyclone have been presented here. These
definitions were developed using an initial set of 61Atlantic cases from 1979 to 1993 and tested (section5.2) on a set of 16 Atlantic cases from 1998 to 2001.The Australian case of Tropical Cyclone Vance (1999)
922 VOLUME 131M O N T H L Y W E A T H E R R E V I E W
FIG. 13. AVN analyses of (a) 325-K potential vorticity, (b) 300-hPa equivalent potential temperature, and (c) mean sea level pressurefor the Atlantic region at 0000 UTC 19 Sep 2001. Hurricane Gabrielle(2001) is in the process of extratropical transition at this time and isclassified as a hybrid system using both the AVN and NOGAPSdiagnostics (Fig. 12).
FIG. 14. AVN analyses of (a) 325-K potential vorticity, (b) 300-hPa equivalent potential temperature, and (c) mean sea level pressurefor the Atlantic region at 0000 UTC 21 Sep 2001. Hurricane Gabrielle(2001) has completed extratropical transition at this time accordingto both the AVN and NOGAPS diagnostics (Fig. 12).
was also presented to demonstrate the wider applica-bility of these diagnostics across storm basins.
Timings of the NHC subjective declaration of extra-tropical transition for Atlantic storms and the objective‘‘completion’’ diagnostic of cold-core development pro-posed here correspond reasonably well; however, there
are some notable differences. The NHC best-track dec-laration time is compared to the objective declarationof extratropical transition in Table 1 for the 16-stormindependent sample from 1998 to 2001. Objective tran-sition data are derived from the AVN and NOGAPSoperational analyses. The mean timing difference(MTD), absolute mean timing difference (AMTD), and

MAY 2003 923E V A N S A N D H A R T
FIG. 15. Phase space diagnostic for Tropical Cyclone Vance (1999) in the South Indian Ocean.Diagnostics are calculated using the 18 NOGAPS analyses and symbols are as in Fig. 9, exceptthat positions are labeled at 1200 UTC times (rather than 0000 UTC) since only 1200 UTCanalyses were available. While this Australian tropical cyclone began as a tropical depression inthe Coral Sea (east of the continent), only the period around transition (1200 UTC 16 Mar–1200UTC 24 Mar 1999) is included here. The storm track and weekly averaged SST field are plottedin the inset. Wind gusts of 144 kt (an Australian record) were measured for Vance.
TABLE 1. Comparison of NHC best-track declaration of extratropical transition completion to the objective method for 16 cyclones froman independent dataset spanning 1998–2001. The time difference (in h) is given in the two rightmost columns for the two datasets used: 18AVN and 18 NOGAPS operational analyses. The AVN incorporated a synthetic vortex from 1998 through 2000 and the NOGAPS incorporateda synthetic vortex for all 4 yr. In general, the NOGAPS synthetic vortex signature is more intense than the AVN for the 3 yr when bothused the bogus. When gridded data were not available, or the vortex signature was too weak for reliable objective diagnosis, N/A is indicated.The last three rows indicate statistics for the extratropical transition diagnoses comparison: mean timing difference (MTD), absolute meantiming difference (AMTD), and standard deviation, respectively. For each model analysis, two numbers are given, seperated by a slash. Thefirst number is the statistic for heterogeneous storm sample (12 storms for the AVN, 13 storms for the NOGAPS), while the second numberis for the homogeneous storm sample (9 common storms between the two model analyses).
Year Storm nameDate of NHC best-track
declaration of extratropical transitionET time offset of AVN
phase diagnosis (h)ET time offset of
NOGAPS phase diagnosis (h)
19981998199819981999
BonnieDanielleEarlMitchFloyd
1800 UTC 30 Aug0000 UTC 4 Sep1800 UTC 3 Sep1800 UTC 5 Nov1200 UTC 17 Sep
N/AN/AN/A16
0
2611211816
11219992000200020002001
GertAlbertoGordonMichaelAllison
1200 UTC 23 Sep1200 UTC 23 Aug1800 UTC 18 Sep0000 UTC 20 Oct0000 UTC 18 Jun
N/A21226
1120
12421226
212212
200120012001200120012001
DeanErinGabrielleKarenMichelleNoel
1800 UTC 28 Aug0600 UTC 15 Sep0600 UTC 19 Sep1800 UTC 15 Oct0000 UTC 6 Nov1200 UTC 6 Nov
2181616
218112
0
N/A16
154N/A124N/A
MTDAMTDs
21/12.718/16.7
10.5/8
18.3/16.7115.7/116
19.3/21.7

924 VOLUME 131M O N T H L Y W E A T H E R R E V I E W
TABLE 2. Intercomparison of timing difference and absolute timing difference statistics for the years 1979–93 (41 cases; ECMWF 1.1258reanalyses) against the years 1998–2001. Three subsets of the most recent storm sample are documented: AVN and NOGAPS 18 operationalanalyses for the homogeneous sample of nine storms and the NOGAPS analyses for an eight-storm sample in which the major timing errorof 54 h from Hurricane Gabrielle (1999) is removed. The mean and standard deviation of the actual timing difference and absolute timingdifference are given as mean/std dev in all cases.
Years No. of cases Data source Time difference (h) Absolute time difference (h)
1979–931998–2001
41989
ECMWFAVNNOGAPS no GabrielleNOGAPS
28.3/23.612.7/8.010.8/13.416.7/21.7
18.9/16.46.7/4.7
11.3/5.916/15.3
standard deviation of the NHC best-track transition dec-laration and objective transition are calculated. Thesestatistics are presented for (i) all of the storm cases forwhich they are available in each model and (ii) only thehomogeneous set of nine storms common to both mod-els. These values are listed as (i)/(ii) for the MTD,MATD, and timing difference standard deviation in Ta-ble 1. From a quick scan of these results, one couldconclude that the timing of transition in the AVN is infar better agreement with the NHC ET declaration thanNOGAPS. However, if only the case of Hurricane Ga-brielle (1999)—in which NOGAPS missed transition by54 h—is removed, the NOGAPS timings of transitionshow more similar agreement with both NHC and AVN.This highlights the potential impact of a single pooranalysis in the evaluation of model skill for a only fewyears.
Compared to the 61-storm sample from 1979 to 1993(Fig. 7), there is a significant reduction in the magni-tudes of the timing difference and absolute timing dif-ference (both mean and standard deviation) for the AVNand NOGAPS (without Gabrielle) transition timingscompared with NHC; the nine-case NOGAPS statisticsare comparable with the earlier time period (Table 2).It is noteworthy that the mean timing difference hasincreased, from 28.3 in 1979–93 to between 12.7 and16.7 in 1998–2001. This change represents a delay inthe model transition time and is attributed to the moreintense initial warm-core signatures present in the modelanalyses (compared to slightly coarser unbogusedECMWF reanalyses) during the tropical cyclone phase.The increase in intensity of the model tropical stormsignature could be a result of the vortex bogusing and/or increases in model resolution. Such a result indicatesthat the intensity of the cyclone warm core has a directimpact upon the evolution and timing of extratropicaltransition. Further, the presence or absence of the trop-ical storm can affect the potential for extratropical cy-clogenesis: for example, modeling studies with andwithout Hurricane Irene (1999) demonstrate that muchweaker midlatitude cyclogenesis would likely have oc-curred without the hurricane (Prater-Mayer and Evans2002).
The agreement between the objective phase space di-agnosis and the NHC declaration of extratropical tran-sition highlighted by this timing comparison suggests
that the cyclone phase diagnoses described here capturethe storm structure changes subjectively required by theoperational forecasters. The objective ET criteriamapped in the cyclone phase space provide a repeatablediagnostic that can be used operationally to check themodel consistency with the satellite signature and avail-able observations of the storm. It is also useful as anaid for assessing improvements in model analysis andforecasting of tropical cyclones from tropical depressionthrough extratropical transition and possibly in deter-mining optimal timing for discontinuing storm bogusingin the analyses. Further, intercomparison of these di-agnostics across model forecasts has the potential forevaluating storm forecast predictability.
Acknowledgments. Partial support for this researchcame from the National Science Foundation (ATM-9911212) and NASA (NAG5-7547). REM was fundedby an Environmental Protection Agency (EPA) STARGraduate Fellowship and a NASA Space Grant GraduateFellowship. Sincere appreciation goes to these agenciesfor their support.
We thank Lixion Avila of NHC for his input on themethodology behind operational classification of tran-sition at the U.S. National Hurricane Center. We furtherthank Mike Fiorino (LLNL) and Cdr. David Jones ofNRL for providing access to the output from the op-erational NOGAPS. Analyses and figures for this paperwere created using the GrADS software package. Sat-ellite imagery provided by NCDC through their histor-ical GOES browser at http://www.ncdc.gov/servlets/GoesBrowser.
REFERENCES
Atallah, E. H., 2001: The dynamics of heavy rainfall in landfallentropical systems. Preprints, First Symp. on Precipitation Ex-tremes, Albuquerque, NM, Amer. Meteor. Soc., 357–358.
Bosart, L. F., E. H. Atallah, and J. E. Molinari, 2001: The quantitativeprecipitation problem associated with landfalling and transition-ing tropical cyclones. Preprints, First Symp. on PrecipitationExtremes, Albuquerque, NM, Amer. Meteor. Soc., 359–362.
Bowyer, P., 2000: Phenomenal waves with a transitioning tropicalcyclone (Luis, the Queen and the Buoys). Preprints, 24th Conf.on Hurricanes and Tropical Meteorology, Fort Lauderdale, FL,Amer. Meteor. Soc., 294–295.
DiMego, G. J., and L. F. Bosart, 1982a: The transformation of TropicalStorm Agnes into an extratropical cyclone. Part I: The observed

MAY 2003 925E V A N S A N D H A R T
fields and vertical motion computations. Mon. Wea. Rev., 110,385–411.
——, and ——, 1982b: The transformation of Tropical Storm Agnesinto an extratropical cyclone. Part II: Moisture, vorticity andkinetic energy budgets. Mon. Wea. Rev., 110, 412–433.
Elsberry, R. L., Ed., 1995: Global perspectives on tropical cyclones.WMO Tech. Doc. 693, Geneva, Switzerland, 289 pp.
Foley, G. R., and B. N. Hanstrum, 1994: The capture of tropicalcyclones by cold fronts off the west coast of Australia. Wea.Forcasting, 9, 577–592.
Frank, W. M., 1977a: The structure and energetics of the tropicalcyclone. I. Storm structure. Mon. Wea. Rev., 105, 1119–1135.
——, 1977b: The structure and energetics of the tropical cyclone. II.Dynamics and energetics. Mon. Wea. Rev., 105, 1136–1150.
Gibson, J. K., P. Kallberg, S. Uppala, A. Hernandez, A. Nomura, andE. Serrano, 1997: ERA description. ECMWF Re-analysis ProjectReport Series, Part 1, ECMWF, Shinfield Park, Reading, UnitedKingdom.
Harr, P., and R. L. Elsberry, 2000: Extratropical transition of tropicalcyclones over the western North Pacific. Part I: Evolution ofstructural characteristics during the transition process. Mon.Wea. Rev., 128, 2613–2633.
Hart, R. E., 1999: Working toward a conceptual model for extra-tropical transition: Diagnosis of transition and post-transitionintensity change from observations and reanalyses. Preprints,23d Conf. on Hurricanes and Tropical Meteorology, Dallas, TX,Amer. Meteor. Soc. 805–808.
——, 2003: A cyclone phase space derived from thermal wind andthermal asymmetry. Mon. Wea. Rev., 131, 585–616.
——, and J. L. Evans, 2001: A climatology of extratropical transitionof Atlantic tropical cyclones. J. Climate, 14, 546–564.
Hirschberg, P. A., and J. M. Fritsch, 1993: On understanding heighttendency. Mon. Wea. Rev., 121, 2646–2661.
Hogan, T., and T. Rosmond, 1991: The description of the Navy Op-erational Global Atmospheric Prediction System’s spectral fore-cast model. Mon. Wea. Rev., 119, 1786–1815.
Kanamitsu, M., 1989: Description of the NMC global data assimi-lation and forecast system. Wea. Forecasting, 4, 335–342.
Klein, P., P. Harr, and R. L. Elsberry, 2000: Extratropical transitionof western North Pacific tropical cyclones: An overview andconceptual model of the transformation stage. Wea. Forecasting,15, 373–396.
Lawrence, M. B., L. A. Avila, J. L. Beven, J. L. Franklin, J. L. Guiney,and R. J. Pasch, 2001: Atlantic hurricane season of 1999. Mon.Wea. Rev., 129, 3057–3084.
MacAfee, A., and P. J. Bowyer, 2000a: Trapped fetch waves in atransitioning tropical cyclone (Part I—The need and the theory).Preprints, 24th Conf. on Hurricanes and Tropical Meteorology,Fort Lauderdale, FL, Amer. Meteor. Soc., 292–293.
——, and ——, 2000b: Trapped fetch waves in a transitioning tropicalcyclone (Part II—Analytical and predictive model). Preprints,24th Conf. on Hurricanes and Tropical Meteorology, Fort Lau-derdale, FL, Amer. Meteor. Soc., 165–166.
Malmquist, D., 1999: Meteorologists and insurers explore extratrop-ical transition of tropical cyclones. Eos, Trans. Amer. Geophys.Union, 80, 79–80.
Molinari, J., and D. Vollaro, 1989: External influences on hurricaneintensity. Part I: Outflow layer eddy angular momentum fluxes.J. Atmos. Sci., 46, 1093–1105.
——, and ——, 1990: External influences on hurricane intensity. PartII: Vertical structure and response of the hurricane vortex. J.Atmos. Sci., 47, 1902–1918.
Pasch, R. J., T. Kimberlain, and S. R. Stewart, 1999: Preliminaryreport on Hurricane Floyd 7–17 September 1999. National Hur-ricane Center, 27 pp. [Available from Tropical Prediction Center,11691 S.W. 17th St., Miami, FL 33165-2149; also available on-line at http://www.nhc.noaa.gov/1999/floyd.html.]
Prater-Mayer, B., and J. L. Evans, 2002: Sensitivity of modeled trop-ical track and structure of Hurricane Irene (1999) to the con-vection parameterization scheme. Meteor. Atmos. Phys., 80,103–115.
Reynolds, R. W., and T. Smith, 1995: A high-resolution global seasurface temperature climatology. J. Climate, 8, 1571–1583.
Sekioka, M., 1956a: A hypothesis on complex of tropical and extra-tropical cyclones for typhoon in the middle latitudes. I. Synopticstructure of Typhoon Marie passing over the Japan Sea. J. Me-teor. Soc. Japan, 34, 276–287.
——, 1956b: A hypothesis on complex of tropical and extratropicalcyclones for typhoon in the middle latitudes. II. Synoptic struc-ture of Typhoons Louise, Kezia, and Jane passing over the JapanSea. J. Meteor. Soc. Japan, 34, 336–345.
Thorncroft, C., and S. C. Jones, 2000: The extratropical transition ofHurricanes Felix and Iris in 1995. Mon. Wea. Rev., 128, 947–972.


