Object at Rest May 2007 John Shin US Economics. Outline A correction, not a crash Creeping core...
30
Object at Rest May 2007 John Shin US Economics
-
Upload
amanda-neal -
Category
Documents
-
view
213 -
download
0
Transcript of Object at Rest May 2007 John Shin US Economics. Outline A correction, not a crash Creeping core...

Object at Rest
May 2007
John ShinUS Economics

Outline
A correction, not a crash Creeping core inflation “Pause” does not mean “finished”
________________Note: Q1 are actuals
Outlook at a Glance…
1Q 2Q 3Q 4Q 1Q 2Q 3Q 4Q
Real GDP (%, q-o-q, ar) 5.6 2.6 2.0 2.5 1.3 2.5 2.5 2.5
Core CPI (%, y-o-y) 2.1 2.4 2.8 2.7 2.6 2.5 2.3 2.4
Fed funds (eop) 4.75 5.25 5.25 5.25 5.25 5.25 5.25 5.25
2006 2007
Actual Forecast
1

Housing Recession = Growth Slowdown
Housing: a series of shocks
– 2006: Construction recession
– 2007: Consumer slowdown
– 2008: Sub-prime shock
– 2009: Foreclosures Outside housing
– Easy financial conditions
– Corporate comeback
– Exports: a little help from our friends
– Fiscal policy: short-run neutral
2

Growth: California ExperienceCalifornia home prices and unemployment rate
________________Source: OFHEO, BLS.
Total: 13%-10
-5
0
5
10
15
20
25
30
35
Mar-76 Mar-82 Mar-88 Mar-94 Mar-00 Mar-06
0
2
4
6
8
10
12
Unemployment rate, rhs
Home prices, lhs
%y-o-y %
3

Growth: Regional Housing BubblesNumber of MSAs, average price increase 2003–2005
________________Source: Office of Housing Enterprise Oversight and Lehman Brothers.Note: Chart covers 379 Metropolitan Statistical Areas.
0
50
100
150
200
250
Less than 8% 8 - 15% More than 15%
Boring
Borderline bubble
Bubble
8–15%
4

Growth: California Home PricesCalifornia home prices
-10
-5
0
5
10
15
20
25
30
35
40
Mar-75 Mar-81 Mar-87 Mar-93 Mar-99 Mar-05
%q-o-q ar
%y-o-y
________________Source: OFHEO
5

Home prices (indexed to peak)
________________Source: OFHEO and Lehman Brothers.
Index (to home price peak)
Quarters after peak
70
80
90
100
110
120
0 8 16 24 32 40 48
NYC (1989 - 2000)
Dallas (1986 - 1997)
LA (1990 - 2000)
Growth: Imbalances at Home -- House Prices
6

Growth: California citiesCalifornia metropolitan area home prices (Mar 95 = 100)
________________Source: OFHEO
100
150
200
250
300
350
400
Mar-00 Mar-01 Mar-02 Mar-03 Mar-04 Mar-05 Mar-06 Mar-07
SacSF
SJSD
LASB
7

Growth: Housing-related Payrolls – CA vs. USNon-farm payroll employment (Index, Aug 2003=100)
________________Source: BLS and Lehman Brothers
95
100
105
110
115
120
Jan-01 Nov-01 Sep-02 Jul-03 May-04 Mar-05 Jan-06 Nov-06
USA
California
Housing
Total
8

Growth: More Stable National Home PricesCase-Shiller versus OFHEO (%y-o-y)
________________Source: S&P/Case Shiller, OFHEO, Lehman BrothersNote: OFHEO composite uses weighting methodology from Case-Shiller 10city composite
-10
-5
0
5
10
15
20
25
Mar-88 Mar-91 Mar-94 Mar-97 Mar-00 Mar-03 Mar-06
Case-Shiller 10city composite
OFHEO nation
OFHEO "composite"
9

California Nonbubble Areas
Early 90s Today Today
Overvaluation Modest Large Fair
Economy Major Recession Weak Solid
Credit Thrift Collapse Hybrids Healthy
Prices -13% -10 to -20% +5%/yr
Growth: Prices -- History Lessons
10

Growth: Housing -- Construction CorrectionReal residential investment (%q-o-q ar)
________________Source: Commerce Department, Lehman Brothers Global Economics.
-25
-20
-15
-10
-5
0
5
10
15
20
25
Mar-05 Dec-05 Sep-06 Jun-07 Mar-08 Dec-08
Forecast
(0)
11
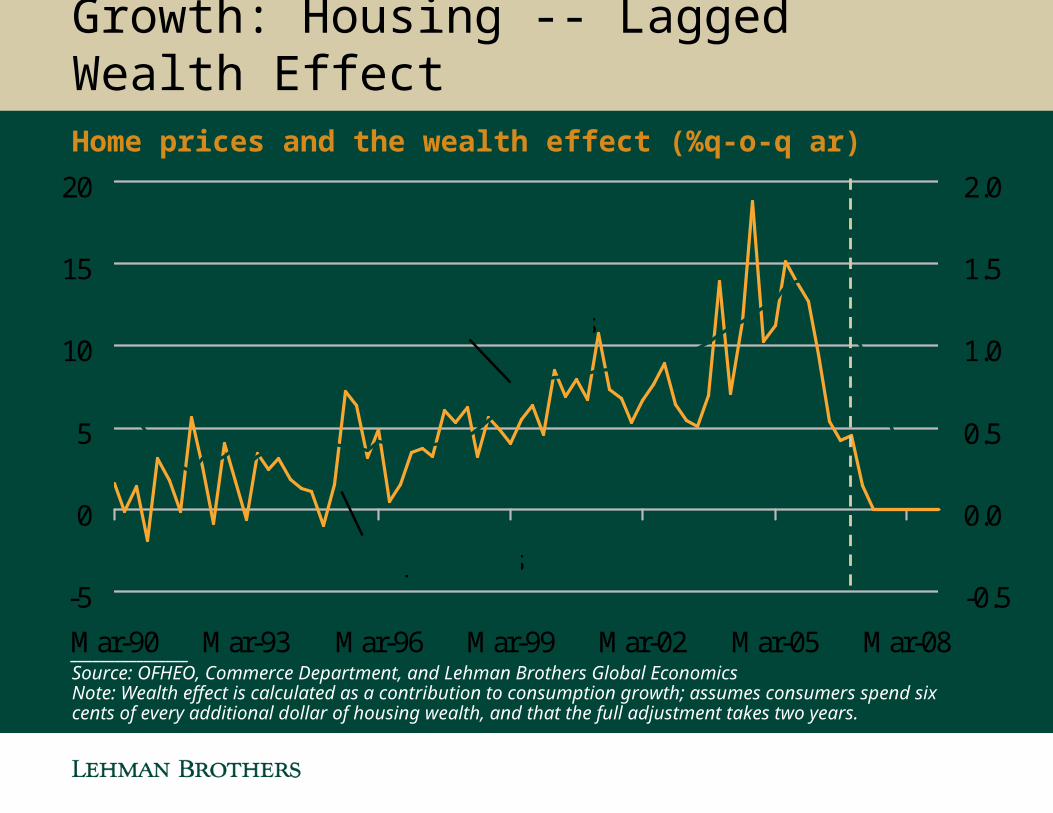
Growth: Housing -- Lagged Wealth EffectHome prices and the wealth effect (%q-o-q ar)
-5
0
5
10
15
20
Mar-90 Mar-93 Mar-96 Mar-99 Mar-02 Mar-05 Mar-08
-0.5
0.0
0.5
1.0
1.5
2.0
Wealth effect, rhs
home prices, lhs
________________Source: OFHEO, Commerce Department, and Lehman Brothers Global EconomicsNote: Wealth effect is calculated as a contribution to consumption growth; assumes consumers spend six cents of every additional dollar of housing wealth, and that the full adjustment takes two years.
12

Growth: Subprime Submarine?
Underwriting standards fell in 2005 and 2006 Economic impact of foreclosures
– Small impact on consumption (Garner & McCarthy)
– Significant impact on inventories
• Supply put back on market
• Demand constrained by tougher underwriting Major drag on bubble regions Risks:
– “Japan” scenario in bubble states
– Contagion to other capital markets
13

Growth: Consumer Connection
Most consumer fundamentals are healthy Solid income growth Moderation in energy costs (for now) Surging stock market wealth
But housing stimulus fading Empirical evidence favors wealth not debt (1)
Hard landing for prices requires
– Bubble
– Very weak economy
– Credit crunch
________________1. See Macroeconomic Advisors “Fear Not MEW”, October 20, 2006.
14

Growth: Consumption Foundation
________________Source: Commerce Department
Real consumption and disposable income (%y-o-y)
-1
0
1
2
3
4
5
6
7
Mar-85 Mar-88 Mar-91 Mar-94 Mar-97 Mar-00 Mar-03 Mar-06
Consumption
Disposable income
15

Growth: Uncertainty over the futureUnemployment expectations (higher means more concerned)
0
10
20
30
40
50
60
70
1990 1992 1994 1996 1998 2000 2002 2004 2006
U. Michigan
Conference Board
________________Source: University of Michigan, Conference Board
16

Growth: Corporate Catch-up?Business fixed investment and profits (current $, % GDP)
________________Source: Commerce Department.
6
7
8
9
10
11
12
13
14
15
Mar-80 Mar-84 Mar-88 Mar-92 Mar-96 Mar-00 Mar-04
Investment
Profits
17

Growth: Oil BoilWest Texas Intermediate crude oil ($/bbl)
________________Source: Bloomberg and Lehman Brothers.
10
20
30
40
50
60
70
80
Jan-00 Jan-01 Jan-02 Jan-03 Jan-04 Jan-05 Jan-06 Jan-07
18

Inflation: Is Three Years “Temporary”Core PCE and core CPI (%y-o-y)
________________Source: Commerce Department, BLS, and Lehman Brothers.
0.0
0.5
1.0
1.5
2.0
2.5
3.0
3.5
Jan-95 Jan-97 Jan-99 Jan-01 Jan-03 Jan-05 Jan-07
Bernanke boundaries
Core CPI
Core PCE
19

Inflation: Tight Labor MarketUnemployment rate and NAIRU (%)
________________Source: Bureau of Labor Statistics and Lehman Brothers.Note: NAIRU, the Nonaccelerating Inflation Rate of Unemployment, is based on regression of change in core CPI
inflation on the lagged unemployment rate.
3
4
5
6
7
8
Jan-90 Jan-93 Jan-96 Jan-99 Jan-02 Jan-05
NAIRU
Unemployment rate
20

Inflation: Labor costs gradually rising
________________Source: Commerce Dept, BLS, Lehman Brothers
Labor cost measures (%y-o-y)
-2.0
-1.0
0.0
1.0
2.0
3.0
4.0
5.0
6.0
Mar-00 Mar-01 Mar-02 Mar-03 Mar-04 Mar-05 Mar-06
AHE
ECI-W
ULC
21

Inflation: Phillips Curve ForecastsCore PCE inflation (%q-o-q ar)
1.0
1.2
1.4
1.6
1.8
2.0
2.2
2.4
2.6
2.8
3.0
Mar-04 Dec-04 Sep-05 Jun-06 Mar-07 Dec-07 Sep-08
Phillips curve range
Actual/Lehman forecast
________________Source: BEA and Lehman Brothers Global Economics; Note: Phillips curve models include either the unemployment rate less NAIRU or the output gap as the measure of capacity utilization, as well as various measures of inflation expectations
22

Fed Freeze
Growth Below Potential
Inflation Above Target
Inertia
23

The Fed: Bernanke’s Birds
“Future policy adjustments will depend on the evolution of the outlook for both inflation and economic growth” (instead of “any additional firming”)
“The Committee's predominant policy concern remains the risk that inflation will fail to moderate as expected.”
The Dove:
________________Source: March 21st FOMC Statement, Federal Reserve Board, and Lehman Brothers.
The Hawk:
24

Fed: Hope Springs EternalFederal Funds target rate and 6 month market expectations (%)
________________Source: Federal Reserve and Lehman Brothers.Note: Market expectations derived from Lehman Brothers’ Fediscope model. Latest expectations as of April 12, 2007.
0
1
2
3
4
5
6
Jan-04 Jul-04 Jan-05 Jul-05 Jan-06 Jul-06 Jan-07 Jul-07
Market expectations
Jan '05
Jul '05Jan '06
Jul '06
Today
25

Fed Inversionomics—A “Perfect” Track Record
________________Note: Shaded areas denote recessions (NBER)Source: Federal Reserve Board, US Treasury and Lehman Brothers
TSY 10yr – Fed funds spread
-6
-4
-2
0
2
4
6
Mar-66 Mar-72 Mar-78 Mar-84 Mar-90 Mar-96 Mar-02
26

Fed: FOMC forecasts
2007 FOMC central tendency forecasts
________________Source: Federal Reserve Board, and Lehman Brothers.
FOMC FOMCOld New
Real GDP (Q4/Q4) 3.0 - 3.25 2.5 - 3.0 2.6
Unemployment rate (Q4) 4.75 - 5.0 4.5 - 4.75 4.7
Core PCE inflation (Q4/Q4) 2.0 - 2.25 2.0 - 2.25 2.2
Lehman
27

Conclusion
Housing recession = GDP slowdown
Stubborn core inflation
Fed inertia: Object at rest stays at rest
28

Analyst CertificationThe views expressed in this report accurately reflect the personal views of Joong S. Shin, the primary analyst responsible for this report, about the subject securities or issuers referred to herein, and no part of such analyst's compensation was, is or will be directly or indirectly related to the specific recommendations or views expressed herein.
Important Disclosures Lehman Brothers Inc. and/or an affiliate thereof (the "firm") regularly trades, generally deals as principal and generally provides liquidity (as market maker or otherwise) in the fixed income securities that are the subject of this research report (and related derivatives thereof). The firm's trading desks may have either a long and / or short position in such securities and / or derivative instruments, which may pose a potential conflict with the interests of investing customers. Where permitted and subject to appropriate information barrier restrictions, the firm's fixed income research analysts regularly interact with its trading desk personnel to determine current prices of fixed income securities. The firm's fixed income research analyst(s) receive compensation based on various factors including, but not limited to, the quality of their work, the overall performance of the firm (including the profitability of the investment banking department), the profitability and revenues of the Fixed Income Division and the outstanding principal amount and trading value of, the profitability of, and the potential interest of the firm’s investing clients in research with respect to, the asset class covered by the analyst.Lehman Brothers generally does and seeks to do investment banking and other business with the companies discussed in its research reports. As a result, investors should be aware that the firm may have a potential conflict of interest.To the extent that any historical pricing information was obtained from Lehman Brothers trading desks, the firm makes no representation that it is accurate or complete. All levels, prices and spreads are historical and do not represent current market levels, prices or spreads, some or all of which may have changed since the publication of this document.Lehman Brothers' global policy for managing conflicts of interest in connection with investment research is available at www.lehman.com/researchconflictspolicy.To obtain copies of fixed income research reports published by Lehman Brothers please contact Valerie Monchi ([email protected]; 212-526-3173) or clients may go to https://live.lehman.com/
Legal DisclaimerThis material has been prepared and/or issued by Lehman Brothers Inc., member SIPC, and/or one of its affiliates ("Lehman Brothers"). Lehman Brothers Inc. accepts responsibility for the content of this material in connection with its distribution in the United States. This material has been approved by Lehman Brothers International (Europe), authorised and regulated by the Financial Services Authority, in connection with its distribution in the European Economic Area. This material is distributed in Japan by Lehman Brothers Japan Inc., and in Hong Kong by Lehman Brothers Asia Limited. This material is distributed in Australia by Lehman Brothers Australia Pty Limited, and in Singapore by Lehman Brothers Inc., Singapore Branch ("LBIS"). Where this material is distributed by LBIS, please note that it is intended for general circulation only and the recommendations contained herein do not take into account the specific investment objectives, financial situation or particular needs of any particular person. An investor should consult his Lehman Brothers' representative regarding the suitability of the product and take into account his specific investment objectives, financial situation or particular needs before he makes a commitment to purchase the investment product. This material is distributed in Korea by Lehman Brothers International (Europe) Seoul Branch. Any U.S. person who receives this material and places an order as result of information contained herein should do so only through Lehman Brothers Inc. This document is for information purposes only and it should not be regarded as an offer to sell or as a solicitation of an offer to buy the securities or other instruments mentioned in it. No part of this document may be reproduced in any manner without the written permission of Lehman Brothers. With exception of the disclosures relating to Lehman Brothers, this report is based on current public information that Lehman Brothers considers reliable, but we do not represent that this information, including any third party information, is accurate or complete and it should not be relied upon as such. It is provided with the understanding that Lehman Brothers is not acting in a fiduciary capacity. Opinions expressed herein reflect the opinion of Lehman Brothers' Fixed Income Research Department and are subject to change without notice. The products mentioned in this document may not be eligible for sale in some states or countries, and they may not be suitable for all types of investors. If an investor has any doubts about product suitability, he should consult his Lehman Brothers representative. The value of and the income produced by products may fluctuate, so that an investor may get back less than he invested. Value and income may be adversely affected by exchange rates, interest rates, or other factors. Past performance is not necessarily indicative of future results. If a product is income producing, part of the capital invested may be used to pay that income. Lehman Brothers may, from time to time, perform investment banking or other services for, or solicit investment banking or other business from any company mentioned in this document. No part of this document may be reproduced in any manner without the written permission of Lehman Brothers. © 2006 Lehman Brothers. All rights reserved. Additional information is available on request. Please contact a Lehman Brothers' entity in your home jurisdiction.
29