Obesity, Unhappiness, and The Challenge of Affluence ...ftp.iza.org/dp2717.pdfDiscussion Paper No....
22
IZA DP No. 2717 Obesity, Unhappiness, and The Challenge of Affluence: Theory and Evidence Andrew J. Oswald Nattavudh Powdthavee DISCUSSION PAPER SERIES Forschungsinstitut zur Zukunft der Arbeit Institute for the Study of Labor March 2007
Transcript of Obesity, Unhappiness, and The Challenge of Affluence ...ftp.iza.org/dp2717.pdfDiscussion Paper No....

IZA DP No. 2717
Obesity, Unhappiness, and The Challenge of Affluence:Theory and Evidence
Andrew J. OswaldNattavudh Powdthavee
DI
SC
US
SI
ON
PA
PE
R S
ER
IE
S
Forschungsinstitutzur Zukunft der ArbeitInstitute for the Studyof Labor
March 2007

Obesity, Unhappiness, and The Challenge of Affluence:
Theory and Evidence
Andrew J. Oswald University of Warwick and IZA
Nattavudh Powdthavee
IoE, University of London
Discussion Paper No. 2717 March 2007
IZA
P.O. Box 7240 53072 Bonn
Germany
Phone: +49-228-3894-0 Fax: +49-228-3894-180
E-mail: [email protected]
Any opinions expressed here are those of the author(s) and not those of the institute. Research disseminated by IZA may include views on policy, but the institute itself takes no institutional policy positions. The Institute for the Study of Labor (IZA) in Bonn is a local and virtual international research center and a place of communication between science, politics and business. IZA is an independent nonprofit company supported by Deutsche Post World Net. The center is associated with the University of Bonn and offers a stimulating research environment through its research networks, research support, and visitors and doctoral programs. IZA engages in (i) original and internationally competitive research in all fields of labor economics, (ii) development of policy concepts, and (iii) dissemination of research results and concepts to the interested public. IZA Discussion Papers often represent preliminary work and are circulated to encourage discussion. Citation of such a paper should account for its provisional character. A revised version may be available directly from the author.

IZA Discussion Paper No. 2717 March 2007
ABSTRACT
Obesity, Unhappiness, and The Challenge of Affluence: Theory and Evidence*
Is affluence a good thing? The book The Challenge of Affluence by Avner Offer (2006) argues that economic prosperity weakens self-control and undermines human well-being. Consistent with a pessimistic view, we show that psychological distress has been rising through time in modern Great Britain. Taking over-eating as an example, our data reveal that half the British population view themselves as overweight, and that happiness and mental health are worse among fatter people in both Britain and Germany. A 10-point move up in body mass index (BMI) is associated in the cross-section with a drop in psychological health of approximately 0.3 GHQ points. Comparisons also matter. For a given level of BMI, we find that people who are educated or who have high income are more likely to view themselves as overweight. We discuss problems of inference and argue that longitudinal data on BMI are needed. We suggest a theory of imitation – where utility depends on relative weight – in which there can be obesity spirals after only small drops in the price of food. JEL Classification: D1, I12, I31 Keywords: body mass index, happiness, mental health, General Health Questionnaire,
GHQ scores, BMI, well-being, obesity, BHPS, GSOEP, imitation, weight, relative income, comparisons
Corresponding author: Andrew J. Oswald Department of Economics University of Warwick Coventry CV4 7AL United Kingdom E-mail: [email protected]
* We are grateful to Alois Stutzer for extremely helpful ideas on this topic. For valuable discussions, we thank also Andrew Clark, Amanda Goodall, Mark Harrison, Tatiana Kornienko, Avner Offer, Sarah Shalgosky, Alois Stutzer, and Robert Wade. The Economic and Social Research Council (ESRC) provided research support through an ESRC professorial fellowship to the first author.

Obesity, Unhappiness, and The Challenge of Affluence: Theory and Evidence
The rise of … incomes has done little or nothing to improve the sense of well-being. Offer (2006), p.357 Disorders abound: family breakdown, addiction, stress, road and landscape congestion, obesity, poverty... p.2 The rise of body weight demonstrates how affluence can rise, and yet fail to deliver well-being. p. 138
Is affluence a good thing? This article examines important ideas raised in a new book
by Avner Offer (2006). In Offer’s view, economic growth undermines well-being.
The paradox of affluence is that a flow of new rewards impairs people’s capacity to
enjoy them.
Like the best social-science, The Challenge of Affluence is either important or
wrong1. Ultimately, the issue will probably be settled by data that will come in only
slowly over the next few decades. In the short run, therefore, readers must decide for
themselves. But our instinct is that Offer is more right than wrong. The monograph
persuades most vividly when read alongside the work of researchers like Daniel
Gilbert of Harvard’s psychology department who argues that people are poor at
affective forecasting, that is, at deciding ex ante what will make them happy ex post. 2
Offer’s arguments are against mainstream economics thinking. In economics, a
person is routinely assumed to be a shrewd judge of his or her best interests.
Although it is not easy in a few lines to do justice to the breadth and especially the
vibrancy of Avner Offer’s writing, these are some of his conclusions:
1. Affluence has changed people’s lives, but economic growth has not done much to
make people happier3. Life is probably getting worse.
1 By contrast, most articles published in the Economic Journal are perhaps best viewed as unimportant (the majority will not be quoted a dozen times in their lifetimes) but correct (they have been refereed and will not be contradicted in any clear way by what goes later). This is normal science. 2 Gilbert (2006), Gilbert et al (1998), Gilbert et al (2002). 3 Earlier evidence is discussed in Easterlin (1974) and Oswald (1997). Ruhm (2005) argues that upswings in the business cycle can be deleterious for well-being.
1

2. The main reason is that choice is fallible. In particular, human beings want their
pleasure now rather than tomorrow. They have trouble -- far more trouble than
economics textbooks teach us -- in practising prudence. Myopia prevails to an
unhappy extent. The world is full of hyperbolic discounting.
3. Human impatience causes bigger problems in wealthier societies. The outcome is
disorders of self-control on a larger and larger scale – over-eating, family breakdown,
and addictive behaviours.
4. Dangerously, economic growth leads to a faster flow of novelty. This is
disorienting. It corrodes the informal norms, commitment devices and institutions
that safely and gradually come into being when change is slow.
5. The huge amount of advertising in modern society has reduced trust and made
genuine sincerity difficult.
6. Obesity4, divorce5 and excessive TV-watching demonstrate how affluence can
reduce happiness.
7. The author’s intellectual case “is not packaged into some grand multivariate
statistical test… Instead there is a variety of quantitative and descriptive tests… I
have woven the argument from the whole range of evidence: this is both social
science and history.” p. 11.
Offer provides a fascinating tapestry of evidence. In our judgment, nevertheless, his
interesting thesis makes too little of the role of relative income, and indeed of relative
bodyweight. We suspect the reason that affluence fails to improve well-being is not
the one -- self-control gets worse with riches -- favoured by the author of The
Challenge of Affluence. It is, rather, that well-being depends on a person’s relative
income and ranked position. By definition, that cannot rise for everyone in a group as
4 See also Offer (1998, 2001). 5 Offer’s arguments on marital breakdown cannot be explored in detail here, but some recent work, such as Hawkins and Booth (2005) and Gardner and Oswald (2006,) suggests that divorcing couples actually benefit, even though the initial effect of divorce is negative. Stevenson and Wolfers (2006) document other welfare gains from divorce.
2

the group’s members all go from having just one Ford on the driveway to having three
Lexuses spilling out across the pavement. Avner Offer is aware of, and sympathetic
to, this idea: “a positive social ranking produces an inner glow”, p. 360. He quotes
Duesenberry (1949), Easterlin (1974) and other writers on it. Yet he does not make it
the dominating centrepiece of Offer (2006).
Some evidence A useful, focused example of Avner Offer’s thesis can be found around food and
over-eating: “Obesity shows how abundance…[can] make a mockery of the rational
consumer.” p.169. Accordingly, and because for health reasons it is a matter of policy
interest6, we consider the author’s more general argument by looking in detail at
weight-gain.
First, and as a backdrop, it is true, although Offer does not provide exactly this
evidence, that mental well-being is worsening in a country like Britain. Figure 1
shows for representative samples of Britons that GHQ psychological distress scores7
rose 8 from 1991. The increase is statistically significant at normal confidence levels.
In a regression equation, pooling the years 1991-2004, we find that:
GHQ = 0.01 time trend + constant + controls for age, gender, marital status, employment status, education level.
Here the coefficient on the time trend has a t-statistic of approximately 2.3. Hence
mental health in Great Britain is apparently gradually worsening, ceteris paribus, by
approximately 0.1 GHQ point per decade.
6 See sources such as Burkhauser and Cawley (2004), Banks et al (2006), Bhattacharya (2005), Propper (2005), Finkelstein et al (2005), and Sanz-de-Galdeano (2005). Links between obesity and labour-market outcomes are studied in Sargent and Blanchflower (1994), Harper (2000), Cawley (2004) and Morris (2006). However, Kenkel et al (2006) does not find strong links between high-school completion and later obesity. 7 Goldberg et al (1997) provides a discussion of the validity of the General Health Questionnaire GHQ-12 as a measure of mental health. It studies many countries and languages. There is evidence that lottery wins of medium size seem to improve later GHQ scores: see Gardner and Oswald (2007). 8 Sacker and Wiggins (2002) present an alternative kind of evidence for two British birth-cohorts. Two studies of the Netherlands by Hodiamont et al (2005) and Verhaak et al (2005), which came to our
3

Second, is there empirical support for the idea that people eat too much, namely,
consume food beyond the point that is rational? Economists are generically loathe to
believe so (Cutler et al, 2003). They assume that obese people are contentedly fat. 9
A simple first step, therefore, is to study if happiness is lower among heavier people.
It is. New evidence is set out in the life-satisfaction equations of Tables 1 and 2,
which find this negative correlation in modern British and German data (the two data
sets each contain only a single cross-section on body mass index, BMI, so
longitudinal analysis cannot be done). The tables use self-reported data to construct
BMI figures.
How much does weight matter? In Tables 1 and 2, a (huge) move of 4 standard
deviations in fatness, from close to the bottom of the BMI distribution to close to the
top, is associated in the cross-section with a modest decrease of well-being of
approximately one fifth of the size of the cross-sectional effect of marital separation.
The regression equation for GHQ mental distress replicates the same sign, in Table 3,
which means that psychological health is systematically lower among heavier
Britons.10 A large 10-point move up in BMI is associated in the cross-section with
only a fairly small worsening, by around 0.3 points, in GHQ mental health. The
negative sign in these equations is consistent with cross-sectional happiness evidence
for the United States in Felton and Graham (2005), Switzerland in Stutzer (2006), and
the Netherlands in Cornelisse-Vermaat et al (2006), and also with some of the
longitudinal associations in Roberts et al (2000), (2002).
While evocative, and consistent with the general Offer hypothesis of self-control
problems, this negative correlation between happiness and BMI does not establish
causality. It is simply a cross-section pattern; ignores the difference between
marginal and average preferences in the population; could be driven by the fact that
attention after early drafts of this paper, conclude that Dutch GHQ distress scores have risen since the 1980s. Levi et al (2003) studies the (mixed) international evidence on suicide trends. 9 Interestingly, Stutzer (2006) demonstrates that obesity is associated with reduced well-being most especially among a sub-sample of people who report that they have limited self-control. 10 Standard controls are included in these equations, though are not discussed in detail here; the literature includes Blanchflower and Oswald (2004), Di Tella et al (2001), Easterlin (2003), Frey and Stutzer (2000), Powdthavee (2005a,b), Van Praag and Ferrer-I-Carbonell (2004), and Winkelmann and Winkelmann (1998). Clark and Oswald (1994) provides an early GHQ regression equation for Britain in the year 1991. Jorm et al (2003), Stunkard et al (2003) and Simon et al (2006) find a correlation
4

unhappy people feel compelled to eat; or could simply reflect the fact that a rational
eater’s utility may be increasing in the flow of eating but decreasing in the stock of
fatness11.
Third, our data find that half of Britain’s population describe themselves as
overweight. See Table 4.
This fact can be set alongside Offer’s interesting argument: In the rational choice
approach there is no such thing as ‘overweight’. p.143. Moreover, individuals’
perceptions depend on their characteristics. For example, highly educated people
view themselves as thin when we do not control for BMI in Table 5, but see
themselves as overweight once BMI is held constant in the equation specification.
This implies that people have different comparison groups. In our data, someone who
is 200 pounds is more likely to see himself or herself as overweight if educated and
rich than if poorly educated and on a low income.
Relative weight and obesity spirals
Comparisons thus matter. If it is easier to be fat in a fat society, utility will depend on
relative weight. This seems reminiscent of Clark (2003) and Powdthavee (2006): the
data suggest that it is psychologically preferable to be unemployed in an area where
there are many jobless people.
Avner Offer argues that obesity has been generated by falling food prices12. Yet it is
hard to see how this trigger can be large enough to match the data.
It is possible to think of a model where it is concern for relative weight that leads to
obesity spirals, and where this happens after only small drops in the price of food. In
a world of comparisons, as in Duesenberry (1949), Clark and Oswald (1996) and
Luttmer (2005), people will often emulate each other, so fatness can spread as though
between obesity and depression, and debate whether it is a causal connection. Doll et al (2000) uncover stronger links to physical, rather than emotional, health. 11 Eating influences the flow of calories, and a differential equation thus explains dBMI/dt. 12 Chou et al (2004) examines the role of restaurant-food prices. Gruber and Frakes (2006) are doubtful that the secular decline in smoking is what has raised obesity.
5
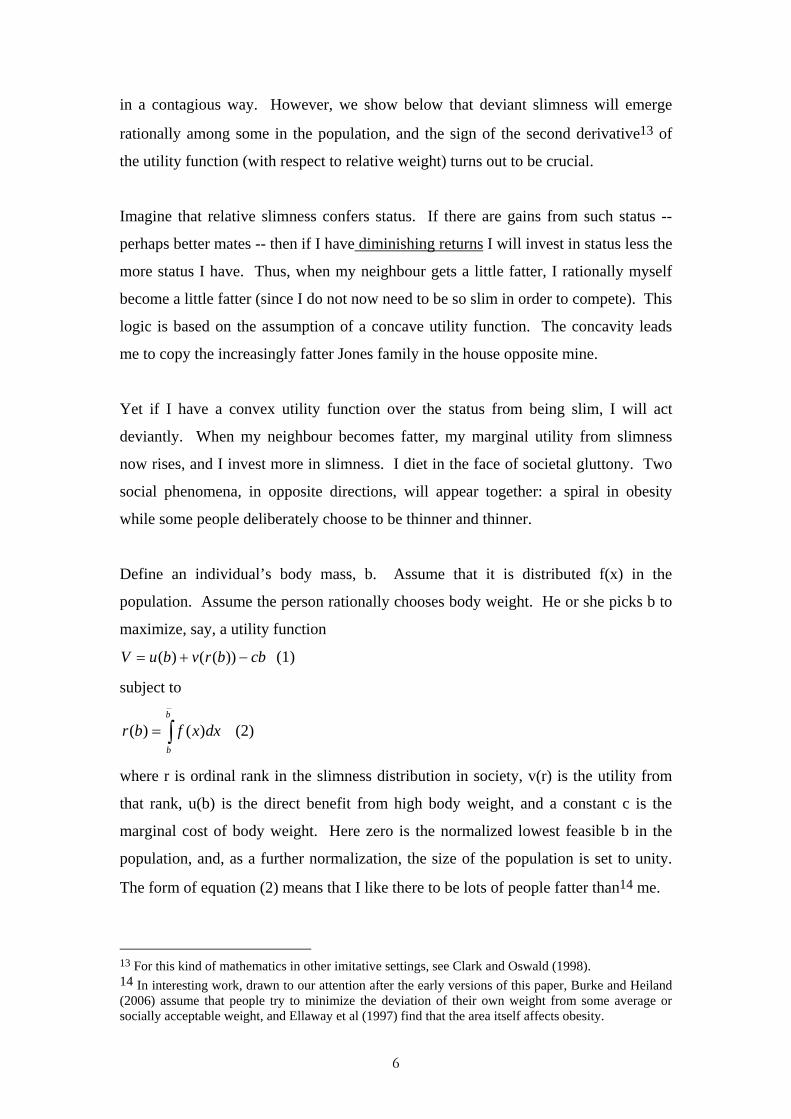
in a contagious way. However, we show below that deviant slimness will emerge
rationally among some in the population, and the sign of the second derivative13 of
the utility function (with respect to relative weight) turns out to be crucial.
Imagine that relative slimness confers status. If there are gains from such status --
perhaps better mates -- then if I have diminishing returns I will invest in status less the
more status I have. Thus, when my neighbour gets a little fatter, I rationally myself
become a little fatter (since I do not now need to be so slim in order to compete). This
logic is based on the assumption of a concave utility function. The concavity leads
me to copy the increasingly fatter Jones family in the house opposite mine.
Yet if I have a convex utility function over the status from being slim, I will act
deviantly. When my neighbour becomes fatter, my marginal utility from slimness
now rises, and I invest more in slimness. I diet in the face of societal gluttony. Two
social phenomena, in opposite directions, will appear together: a spiral in obesity
while some people deliberately choose to be thinner and thinner.
Define an individual’s body mass, b. Assume that it is distributed f(x) in the
population. Assume the person rationally chooses body weight. He or she picks b to
maximize, say, a utility function
cbbrvbuV −+= ))(()( (1)
subject to
∫=b
b
dxxfbr )()( (2)
where r is ordinal rank in the slimness distribution in society, v(r) is the utility from
that rank, u(b) is the direct benefit from high body weight, and a constant c is the
marginal cost of body weight. Here zero is the normalized lowest feasible b in the
population, and, as a further normalization, the size of the population is set to unity.
The form of equation (2) means that I like there to be lots of people fatter than14 me.
13 For this kind of mathematics in other imitative settings, see Clark and Oswald (1998). 14 In interesting work, drawn to our attention after the early versions of this paper, Burke and Heiland (2006) assume that people try to minimize the deviation of their own weight from some average or socially acceptable weight, and Ellaway et al (1997) find that the area itself affects obesity.
6

Offer argues that people act as though they overestimate u(b), the direct benefits of
body weight. Hence they over-eat.
How heavy should I optimally decide to be? There are two natural ways to set up the
individual’s utility maximization problem. If the rank of body mass is what gives
status15 then, using equation (2) within maximand (1), the first-order condition is
0)())(()( =−′−′=∂∂ cbfbrvbu
bV (4)
and thus if society becomes marginally heavier, in the particular sense that the very
highest body weight increases, then, by standard comparative statics, the response of
this rational individual is determined by the sign of the cross-partial
).()())((2
bfbfbrvbb
V ′′−=∂∂
∂ (5)
Someone with a concave utility function will therefore rationally imitate the herd –
thereby becoming fatter too.
An alternative is to imagine that status over being slim comes in a different way, and
depends smoothly on the gap between average weight and one’s own16. Define mean
body mass, m, as:
∫=b
dbbbfm0
.)( (6)
Now take the individual’s maximand to be instead the utility function
,)()( cbbmbuW −−+= µ (7)
so the first-order condition is
.0)()( =−−′−′=∂∂ cbmbu
bW µ (8)
In this case, if society becomes heavier in the sense that the mean of the weight
distribution goes up, rational individuals will imitate if they have a concave utility
function, because
15 As in wages in Brown et al (2005) and a consumption good in Hopkins and Kornienko (2004, 2006). 16 Relative concerns raise questions -- eg, Oswald (1983), Frank (1985) -- about how optimally to design the progressivity of tax schedules.
7

).(2
bmmb
W−′′−=
∂∂∂ µ (9)
Like its equivalent, equation (5), this is positive under concavity. Hence the existence
of imitative keeping-up-with-the-Jones’ in body weight will occur among those with a
utility function that exhibits diminishing marginal utility in relative body weight,
namely, when the right hand side of this function is positive. Obesity spirals up.
Some individuals, though, will diet obsessively. The people who choose to become
slimmer in the face of rising body weights around them will be those with convex
utility functions. If utility convexity in status is more likely close to the top of the
distribution (think of Wimbledon tennis champions, as they move from being ranked
third to second to actually winning the tournament), then anorexic dieting will occur
particularly among the elite in society, because, by being already close to the top, they
have the most to gain.
These ideas on herd behaviour in weight are complementary to, rather than a
substitute for, those of Avner Offer. Perhaps one advantage is that they suggest why
small declines in food prices can have surprisingly large consequences. Moreover,
the emphasis on relativities (here in feelings about weight) 17 fits with the approach of
Richard Easterlin and others that says relative concerns in the utility function are why
western society does not see its citizens reporting rising happiness scores through the
decades.
It is not possible to capture the entire contribution of Offer (2006) by looking at
obesity and food consumption alone. It is too rich a monograph.
Nevertheless, we hope this example gives some of the spirit of the book’s important
general argument. Moreover, these self-control issues of eating and obesity seem
independently interesting, at the time of writing, because they are the subject of public
debate in the industrialized nations.
17 Paradoxically, in this model it is the thin elite who create bad (psychological) ‘externalities’ on others; they make fat people feel lower in status.
8

Conclusion
Most economists welcome affluence. They do not know facts like the rise in GHQ
psychological distress captured in Figure 1. They teach their students -- perhaps more
out of habits of thought than by reference to data -- that life is getting better in
western society.
These economists may be right. Our instinct, however, is different. It is that Avner
Offer’s valuable and darker thesis is largely correct, even though, in our eyes, his
beautifully written book plays down relativities in utility functions rather too much.
Offer instead stresses self-control, and more precisely its absence. Yet if people care
about relative income, and relative body weight, then it seems possible to explain the
observed facts of western society. Approximately flat levels of happiness through
time, and obesity spirals, both emerge from such a theory.
For concreteness, this article has concentrated on one particular area of life: eating
and food. We have provided simple evidence that happiness and mental health are
worse among fatter people in Britain and Germany; that half the population see
themselves as overweight; and that, for any given level of body mass index (BMI), a
person’s perception of whether they are over-weight depends on their education and
income. More evidence on the interesting Offer thesis, especially longitudinally on
behaviours such as eating, and on the possible existence of hyperbolic discounting, is
needed. This will allow deep questions of causality to be studied. But it already
seems unwise to presume that affluence is making us happier.
9

References
Banks, J., Marmot, M., Oldfield, Z. and Smith, J.P. (2006). ‘The SES health gradient
on both sides of the Atlantic’. National Bureau of Economic Research Paper #12674.
Bhattacharya, J. and Bundorf, K.M. (2005). ‘The incidence of the healthcare costs of obesity’. National Bureau of Economic Research Paper #11303.
Blanchflower, D.G. and Oswald, A.J. (2004). ‘Well-being over time in Britain and the USA’. Journal of Public Economics, vol. 88, pp.1359-1386.
Brown, G.D.A., Gardner, J., Oswald, A.J. and Qian, J. (2005). ‘Does wage rank affect workers’ well-being?’ Working paper, Warwick University.
Burke, M. and Heiland, F. (2006). ‘Social dynamics of obesity’. Working paper, Federal Reserve Bank of Boston, Discussion paper 06-5.
Burkhauser, R.V. and Cawley, J. (2004). ‘Obesity, disability, and movement onto the disability insurance rolls’. Working paper, Cornell University.
Cawley, J. (2004). ‘The impact of obesity on wages’. Journal of Human Resources, vol. 39, pp. 451-474.
Chou, S.Y., Grossman, M. and Saffer, H. (2004). ‘An economic analysis of adult obesity: results from the Behavioral Risk Factor Surveillance System’, Journal of Health Economics, vol. 23, pp. 565-587.
Clark, A.E. (2003). ‘Unemployment as a social norm: Psychological evidence from panel data’. Journal of Labor Economics, vol. 21, pp.323-351.
Clark, A.E. & Oswald, A.J. (1994). Unhappiness and unemployment. Economic Journal, vol. 104, pp.648-659.
Clark, A.E. and Oswald, A.J. (1996). ‘Satisfaction and comparison income’. Journal of Public Economics, vol. 61, pp.359-381.
Clark, A.E. and Oswald, A.J. (1998). ‘Comparison-concave utility and following behaviour in social and economic settings’. Journal of Public Economics, vol. 70, pp.133-150.
Cornelisse-Vermaat, J.R., Antonides, G., Van Ophem, J.A.C., and Van Den Brink, H.M. (2006). ‘Body mass index, perceived health, and happiness: Their determinants and structural relationships’. Social Indicators Research, vol. 79, pp.143-158.
Cutler, D.M., Glaeser, E.L., and Shapiro, J.M. (2003). ‘Why have Americans become more obese?’ Journal of Economic Perspectives, vol. 17, pp.93-118.
Di Tella, R., MacCulloch, R.J. and Oswald, A.J. (2001). ‘Preferences over inflation and unemployment: Evidence from surveys of happiness.’ American Economic Review, vol. 91, pp.335-341.
Doll, H.A., Petersen, S.E.K. and Stewart-Brown, S.L. (2000). ‘Obesity and physical and emotional well-being: Associations between BMI, chronic illness, and the physical and mental components of the SF-36 questionnaire.’ Obesity Research, vol. 8, pp.160-170.
Duesenberry, J.S. (1949). Income, saving and the theory of consumer behavior. Cambridge, MA: Harvard University Press.
Easterlin, R.A. (1974). ‘Does economic growth improve the human lot? Some empirical evidence.’ In P.A. David and M. W. Reder (Eds.), Nations and households in economic growth: Essays in Honor of Moses Abramowitz. New York: Academic Press.
Easterlin, R.A. (2003). ‘Explaining happiness.’ Proceedings of the National Academy of Sciences, vol. 100, pp.11176-11183.
10

Ellaway, J. Anderson, A and Macintyre, S. (1997). ‘Does area of residence affect body size and shape?’ International Journal of Obesity, vol. 21, pp.304-308.
Felton, A. and Graham, C. (2005). ‘Variance in obesity across cohorts and countries: A norms-based explanation using happiness surveys.’ Working paper, Brookings Institution, Washington.
Finkelstein, E.A., Ruhm, C.J. and Kosa, K.M. (2005). ‘Economic causes and consequences of obesity’. Annual Review of Public Health, vol.26, pp. 239-257.
Frank, R.H. (1985). Choosing the right pond: Human behaviour and the quest for status. Oxford University Press: London.
Frey, B.S. and Stutzer, A. (2000). ‘Happiness, economy and institutions’. Economic Journal, vol. 110, pp.918-938.
Gardner, J. and Oswald A.J. (2006). ‘Do divorcing couples become happier by breaking up?’ Journal of the Royal Statistical Society (Series A), vol.169. pp. 319-336.
Gardner, J. and Oswald A.J. (2007). ‘Money and mental wellbeing: A longitudinal study of medium-sized lottery wins’. Journal of Health Economics, vol.26., pp. 49-60.
Gilbert D. (2006). Stumbling on happiness. Alfred A Knopf: New York. Gilbert, D.T., Driver-Linn, E. and Wilson, T.D. (2002). ‘The trouble with Vronsky:
Impact bias in the forecasting of future affective states.’ In L. Feldman-Barrett and P. Salvoney (Eds.) The Wisdom of Feeling, Guilford, New York.
Gilbert, D. T., Pinel, E. C., Wilson, T. D., Blumberg, S. J., and Wheatley, T. (1998). ‘Immune neglect: A source of durability bias in affective forecasting.’ Journal of Personality and Social Psychology, vol. 75, pp.617-638.
Goldberg, D.P., Gater, T., Sartorious, N., Ustun, T.B., Piccinelli, M., Gureje, O. and Rutter, C. (1997). ‘The validity of two versions of the GHQ in the WHO study of mental illness in general health care’. Psychological Medicine, vol. 27, pp.191-197.
Gruber, J. and Frakes, M. (2006). ‘Does falling smoking lead to rising obesity?’, Journal of Health Economics, vol. 25, pp.183-197.
Harper, B. (2000). ‘Beauty, stature and the labour market: A British cohort study’, Oxford Bulletin of Economics and Statistics, vol. 62, pp. 771-784.
Hawkins, D.N. and Booth, A. (2005). ‘Unhappily ever after: Effects of long-term, low-quality marriages on well-being’. Social Forces, vol. 84, pp.451-471.
Hodiamont, P.P.G., Rijnders, C.A.T., Mulder, J. and Furer, J.W. (2005). ‘Psychiatric disorders in a Dutch Health Area: a repeated cross-sectional survey.’ Journal of Affective Disorders, vol. 84, pp.77-83.
Hopkins, E. and Kornienko, T. (2004). ‘Running to keep in the same place: Consumer choice as a game of status’. American Economic Review, vol. 94, pp.1085-1107.
Hopkins, E. and Kornienko, T. (2006). ‘Methods of social comparison in games of status.’ Working paper, University of Edinburgh.
Jorm, A.F., Korten, A.E., Christensen, H., Jacomb, P.A., Rodgers, B. and Parslow, R.A. (2003). ‘Association of obesity with anxiety, depression and emotional well-being: A community survey’. Australian and New Zealand Journal of Public Health, vol. 27, pp. 434-440.
Kenkel, D., Lillard, D. and Mathios, A. (2006). ‘The roles of high school completion and GED receipt in smoking and obesity’, Journal of Labor Economics, vol. 24, pp.635-660.
11

Levi, F., La Vecchia, C., Lucchini, F., Negri, E., Saxena, S., Maulik, P.K., and Saraceno, B. (2003). ‘Trends in mortality from suicide, 1965-99’, Acta Psychiatrica Scandinavica, vol. 108, pp.341-349.
Luttmer, E.F.P. (2005). ‘Neighbors as negatives: Relative earnings and well-being’. Quarterly Journal of Economics, vol. 120, pp.963-1002.
Morris, S. (2006). ‘Body mass index and occupational attainment’. Journal of Health Economics, vol. 25, pp. 347-364.
Offer, A. (1998). ‘Epidemics of abundance: Overeating and slimming in the USA and Britain since the 1950s’. Oxford University Discussion Papers in Economic and Social History, number 25.
Offer, A. (2001). ‘Body weight and self-control in the United States and Britain since the 1950s’. Social History of Medicine, vol. 14, pp.79-106.
Offer, A. (2006). The Challenge of Affluence: Self-Control and Well-being in the United States and Britain Since 1950, Oxford University Press, Oxford.
Oswald, A.J. (1983). ‘Altruism, jealousy and the theory of optimal non-linear taxation. Journal of Public Economics, vol. 20, pp.77-87.
Oswald, A.J. (1997). ‘Happiness and economic performance’. Economic Journal, vol. 107, pp.1815-1831.
Oswald, A.J. and Powdthavee, N. (2005). ‘Does happiness adapt? Longitudinal evidence on disability with implications for economists and judges’. Working paper, Warwick University.
Powdthavee, N. (2005a). ‘Unhappiness and crime: Evidence from South Africa’. Economica, vol. 72, pp.531-547.
Powdthavee, N. (2005b). ‘Putting a price tag on friends, relatives and neighbours: Using surveys of life satisfaction to value social relationships’. Working paper, Institute of Education, London.
Powdthavee, N. (2006). ‘Are there geographical variations in the psychological costs of unemployment in South Africa?’ Social Indicators Research, forthcoming.
Propper, C. (2005). ‘Why economics is good for your health – 2004 RES Public Lecture’. CMPO paper 05/116, Bristol University.
Roberts, R.E., Kaplan, G.A., Shema, S.J. and Strawbridge, W.J. (2000). ‘Are the obese at greater risk of depression?’ American Journal of Epidemiology, vol. 152, pp.163-170.
Roberts, R.E., Strawbridge, W.J., Deleger, S. and Kaplan, G.A. (2002). ‘Are the fat more jolly?’ Annals of Behavioral Medicine, vol. 24, pp.169-180.
Ruhm,C.J. (2005). ‘Healthy living in hard times’. Journal of Health Economics, vol. 24, pp.341-263.
Sacker, A. and Wiggins, R.D. (2002). ‘Age-period-cohort effects on inequalities in psychological distress’. Psychological Medicine, vol. 32, pp.977-990.
Sanz-de-Galdeano, A. (2005). ‘The obesity epidemic in Europe’. IZA Discussion paper 1814.
Sargent, J.D. and Blanchflower, D.G. (1994). ‘Obesity and stature in adolescence and earnings in young adulthood – Analysis of a British birth cohort’, Archives of Pediatrics & Adolescent Medicine, vol. 148, p.681-687.
Simon, G.E., Von Korff, M., Saunders, K., Miglioretti, D.L., Crane, P.K., van Belle, G., amd Kessler, R.C. (2006). ‘Association between obesity and psychiatric disorders in the US adult population’, Archives of General Psychiatry, vol. 63, pp.824-830.
12

Stevenson, B. and Wolfers, J. (2006). ‘Bargaining in the shadow of the law: Divorce laws and family distress.’ Quarterly Journal of Economics, vol. 121, pp. 267-288.
Stunkard, A.J., Faith, M.S. and Allison, K.C. (2003). ‘Depression and obesity’. Biological Psychiatry, vol. 54, pp. 330-337.
Stutzer, A. (2006). ‘When temptation overwhelms will-power: Obesity and happiness’. Working paper, University of Basel.
Van Praag, B. and Ferrer-I-Carbonell, A. (2004). Happiness Quantified: A Satisfaction Calculus Approach, Oxford University Press, Oxford.
Verhaak, P.F.M., Hoeymans, N. and Westert, G.P. (2005). ‘Mental health in the Dutch population and in general practice: 1987-2001’, British Journal of General Practice, vol. 55, pp.770-775.
Winkelmann, L. and Winkelmann, R. (1998). ‘Why are the unemployed so unhappy?’ Evidence from panel data’. Economica, vol. 65, pp.1-15.
13

Figure 1: Average GHQ Psychological Distress Levels Over Time in Britain: BHPS, 1991-2004
10.90
10.95
11.00
11.05
11.10
11.15
11.20
11.25
11.30
Ave
rage
GH
Q-1
2 (li
kert
)
1991-1994 1995-1999 2000-2004
Note: A GHQ score is a standard measure of psychological ill-health. It amalgamates answers to 12 separate mental-distress questions: “Have you lost much sleep over worry?”; “Been able to concentrate on things?”; “Felt you are playing a useful part in things?”; “Felt capable of making decisions about things?”; “Felt constantly under strain?”; “Felt you could not overcome your difficulties?”; “Been able to enjoy your normal day-to-day activities”; “Been able to face up to your problems”; “Been feeling unhappy and depressed?”; “Been losing confidence in yourself?”; “Been thinking of yourself as a worthless person?”; “Been feeling reasonably happy all things considered?”. These data are on representative samples of Britons, from the British Household Panel Surveys (BHPS).
14

Table 1: British Life-Satisfaction Regression Equations including a Body Mass Index Variable (BMI), BHPS 2004
Dependent variable: Life satisfaction (1) (2) (3) (4) Body Mass Index -0.009 -0.009 -0.007 -0.008 [0.003]** [0.003]** [0.003]** [0.003]** Male 0.025 -0.024 -0.025 [0.021] [0.022] [0.023] Age -0.013 -0.025 -0.025 [0.004]** [0.005]** [0.005]** Age-squared/100 0.020 0.029 0.029 [0.004]** [0.005]** [0.005]** Living as couple -0.076 -0.075 [0.039]* [0.040] Widowed -0.437 -0.437 [0.060]** [0.060]** Divorced -0.513 -0.498 [0.057]** [0.058]** Separated -0.714 -0.690 [0.094]** [0.098]** Never married -0.356 -0.345 [0.042]** [0.043]** Unemployed -0.531 -0.492 [0.085]** [0.087]** Self-employed 0.058 0.091 [0.039] [0.041]* Retired -0.105 -0.062 [0.051]* [0.053] Student 0.101 0.115 [0.066] [0.069] Disabled -1.182 -1.142 [0.073]** [0.075]** Look after home -0.214 -0.185 [0.053]** [0.055]** Household size -0.042 -0.027 [0.012]** [0.012]* Own home outright 0.183 0.174 [0.032]** [0.033]** Log of household income 0.087 [0.021]** Constant 5.474 5.606 6.280 5.441 [0.074]** [0.099]** [0.159]** [0.252]** Education dummies included No No Yes Yes Regional dummies included No No Yes Yes # Observations 12616 12616 12616 12127 R-squared 0.0000 0.0100 0.0900 0.0900 Robust standard errors in brackets * significant at 5%; ** significant at 1%
Notes: Each of the four columns is a separate regression equation. The first column has only BMI as an independent variable; the fourth column includes all the variables shown. The mean (s.d.) of BMI is 25.9 (4.7). The mean (s.d.) of life satisfaction, which is reported on a scale from 1 to 7, is 5.2 (1.3). For pedagogical purposes, these and later regressions are estimated by ordinary least squares and assume a cardinal dependent variable that takes the values 1, 2, 3, ... Ordered estimators give similar results. The omitted reference groups here are the married and those in full-time employment.
15

Table 2: German Life-Satisfaction Regression Equations including a Body Mass
Index Variable (BMI), GSOEP 2002
Dependent variable: Life satisfaction (1) (2) (3) (4) Body Mass Index -0.030 -0.024 -0.015 -0.010 [0.003]** [0.003]** [0.003]** [0.003]** Male 0.030 -0.057 -0.074 [0.019] [0.020]** [0.019]** Age -0.012 -0.060 -0.057 [0.004]** [0.006]** [0.006]** Age-squared/100 0.008 0.061 0.059 [0.004] [0.006]** [0.006]** Single -0.277 -0.134 [0.042]** [0.042]** Widowed -0.363 -0.173 [0.061]** [0.062]** Divorced -0.523 -0.300 [0.054]** [0.054]** Separated -1.171 -0.914 [0.114]** [0.113]** Unemployed -0.261 -0.154 [0.029]** [0.028]** High school 0.277 0.216 [0.035]** [0.034]** More than high school 0.577 0.395 [0.041]** [0.041]** Disabled -0.809 -0.773 [0.046]** [0.045]** Log of household income 0.454 [0.023]** Constant 7.81 8.022 8.754 3.79 [0.076]** [0.099]** [0.190]** [0.311]** Regional dummies included No No Yes Yes # Observations 23643 23643 23643 23636 R-squared 0.01 0.01 0.09 0.11 Robust standard errors in brackets * significant at 5%; ** significant at 1%
Notes: The mean (s.d.) of BMI is 25.2 (4.3). The mean (s.d.) of life satisfaction, which is reported on a scale from 1 to 10, is 7.0 (1.7). Reference groups are married, in full-time employment, and less than high school education. The data are from the German Socioeconomic Panel Surveys (GSOEP).
16

Table 3: British Psychological-Distress GHQ Regression Equations including a Body Mass Index Variable (BMI), BHPS 2004
Dependent variable: GHQ-12 (likert) (1) (2) (3) (4) Body Mass Index 0.046 0.044 0.028 0.028 [0.013]** [0.013]** [0.012]* [0.012]* Male -1.441 -1.239 -1.230 [0.092]** [0.099]** [0.101]** Age 0.051 0.033 0.032 [0.015]** [0.020] [0.021] Age-squared/100 -0.042 -0.032 -0.031 [0.015]** [0.021] [0.021] Living as couple 0.183 0.156 [0.182] [0.187] Widowed 0.665 0.653 [0.241]** [0.242]** Divorced 0.490 0.461 [0.246]* [0.252] Separated 1.542 1.521 [0.445]** [0.463]** Never married -0.008 -0.054 [0.182] [0.187] Unemployed 2.167 2.130 [0.365]** [0.380]** Self-employed -0.196 -0.160 [0.175] [0.182] Retired 0.512 0.394 [0.210]* [0.213] Student -0.134 -0.190 [0.292] [0.303] Disabled 5.187 5.051 [0.323]** [0.330]** Look after home 1.155 1.089 [0.231]** [0.238]** Household size -0.003 -0.039 [0.045] [0.048] Own home outright -0.421 -0.390 [0.128]** [0.130]** Log of household income -0.197 [0.093]* Constant 9.973 9.338 9.741 11.567 [0.330]** [0.420]** [0.685]** [1.104]** Education dummies included No No Yes Yes Regional dummies included No No Yes Yes # Observations 12436 12436 12436 11962 R-squared 0.0000 0.0200 0.0700 0.0700 Robust standard errors in brackets * significant at 5%; ** significant at 1%
Notes: The mean (s.d.) of BMI is 25.9 (4.7). The mean (s.d.) of GHQ distress, which is measured on a scale from 1 to 36, is 11.2 (5.4). Reference groups are married and in full-time employment.
17
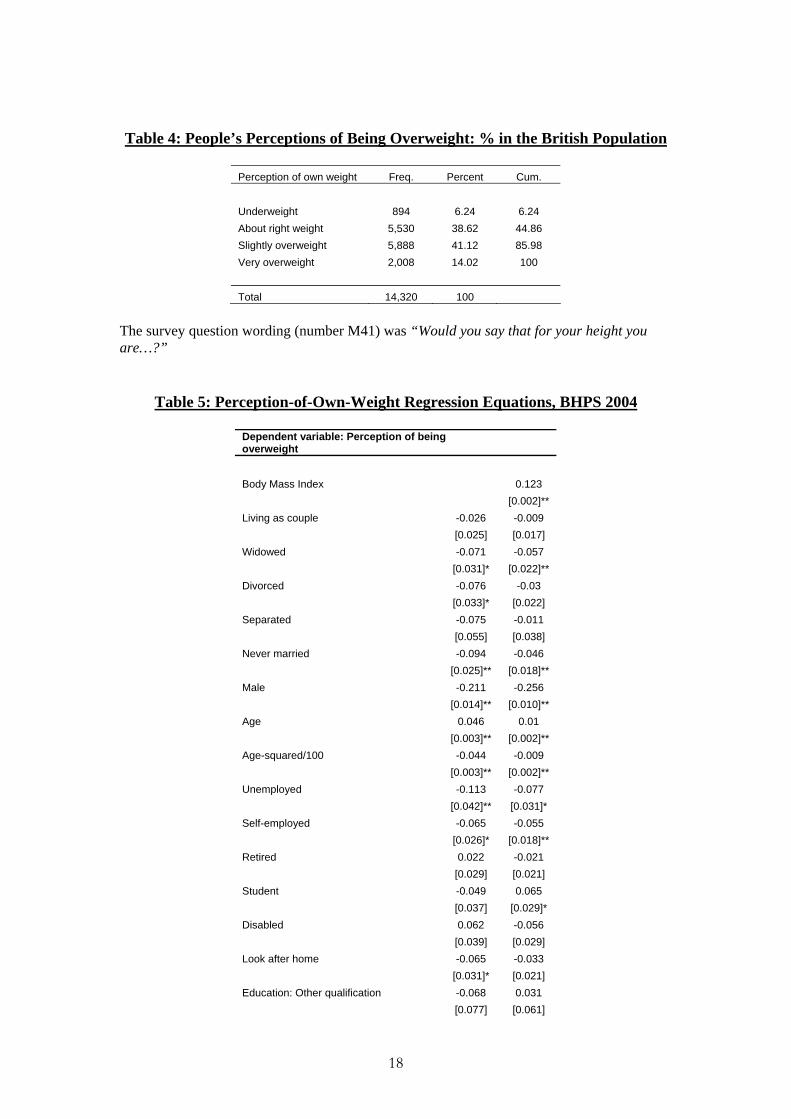
Table 4: People’s Perceptions of Being Overweight: % in the British Population
Perception of own weight Freq. Percent Cum. Underweight 894 6.24 6.24 About right weight 5,530 38.62 44.86 Slightly overweight 5,888 41.12 85.98 Very overweight 2,008 14.02 100
Total 14,320 100
The survey question wording (number M41) was “Would you say that for your height you are…?”
Table 5: Perception-of-Own-Weight Regression Equations, BHPS 2004
Dependent variable: Perception of being overweight
Body Mass Index 0.123 [0.002]** Living as couple -0.026 -0.009 [0.025] [0.017] Widowed -0.071 -0.057 [0.031]* [0.022]** Divorced -0.076 -0.03 [0.033]* [0.022] Separated -0.075 -0.011 [0.055] [0.038] Never married -0.094 -0.046 [0.025]** [0.018]** Male -0.211 -0.256 [0.014]** [0.010]** Age 0.046 0.01 [0.003]** [0.002]** Age-squared/100 -0.044 -0.009 [0.003]** [0.002]** Unemployed -0.113 -0.077 [0.042]** [0.031]* Self-employed -0.065 -0.055 [0.026]* [0.018]** Retired 0.022 -0.021 [0.029] [0.021] Student -0.049 0.065 [0.037] [0.029]* Disabled 0.062 -0.056 [0.039] [0.029] Look after home -0.065 -0.033 [0.031]* [0.021] Education: Other qualification -0.068 0.031 [0.077] [0.061]
18

Education: Apprenticeship 0.036 0.052 [0.048] [0.035] Education: CSE grade 2-5 0.026 0.076 [0.045] [0.034]* Education: Commercial qf, no O-level 0.081 0.072 [0.047] [0.033]* Education: GCE O-level 0.008 0.062 [0.024] [0.017]** Education: GCE A-level 0.025 0.083 [0.027] [0.019]** Education: Nursing qualification 0.069 0.049 [0.066] [0.045] Education: Other HE qf -0.014 0.058 [0.023] [0.017]** Education: Teaching qualification -0.032 0.057 [0.044] [0.031] Education: First degree -0.052 0.094 [0.028] [0.020]** Education: Higher degree -0.114 0.067 [0.042]** [0.031]* Household size 0.01 0.009 [0.007] [0.004]* Own home outright -0.021 0.008 [0.018] [0.012] Log of household income 0.011 0.019 [0.013] [0.009]* Constant 0.538 -1.935 [0.152]** [0.119]**
Regional dummies included Yes Yes # Observations 13717 12057
R-squared 0.08 0.58
Robust standard errors in brackets
* significant at 5%; ** significant at 1%
Notes: The mean (s.d.) of BMI is 25.9 (4.7). The mean (s.d.) of overweight perception is 1.6 (0.8). Reference groups are married, in full-time employment, and less than high-school education
19