Obesity occurs when over a long period of time energy ... · Obesity occurs when over a long period...
28
Draft of the Strategy and the Care Pathway for Children with Excess Weights has been circulated Several of you have been quite involved in the development of one or both of these but there are others who are new to this. I will give an overview of the documents now so that: •everyone is briefed and has a similar understanding before we go into the workshop part of the afternoon. •questions and queries can be raised The Strategy. This has 4 main sections and we will look at each of these during the course of the afternoon 1.Making the case for action 2.What is happening in Hampshire 3.Recommendations for 2012 onward. 4.The Action Plan 5.Appendices 1
Transcript of Obesity occurs when over a long period of time energy ... · Obesity occurs when over a long period...

Draft of the Strategy and the Care Pathway for Children with Excess
Weights has been circulated
Several of you have been quite involved in the development of one or both
of these but there are others who are new to this.
I will give an overview of the documents now so that:
•everyone is briefed and has a similar understanding before we go into the
workshop part of the afternoon.
•questions and queries can be raised
The Strategy. This has 4 main sections and we will look at each of these
during the course of the afternoon
1.Making the case for action
2.What is happening in Hampshire
3.Recommendations for 2012 onward.
4.The Action Plan
5.Appendices
1

Obesity occurs when over a long period of time energy intake is greater than
energy expenditure. The expert report on obesity presented an obesity
system map showing over 100 variables with have an influence on energy
balance. These are presented as seven cross cutting themes in this
simplified diagram
1.Biology: an individuals starting point; the influence of genetics and ill health.
2.Activity environment: the influence of the environment on an individual‟s activity behaviour
e.g. a decision to cycle to school may be influenced by road safety, or provision of secure
cycle shelters.
3.Physical Activity: the type, frequency and intensity of activities an individual carries out.
4.Societal influences e.g. the influence of culture and media, education and peer pressure
on food and activity behaviours.
5.Individual psychology e.g. a person‟s individual psychological drive for particular foods
and physical activities.
6.Food environment: the influence of the food environment on an individual‟s food choices
e.g. a decision to eat more fruit and vegetables may be influenced by the availability and
quality of fruit and vegetables.
7.Food consumption: the quality, quantity (portion sizes) and frequency (snacking patterns)
of an individual‟s diet.
2
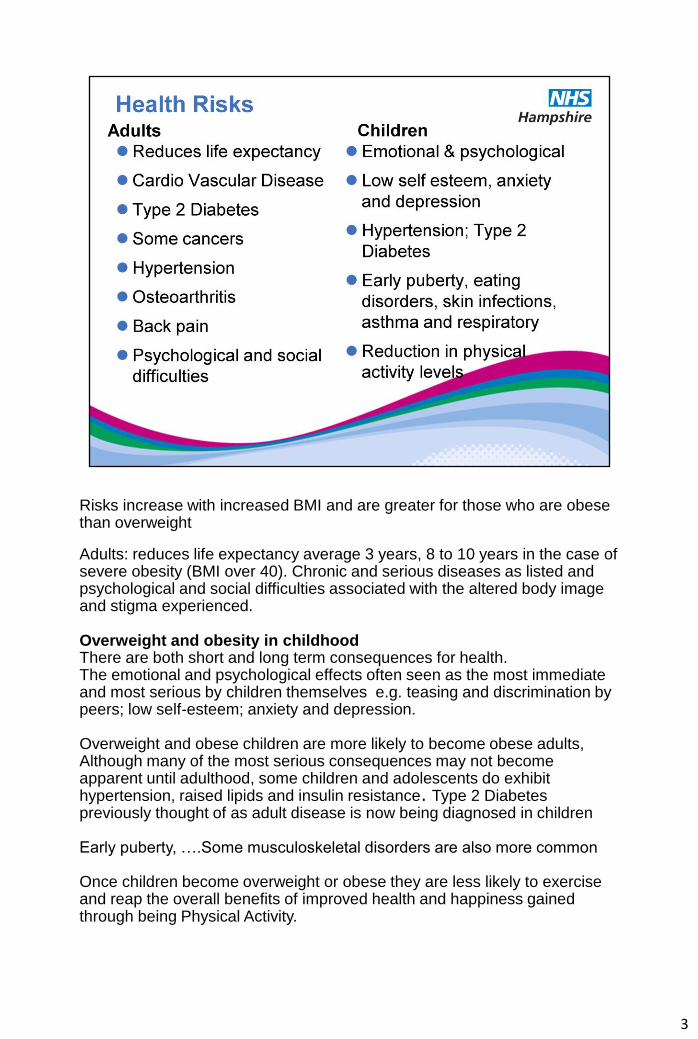
Risks increase with increased BMI and are greater for those who are obese than overweight
Adults: reduces life expectancy average 3 years, 8 to 10 years in the case of severe obesity (BMI over 40). Chronic and serious diseases as listed and psychological and social difficulties associated with the altered body image and stigma experienced. Overweight and obesity in childhood There are both short and long term consequences for health. The emotional and psychological effects often seen as the most immediate and most serious by children themselves e.g. teasing and discrimination by peers; low self-esteem; anxiety and depression. Overweight and obese children are more likely to become obese adults, Although many of the most serious consequences may not become apparent until adulthood, some children and adolescents do exhibit hypertension, raised lipids and insulin resistance. Type 2 Diabetes previously thought of as adult disease is now being diagnosed in children Early puberty, ….Some musculoskeletal disorders are also more common Once children become overweight or obese they are less likely to exercise and reap the overall benefits of improved health and happiness gained through being Physical Activity.
3
Once established, obesity is notoriously difficult to treat, so prevention and early intervention are very important.
3
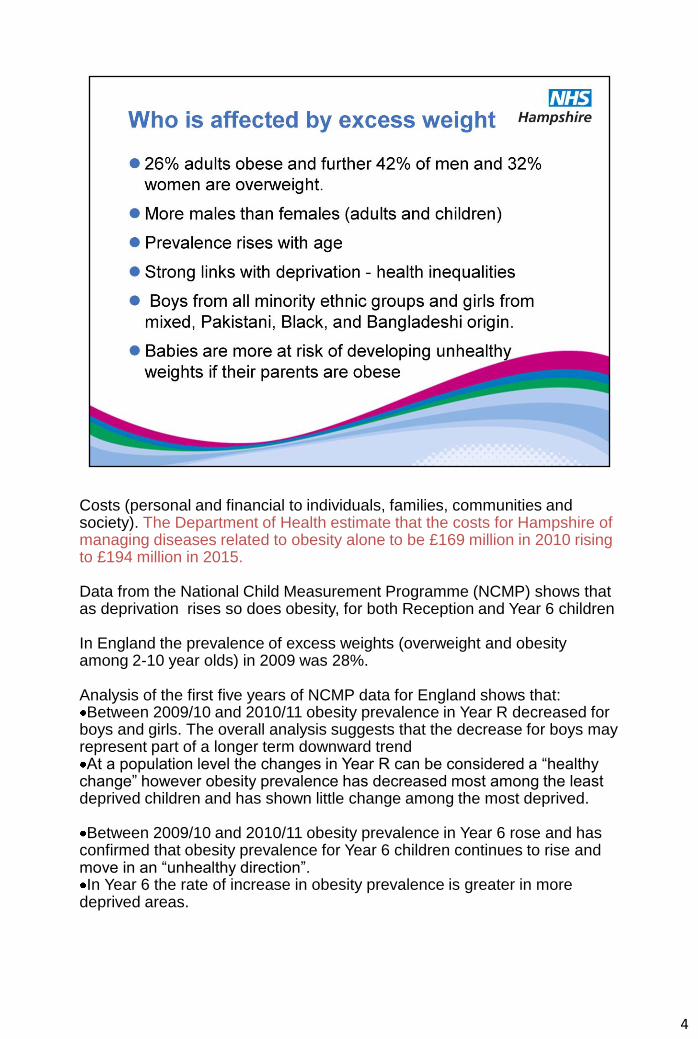
Costs (personal and financial to individuals, families, communities and society). The Department of Health estimate that the costs for Hampshire of managing diseases related to obesity alone to be £169 million in 2010 rising to £194 million in 2015. Data from the National Child Measurement Programme (NCMP) shows that as deprivation rises so does obesity, for both Reception and Year 6 children In England the prevalence of excess weights (overweight and obesity among 2-10 year olds) in 2009 was 28%. Analysis of the first five years of NCMP data for England shows that: Between 2009/10 and 2010/11 obesity prevalence in Year R decreased for
boys and girls. The overall analysis suggests that the decrease for boys may represent part of a longer term downward trend At a population level the changes in Year R can be considered a “healthy
change” however obesity prevalence has decreased most among the least deprived children and has shown little change among the most deprived. Between 2009/10 and 2010/11 obesity prevalence in Year 6 rose and has
confirmed that obesity prevalence for Year 6 children continues to rise and move in an “unhealthy direction”. In Year 6 the rate of increase in obesity prevalence is greater in more
deprived areas.
4

Reducing levels of excess weight (overweight and obesity) in both children
and adults remain a priority and Healthy Lives, Healthy People: A call to
action on obesity in England (2011) describes this government‟s strategy
and ambition to sustain a downward trend in excess weights by 2020. The
main components of the strategy are listed.
•Empowering individuals through the provision of guidance, information and
tailored support- “equipping people to make the best choices”. Giving partners the opportunity to play their part through e.g. the
Responsibility Deal and Change4Life. Giving Local Government through its public health responsibilities the lead
role locally. To build the evidence base, including effectiveness and cost effectiveness
and promote the spread of good practice and full use of the evidence.
Outcomes Framework for England 2013-2016 includes health improvement
indicators that will demonstrate the progress being made towards a
reduction in excess weights at a local level. They include breast feeding
initiation rates; breast feeding prevalence at 6-8 weeks; excess weights in 4-
5 year olds and 10-11 year olds; diet and physical activity measures in
adults and excess weights in adults.
5

Health related social marketing is the systematic application of commercial
marketing concepts and techniques to achieve specific behavioural goals
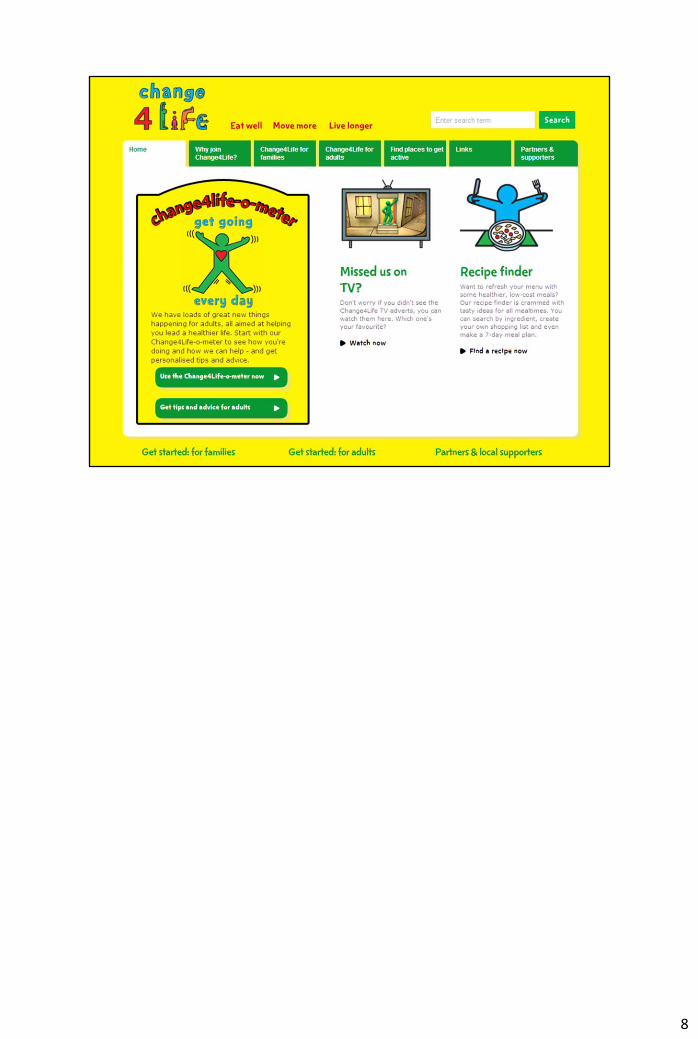
relevant to improving health and reducing health inequalities. Over the last three years the „Change4Life‟ (www.change4life.com) social
marketing programme originally developed as part of the childhood obesity
prevention strategy has been successful in gaining high levels of brand
recognition (88%) and can demonstrate high levels of trust in the brand by
the target population and frontline staff. The programme has promoted the
following simple behavioural change messages that families find acceptable:
Sugar swaps (swapping high sugar items for low sugar items) Meal time (eating regular meals) 5 A DAY Cut back fat Me size meals (serving children correct portion size – i.e. child size not
adult) Snack check (setting a limit on snacks and treats) Up and about (moving more and setting a limit of 2 hours „screen time‟) 60 active minutes (encouraging children to be active; minimum of 60
minutes per day)
Start4Life www.start4life.com is a sister brand of Change4Life aimed at
families with children under 2 years.
6

Home Page of the website for Start4Life to give an idea of the approach and style
6 simple messages BF; introduction of food and physical activity
8

9
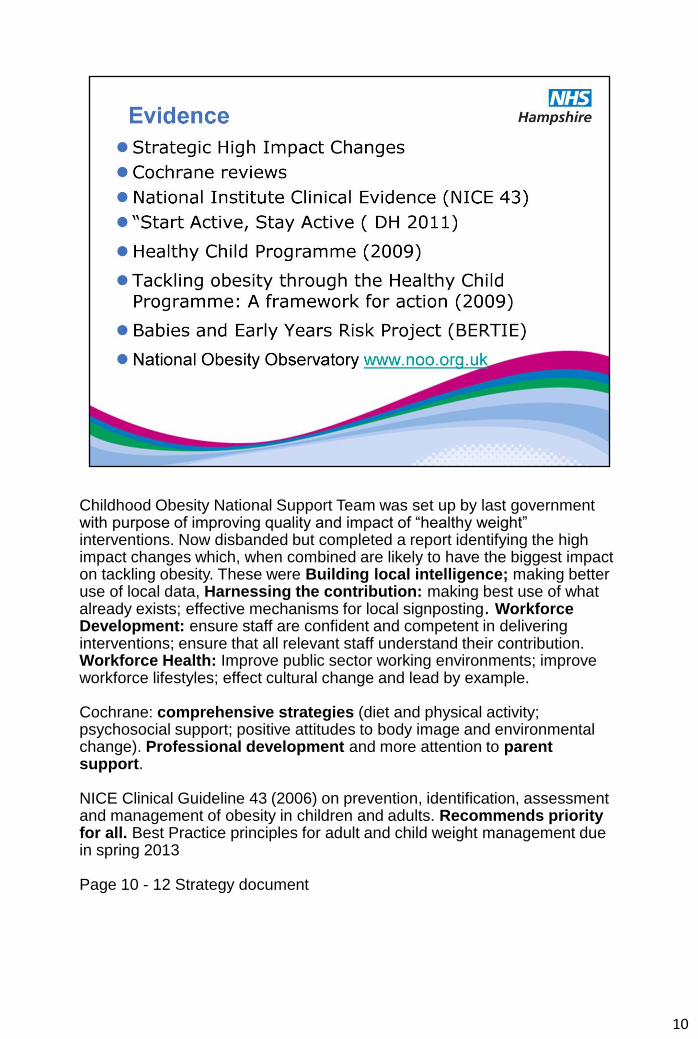
Childhood Obesity National Support Team was set up by last government with purpose of improving quality and impact of “healthy weight” interventions. Now disbanded but completed a report identifying the high impact changes which, when combined are likely to have the biggest impact on tackling obesity. These were Building local intelligence; making better use of local data, Harnessing the contribution: making best use of what already exists; effective mechanisms for local signposting. Workforce Development: ensure staff are confident and competent in delivering interventions; ensure that all relevant staff understand their contribution. Workforce Health: Improve public sector working environments; improve workforce lifestyles; effect cultural change and lead by example. Cochrane: comprehensive strategies (diet and physical activity; psychosocial support; positive attitudes to body image and environmental change). Professional development and more attention to parent support. NICE Clinical Guideline 43 (2006) on prevention, identification, assessment and management of obesity in children and adults. Recommends priority for all. Best Practice principles for adult and child weight management due in spring 2013 Page 10 - 12 Strategy document
10
11

What you think is driving the increased levels of excess weight / obesity in Hampshire?
12
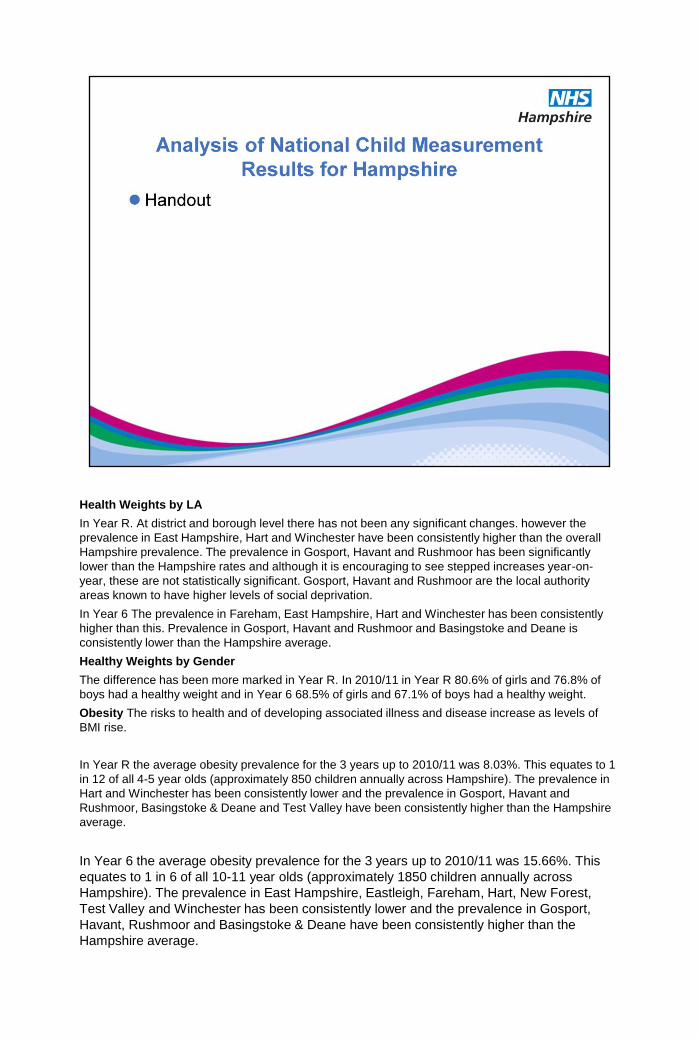
Health Weights by LA
In Year R. At district and borough level there has not been any significant changes. however the
prevalence in East Hampshire, Hart and Winchester have been consistently higher than the overall
Hampshire prevalence. The prevalence in Gosport, Havant and Rushmoor has been significantly
lower than the Hampshire rates and although it is encouraging to see stepped increases year-on-
year, these are not statistically significant. Gosport, Havant and Rushmoor are the local authority
areas known to have higher levels of social deprivation.
In Year 6 The prevalence in Fareham, East Hampshire, Hart and Winchester has been consistently
higher than this. Prevalence in Gosport, Havant and Rushmoor and Basingstoke and Deane is
consistently lower than the Hampshire average.
Healthy Weights by Gender
The difference has been more marked in Year R. In 2010/11 in Year R 80.6% of girls and 76.8% of
boys had a healthy weight and in Year 6 68.5% of girls and 67.1% of boys had a healthy weight.
Obesity The risks to health and of developing associated illness and disease increase as levels of
BMI rise.
In Year R the average obesity prevalence for the 3 years up to 2010/11 was 8.03%. This equates to 1
in 12 of all 4-5 year olds (approximately 850 children annually across Hampshire). The prevalence in
Hart and Winchester has been consistently lower and the prevalence in Gosport, Havant and
Rushmoor, Basingstoke & Deane and Test Valley have been consistently higher than the Hampshire
average.
In Year 6 the average obesity prevalence for the 3 years up to 2010/11 was 15.66%. This
equates to 1 in 6 of all 10-11 year olds (approximately 1850 children annually across
Hampshire). The prevalence in East Hampshire, Eastleigh, Fareham, Hart, New Forest,
Test Valley and Winchester has been consistently lower and the prevalence in Gosport,
Havant, Rushmoor and Basingstoke & Deane have been consistently higher than the
Hampshire average.


The LAA targets for NCMP coverage and obesity prevalence for each year of the plan were achieved.
Local analysis of the NCMP data has been shared with Local Authorities and Schools to inform priorities and development of services.
The Hampshire „Cook & Eat‟ Programme (Groups of families experiencing healthy eating and cooking together) was evaluated well and had 3,638 direct beneficiaries.
The „Cook & Eat‟ Programme was adapted for use in Early Years settings; 18 Children‟s Centres ran the course and it has been adopted as the recommended model for all Children‟s Centres across Hampshire.
Local supporters from a range of partners across Hampshire signed up to „Change4Life‟ campaign and „Change4Life‟ events were targeted to schools with high rates of excess weights
Breastfeeding support programmes commissioned from the voluntary sector in populations with low breast feeding rates. The outcomes of these programmes will be evaluated and reported.
„Healthy Weight Coordinator Posts‟ in the 3 areas with highest rates of excess weights. Evaluation of these posts showed: an increased awareness and focus on the issue of obesity and its related determinants; they facilitated networking across frontline services and brought resources including training and development to those areas.
Increase in school meal uptake
Increase in take up of physical activity and sport in Hampshire schools
Maternity Units and Health Visiting Providers committed to achieving the WHO „Baby Friendly Initiative‟ standard to improve breast feeding rates by 2013
Nine out of 10 schools in Hampshire achieved National Healthy School Status. There was very high engagement of schools in the new National Healthy Schools Enhancement Model and over 80 choosing obesity reduction as a priority.
Pilot of „Healthy Early Years‟ model for Hampshire.
„Routine Feedback‟ of NCMP results to parents of all Year 6 children since 2010/11.
Evaluation of Tier 2 Weight Management services provided by MEND (Mind, Exercise, Nutrition…Do it!) and a School Nurse pilot in Hampshire.
The training and development needs of frontline staff have been assessed to inform future plans.

Inequalities in childhood obesity are persisting with areas such as Gosport; Havant;
Rushmoor and Basingstoke & Deane having higher rates of excess weight. Further analysis
of the local data to better understand and monitor progress toward addressing the inequality
is needed.
Breast feeding rates at 6-8 weeks are lower than expected for the local population and is a
priority to address.
Opportunities to embed healthy lifestyle (eating and physical activity) behaviours into
Hampshire parenting support programmes should be explored.
Continue to promote engagement of Children‟s Centres with the „Cook & Eat‟ style
programmes.
Continue to support schools where excess weight prevalence is high to work to the
Hampshire Healthy Schools model and implement a Hampshire „Healthy Early Years‟
programme across Hampshire based on the evaluation of the pilot.
Plan and commission services to support implementation of the Care Pathway for children
with excess weights.
Commission 100% delivery of Healthy Child Programme (HCP) pre-birth to five years.
Identify children at higher risk of developing obesity and offer effective family interventions.
Implement „Routine Feedback‟ of NCMP results to parents of all Year R children.
Implement a programme of training and development to meet the needs of frontline staff
engaging with families around healthy weights.
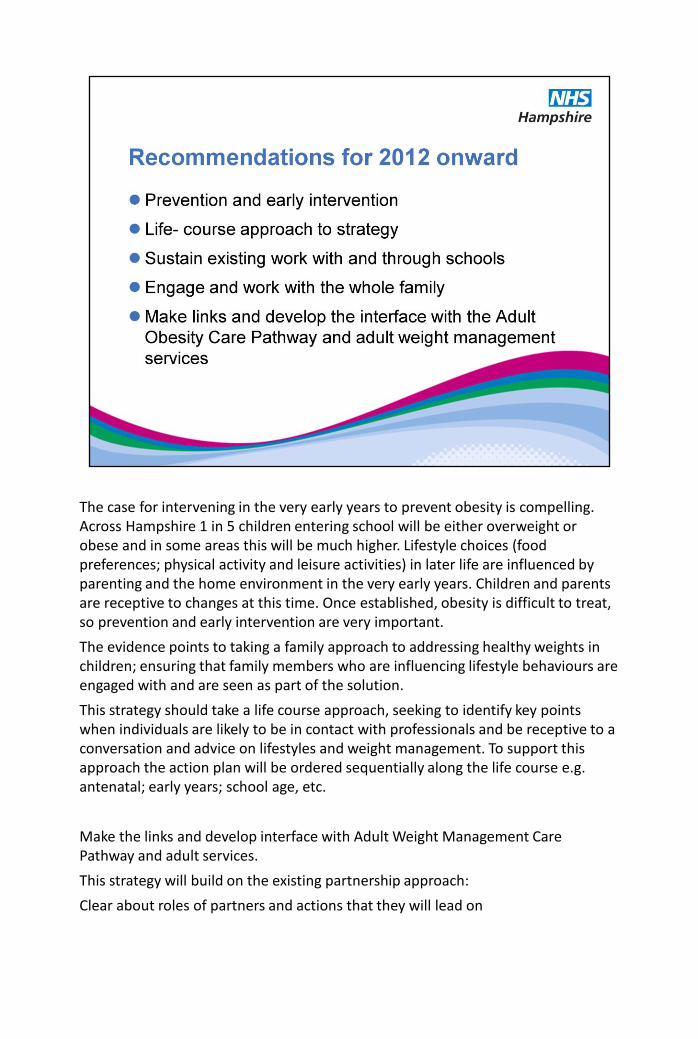
The case for intervening in the very early years to prevent obesity is compelling. Across Hampshire 1 in 5 children entering school will be either overweight or obese and in some areas this will be much higher. Lifestyle choices (food preferences; physical activity and leisure activities) in later life are influenced by parenting and the home environment in the very early years. Children and parents are receptive to changes at this time. Once established, obesity is difficult to treat, so prevention and early intervention are very important.
The evidence points to taking a family approach to addressing healthy weights in children; ensuring that family members who are influencing lifestyle behaviours are engaged with and are seen as part of the solution.
This strategy should take a life course approach, seeking to identify key points when individuals are likely to be in contact with professionals and be receptive to a conversation and advice on lifestyles and weight management. To support this approach the action plan will be ordered sequentially along the life course e.g. antenatal; early years; school age, etc.
Make the links and develop interface with Adult Weight Management Care Pathway and adult services.
This strategy will build on the existing partnership approach:
Clear about roles of partners and actions that they will lead on
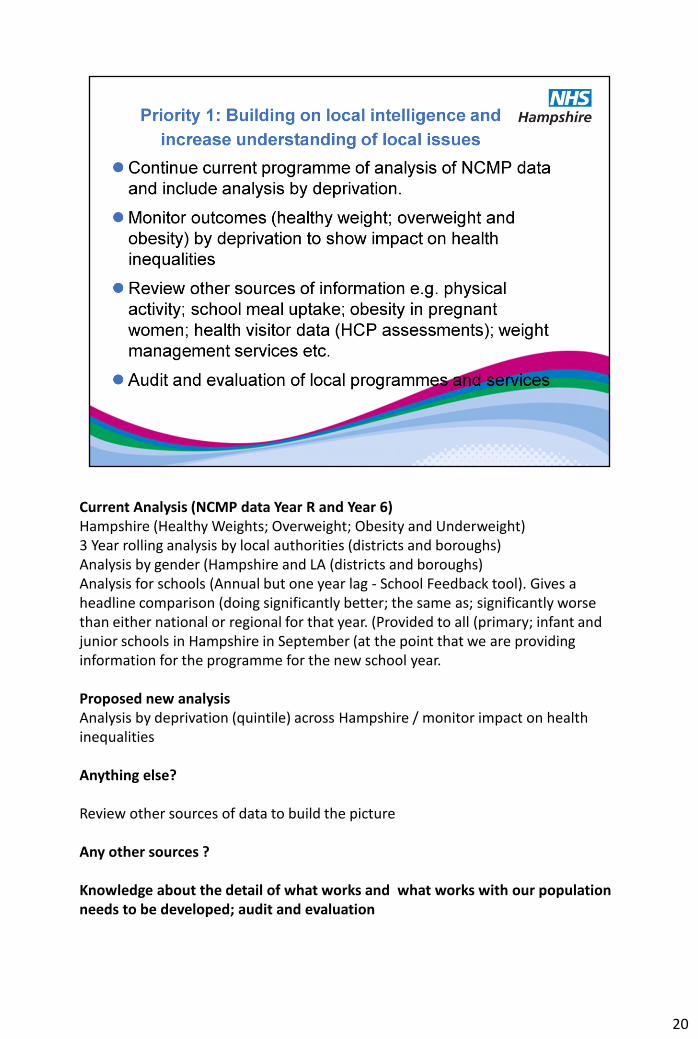
Current Analysis (NCMP data Year R and Year 6) Hampshire (Healthy Weights; Overweight; Obesity and Underweight) 3 Year rolling analysis by local authorities (districts and boroughs) Analysis by gender (Hampshire and LA (districts and boroughs) Analysis for schools (Annual but one year lag - School Feedback tool). Gives a headline comparison (doing significantly better; the same as; significantly worse than either national or regional for that year. (Provided to all (primary; infant and junior schools in Hampshire in September (at the point that we are providing information for the programme for the new school year. Proposed new analysis Analysis by deprivation (quintile) across Hampshire / monitor impact on health inequalities Anything else? Review other sources of data to build the picture Any other sources ? Knowledge about the detail of what works and what works with our population needs to be developed; audit and evaluation
20

Responsibility and accountability through Child Health Prevention and Early intervention Group – Co Chaired by Christine Jackson and John Clarke.
Sub Groups of the Healthy Weight Strategy Group as described now being established. Seeking broader membership Contact us if you would like to be involved
Breast Feeding – extensive work programme developed from 2007. Bringing under umbrella of HW Strategy
Communications and C4L
Commissioning Group
Workforce Development
In Hampshire need to think about how we are networking and interfacing with localities and key partnerships in local area
Local Children’s Partnerships
H&WB Partnerships
Clinical Commissioning Groups
Example from Breast Feeding Programme

Analysis of the first five years of NCMP data for England shows that: For Year R between 2009/10 and 2010/11 obesity prevalence decreased
for boys and girls. The overall analysis suggests that the decrease for boys
may represent part of a longer term downward trend however there is less
evidence to suggest obesity prevalence for girls in Year R is undergoing a
sustained decrease. At a population level the changes in Year R can be considered a “healthy
change” however obesity prevalence has decreased most among the least
deprived children and has shown little change among the most deprived. For Year 6 between 2009/10 and 2010/11 obesity prevalence rose and has
confirmed that obesity prevalence for Year 6 children continues to rise and
move in an “unhealthy direction”. In Year 6 the rate of increase in obesity prevalence is greater in more
deprived areas.
22
23
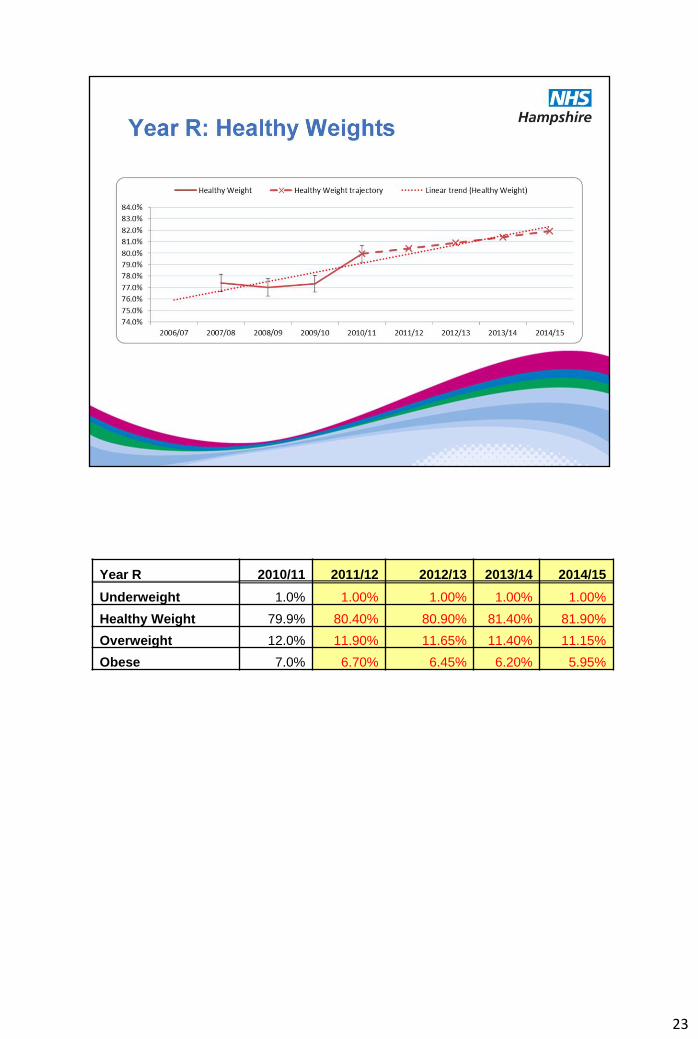
Year R 2010/11 2011/12 2012/13 2013/14 2014/15
Underweight 1.0% 1.00% 1.00% 1.00% 1.00%
Healthy Weight 79.9% 80.40% 80.90% 81.40% 81.90%
Overweight 12.0% 11.90% 11.65% 11.40% 11.15%
Obese 7.0% 6.70% 6.45% 6.20% 5.95%
24
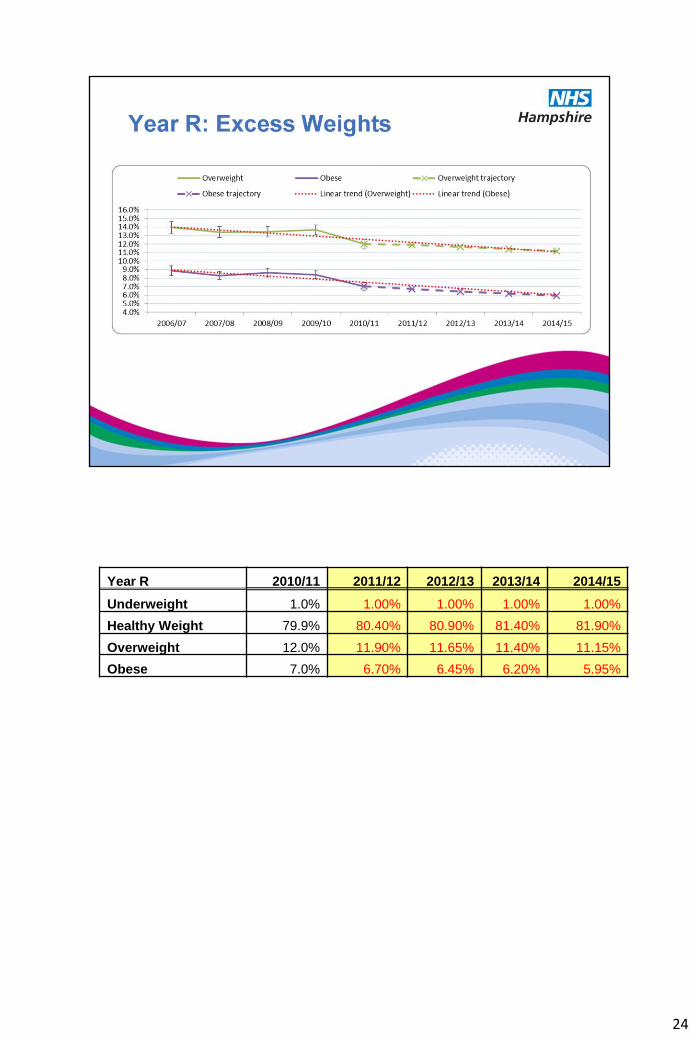
Year R 2010/11 2011/12 2012/13 2013/14 2014/15
Underweight 1.0% 1.00% 1.00% 1.00% 1.00%
Healthy Weight 79.9% 80.40% 80.90% 81.40% 81.90%
Overweight 12.0% 11.90% 11.65% 11.40% 11.15%
Obese 7.0% 6.70% 6.45% 6.20% 5.95%
25
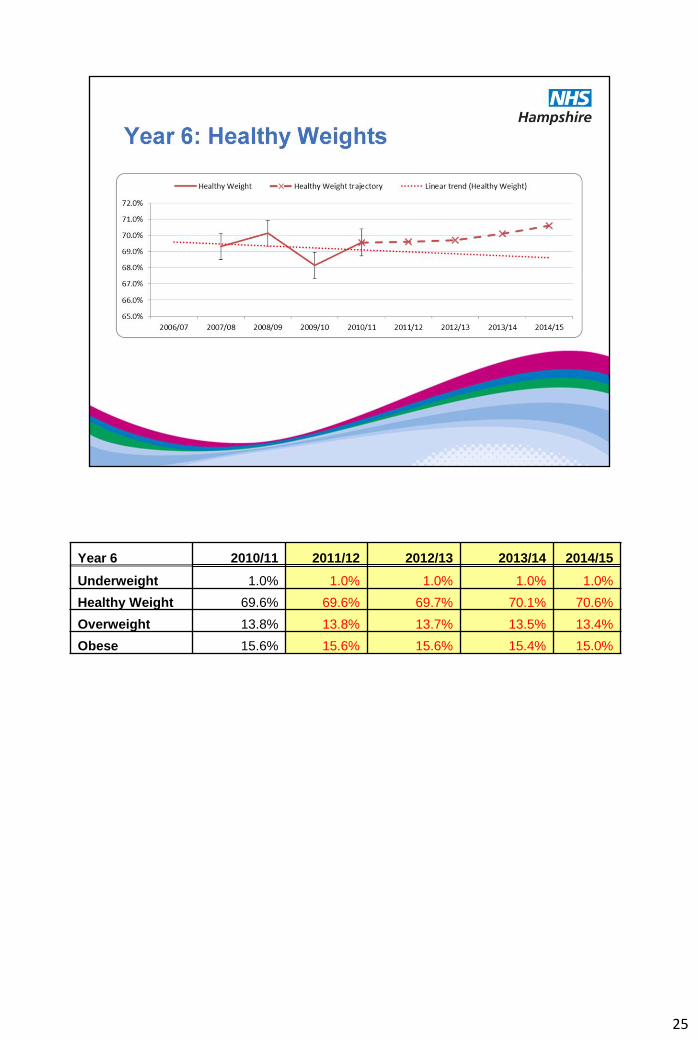
Year 6 2010/11 2011/12 2012/13 2013/14 2014/15
Underweight 1.0% 1.0% 1.0% 1.0% 1.0%
Healthy Weight 69.6% 69.6% 69.7% 70.1% 70.6%
Overweight 13.8% 13.8% 13.7% 13.5% 13.4%
Obese 15.6% 15.6% 15.6% 15.4% 15.0%
26
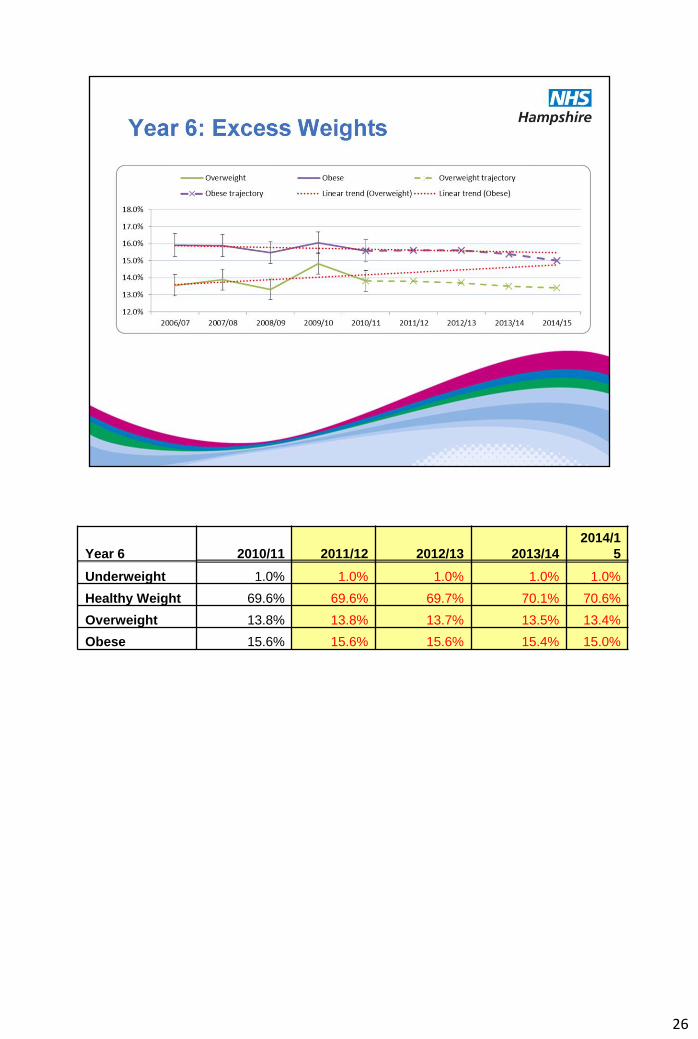
Year 6 2010/11 2011/12 2012/13 2013/14 2014/1
5
Underweight 1.0% 1.0% 1.0% 1.0% 1.0%
Healthy Weight 69.6% 69.6% 69.7% 70.1% 70.6%
Overweight 13.8% 13.8% 13.7% 13.5% 13.4%
Obese 15.6% 15.6% 15.6% 15.4% 15.0%