
Obesity and reproduction Professor Aleksandar Ljubić Medical school University of Belgrade Clinic...
57
Obesity and reproduction Professor Aleksandar Ljubić Medical school University of Belgrade Clinic for Obstetrics and Gynecology Clinical center of Serbia
-
Upload
arline-dorsey -
Category
Documents
-
view
228 -
download
4
Transcript of Obesity and reproduction Professor Aleksandar Ljubić Medical school University of Belgrade Clinic...

Obesity and reproduction
Professor Aleksandar LjubićMedical school University of BelgradeClinic for Obstetrics and Gynecology
Clinical center of Serbia

Obesity and reproductionObesity and reproduction
EpidemiologEpidemiologyy
PatoPatophysphysiologiologyy
IVFIVF
PregnancyPregnancy
IntergeneraIntergenerational obesitytional obesity

Health Challenges of the Future?
Increasing burden of “lifestyle” diseases1. Obesity
2. Cardiovascular disease (hypertension, atherosclerosis)
3. Type 2 Diabetes
Associated with increasing morbidity and mortality
Appearing at younger and younger ages
WHO, 2005

Obesity – pandemic disease
WHO, 2005

Women of reproductive ageWomen of reproductive age
Martorell, R, et al;Eur J Clin Nutrit, 2000

Obesity and its associated metabolic problems areappearing at younger ages
WHO, 2005

Horgan, Bellizzi and Dietz, 2000. IOTF.
Obesity during childhood in Obesity during childhood in developing countriesdeveloping countries

Cover page of The Economist, December 13-19th, 2003.
Our physiology has not been able to adapt to advances
in technology and food production.

Chrousos GP2009

PCOS and obesity
PCOS the most frequent ovarian disorder in premenopausal
women Azziz et al., 2004
Obesity 20–69% of women with PCOS - BMI > 30 Independent of obesity, women with PCOS have
increased intra-abdominal fat accumulation Asuncion et al., 2000; Azziz et al., 2004; Carmina et al.,
2007.

NIH PCOS groups a more severe phenotype
ESHRE including ovulatory and non-hyperandrogenic PCOS groups
less severe with metabolic features primarily related to excess weight, specifically increased abdominal fat
Moran and Teede, 2009.
PCOS clasification

PCOS and long-term sequelae
IR and subsequent hyperinsulinaemia: Impaired glucose tolerance, Gestational diabetes mellitus - OR 2.94, T2DM Cardiovascular disease
exacerbated by coexistent obesity Boudreaux et al., 2006 Ehrmann et al., 2006

AbdominalAbdominal adiposity and adiposity and PCOS PCOS
Escobar-Morreale H et al. Trends in Endocrinology and Metabolism, 2007; 18(7): 266-272.

PCOS and obesity - patophysiologyPCOS and obesity - patophysiology
Compensatory hyperinsulinaemia - significant contributor to the hyperandrogenism
Increased serum insulin stimulates ovarian androgen production, reduces SHBG increasing serum levels of free bio-available androgens
Apart from reproductive (anovulation) and cosmetic (acne, alopecia, hirsutism) consequences hyperandrogenaemia
increases abdominal obesity, aggravates existing IR
Preadipocytes have androgen receptors and high androgen levels have been shown to induce selective IR in
cultured adipocytes
D. Rachon, H. Teede Molecular and Cellular Endocrinology (2010)

Molecules secreted by the intraabdominal adipose tissue (adipokines)
promote ovarian androgen production. TNF stimulate proliferation and steroidogenesis apoptosis
and anovulation in the rat’s ovary leptin induces anovulation by direct ovarian effects
Duggal et al., 2000 Intraabdominal fat tissue
express enzymes involved in the metabolism of androgens further contribute to the hyperandrogenism in women with
PCOS Gambineri et al., 2002
PCOS and obesity - patophysiologyPCOS and obesity - patophysiology

IR and ovarian hyperandrogenism promote the accumulation of intra-
abdominal fat primary determinants of the
metabolic abnormalities present in women with PCOS
D. Rachon, H. Teede Molecular and Cellular Endocrinology (2010)
PCOS and obesity - patophysiologyPCOS and obesity - patophysiology

Fat distribution and anovulationFat distribution and anovulation
Abdominal fat in anovulatory women - SAF not intraabdominal fat.
Abdominal and trunk SAF accumulation are associated with anovulation.
Kuchenbecker et al, J Clin Endocrinol Metab 2010

PCOS – PCOS – abdominalabdominal adiposity adiposity
Escobar-Morreale H et al. Trends in Endocrinology and Metabolism, 2007;18 (7) : 266-272.

Obesity - sterility Obesity - sterility Multiple steroid and
metabolic disturbances Production and effect of
Insulin, leptin, resistin, ghrelin and adiponectin.
Poretsky et al., 1999; Moschos et al., 2002; Tanbo, 2002; Pasquali et al., 2003),

GGhrelinhrelinreproductive reproductive
functionfunction
Garcia MC et al, Reproduction 2007; 133: 531-540
A putative signal forenergy insufficiency
Follicle growth and maturationEmbryonic
developmentImplantation

Fedorscak et al, Human Reproduction, 2004
No - 5019No - 5019
Obesity and IVFObesity and IVF

Fedorscak et al, Human Reproduction, 2004
Obesity and IVFObesity and IVF
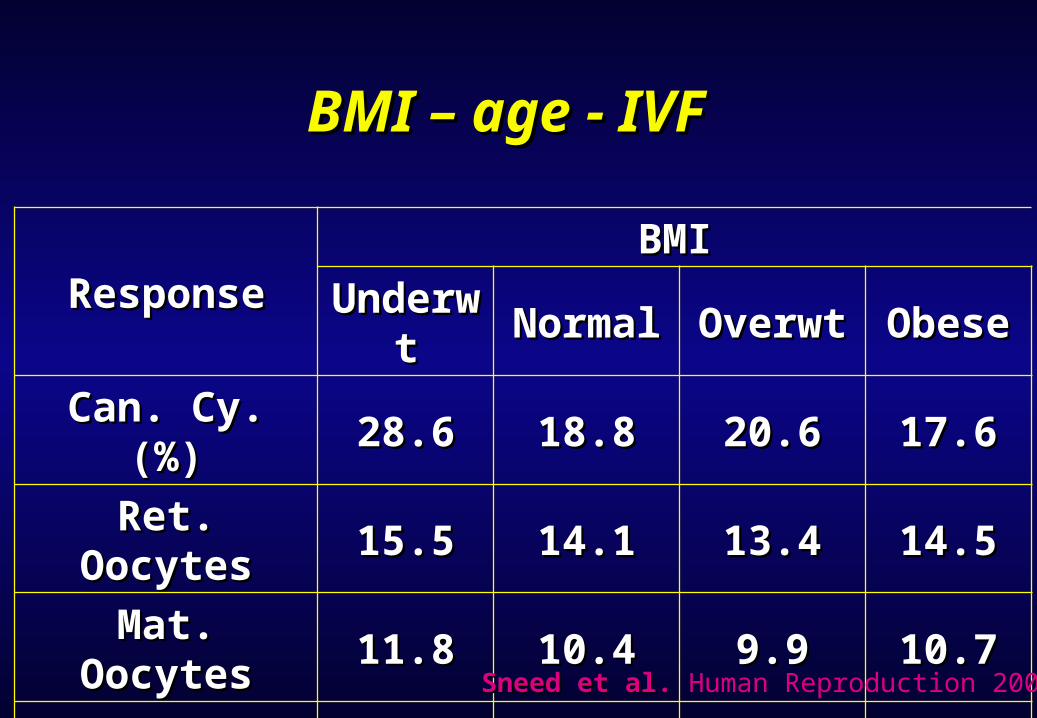
BMI BMI – age – age - IVF- IVF
ResponseResponseBMIBMI
UnderwtUnderwt NormalNormal OverwtOverwt ObeseObese
Can. Cy. (%)Can. Cy. (%) 28.628.6 18.818.8 20.620.6 17.617.6
Ret. OocytesRet. Oocytes 15.515.5 14.114.1 13.413.4 14.514.5
Mat. OocytesMat. Oocytes 11.811.8 10.410.4 9.99.9 10.710.7
Fert. OocytesFert. Oocytes 9.39.3 8.68.6 8.48.4 8.58.5
Sneed et al. Sneed et al. Human Reproduction 2008

Sneed et al. Sneed et al. Human Reproduction 2008
OutcomeOutcomeBMIBMI
UnderwtUnderwt NormalNormal OverwtOverwt ObeseObese
Pts with ETPts with ET 2020 498498 258258 253253
Em. Trans.Em. Trans. 2.22.2 2.32.3 2.32.3 2.32.3
Imp. Rate (%)Imp. Rate (%) 27.527.5 23.323.3 23.423.4 21.521.5
Preg. Rate (%)Preg. Rate (%) 58.858.8 48.748.7 45.345.3 39.539.5
Misc. Rate (%)Misc. Rate (%) 00 17.717.7 15.115.1 10.010.0
Clin.Preg. (%)Clin.Preg. (%) 58.858.8 38.638.6 36.836.8 35.135.1
BMI BMI – age – age - IVF- IVF

0
10
20
30
40
50
60
70
80
90
18 20 22 24 26 28 30 32 34 36 38 40
BMI
Cli
nic
al
Pre
gn
an
cy
Ra
te
20 25 30 35 40
Sneed et al. Sneed et al. Human Reproduction 2008
Younger patientsYounger patients
- - BMIBMI reduction reduction
BMI BMI – age – age - IVF- IVF

Outcome measures
The primary outcome measure was live birth rate per woman.
Secondary outcome measures included total dose of gonadotrophins, Cancellation rates, number of oocytes retrieved, number of embryos obtained, pregnancy rate, miscarriage rate and ovarian hyperstimulation syndrome (OHSS) rate.
A. Maheshwari, Aberdeen, Human Reproduction Update, 2007, 1843 studies

Live birth rate
In women with BMI of < 25, the odds of live birth per woman were 1.08 (95%: CI 0.92, 1.26), and per cycle were 0.74 (95% CI: 0.27, 2.01) when compared with women with BMI of > 25.
In women with BMI of < 30, the odds of live birth per woman were 1.12 (95% CI: 0.91, 1.37) when compared with women with BMI of > 30.
There was significant statistical heterogeneity in results from the different studies (P = 0.003).
A. Maheshwari, Aberdeen, Human Reproduction Update, 2007

Pregnancy rate BMI of < 25, OR - 1.24 (95% CI: 1.02, 1.50) when
compared with BMI of > 25. Significant statistical heterogeneity (P = 0.03).
A. Maheshwari, Aberdeen, Human Reproduction Update, 2007

Pregnancy rate
BMI 20–25, OR - 1.40 (95% CI: 1.22, 1.60) as compared to a BMI > 25.
Significant statistical heterogeneity (P< 0.00001).
A. Maheshwari, Aberdeen, Human Reproduction Update, 2007

Pregnancy rate
BMI < 30, OR - 1.47 (95% CI: 1.20, 1.80) as compared to women with BMI of > 30.
Significant statistical heterogeneity (P< 0.00001).
A. Maheshwari, Aberdeen, Human Reproduction Update, 2007

The dose of gonadotrophins
The dose of gonadotrophins was higher in women with BMI of > 25 (WMD 210.08, 95% CI: 149.12, 271.05) in comparison with those with BMI of < 25.
A. Maheshwari, Aberdeen, Human Reproduction Update, 2007

The dose of gonadotrophins
The requirement for gonadotrophins was higher (WMD 361.94, 95% CI: 156.47, 567.40) in obese women (BMI > 30 versus BMI < 30)
A. Maheshwari, Aberdeen, Human Reproduction Update, 2007

Number of oocytes retrieved
The WMD of the number of oocytes recovered in women with BMI < 25 was 0.58 (95% CI: 0.22, 0.94) in comparison with women with BMI > 25.
A. Maheshwari, Aberdeen, Human Reproduction Update, 2007

Number of oocytes retrieved
The WMD of the number of oocytes retrieved in women with BMI < 30 was 0.68 (95% CI: 0.11, 1.25) as compared to women with BMI of > 30.
A. Maheshwari, Aberdeen, Human Reproduction Update, 2007

Cancellation rate
BMI of > 25 OR were 1.83 (95% CI: 1.36, 2.45), as compared to BMI < 25.
BMI of > 30, OR were 1.59 (95%CI: 0.53, 4.80), as compared to women with BMI < 30
Significant statistical heterogeneity (P = 0.05).
A. Maheshwari, Aberdeen, Human Reproduction Update, 2007
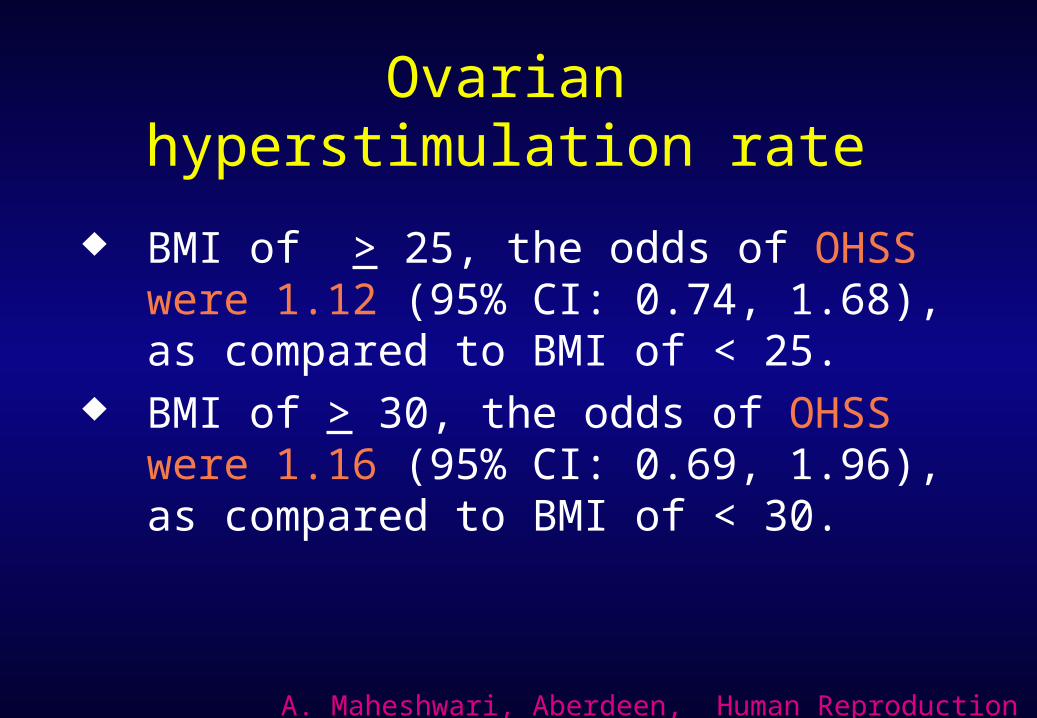
Ovarian hyperstimulation rate
BMI of > 25, the odds of OHSS were 1.12 (95% CI: 0.74, 1.68), as compared to BMI of < 25.
BMI of > 30, the odds of OHSS were 1.16 (95% CI: 0.69, 1.96), as compared to BMI of < 30.
A. Maheshwari, Aberdeen, Human Reproduction Update, 2007
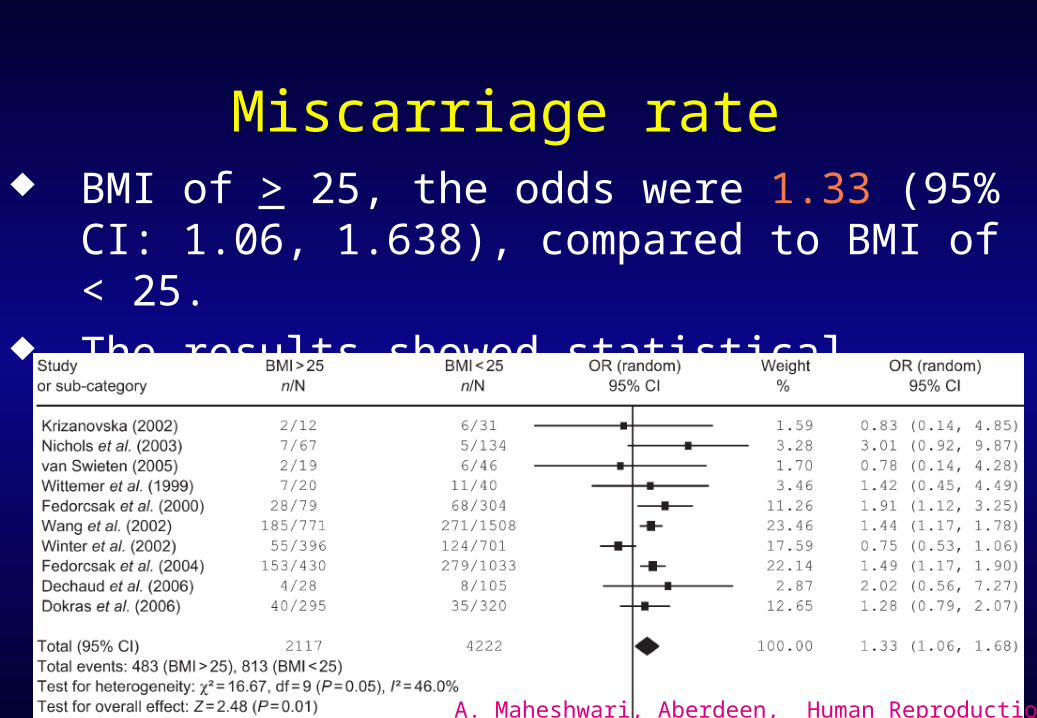
Miscarriage rate BMI of > 25, the odds were 1.33 (95% CI: 1.06,
1.638), compared to BMI of < 25. The results showed statistical heterogeneity (P = 0.05).
A. Maheshwari, Aberdeen, Human Reproduction Update, 2007

Miscarriage rate
The risk of miscarriage was higher (OR = 1.53, 95% CI: 1.27, 1.84), in women with BMI > 30 versus BMI < 30.

Increased FSH consumption Less oocytes Lower E2 More cancelation Less pregnancies
Crosignani et al., 1994; Homburg et al., 1996; Soderstrom-Anttila et al., 1996; Wang et al., 2000; Wittemer et al., 2000; Carrell et al., 2001; Loveland et al., 2001; Mulders et al., 2003; Nichols et al., 2003
Obesity and IVFObesity and IVF


Pregnancy complications - Pregnancy complications - BMIBMI
Adapted from Galtier-Dereure et al. (1995)

Congenital malformations – BMI Congenital malformations – BMI
Watkins ML, et al., Pediatrics 111:1152, 2003)

Why might obesity lead to congenital Why might obesity lead to congenital anomalies?anomalies?
Four potential mechanisms:Four potential mechanisms:- Undiagnosed diabetesUndiagnosed diabetes
HypertensionDyslipidaemia
Glucose intolerance Inflammation
Abdominal Obesity

Why might obesity lead to Why might obesity lead to congenital anomalies?congenital anomalies?
Four potential mechanisms:Four potential mechanisms: Undiagnosed diabetesUndiagnosed diabetes Folate statusFolate status

Why might obesity lead to Why might obesity lead to congenital anomalies?congenital anomalies?
Four potential mechanisms:Four potential mechanisms: Undiagnosed diabetesUndiagnosed diabetes Folate statusFolate status Nutritional deficienciesNutritional deficiencies

Why might obesity lead to Why might obesity lead to congenital anomalies?congenital anomalies?
Four potential mechanisms:Four potential mechanisms: Undiagnosed diabetesUndiagnosed diabetes Folate statusFolate status Nutritional deficienciesNutritional deficiencies Difficulties with antenatal detectionDifficulties with antenatal detection

The Developmental Origins of Health and Disease
“A process whereby a stimulus or insult applied at a critical or sensitive period of development results in long term or permanent changes in the structure or function of the organism”
Lucas J. The childhood environment and adult , 1991


Parsons et al, BMJ 2001
Excessive birth weightExcessive birth weight


Fetal Fetal programming programming
Increased weight gain
Glucose intolerance Insulin resistance Diabetes Cardiovascular
problems


Prevention / TreatmentPrevention / Treatment
Influence of maternal and fetal health on Obesity pandemic
When to intervene? Before conception Around conception During pregnancy During childhood

Inter-generational obesity cycleInter-generational obesity cycle
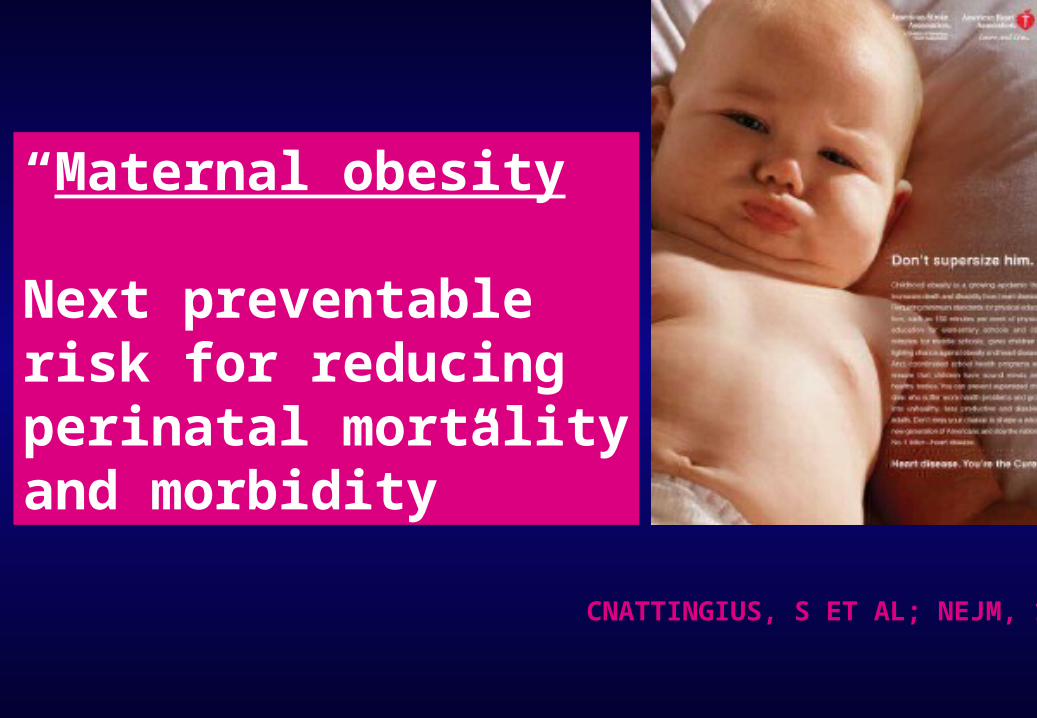
“Maternal obesity
Next preventable risk for reducing perinatal mortality and morbidity”
CNATTINGIUS, S ET AL; NEJM, 1998


![Commissiones et Relationes Venetae, Tomus I [Šime Ljubić, 1876.]](https://static.fdocuments.net/doc/165x107/577cd4261a28ab9e7897cbd0/commissiones-et-relationes-venetae-tomus-i-sime-ljubic-1876.jpg)