OBAYASHI CORPORATION
48
OBAYASHI CORPORATION CONSOLIDATED FINANCIAL STATEMENTS Year Ended March 31, 2021
Transcript of OBAYASHI CORPORATION

OBAYASHI CORPORATIONCONSOLIDATEDFINANCIAL STATEMENTS
Year Ended March 31, 2021

Independent Auditor’s Report
The Board of DirectorsOBAYASHI CORPORATION
Opinion
We have audited the accompanying consolidated financial statements of OBAYASHICORPORATION and its consolidated subsidiaries (the Group), which comprise the consolidatedbalance sheet as at March 31, 2021, and the consolidated statements of income, comprehensiveincome, changes in net assets, and cash flows for the year then ended, and notes to the consolidatedfinancial statements.In our opinion, the accompanying consolidated financial statements present fairly, in all materialrespects, the consolidated financial position of the Group as at March 31, 2021, and itsconsolidated financial performance and its consolidated cash flows for the year then ended inaccordance with accounting principles generally accepted in Japan.
Basis for OpinionWe conducted our audit in accordance with auditing standards generally accepted in Japan. Ourresponsibilities under those standards are further described in the Auditor’s Responsibilities forthe Audit of the Consolidated Financial Statements section of our report. We are independent ofthe Group in accordance with the ethical requirements that are relevant to our audit of theconsolidated financial statements in Japan, and we have fulfilled our other ethical responsibilitiesin accordance with these requirements. We believe that the audit evidence we have obtained issufficient and appropriate to provide a basis for our opinion.
Key Audit MattersKey audit matters are those matters that, in our professional judgment, were of most significancein our audit of the consolidated financial statements of the current period. These matters wereaddressed in the context of the audit of the consolidated financial statements as a whole, and informing the auditor’s opinion thereon, and we do not provide a separate opinion on these matters.
Estimates of total construction revenue and total construction costs when applying the percentage-of-completion method
Key audit matters Auditor’s responseAs described in “(1) Application of the
percentage-of-completion method” under “4.Significant Accounting Estimates,” the Groupapplies the percentage-of-completion method forthe portion of work completed up to the end ofthe fiscal year ended March 31, 2021 forconstruction contracts for which completion is
We mainly performed the following procedures toevaluate the estimates of total construction revenueand total construction costs when applying thepercentage-of-completion method.
(1) Evaluation of internal controlWe evaluated the design and operating
effectiveness of the following internal controls

deemed to be certain (the cost-to-cost method isused to estimate progress toward completion ofconstruction). If it is likely that total constructioncosts associated with construction contracts willexceed total construction revenue and if theamount of the excess can be reasonablyestimated, then the amount resulting fromdeducting the profit or loss already recorded forsuch construction contracts from the expectedamount of the excess of costs over revenue ( Losson construction contracts”) is accounted for asloss in the period in which Loss on constructioncontracts is expected, and a provision for Loss onconstruction contracts is recorded.
Net sales accounted for by the percentage-of-completion method made up 85.9%, or1,517,425 million yen, of total net sales for thefiscal year ended March 31, 2021. The provisionfor Loss on construction contracts was3,114 million yen for the fiscal year ended March31, 2021.
In applying the percentage-of-completionmethod, revenues from construction contracts aredetermined by multiplying total constructionrevenue by progress toward completion ofconstruction, which is based on total constructioncosts and corresponds to costs actually incurredup until the end of the fiscal year. Accordingly, itis necessary to reasonably estimate totalconstruction revenue, total constructioncosts, and progress toward completion ofconstruction as of the end of the fiscal year.
In addition to the construction contractsundertaken by the Group being individual innature as they involve specifications andconstruction periods that vary by project, manysuch contracts span long constructionperiods, making it likely that construction detailsand the like will change during the course ofconstruction due to certain facts coming to lightand conditions at construction sites changingafter the start of construction.
Although total construction revenue, whichserves as a basis for revenue recognition underthe percentage-of-completion method, is basedon construction contract amounts, constructiondetails and contracts tend to be modified while
relating to estimates of total construction revenueand total construction costs.・ We evaluated controls to ensure reliability by
requiring that operating budgets on whichestimates of total construction costs are basedare prepared by persons in charge ofconstruction work who have specializedknowledge, and that the necessary approval forsuch operating budgets is obtained fromconstruction and other such departments.
・ We evaluated controls to confirm that each ofthe elements of total construction costs areaccumulated and calculated in detail based onobjective prices such as internally-approvedstandard unit prices and third party quotations.
・ We evaluated a system for revising estimates oftotal construction costs in a timely manner inaccordance with factors such as the status ofconstruction and the amounts of costs actuallyincurred, or changes in specifications instructedby customers, and controls to confirm thatrevisions are made in a timely and appropriatemanner.
・ We evaluated controls to ensure reliability byrequiring that estimates of total constructionrevenue are calculated by accumulatinginformation from materials such as constructioninstructions and quotations, and that thenecessary approval for such calculations isobtained.
・ We evaluated a system for revising estimates oftotal construction revenue in a timely manner inaccordance with factors such as the status ofdiscussions with ordering parties, and controlsto confirm that revisions are made in a timelyand appropriate manner.
(2) Evaluation of estimates of total constructionrevenue
We identified construction contracts in whichthere is either material or qualitative uncertainty overthe estimate of total construction revenue in light offactors such as construction contract amount, profit(loss) on construction, construction details, and thestatus of construction, and performed the followingprocedures.・ We compared the construction contract
amounts, which are incorporated into estimatesof total construction revenue, to constructioncontracts.
・ Of additional construction contract amounts

construction is still in progress due to newagreements between counterparties, makingestimates of additional contract amounts arisingfrom changes in construction details uncertainuntil a final agreement is reached with theordering party.
In addition, although total constructioncosts, which serve as a basis for revenuerecognition under the percentage-of-completionmethod, are based on operating budgets for eachconstruction contract and estimated in line withrevisions in operating budgets resulting fromchanges in construction details and fluctuationsin building material and labor prices, totalconstruction costs are also based on certainassumptions or the judgment of persons directlyor indirectly responsible for cost management orprogress management over construction contractssince there is no uniform rule for makingdeterminations applicable to all constructioncontracts for estimates of work details, workinghours, and building material and labor costsnecessary to complete construction or for thefeasibility of cost reduction activities, and sincemany such contracts span long constructionperiods.
Further, considering that it is necessary to takeinto consideration factors such as the politicalsituation and economic conditions in countrieswhere the Group does business as well asfluctuations in exchange rates since overseasconstruction projects, mainly in Asia and NorthAmerica, in particular tend to be large in scaleand span long periods of time, estimates of totalconstruction costs for overseas constructionprojects involve an even greater degree ofuncertainty, and estimates of total constructioncosts are becoming relatively more uncertainwhen taking into account the impact of workbeing halted on domestic and overseasconstruction projects as a result of the spread ofthe COVID-19 pandemic in the fiscal year endedMarch 31, 2021.
Based on the above, we have determined thatestimates of total construction costs and totalconstruction revenue as it relates to application ofthe percentage-of-completion method are key
that are incorporated into estimates of totalconstruction revenue, we compared the portionin existing contracts in effect to constructioncontracts, and compared the portion in contractsnot in effect to basis materials such asconstruction instructions and quotationssubmitted to ordering parties after makinginquiries of persons such as on-site constructionmanagers regarding the details and basis forsuch amounts and inspecting minutes ofdiscussions with ordering parties.
・ We evaluated the estimates of total constructionrevenue and the cutoff for the fiscal year endedMarch 31, 2021 by analyzing quarter-to-quarterchanges in such estimates.
(3) Evaluation of estimates of total constructioncosts
We identified construction contracts in whichthere is either material or qualitative uncertainty overthe estimate of total construction costs in light offactors such as construction contract amount, profit(loss) on construction, construction details, and thestatus of construction, and performed the followingprocedures.・ We compared estimates of total construction
costs to operating budgets, which serve as thebasis for calculating such estimates, andconsidered whether the details of estimatedcosts are consistent with constructiondeliverables, whether estimated costs werecalculated by grouping such details by type ofconstruction, and whether operating budgets arefree from material reconciling items included inresponse to future uncertainty.
・ We compared the most recent estimates of totalconstruction costs for each quarter with thecorresponding estimates of total constructioncosts for the preceding quarter, and evaluatedwhether the details of material quarter-to-quarter changes were reflected in suchestimates in a timely manner by makinginquiries of on-site construction managersregarding these changes and reconciling thesechanges to revised basis materials prepared byon-site construction personnel.
・ After inquiring about construction progressfrom construction departments and on-siteconstruction managers, we made inquiries on aquarterly basis about determinations of whetherto revise total construction costs and, for

audit matters. construction projects for which the Groupdetermined that revision is necessary, weevaluated the timeliness and appropriateness ofthese determinations and revised operatingbudgets.
・ We obtained operating budgets, and comparedthe estimated costs for each type of work tomaterials, such as quotations, from which costsare accumulated to serve as the basis for suchestimated costs. Additionally, we compared thecosts actually incurred relative to the estimatedcosts for each type of work, and considered ifactual costs have not exceeded estimated costswhile also considering consistency withconstruction progress.
・ We performed on-site observations for a portionof construction projects to consider if the statusof construction is consistent with constructionprogress that we heard about in advance fromconstruction departments or on-siteconstruction managers, as well as with detailsof estimates of total construction costs andprogress toward completion of construction.
・ We evaluated the accuracy of estimates ofongoing operating budgets and the process forestimating total construction costs bycomparing the most recent estimates of totalconstruction costs for each quarter to thecorresponding estimates of total constructioncosts for the preceding quarter and consideringthe reasons for quarter-to-quarter changes inestimates on a quarterly basis.
(4) Evaluation of the amount recorded forprovision of Loss on construction contracts
For the amount of provision of loss onconstruction above a certain amount, in addition tothe procedures noted in (1) through (3) above, weobtained a schedule of provision for Loss onconstruction contracts prepared by theGroup, recalculated the amount to be recorded forprovision for Loss on construction contracts, andfound that the amount was the same as that recordedby the Group.
Assessment of indicators of impairment of investment and rental propertiesKey audit matters Auditor’s response

As described in “(2) Impairment of investmentand rental properties” under “4. SignificantAccounting Estimates,” the Group recordedimpairment loss of 540 million yen on investmentand rental properties of 411,386 million yen forthe fiscal year ended March 31, 2021 due todecreased profitability or property pricesresulting from changes in the businessenvironment. The Group’s investment and rentalproperties are used for various purposes, such asoffice buildings and logistics facilities, and aregeographically diverse since they are also locatedoverseas, such as in the UK and Thailand.
In assessing indicators of impairment ofinvestment and rental properties, estimates of netoperating income and the capitalization rate foreach individual investment and rental propertythat are used to determine market value aresubject to uncertainty since they are greatlyaffected by factors such as the economicenvironment, changes in interestrates, competition in the real estate market, andthe COVID-19 pandemic.
In addition, considering that investment andrental properties are material as they account forapproximately 18% of consolidated total assets, ifthe Group records impairment loss due, forexample, to a major decline in the market valueof the investment and rental properties, it couldpotentially affect the Group’s operating resultsand financial position.
Based on the above, we have determined thatthe assessment of indicators of impairment ofinvestment and rental properties is a key auditmatter.
We mainly performed the following procedures toevaluate the assessment of indicators of impairmentof investment and rental properties.
(1) Evaluation of internal controlWe evaluated the design and operating
effectiveness of internal controls relating to therecognition of impairment loss on non-currentassets, including investment and rental properties.
(2) Evaluation of determinations of whether thereare indicators of impairment
・ We obtained materials prepared by the Groupfor considering whether assets areimpaired, and evaluated the assessment ofindicators of impairment for properties that weselected based on materiality by, forexample, agreeing profit (loss) and carryingvalue by property to the Group’s accountingbooks.
・ We evaluated estimates of net operatingincome, which is used to determine fairvalue, for properties that we selected based onmateriality by comparing estimates of netoperating income for each property with actualnet operating income recorded in the previousperiod and making inquiries of the responsibledepartment in accordance with preconditionsestimated by the Group in light of factors thatinclude the COVID-19 pandemic. Further, weagreed significant estimates of net operatingincome to source documents.
・ We evaluated the capitalization rates which areused to determine fair value for properties thatwe selected based on materiality by comparingsuch capitalization rates to informationobtained from external organizations.
・ We read minutes of various meetings such asmeetings of the board of directors and madeinquiries of the responsible departments toidentify the events impacting assessments, andevaluated whether the identified events havebeen reflected in materials for consideringwhether assets are impaired.

Responsibilities of Management, the Corporate Auditor and the Board of CorporateAuditors for the Consolidated Financial StatementsManagement is responsible for the preparation and fair presentation of these consolidatedfinancial statements in accordance with accounting principles generally accepted in Japan, and forsuch internal control as management determines is necessary to enable the preparation ofconsolidated financial statements that are free from material misstatement, whether due to fraudor error.In preparing the consolidated financial statements, management is responsible for assessing theGroup’s ability to continue as a going concern and disclosing, as required by accounting principlesgenerally accepted in Japan, matters related to going concern.The Corporate Auditor and the Board of Corporate Auditors are responsible for overseeing theGroup’s financial reporting process.
Auditor’s Responsibilities for the Audit of the Consolidated Financial StatementsOur objectives are to obtain reasonable assurance about whether the consolidated financialstatements as a whole are free from material misstatement, whether due to fraud or error, and toissue an auditor’s report that includes our opinion. Misstatements can arise from fraud or errorand are considered material if, individually or in the aggregate, they could reasonably be expectedto influence the economic decisions of users taken on the basis of these consolidated financialstatements.As part of an audit in accordance with auditing standards generally accepted in Japan, we exerciseprofessional judgment and maintain professional skepticism throughout the audit. We also:・ Identify and assess the risks of material misstatement of the consolidated financial
statements, whether due to fraud or error, design and perform audit procedures responsive tothose risks, and obtain audit evidence that is sufficient and appropriate to provide a basis forour opinion.
・ Consider internal control relevant to the audit in order to design audit procedures that areappropriate in the circumstances for our risk assessments, while the purpose of the audit ofthe consolidated financial statements is not expressing an opinion on the effectiveness of theGroup’s internal control.
・ Evaluate the appropriateness of accounting policies used and the reasonableness of accountingestimates and related disclosures made by management.
・ Conclude on the appropriateness of management’s use of the going concern basis ofaccounting and, based on the audit evidence obtained, whether a material uncertainty existsrelated to events or conditions that may cast significant doubt on the Group’s ability tocontinue as a going concern. If we conclude that a material uncertainty exists, we are requiredto draw attention in our auditor’s report to the related disclosures in the consolidated financialstatements or, if such disclosures are inadequate, to modify our opinion. Our conclusions arebased on the audit evidence obtained up to the date of our auditor’s report. However, futureevents or conditions may cause the Group to cease to continue as a going concern.

・ Evaluate the overall presentation, structure and content of the consolidated financialstatements, including the disclosures, and whether the consolidated financial statementsrepresent the underlying transactions and events in a manner that achieves fair presentation inaccordance with accounting principles generally accepted in Japan.
・ Obtain sufficient appropriate audit evidence regarding the financial information of the entitiesor business activities within the Group to express an opinion on the consolidated financialstatements. We are responsible for the direction, supervision and performance of the groupaudit. We remain solely responsible for our audit opinion.
We communicate with the Corporate Auditor and the Board of Corporate Auditorsregarding, among other matters, the planned scope and timing of the audit and significant auditfindings, including any significant deficiencies in internal control that we identify during our audit.We also provide the Corporate Auditor and the Board of Corporate Auditors with a statement thatwe have complied with the ethical requirements regarding independence that are relevant to ouraudit of the financial statements in Japan, and to communicate with them all relationships andother matters that may reasonably be thought to bear on our independence, and whereapplicable, related safeguards.From the matters communicated with the Corporate Auditor and the Board of CorporateAuditors, we determine those matters that were of most significance in the audit of theconsolidated financial statements of the current period and are therefore the key audit matters. Wedescribe these matters in our auditor’s report unless law or regulation precludes public disclosureabout the matter or when, in extremely rare circumstances, we determine that a matter should notbe communicated in our report because the adverse consequences of doing so would reasonablybe expected to outweigh the public interest benefits of such communication.
Interest Required to Be Disclosed by the Certified Public Accountants Act of JapanOur firm and its designated engagement partners do not have any interest in the Group which isrequired to be disclosed pursuant to the provisions of the Certified Public Accountants Act ofJapan.

Convenience TranslationThe U.S. dollar amounts in the accompanying consolidated financial statements with respect tothe year ended March 31, 2021 are presented solely for convenience. Our audit also included thetranslation of Japanese yen amounts into U.S. dollar amounts and, in our opinion, such translationhas been made on the basis described in Note 2 to the consolidated financial statements.
Ernst & Young ShinNihon LLCTokyo, Japan
June 25, 2021
Shuji KanekoDesignated Engagement PartnerCertified Public Accountant
Kenji SatoDesignated Engagement PartnerCertified Public Accountant

Consolidated Balance SheetsOBAYASHI CORPORATIONAt March 31, 2021 and 2020
2021 2020 2021 2020
Assets
Current assets
Cash and deposits (Notes 7 and 13) \ 258,549 \ 315,027 $ 2,335,374 $ 2,845,523
Notes and accounts receivable from completed constructioncontracts and other (Notes 7 and 13) 744,473 773,694 6,724,532 6,988,481
Electronically recorded monetary claims (Notes 13) 21,327 12,680 192,644 114,534
Short-term investment securities (Notes 7, 13 and 14) 4,401 7,103 39,761 64,166
Real estate for sale 12,160 11,937 109,842 107,822
Costs on uncompleted construction contracts (Note 7) 69,198 38,141 625,038 344,517
Costs on real estate business 22,826 15,171 206,182 137,042
Inventories for PFI and other projects (Note 7) 38,095 53,500 344,097 483,244
Other inventories (Note 7) 8,206 8,744 74,128 78,981
Accounts receivable-other (Note 13) 64,501 75,125 582,621 678,580
Other 25,812 22,749 233,156 205,489
Allowance for doubtful accounts (147) (118) (1,336) (1,074)
Total current assets 1,269,405 1,333,757 11,466,044 12,047,310
Noncurrent assets
Property, plant and equipment, net
Buildings and structures (Note 7) 117,083 120,866 1,057,569 1,091,741
Machinery, vehicles, tools, furniture and fixtures(Note 7) 50,846 55,274 459,280 499,272
Land (Note 7) 385,157 367,701 3,478,977 3,321,299
Leased assets 1,081 236 9,764 2,133
Construction in progress (Note 7) 55,087 28,112 497,583 253,928
Total property, plant and equipment, net (Note 7) 609,256 572,190 5,503,176 5,168,376
Intangible assets 6,437 6,367 58,147 57,516
Investments and other assets
Investment securities (Notes 7, 13 and 14) 340,079 290,719 3,071,805 2,625,953
Long-term loans receivable 1,769 2,109 15,982 19,054
Deferred tax assets (Note 17) 2,126 1,846 19,208 16,682
Other (Note 7) 43,730 23,496 395,002 212,236
Allowance for doubtful accounts (177) (191) (1,607) (1,729)
Total investments and other assets 387,528 317,981 3,500,391 2,872,198
Total noncurrent assets 1,003,222 896,539 9,061,714 8,098,090
Total assets \ 2,272,628 \ 2,230,297 $ 20,527,758 $ 20,145,401The accompanying notes to the consolidated financial statements are an integral part of this statement.
Thousands of U.S. dollars (Note 2)Millions of yen
1

2021 2020 2021 2020
Liabilities
Current liabilities
Notes and accounts payable for construction contractsand other (Notes 13) \ 466,213 \ 536,863 $ 4,211,125 $ 4,849,274
Electronically recorded obligations (Notes 13) 106,456 118,976 961,578 1,074,670
Short-term loans payable (Notes 7, 13 and 24) 54,634 54,823 493,492 495,201
Current portion of nonrecourse loans payable(Notes 7, 13 and 24) 7,445 7,631 67,250 68,929
Lease obligations (Notes 13 and 24) 740 839 6,685 7,581
Income taxes payable 13,415 27,209 121,177 245,774
Advances received on uncompleted construction contracts 127,845 109,216 1,154,777 986,508
Deposits received (Note 13) 121,289 121,611 1,095,556 1,098,467
Provision for warranties for completed construction 2,975 4,313 26,880 38,961
Provision for loss on construction contracts (Note 7) 13,551 12,694 122,407 114,666
Provision for loss on Antimonopoly Act - 4,145 - 37,440
Other 78,357 91,845 707,772 829,608
Total current liabilities 992,925 1,090,170 8,968,702 9,847,085
Noncurrent liabilities
Bonds payable (Notes 13 and 23) 40,000 40,000 361,304 361,304
Long-term loans payable (Notes 7, 13 and 24) 101,722 78,104 918,820 705,488
Nonrecourse loans payable (Notes 7, 13 and 24) 62,151 67,993 561,390 614,156
Lease obligations (Notes 13 and 24) 296 442 2,677 3,997
Deferred tax liabilities (Note 17) 21,229 5,336 191,754 48,206
Deferred tax liabilities for land revaluation (Note 17) 18,644 18,893 168,405 170,660
Provision for stock payments for directors 401 433 3,630 3,919
Provision for environmental measures 26 239 237 2,161
Liability for retirement benefits (Note 16) 47,758 52,598 431,382 475,098
Other 25,493 25,584 230,269 231,098
Total noncurrent liabilities 317,723 289,627 2,869,872 2,616,092
Total liabilities 1,310,648 1,379,798 11,838,575 12,463,177
Net assets
Shareholders' equity
Capital stock 57,752 57,752 521,657 521,657
Capital surplus 42,641 42,825 385,166 386,826
Retained earnings 661,512 587,012 5,975,186 5,302,255
Treasury stock (2,090) (2,121) (18,885) (19,160)
Total shareholders' equity 759,816 685,469 6,863,124 6,191,577
Accumulated other comprehensive income
Valuation difference on available-for-sale securities 138,542 104,775 1,251,397 946,398
Deferred gains (losses) on hedges 7,471 6,837 67,484 61,762
Revaluation reserve for land (Note 7) 20,379 19,076 184,076 172,307
Foreign currency translation adjustments 1,349 1,306 12,190 11,803
Retirement benefit asset and liability adjustments 3,449 426 31,161 3,850
Total accumulated other comprehensive income 171,191 132,422 1,546,309 1,196,122
Non-controlling interests 30,970 32,606 279,748 294,522
Total net assets 961,979 850,498 8,689,182 7,682,223
Total liabilities and net assets \ 2,272,628 \ 2,230,297 $ 20,527,758 $ 20,145,401The accompanying notes to the consolidated financial statements are an integral part of this statement.
Thousands of U.S. dollars (Note 2)Millions of yen
2
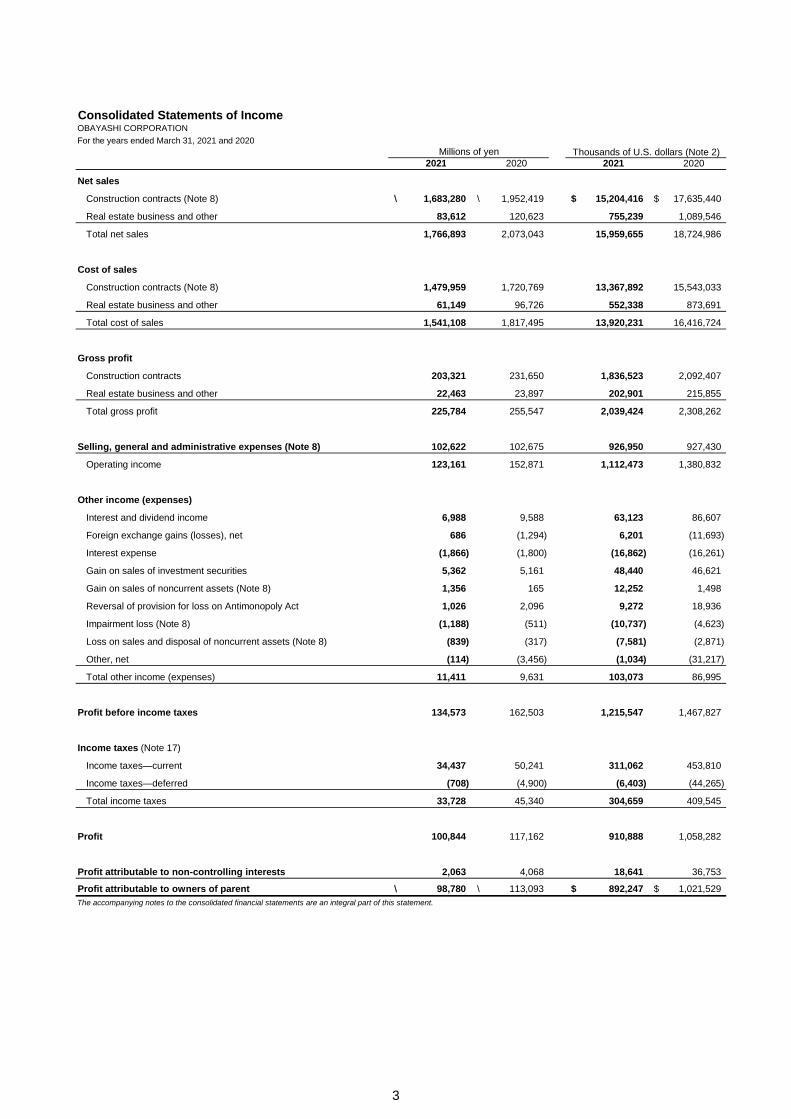
Consolidated Statements of IncomeOBAYASHI CORPORATIONFor the years ended March 31, 2021 and 2020
2021 2020 2021 2020
Net sales
Construction contracts (Note 8) \ 1,683,280 \ 1,952,419 $ 15,204,416 $ 17,635,440
Real estate business and other 83,612 120,623 755,239 1,089,546
Total net sales 1,766,893 2,073,043 15,959,655 18,724,986
Cost of sales
Construction contracts (Note 8) 1,479,959 1,720,769 13,367,892 15,543,033
Real estate business and other 61,149 96,726 552,338 873,691
Total cost of sales 1,541,108 1,817,495 13,920,231 16,416,724
Gross profit
Construction contracts 203,321 231,650 1,836,523 2,092,407
Real estate business and other 22,463 23,897 202,901 215,855
Total gross profit 225,784 255,547 2,039,424 2,308,262
Selling, general and administrative expenses (Note 8) 102,622 102,675 926,950 927,430
Operating income 123,161 152,871 1,112,473 1,380,832
Other income (expenses)
Interest and dividend income 6,988 9,588 63,123 86,607
Foreign exchange gains (losses), net 686 (1,294) 6,201 (11,693)
Interest expense (1,866) (1,800) (16,862) (16,261)
Gain on sales of investment securities 5,362 5,161 48,440 46,621
Gain on sales of noncurrent assets (Note 8) 1,356 165 12,252 1,498
Reversal of provision for loss on Antimonopoly Act 1,026 2,096 9,272 18,936
Impairment loss (Note 8) (1,188) (511) (10,737) (4,623)
Loss on sales and disposal of noncurrent assets (Note 8) (839) (317) (7,581) (2,871)
Other, net (114) (3,456) (1,034) (31,217)
Total other income (expenses) 11,411 9,631 103,073 86,995
Profit before income taxes 134,573 162,503 1,215,547 1,467,827
Income taxes (Note 17)
Income taxes―current 34,437 50,241 311,062 453,810
Income taxes―deferred (708) (4,900) (6,403) (44,265)
Total income taxes 33,728 45,340 304,659 409,545
Profit 100,844 117,162 910,888 1,058,282
Profit attributable to non-controlling interests 2,063 4,068 18,641 36,753
Profit attributable to owners of parent \ 98,780 \ 113,093 $ 892,247 $ 1,021,529The accompanying notes to the consolidated financial statements are an integral part of this statement.
Thousands of U.S. dollars (Note 2)Millions of yen
3

Consolidated Statements of Comprehensive IncomeOBAYASHI CORPORATIONFor the years ended March 31, 2021 and 2020
2021 2020 2021 2020
Profit \ 100,844 \ 117,162 $ 910,888 $ 1,058,282
Other comprehensive income
Valuation difference on available-for-sale securities 33,765 (45,357) 304,993 (409,698)
Deferred gains (losses) on hedges (46) 5,971 (419) 53,936
Foreign currency translation adjustments (1,526) 2,693 (13,789) 24,329
Retirement benefit asset and liability adjustments 3,019 (1,753) 27,274 (15,839)Share of other comprehensive income of affiliates accounted forby the equity method 666 (250) 6,017 (2,262)
Total other comprehensive income (Note 9) 35,878 (38,697) 324,077 (349,535)
Comprehensive income \ 136,723 \ 78,465 $ 1,234,966 $ 708,747
Comprehensive income attributable to:
Owners of parent \ 136,246 \ 73,065 $ 1,230,665 $ 659,973
Non-controlling interests 476 5,399 4,300 48,774The accompanying notes to the consolidated financial statements are an integral part of this statement.
Thousands of U.S. dollars (Note 2)Millions of yen
4

Consolidated Statements of Changes in Net AssetsOBAYASHI CORPORATIONFor the year ended March 31, 2021
Millions of yen
Balance at the beginning of current period \ 57,752 \ 42,825 \ 587,012 \ (2,121) \ 685,469
Changes during period
Cash dividends paid (22,977) (22,977)
Profit attributable to owners of parent 98,780 98,780
Reversal of revaluation reserve for land (1,302) (1,302)
Purchase of treasury stock (3) (3)
Disposal of treasury stock 33 33Share changes in parent's ownershipinterests associated with transaction withnon-controlling interests
(183) (183)
Net changes in items other than those inshareholders' equity
Total changes during period - (183) 74,500 30 74,346
Balance at the end of current period \ 57,752 \ 42,641 \ 661,512 \ (2,090) \ 759,816
Balance at the beginning of current period \ 104,775 \ 6,837 \ 19,076 \ 1,306 \ 426 \ 132,422 \ 32,606 \ 850,498
Changes during period
Cash dividends paid (22,977)
Profit attributable to owners of parent 98,780
Reversal of revaluation reserve for land (1,302)
Purchase of treasury stock (3)
Disposal of treasury stock 33Share changes in parent's ownershipinterests associated with transaction withnon-controlling interests
(183)
Net changes in items other than those inshareholders' equity 33,766 633 1,302 42 3,023 38,769 (1,635) 37,133
Total changes during period 33,766 633 1,302 42 3,023 38,769 (1,635) 111,480
Balance at the end of current period \ 138,542 \ 7,471 \ 20,379 \ 1,349 \ 3,449 \ 171,191 \ 30,970 \ 961,979
Shareholders' equity
Capital stock Capital surplus
Foreigncurrency
translationadjustments
Retirementbenefit assetand liabilityadjustments
Valuationdifference onavailable-for-
sale securities
Deferred gains(losses) on
hedges
Revaluationreserve for land
Accumulated other comprehensive income
Non-controllinginterests
Total netassets
Retainedearnings Treasury stock
Totalshareholders'
equity
Totalaccumulated
othercomprehensive
income
5

For the year ended March 31, 2021
Thousands of U.S. dollars (Note 2)
Balance at the beginning of current period $ 521,657 $ 386,826 $ 5,302,255 $ (19,160) $ 6,191,577
Changes during period
Cash dividends paid (207,547) (207,547)
Profit attributable to owners of parent 892,247 892,247
Reversal of revaluation reserve for land (11,768) (11,768)
Purchase of treasury stock (30) (30)
Disposal of treasury stock 305 305Share changes in parent's ownershipinterests associated with transactionwith non-controlling interests
(1,660) (1,660)
Net changes in items other than thosein shareholders' equity
Total changes during period - (1,660) 672,931 275 671,546
Balance at the end of current period $ 521,657 $ 385,166 $ 5,975,186 $ (18,885) $ 6,863,124
Balance at the beginning of current period $ 946,398 $ 61,762 $ 172,307 $ 11,803 $ 3,850 $ 1,196,122 $ 294,522 $ 7,682,223
Changes during period
Cash dividends paid (207,547)
Profit attributable to owners of parent 892,247
Reversal of revaluation reserve for land (11,768)
Purchase of treasury stock (30)
Disposal of treasury stock 305Share changes in parent's ownershipinterests associated with transactionwith non-controlling interests
(1,660)
Net changes in items other than thosein shareholders' equity 304,998 5,722 11,768 386 27,310 350,186 (14,774) 335,412
Total changes during period 304,998 5,722 11,768 386 27,310 350,186 (14,774) 1,006,958
Balance at the end of current period $ 1,251,397 $ 67,484 $ 184,076 $ 12,190 $ 31,161 $ 1,546,309 $ 279,748 $ 8,689,182
The accompanying notes to the consolidated financial statements are an integral part of this statement.
Accumulated other comprehensive income
Non-controllinginterests
Total netassets
Valuationdifference onavailable-for-
sale securities
Deferred gains(losses) on
hedges
Revaluationreserve for land
Foreigncurrency
translationadjustments
Retirementbenefit assetand liabilityadjustments
Totalaccumulated
othercomprehensive
income
Shareholders' equity
Capital stock Capital surplus Retainedearnings Treasury stock
Totalshareholders'
equity
6

For the year ended March 31, 2020
Millions of yen
Balance at the beginning of current period \ 57,752 \ 42,540 \ 498,195 \ (2,132) \ 596,355
Changes during period
Cash dividends paid (24,413) (24,413)
Profit attributable to owners of parent 113,093 113,093
Reversal of revaluation reserve for land 138 138
Purchase of treasury stock (5) (5)
Disposal of treasury stock 16 16
Share changes in parent's ownershipinterests associated with transactionwith non-controlling interests
285 285
Net changes in items other than thosein shareholders' equity
Total changes during period - 285 88,817 10 89,113
Balance at the end of current period \ 57,752 \ 42,825 \ 587,012 \ (2,121) \ 685,469
Balance at the beginning of current period \ 150,115 \ 1,113 \ 19,214 \ (33) \ 2,178 \ 172,588 \ 29,204 \ 798,149
Changes during period
Cash dividends paid (24,413)
Profit attributable to owners of parent 113,093
Reversal of revaluation reserve for land 138
Purchase of treasury stock (5)
Disposal of treasury stock 16
Share changes in parent's ownershipinterests associated with transactionwith non-controlling interests
285
Net changes in items other than thosein shareholders' equity (45,339) 5,723 (138) 1,340 (1,752) (40,165) 3,401 (36,764)
Total changes during period (45,339) 5,723 (138) 1,340 (1,752) (40,165) 3,401 52,349
Balance at the end of current period \ 104,775 \ 6,837 \ 19,076 \ 1,306 \ 426 \ 132,422 \ 32,606 \ 850,498
Non-controllinginterests
Total netassets
Totalshareholders'
equity
Retirementbenefit assetand liabilityadjustments
Totalaccumulated
othercomprehensive
income
Accumulated other comprehensive income
Revaluationreserve for land
Foreigncurrency
translationadjustments
Valuationdifference onavailable-for-
sale securities
Deferred gains(losses) on
hedges
Capital stock Capital surplus
Shareholders' equity
Retainedearnings Treasury stock
7

For the year ended March 31, 2020
Thousands of U.S. dollars (Note 2)
Balance at the beginning of current period $ 521,657 $ 384,247 $ 4,500,000 $ (19,257) $ 5,386,646
Changes during period
Cash dividends paid (220,521) (220,521)
Profit attributable to owners of parent 1,021,529 1,021,529
Reversal of revaluation reserve for land 1,247 1,247
Purchase of treasury stock (47) (47)
Disposal of treasury stock 144 144
Share changes in parent's ownershipinterests associated with transactionwith non-controlling interests
2,578 2,578
Net changes in items other than thosein shareholders' equity
Total changes during period - 2,578 802,255 97 804,931
Balance at the end of current period $ 521,657 $ 386,826 $ 5,302,255 $ (19,160) $ 6,191,577
Balance at the beginning of current period $ 1,355,934 $ 10,060 $ 173,554 $ (301) $ 19,677 $ 1,558,926 $ 263,796 $ 7,209,369
Changes during period
Cash dividends paid (220,521)
Profit attributable to owners of parent 1,021,529
Reversal of revaluation reserve for land 1,247
Purchase of treasury stock (47)
Disposal of treasury stock 144
Share changes in parent's ownershipinterests associated with transactionwith non-controlling interests
2,578
Net changes in items other than thosein shareholders' equity (409,536) 51,701 (1,247) 12,104 (15,826) (362,803) 30,726 (332,076)
Total changes during period (409,536) 51,701 (1,247) 12,104 (15,826) (362,803) 30,726 472,854
Balance at the end of current period $ 946,398 $ 61,762 $ 172,307 $ 11,803 $ 3,850 $ 1,196,122 $ 294,522 $ 7,682,223
The accompanying notes to the consolidated financial statements are an integral part of this statement.
Accumulated other comprehensive income
Non-controllinginterests
Total netassets
Valuationdifference onavailable-for-
sale securities
Deferred gains(losses) on
hedges
Revaluationreserve for land
Foreigncurrency
translationadjustments
Retirementbenefit assetand liabilityadjustments
Totalaccumulated
othercomprehensive
income
Shareholders' equity
Capital stock Capital surplus Retainedearnings Treasury stock
Totalshareholders'
equity
8

Consolidated Statements of Cash FlowsOBAYASHI CORPORATIONFor the years ended March 31, 2021 and 2020
2021 2020 2021 2020Net cash provided by (used in) operating activities
Profit before income taxes \ 134,573 \ 162,503 $ 1,215,547 $ 1,467,827Depreciation and amortization 20,038 19,880 180,995 179,568Impairment loss 1,188 511 10,737 4,623Increase (decrease) in allowance for doubtful accounts 17 (50) 154 (456)Increase (decrease) in provision for loss on construction contracts 891 10,743 8,054 97,040Increase (decrease) in provision for loss on Antimonopoly Act (4,145) (6,179) (37,440) (55,821)Increase (decrease) in provision for loss on real estate business and other - (993) - (8,969)Increase (decrease) in liability for retirement benefits (424) (788) (3,831) (7,126)Interest and dividend income (6,988) (9,588) (63,123) (86,607)Interest expense 1,866 1,800 16,862 16,261Loss (gain) on sales of noncurrent assets (1,124) (50) (10,157) (457)Loss (gain) on sales of short-term and long-term investment securities (5,312) (4,717) (47,983) (42,608)Decrease (increase) in notes and accounts receivable―trade 14,647 84,441 132,303 762,723Decrease (increase) in costs on uncompleted construction contracts (31,141) (2,772) (281,285) (25,043)Decrease (increase) in inventories (5,653) 8,421 (51,067) 76,064Decrease (increase) in inventories for PFI and other projects 15,404 (9,391) 139,147 (84,825)Decrease (increase) in other assets 4,645 15,370 41,963 138,838Increase (decrease) in notes and accounts payable―trade (77,678) (14,922) (701,642) (134,786)Increase (decrease) in advances received on uncompleted constructioncontracts 20,284 (7,472) 183,223 (67,496)Increase (decrease) in other liabilities (12,868) 26,292 (116,231) 237,490Other, net 1,454 8,744 13,138 78,986
Subtotal 69,676 281,781 629,364 2,545,225Interest and dividend received 7,827 9,698 70,706 87,606Interest paid (1,830) (1,777) (16,530) (16,056)Income taxes (paid) refunded (47,753) (47,991) (431,336) (433,490)Surcharges paid (3,118) (4,083) (28,167) (36,884)
Net cash provided by (used in) operating activities 24,803 237,628 224,036 2,146,400
Net cash provided by (used in) investing activitiesPayments into time deposits (38,801) (38,901) (350,474) (351,384)Proceeds from withdrawal of time deposits 32,044 33,359 289,442 301,322Purchase of property, plant and equipment and intangible assets (57,431) (47,471) (518,758) (428,795)Proceeds from sales of property, plant and equipment and intangible assets 2,726 504 24,629 4,553Purchase of short-term and long-term investment securities (4,973) (5,369) (44,927) (48,504)Proceeds from sales and redemption of short-term and long-term investmentsecurities 11,971 10,859 108,136 98,085Payments of loans receivable (79) (408) (714) (3,691)Collection of loans receivable 168 224 1,518 2,027Payments for purchase of shares of subsidiaries resulting in change in scopeof consolidation (6,671) - (60,264) -Payments for sales of shares of subsidiaries resulting in change in scope ofconsolidation - (113) - (1,022)Other, net (18,028) - (162,845) -
Net cash provided by (used in) investing activities (79,075) (47,318) (714,258) (427,410)
Net cash provided by (used in) financing activitiesNet increase (decrease) in short-term loans payable - (1,700) - (15,355)Repayments of lease obligations (883) (344) (7,978) (3,110)Proceeds from long-term loans payable 41,161 10,212 371,796 92,246Repayment of long-term loans payable (17,464) (17,879) (157,748) (161,495)Proceeds from nonrecourse loans payable 1,605 3,302 14,499 29,832Payment of nonrecourse loans payable (7,632) (16,835) (68,943) (152,064)Proceeds from issuance of bonds - 10,000 - 90,326Redemption of bonds - (10,000) - (90,326)Cash dividends paid (22,977) (24,413) (207,547) (220,521)Cash dividends paid to non-controlling interests (1,754) (1,370) (15,846) (12,380)Payments from changes in ownership interests in subsidiaries that do notresult in change in scope of consolidation (534) (364) (4,828) (3,287)Other, net (3) (5) (30) (47)
Net cash provided by (used in) financing activities (8,483) (49,397) (76,627) (446,183)Effect of exchange rate changes on cash and cash equivalents 285 332 2,577 3,007Net increase (decrease) in cash and cash equivalents (62,470) 141,245 (564,272) 1,275,814Cash and cash equivalents at beginning of period 298,945 157,699 2,700,253 1,424,438Cash and cash equivalents at end of period (Note 11) \ 236,474 \ 298,945 $ 2,135,980 $ 2,700,253The accompanying notes to the consolidated financial statements are an integral part of this statement.
Thousands of U.S. dollars (Note 2)Millions of yen
9

Notes to Consolidated Financial StatementsOBAYASHI CORPORATION for the years ended March 31, 2021 and 2020
1. Basis of Presenting Consolidated Financial Statements
2. U.S. Dollar Amounts
3. Summary of Significant Accounting Policies
The accompanying consolidated financial statements were prepared based on the accounts maintained by OBAYASHICORPORATION (the "Company") and its subsidiaries (collectively, the "Companies") in accordance with accounting principlesgenerally accepted in Japan, which are different in certain respects as to the application and disclosure requirements of InternationalFinancial Reporting Standards, and are compiled from the consolidated financial statements prepared by the Company as required bythe Financial Instruments and Exchange Law of Japan.Certain amounts in the prior year's financial statements were reclassified to conform to the changes made for the latest fiscal year.
The accounts of the consolidated financial statements presented herein are expressed in Japanese yen by rounding down to thenearest million. The U.S. dollar amounts shown in the accompanying consolidated financial statements and notes thereto weretranslated from the original Japanese yen into U.S. dollars on the basis of \110.71 to US$1, the rate of exchange prevailing at March31, 2021, and were then rounded down to the nearest thousand. These U.S. dollar amounts are not intended to imply that the Japaneseyen amounts have been or could be converted, realized or settled in U.S. dollars at this or any other rate.
(1) Scope of consolidation and application of the equity methodThe Company had 97 subsidiaries at March 31, 2021. The consolidated financial statements as of and for the years ended March 31,2021 and 2020 included the accounts of the Company and all subsidiaries.All significant intercompany accounts and transactions are eliminated. Investments in all affiliates (25 companies as of March 31, 2021)are accounted for by the equity method.
(2) Fiscal year for consolidated subsidiariesA domestic consolidated subsidiary and certain foreign consolidated subsidiaries (36 companies) have a fiscal year that ends onDecember 31 and a domestic consolidated subsidiary has a fiscal year that ends on January 31. The consolidated financial statementswere prepared based on the financial statements as of the same date. Necessary adjustments for consolidation were made onsignificant transactions that took place during the period between the fiscal year-end of the subsidiaries and that of the Company.Consolidated subsidiaries other than those referred to above have the same fiscal year as the Company, which ends on March 31.
(4) Foreign currency translationReceivables and payables denominated in foreign currencies are translated into Japanese yen at the rate of exchange in effect at thebalance sheet date. The resulting exchange gains and losses from translation are recognized in the consolidated statements ofincome.The balance sheet accounts of the foreign consolidated subsidiaries are translated into Japanese yen at the rates of exchange in effectat the balance sheet date of subsidiaries, except for the components of net assets excluding non-controlling interests which aretranslated at their historical exchange rates. Revenue and expense accounts are translated at the rates of exchange in effect at thebalance sheet date of subsidiaries. Differences arising from the translation are presented as foreign currency translation adjustmentsand non-controlling interests in the consolidated financial statements.
(3) GoodwillGoodwill is amortized by the straight-line method over a period of 5 years. However, goodwill that is not material is charged to incomein the year of acquisition.Differences between the cost and underlying net equity of investments in affiliates accounted for by the equity method are immaterialand charged or credited to income as they occur.
(6) Short-term investment securities and investment securitiesSecurities are classified into two categories: held-to-maturity and other securities. Held-to-maturity securities are carried at amortizedcost. Marketable securities classified as other securities are carried at fair value with changes in unrealized holding gain or loss, net ofthe applicable income taxes, included directly in net assets. Non-marketable securities classified as other securities are carried at cost.Cost of securities sold is determined by the moving average method.
(5) Cash equivalentsAll highly liquid investments, generally with a maturity of three months or less when purchased, which are readily convertible into knownamounts of cash and are so near maturity that they represent only an insignificant risk of any change in value are considered cashequivalents.
(8) Property, plant and equipmentThe Company and its domestic consolidated subsidiaries mainly calculate depreciation by the declining-balance method, while straight-line method is applied to the buildings and fixtures acquired on or after April 1, 1998 and facilities attached to buildings and other non-building structures acquired on or after April 1, 2016. Foreign consolidated subsidiaries mainly apply the straight-line method.The useful lives and residual values of depreciable assets are estimated mainly in accordance with the Corporate Tax Law.
(7) InventoriesReal estate held for sale, costs on uncompleted construction contracts, costs on real estate business, inventories for PFI and otherprojects and costs on other business are all stated at cost determined by the specific identification method.Raw materials and supplies are stated at cost determined by the first-in first-out method.Inventories are stated at the lower of cost or net realizable value.
10

(15) Provision for stock payments for directorsProvision for stock payments for directors is provided for stock award debt based on predetermined regulations for awarding stock,which is prepared for future awards of the Company shares to its directors and executive officers.
(14) Provision for loss on Antimonopoly ActProvision for loss on Antimonopoly Act is provided for the estimated surcharges and other based on the Antimonopoly Act.
(13) Provision for loss on construction contractsProvision for loss on construction contracts is provided at the estimated amount for the future losses on contract backlog at the balancesheet date which will probably be incurred and which can be reasonably estimated.
(d) Assessment of hedge effectivenessHedge effectiveness is not assessed when substantial terms and conditions of the hedging instruments and the hedged forecastedtransactions are the same.Regarding interest rate swaps, the evaluation of hedge effectiveness is omitted when they meet certain criteria under the short-cutmethod, otherwise the hedge effectiveness is evaluated by comparing estimated cumulative cash flows of hedging instruments andthose of hedged items.
(b) Hedging instruments and hedged itemsTo hedge foreign exchange risks related to the monetary assets and liabilities denominated in foreign currencies and projected futureforeign currency transactions, foreign exchange forward contracts and non-deliverable foreign exchange forward contracts areemployed as hedging instruments. To hedge the interest-rate risks related to loans payable, interest rate swaps are employed ashedging instruments.
(c) Hedging policyThe Companies utilize derivative financial instruments only for the purpose of hedging future risks of fluctuation of foreign currencyexchange rates or interest rates in accordance with internal rules.
(18) Derivatives and hedge accounting(a) Method of hedge accountingHedging instruments are valued at fair value and accounted for using the deferral method of accounting.The monetary assets and liabilities denominated in foreign currencies, for which foreign exchange forward contracts are used to hedgethe foreign currency fluctuations, are translated at the contracted rate if the foreign exchange forward contracts qualify for hedgeaccounting.The interest rate swaps, which qualify for hedge accounting and meet specific matching criteria, are not remeasured at market value,but the differential paid or received under the swap agreements is charged to income (short-cut method).
(17) Retirement benefitsRetirement benefit obligation for employees is attributed to each period by the benefit formula method.Actuarial differences are amortized commencing in the following year after the differences is recognized primarily by the straight-linemethod over periods (5 years to 10 years) which are shorter than the average remaining years of service of the employees.Prior service cost (PSC) is amortized by the straight-line method over a period of 10 years which is shorter than the average remainingyears of service of the employees, while PSC of certain subsidiaries is expensed as incurred.
(16) Provision for environmental measuresProvision for environmental measures is provided based on an estimate of costs for disposal of Polychlorinated Biphenyl (PCB) waste,which the Company and its domestic subsidiaries are obliged to dispose of by the Act on Special Measures Concerning Promotion ofProper Treatment of PCB Waste.
(12) Provision for warranties for completed constructionProvision for warranties for completed construction is provided to cover expenses for defects claimed concerning completed work,based on the estimated amount of compensation to be paid in the future for the work completed during the fiscal year.
(11) Allowance for doubtful accountsAllowance for doubtful accounts is provided based on the historical experience with respect to write-offs for the Company and itsdomestic subsidiaries and based on an estimate of the amount for specific uncollectible accounts for the Companies.
(10) Leased assetsAmortization of leased assets under finance leases that do not transfer ownership of the leased assets to the lessee is calculated bythe straight-line method over the lease period with a residual value of zero.
(9) Intangible assetsIntangible fixed assets are amortized by the straight-line method. Computer software for internal use is amortized by the straight-linemethod over the estimated useful life of 5 years.
(19) Recognizing revenues and costs of construction contractsRevenues and costs of construction contracts of which the percentage of completion can be reliably estimated are recognized by thepercentage-of-completion method. The percentage of completion is calculated at the cost incurred as a percentage of the estimatedtotal cost. The completed-contract method continues to be applied for contracts for which the percentage of completion cannot bereliably estimated.Revenues from construction contracts and the related costs of the overseas subsidiaries are mainly recorded on the percentage-of-completion method.
11

4. Significant Accounting Estimates
2. Major assumptionsThe major assumptions used in estimating the total construction revenue, the total construction costs, and the percentage ofcompletion by the percentage-of-completion method, and the estimated loss on construction contracts in recording the provision forloss on construction contracts are the likelihood of obtaining additional contract payments, the quantity and number of constructionmaterials and labor to be used in the course of construction, the unit procurement costs, and the feasibility of cost reduction activities.Each of these assumptions is reasonably set based on the latest construction status and negotiations with ordering parties andsubcontractors, taking into account the impact of the COVID-19 pandemic. 3. Impact on the consolidated financial statements for the following fiscal yearAlthough the major assumptions may have an impact on revenues from construction contracts due to the uncertainty of estimates, theCompanies do not anticipate any changes in assumptions that would have a significant impact on the consolidated financial statementsfor the following fiscal year and beyond when making estimates at the end of the current consolidated fiscal year.
(a) The amounts recorded in the consolidated financial statements for the current fiscal yearImpairment loss: \540 million (US$4,881 thousand)It should be noted that investment and rental properties recorded in the consolidated balance sheets is \411,386 million (US$3,715,889thousand) as of the fiscal year ended March 31, 2021.(b) Other information that contributes to the understanding of users of consolidated financial statements 1. Calculation methodFor investment and rental properties for which there is an indicator of impairment, if the total undiscounted future cash flows are lessthan the carrying amount, the carrying amount of the property is reduced to the recoverable amount, and the amount of the reduction isrecorded as other expenses in the consolidated statements of income for the fiscal year.
(23) Consolidated tax payment systemThe Companies apply the consolidated tax payment system.
(25) Accounting method for joint ventures in construction businessThe accounting method for joint ventures in the construction business is mainly based on the accounting method for recognizingassets, liabilities, income and expenses in proportion to the investment of the members.
(22) Income taxesThe Companies apply deferred tax accounting for income taxes which requires recognition of income taxes by the asset/liabilitymethod.Under the asset/liability method, deferred tax assets and liabilities are determined based on the difference between financial reportingbasis and the tax basis of the assets and liabilities and are measured using the enacted tax rates and laws which will be in effect whenthe differences are expected to reverse.
(21) Consumption taxesConsumption tax and local consumption tax are accounted for under the tax-exclusive method.
(20) Revenues and expenses associated with finance lease transactionsSales and cost of sales are recognized upon receipt of lease payment.
(24) Application of deferred tax accounting for transition from consolidated tax payment system to group tax sharing systemThe Company and some of its domestic subsidiaries do not apply the provisions of paragraph 44 of the "Guidance on AccountingStandard for Tax Effect Accounting" (ASBJ Guidance No. 28, February 16, 2018), to the items for which the non-consolidated taxpayment system was reviewed in conjunction with the transition to the group tax sharing system established in "Act for Partial Revisionof the Income Tax Act, etc." (Act No. 8, 2020) and the transition to the group tax sharing system, in accordance with paragraph 3 of the"Practical Solution on the Treatment of Tax Effect Accounting for the Transition from the Consolidated Taxation System to the GroupTax Sharing System" (PITF No. 39, March 31, 2020), and the amount of deferred tax assets and deferred tax liabilities are based onthe provisions of the tax law before the revision.
(1) Application of the percentage-of-completion method
(2) Impairment of investment and rental properties
\1,517,425 million (US$13,706,308 thousand)(b) Other information that contributes to the understanding of users of consolidated financial statements 1. Calculation methodThe Companies applies the percentage-of-completion method for the portion of work completed up to the end of the fiscal year endedMarch 31, 2021 for construction contracts for which completion is deemed to be certain (the cost-to-cost method is used to estimateprogress toward completion of construction). Specifically, in applying the percentage-of-completion method, revenues fromconstruction contracts are determined by multiplying total construction revenue by progress toward completion of construction, which isbased on total construction costs and corresponds to costs actually incurred up until the end of the fiscal year. In estimating the totalconstruction revenue, the total construction costs, and the percentage of completion of construction, the Companies make reasonableforecasts and judgments based on the business environment, status of construction work, negotiations with ordering parties, and otherfactors.If it is likely that total construction costs associated with construction contracts will exceed total construction revenue and if the amountof the excess can be reasonably estimated, then the amount resulting from deducting the profit or loss already recorded for suchconstruction contracts from the expected amount of the excess of costs over revenue (hereinafter, “loss on construction contracts”) isaccounted for as loss in the period in which loss on construction contracts is expected, and a provision for loss on constructioncontracts is recorded.
(a) The amounts recorded in the consolidated financial statements for the current fiscal yearRevenues from construction contracts recognized by the percentage-of-completion method:
12

5. Standards Issued But Not Yet Effective
6. Additional Information
The "Accounting Standard for Disclosures about Accounting Estimates" (ASBJ Statement No. 31, March 31, 2020) is applied from thebeginning of the fiscal year ended March 31, 2021 and notes regarding significant accounting estimates are included in theconsolidated financial statements. However, in such notes, the contents related to the previous consolidated fiscal year are notdescribed in accordance with the transitional treatment prescribed in the proviso of paragraph 11 of the accounting standard.
2. Major assumptionsThe major assumptions used in assessing indicators of impairment and for recognizing and measuring impairment loss for investmentand rental properties are future cash flows, capitalization rates and discount rates, based on the operating conditions of each propertyand the market conditions for real estate leasing. Each of these assumptions is reasonably set based on the average annual netoperating income of each property for the most recent multiple years and capitalization rates obtained from external specializedagencies, taking into account the impact of the COVID-19 pandemic.
(2) Adoption of the "Accounting Standard for Disclosures about Accounting Estimates"
3. Impact on the consolidated financial statements for the following fiscal yearAlthough there is a possibility that estimates of market prices (fair values) and recoverable amounts may increase or decreasedepending on the operating conditions of each property, real estate leasing market conditions, and other factors, the Companies do notanticipate any changes in assumptions that would have a significant impact on the consolidated financial statements for the followingfiscal year and beyond when making estimates at the end of the current fiscal year.
(a) OverviewThis is a comprehensive accounting standard for revenue recognition. Specifically, the accounting standard establishes the followingfive-step model that will apply to revenue from customers: 1. Identify the contract(s) with a customer 2. Identify the performance obligations in the contract 3. Determine the transaction price 4. Allocate the transaction price to the performance obligations in the contract 5. Recognize revenue when (or as) the entity satisfies a performance obligation(b) Scheduled date of adoptionThe Companies will adopt the accounting standard and implementation guidance from the beginning of the fiscal year ending March31, 2022.(c) Impact of the adoption of accounting standard and implementation guidanceThe impact of the adoption of the accounting standards and related implementation guidance on the consolidated financial statementsis immaterial.
On March 30, 2018, the Accounting Standards Board of Japan (ASBJ) issued "Accounting Standard for Revenue Recognition" (ASBJStatement No.29, revised March 31, 2020) and "Implementation Guidance on Accounting Standard for Revenue Recognition" (ASBJGuidance No.30, revised March 26, 2021).
(1) Accounting Standard and Implementation Guidance on Revenue Recognition
(2) Accounting Standard for Fair Value Measurement and Related Implementation GuidanceOn July 4, 2019, the ASBJ issued “Accounting Standard for Fair Value Measurement ” (ASBJ Statement No. 30), and “ImplementationGuidance on Accounting Standard for Fair Value Measurement ” (ASBJ Guidance No. 31, revised June 17, 2021), along with relatedupdates to “Accounting Standard for Measurement of Inventories” (ASBJ Statement No. 9), “Accounting Standard for FinancialInstruments” (ASBJ Statement No. 10), and on March 31, 2020, “Implementation Guidance on Disclosures about Fair Value ofFinancial Instruments ” (ASBJ Guidance No. 19).(a) OverviewThe ASBJ has developed an “Accounting Standard for Fair Value Measurement” and “Implementation Guidance on AccountingStandard for Fair Value Measurement” (hereinafter collectively, the “Fair Value Measurement Standard”), which provide guidance forfair value measurement in order to improve comparability with internationally recognized accounting standards. The Fair ValueMeasurement Standard is applied with respect to the fair value of the following items; • Financial instruments defined in “Accounting Standard for Financial Instruments” • Inventories held for trading purposes defined in “Accounting Standard for Measurement of Inventories”(b) Scheduled date of adoptionThe Companies adopt the accounting standards and related implementation guidance from the beginning of the fiscal year endingMarch 31, 2022.(c) Impact of adoption of revised accounting standard and related implementation guidanceThe impact of the adoption of the accounting standards and related implementation guidance on the consolidated financial statementsis immaterial.
(1) Disclosure of significant accounting policies in accordance with the adoption of the "Accounting Standard for Disclosures aboutAccounting Policies, Accounting Changes and Error Corrections"As a result of the new application of the "Accounting Standard for Disclosures about Accounting Policies, Accounting Changes andError Corrections" (ASBJ Statement No. 24, March 31, 2020), the accounting principles and procedures adopted in cases where theprovisions of the relevant accounting standards are not clear are described in "(25) Accounting method for joint ventures in constructionbusiness" in "3. Summary of Significant Accounting Policies," the accounting method for joint ventures in the construction business ismainly based on the accounting method for recognizing assets, liabilities, income and expenses in proportion to the investment of themembers.
13

(b) The Company's own stock in the BIP TrustThe Company's own stock in the BIP Trust is recorded in "Treasury stock" under net assets based on the book value in the BIP Trust(excluding ancillary expenses). The book value and the number of these treasury shares in the BIP Trust as of March 31, 2021 and2020 are \400 million (US$3,615 thousand) and 372,318 shares and \434 million (US$3,921 thousand) and 403,901 shares,respectively.
(a) Transaction summaryThe Company has introduced a performance-linked stock compensation plan as an incentive plan for its directors and executiveofficers (the "Directors") since the fiscal year ended March 31, 2016. The plan is highly transparent and objective and closely linkedwith the Company's performance for the Directors, with the goal of increasing awareness of the importance of contributing to furtherenhancing the corporate value and performance over the medium to long term.The Company's shares are acquired through the Board Incentive Plan Trust (the "BIP Trust") and awarded to the Directors inaccordance with performance targets achieved.
(3) Performance-linked stock compensation plan for directors and executive officers
14

7. Notes to Consolidated Balance Sheets
(1) Breakdown of "Inventories for PFI and other projects"Millions of yen Thousands of U.S. dollars
At March 31 2021 2020 2021 2020
Costs on PFI business \ 38,095 \ 53,500 $ 344,097 $ 483,244
(2) Breakdown of "Other inventories"Millions of yen Thousands of U.S. dollars
At March 31 2021 2020 2021 2020
Costs on other business \ 4,102 \ 4,423 $ 37,060 $ 39,954
Raw materials and supplies 4,103 4,320 37,067 39,026
Total \ 8,206 \ 8,744 $ 74,128 $ 78,981
(3) Accumulated depreciation and amortization of property, plant and equipmentMillions of yen Thousands of U.S. dollars
At March 31 2021 2020 2021 2020
\ 183,074 \ 184,058 $ 1,653,636 $ 1,662,532
(4) Investments in affiliates included in investment securitiesMillions of yen Thousands of U.S. dollars
At March 31 2021 2020 2021 2020
\ 7,138 \ 6,458 $ 64,479 $ 58,336
(5) Revaluation reserve for land
(6) Pledged assets
Millions of yen Thousands of U.S. dollarsAt March 31 2021 2020 2021 2020
Assets pledged as collateral
Cash and deposits \ 1,560 \ 1,621 $ 14,092 $ 14,645
Buildings and structures 4,033 4,239 36,434 38,289
Machinery, vehicles, tools, furniture and fixtures 38 27 347 251
Land 10,981 10,981 99,192 99,192
Investment securities 143 - 1,293 -
Total \ 16,757 \ 16,869 $ 151,360 $ 152,378
Liabilities secured thereby
Short-term loans payable \ 300 \ 300 $ 2,709 $ 2,709
Long-term loans payable 300 600 2,709 5,419
Total \ 600 \ 900 $ 5,419 $ 8,129
(7) Deposited assets
Millions of yen Thousands of U.S. dollarsAt March 31 2021 2020 2021 2020
Short-term investment securities \ 56 \ 154 $ 512 $ 1,394
Investment securities 293 349 2,649 3,155
Investments and other assets―other 538 392 4,865 3,549
Total \ 888 \ 896 $ 8,028 $ 8,099
Assets pledged as collateral for long-term loans payable and others are as follows:
Pursuant to the "Law Concerning the Revaluation of Land," land used for business operations was revalued on March 31, 2000. Theexcess of the revalued carrying amount over the book value before revaluation is included in net assets as revaluation reserve for land,net of applicable income taxes.The revaluation of the land was determined based on the official standard notice prices in accordance with Article 2, Paragraph 1 of the"Enforcement Ordinance Concerning Land Revaluation" and the appraisal value made by the certified real estate appraisers inaccordance with Article 2, Paragraph 5 of the same ordinance with certain necessary adjustments.
Assets deposited under the "Law for Execution of Warranty against Housing Defects" and the others are as follows:
15

(8) Contingent liabilitiesThe Companies are contingently liable for the following:
Millions of yen Thousands of U.S. dollarsAt March 31 2021 2020 2021 2020
\ 35 \ 52 $ 321 $ 476
(9) Estimated loss on uncompleted construction contracts
Millions of yen Thousands of U.S. dollarsAt March 31 2021 2020 2021 2020
\ 11,771 \ 221 $ 106,326 $ 2,000
(10) Directly deducted advanced depreciationAdvanced depreciation for tax purposes was charged directly to the following noncurrent assets:
Millions of yen Thousands of U.S. dollarsAt March 31 2021 2020 2021 2020
Buildings and structures \ 46 \ 42 $ 417 $ 385
Machinery, vehicles, tools, furniture and fixtures - 0 - 0
Construction in progress 7 27 70 246
Total \ 54 \ 70 $ 488 $ 632
(11) Nonrecourse loans
Millions of yen Thousands of U.S. dollarsAt March 31 2021 2020 2021 2020
Cash and deposits \ 18,450 \ 17,299 $ 166,657 $ 156,263
9,926 8,871 89,666 80,128
Inventories for PFI and other projects 35,543 35,872 321,047 324,026
Buildings and structures 3,654 3,861 33,010 34,882
Machinery, vehicles, tools, furniture and fixtures 22,245 24,284 200,935 219,353
Total \ 89,821 \ 90,190 $ 811,318 $ 814,653
(12) Commitment lines
The total commitment lines available are as follows:Millions of yen Thousands of U.S. dollars
At March 31 2021 2020 2021 2020
Contract amount \ 180,000 \ 50,000 $ 1,625,869 $ 451,630
Outstanding borrowings - - - -
Available amount \ 180,000 \ 50,000 $ 1,625,869 $ 451,630
Nonrecourse loans are nonrecourse loans payable to financial institutions, which are issued to the Company's consolidated specialpurpose company and are backed by the related PFI business or the renewable energy business as collateral.Assets as collateral for the nonrecourse loans are as follows:
"Costs on uncompleted construction contracts" for which a construction loss is anticipated and "Provision for loss on constructioncontracts" are presented without being offset. The amounts of "Costs on uncompleted construction contracts," for which a constructionloss is anticipated, matching with "Provision for loss on construction contracts" are as follows:
Guarantees of long-term debt of employees
The Company has a commitment line agreement with syndicated financial institutions to ensure timely access to funds in case ofemergency. At March 31, 2021 and 2020, there are no outstanding balances under the agreement.This commitment line agreement includes financial covenants on net assets, ordinary income (loss) and the credit rating of theCompany.
Notes and accounts receivable from completedconstruction contracts and other
16

8. Notes to Consolidated Statements of Income
(1) Revenues from construction contracts recognized by the percentage-of-completion methodMillions of yen Thousands of U.S. dollars
For the years ended March 31 2021 2020 2021 2020
\ 1,517,425 \ 1,785,320 $ 13,706,308 $ 16,126,101
(2) Provision for loss on construction contracts included in cost of sales of construction contractsMillions of yen Thousands of U.S. dollars
For the years ended March 31 2021 2020 2021 2020
\ 3,114 \ 11,992 $ 28,127 $ 108,325
(3) The major components of "Selling, general and administrative expenses"Millions of yen Thousands of U.S. dollars
For the years ended March 31 2021 2020 2021 2020
Employees' salaries and allowances \ 40,642 \ 40,847 $ 367,109 $ 368,957
Retirement benefit expenses 1,383 1,202 12,497 10,863
Research and development expenses 13,661 13,734 123,397 124,060
(4) Research and development expenses included in "Selling, general and administrative expenses"Millions of yen Thousands of U.S. dollars
For the years ended March 31 2021 2020 2021 2020
\ 13,661 \ 13,734 $ 123,397 $ 124,060
(5) Breakdown of "Gain on sales of noncurrent assets"Millions of yen Thousands of U.S. dollars
For the years ended March 31 2021 2020 2021 2020
Land \ 1,134 \ 11 $ 10,244 $ 108
Others 222 153 2,007 1,390
Total \ 1,356 \ 165 $ 12,252 $ 1,498
(6) Impairment lossThe following table summarizes the impairment losses recognized for the years ended March 31, 2021 and 2020.Classification by purpose
Use Type of assets Location Number of assets
Land Kanagawa 1
Land Tokyo 1
Buildings and others Tokyo 1
Chiba 1
Use Type of assets Location Number of assets
Land, buildings and others Hokkaido 1
Land, buildings and others Kanagawa and others 2
Structures and others
Real estate for development
Real estate reclassified as "held fordevelopment"
Agricultural facilities
Asphalt plant
Real estate reclassified as "held forsale" and others
Real estate for lease
2021
2020
17

Breakdown by account
Use
\ 498
289
251
149
Use
$ 4,501
2,611
2,269
1,353
Use
\ 393
118
Use
$ 3,549
1,071
Valuation method
(7) Breakdown of "Loss on sales and disposal of noncurrent assets"Millions of yen Thousands of U.S. dollars
For the years ended March 31 2021 2020 2021 2020
Buildings and structures \ 272 \ 89 $ 2,464 $ 812
Machinery, vehicles, tools, furniture and fixtures 227 22 2,052 199
Demolition and removal costs 306 100 2,764 912
Others 33 104 299 946
Total \ 839 \ 317 $ 7,581 $ 2,871
Thousands of U.S. dollars
Real estate for lease
Agricultural facilities
(Building and structures 251, Machinery, vehicles, tools, furniture and fixtures 0)
(Building and structures 99, Machinery, vehicles, tools, furniture and fixtures 50)
Real estate for lease
(Land 2,611)
(Building and structures 2,268, Machinery, vehicles, tools, furniture and fixtures 1)
Real estate reclassified as "held fordevelopment"
Real estate for development
(Land 548, Building and structures 523)
Agricultural facilities
2020
2020
Asphalt plant(Land 18, Building and structures 207, Machinery, vehicles, tools, furniture and fixtures 167)
Real estate reclassified as "held forsale" and others
Real estate for development
Real estate reclassified as "held forsale" and others
Real estate reclassified as "held fordevelopment"
(Land 498)
(Land 289)
(Land 4,501)
Millions of yen
Thousands of U.S. dollars
Millions of yen
(Building and structures 897, Machinery, vehicles, tools, furniture and fixtures 456)
2021
2021
The Companies recognize impairment losses for individual items classified as: 1) Real estate reclassified as "held fordevelopment," 2) Real estate for development, 3) Real estate for lease, 4) Agricultural facilities, 5) Asphalt plant, 6) Realestate reclassified as "held for sale," and 7) Others.Due to the decrease in fair value and profitability of real estate, the Companies reduced the carrying values of these assetsto their recoverable amounts and recognized the declines as impairment losses.The recoverable amounts of the assets were the net realizable values, which were calculated as the selling prices (estimatedbased on the Japanese Real Estate Appraisal Standards) less applicable sales expenses.
(Land 60, Building and structures 57)
Asphalt plant
(Land 166, Building and structures 1,870, Machinery, vehicles, tools, furniture and fixtures 1,513)
18

9. Notes to Consolidated Statements of Comprehensive Income
Millions of yen Thousands of U.S. dollarsFor the years ended March 31 2021 2020 2021 2020Valuation difference on available-for-sale securities
Occurred during the year \ 53,710 \ (63,708) $ 485,142 $ (575,456)Reclassification adjustments (5,191) (1,477) (46,890) (13,343)
48,518 (65,186) 438,251 (588,800)Tax effect (14,752) 19,828 (133,257) 179,102Valuation difference on available-for-sale securities 33,765 (45,357) 304,993 (409,698)
Deferred gains (losses) on hedgesOccurred during the year (146) 5,649 (1,325) 51,033Reclassification adjustments 85 341 770 3,082
Deferred gains (losses) on hedges before tax effect (61) 5,991 (555) 54,115Tax effect 15 (19) 136 (179)Deferred gains (losses) on hedges (46) 5,971 (419) 53,936
Foreign currency translation adjustmentsOccurred during the year (1,526) 2,693 (13,789) 24,329Reclassification adjustments - - - -
Foreign currency translation adjustments (1,526) 2,693 (13,789) 24,329Retirement benefit asset and liability adjustments
Occurred during the year 4,801 (1,565) 43,370 (14,141)Reclassification adjustments (444) (953) (4,014) (8,609)
4,357 (2,518) 39,356 (22,751)Tax effect (1,337) 765 (12,081) 6,911Retirement benefit asset and liability adjustments 3,019 (1,753) 27,274 (15,839)
Occurred during the year 659 (256) 5,956 (2,317)Reclassification adjustments 6 6 61 54
666 (250) 6,017 (2,262)Total other comprehensive income \ 35,878 \ (38,697) $ 324,077 $ (349,535)
Share of other comprehensive income of affiliatesaccounted for by the equity method
Share of other comprehensive income of affiliatesaccounted for by the equity method
Valuation difference on available-for-sale securitiesbefore tax effect
The following table presents reclassification adjustments as amounts reclassified to profit for the years ended March 31, 2021and 2020 which are recognized in other comprehensive income for the years ended on or before March 31, 2021 and 2020 andtax effect allocated to each component of other comprehensive income for the years ended March 31, 2021 and 2020.
Retirement benefit asset and liability adjustmentsbefore tax effect
19

10. Notes to Consolidated Statements of Changes in Net Assets
(1) Type and number of outstanding sharesFor the year ended March 31, 2021 Number of shares
Type of sharesIssued stock:
Common stockTreasury stock:
Common stockNotes:
For the year ended March 31, 2020 Number of shares
Type of sharesIssued stock:
Common stockTreasury stock:
Common stockNotes:
(2) Dividends(a) Dividends paid to shareholdersFor the year ended March 31, 2021
Resolution approved byType ofshares
Millions ofyen
Thousands ofU.S. dollars Yen
U.S.dollars
Commonstock ¥11,488 $103,774 ¥16 $0.14
Commonstock ¥11,488 $103,773 ¥16 $0.14
Note:
For the year ended March 31, 2020
Resolution approved byType ofshares
Millions ofyen
Thousands ofU.S. dollars Yen
U.S.dollars
Commonstock ¥12,925 $116,746 ¥18 $0.16
Commonstock ¥11,488 $103,774 ¥16 $0.14
Notes:
For the year ended March 31, 2021
Resolution approved byMillions of
yenThousands ofU.S. dollars
Paidfrom Yen
U.S.dollars
¥11,488 $103,773Retainedearnings ¥16 $0.14
Note:
For the year ended March 31, 2020
Resolution approved byMillions of
yenThousands ofU.S. dollars
Paidfrom Yen
U.S.dollars
¥11,488 $103,774Retainedearnings ¥16 $0.14
Note:
(3) Shareholders' equity
Dividends for shares in the BIP Trust are included in dividends in accordance with the resolution at the Annual General Meetingof Shareholders on June 24, 2020 (included amount: \6 million (US$58 thousand)).
The Corporation Law of Japan provides that an amount equal to 10% of the amount to be disbursed as distributions of capital surplus(other than legal capital surplus) and retained earnings (other than legal reserve) be transferred to legal capital surplus or legal reserve,until the sum of legal capital surplus and legal reserve equals 25% of the capital stock account. Such distributions can be made at anytime by resolution of the shareholders, or by the Board of Directors if certain conditions are met.
Type ofshares
Shareholders'cut-off date
Effectivedate
Annual General Meetingof Shareholders(June 24, 2020)
Commonstock
March 31,2020
June 25,2020
June 26,2019
Amount Amount per share
1. Dividends for shares in the BIP Trust are included in dividends in accordance with the resolution at the Annual GeneralMeeting of Shareholders on June 25, 2019 (included amount: \7 million (US$68 thousand)).2. Dividends for shares in the BIP Trust are included in dividends in accordance with the resolution at the Board of Directors onNovember 11, 2019 (included amount: \6 million (US$58 thousand)).
(b) Dividends with a shareholders' cut-off date during the fiscal year but an effective date subsequent to the fiscal yearAmount Amount per share
Type ofshares
Shareholders'cut-off date
Effectivedate
Annual General Meetingof Shareholders(June 24, 2021)
Commonstock
March 31,2021
June 25,2021
Dividends for shares in the BIP Trust are included in dividends in accordance with the resolution at the Annual General Meetingof Shareholders on June 24, 2021 (included amount: \5 million (US$53 thousand)).
Shareholders'cut-off date
Effectivedate
Board of Directors(November 11, 2019)
September 30,2019
December 2,2019
Board of Directors(November 9, 2020)
September 30,2020
December 1,2020
1. Dividends for shares in the BIP Trust are included in dividends in accordance with the resolution at the Annual GeneralMeeting of Shareholders on June 24, 2020 (included amount: \6 million (US$58 thousand)).2. Dividends for shares in the BIP Trust are included in dividends in accordance with the resolution at the Board of Directors onNovember 9, 2020 (included amount: \6 million (US$54 thousand)).
Amount Amount per shareShareholders'
cut-off dateEffective
dateAnnual General Meeting ofShareholders (June 25, 2019)
March 31,2019
Balance atbeginning of year
Increase in sharesduring the year
Decrease in sharesduring the year
Balance atend of year
Annual General Meeting ofShareholders (June 24, 2020)
March 31,2020
June 25,2020
3,872,160 4,689 14,916 3,861,9331. Stocks owned by the BIP Trust are included in "Treasury stock" at beginning and end of year (included amount: 418,817 and403,901 shares).2. Treasury stock increased by 4,689 shares due to the repurchase of shares less than one unit.3. Treasury stock decreased by 14,916 shares due to awarding stocks owned by the BIP Trust.
Amount Amount per share
31,583 3,833,8581. Stocks owned by the BIP Trust are included in "Treasury stock" at beginning and end of year (included amount: 403,901 and372,318 shares).2. Treasury stock increased by 3,508 shares due to the repurchase of shares less than one unit.3. Treasury stock decreased by 31,583 shares due to awarding stocks owned by the BIP Trust.
Balance atbeginning of year
Increase in sharesduring the year
Decrease in sharesduring the year
Balance atend of year
721,509,646 - - 721,509,646
721,509,646 - - 721,509,646
3,861,933 3,508
20

11. Notes to Consolidated Statements of Cash Flows
At March 31 2021 2020 2021 2020
Cash and deposits \ 258,549 \ 315,027 $ 2,335,374 $ 2,845,523
Time deposits with a maturity of more than three months (22,074) (16,082) (199,393) (145,270)
Cash and cash equivalents at end of period \ 236,474 \ 298,945 $ 2,135,980 $ 2,700,253
12. Lease Transactions
Operating leases(a) Lessee's accountingFuture minimum payments under non-cancelable lease contracts at March 31, 2021 and 2020 are as follows:
At March 31 2021 2020 2021 2020Within 1 year \ 3,338 \ 3,253 $ 30,159 $ 29,391Over 1 year 5,841 6,370 52,759 57,546Total \ 9,179 \ 9,624 $ 82,919 $ 86,937
(b) Lessor's accountingFuture minimum receivables under non-cancelable lease contracts at March 31, 2021 and 2020 are as follows:
At March 31 2021 2020 2021 2020Within 1 year \ 6,507 \ 6,403 $ 58,775 $ 57,843Over 1 year 41,076 44,237 371,029 399,576Total \ 47,583 \ 50,640 $ 429,804 $ 457,419
Millions of yen Thousands of U.S. dollars
The reconciliation between cash and cash equivalents reported in the consolidated statements of cash flows and amounts reported inthe consolidated balance sheets is as follows:
Thousands of U.S. dollarsMillions of yen
Millions of yen Thousands of U.S. dollars
21

13. Financial Instruments
(1) Overview(a) Policy for financial instruments
(b) Types of financial instruments related risks and risk management
(c) Supplementary explanation of fair values of financial instruments
Millions of yen Thousands of U.S. dollarsCarrying Carrying
At March 31, 2021 value valueAssets
Cash and deposits \ \ \ $ $ $
Accounts receivable―otherTotal \ \ \ $ $ $
Liabilities
\ \ \ $ $ $
Short-term loans payable
Deposits receivedBonds payableLong-term loans payableNonrecourse loans payableTotal \ \ \ $ $ $
Derivative transactions * \ \ \ $ $ $
918,820230
2,161 561,390
4,211,125
63,625
62,151 64,313962,960
7,043 7,0438,670,516
-
(2) Fair value of financial instruments
4,211,125
64,501 64,501
Difference DifferenceFair value Fair value
744,473 744,638
2,335,374 2,335,374
6,724,532 1,496
466,213
170
959,912- 63,625
3,047
Notes and accounts receivable fromcompleted construction contracts and other
582,62143
Notes and accounts payable for constructioncontracts and other
Current portion of nonrecourse loans payable
1,406,396 1,406,566
2,868,295-
Short-term investment securities andinvestment securities
493,492 -
317,544 317,548 4
6,726,029165Electronically recorded monetary claims -
40,000 363,388
21,327 21,327 - 192,644 192,644
-
-
121,289
582,62112,703,424
67,250-
2,868,251
54,634 54,634
466,213
-7,4457,445-
1,540
-
-258,549 258,549 -
1,095,5562,0845,914924,734
8,698,043580,918 19,528
- 67,250121,289
493,492
1,095,556-
27,526
12,704,965
40,230101,722 102,377 654
361,304
The Companies raise funds by borrowing from banks and issuing commercial paper or corporate bonds. Also, the Companies restricttemporary excess fund management to highly secure assets, time deposits and other short-term investments. The Companies use derivativesin order to avoid the risks, fluctuations of particular assets and liabilities, and fluctuations of interest rates. The Companies do not usederivative transactions to gain short-term profits or for speculative purposes.
"Notes and accounts receivable from completed construction contracts and other," "Electronically recorded monetary claims" and "Accountsreceivable―other," which are operating receivables, are exposed to the credit risk of customers. In order to mitigate the risk when orders arereceived, the Companies conduct a strict screening and determine project plans so that potential risks are minimized."Short-term investment securities" and "Investment securities" mainly consist of stocks. While "Short-term investment securities" and"Investment securities" are exposed to market risk, the Companies monitor market prices of these securities."Notes and accounts payable for construction contracts and other," "Electronically recorded obligations" and "Deposits received," which areoperating liabilities, are due within one year."Short-term loans payable," "Long-term loans payable," "Commercial paper" and "Bonds payable" are used for operations or capitalinvestment. "Nonrecourse loans payable" are used for enterprise funds related to particular PFI projects and other. The floating rate loans areexposed to fluctuation in interest rates. In order to hedge against the interest rate risks and fix the payment of interest, the Companies utilizederivative transactions (interest rate swaps) for each contract of certain long-term loans payable. Regarding the evaluation of hedgeeffectiveness, it is omitted by the judgement of the short-cut method because the interest rate swaps meet the certain criteria under the short-cut method.The transactions of derivative financial instruments are carried out in accordance with the Companies' internal rules, and the status of thetransactions is reported regularly to the Board of Directors. The Companies trade derivative transactions with major financial institutions andtherefore consider there is no credit risk underlying those transactions.While operating debt and borrowings are exposed to liquidity risk, the Companies manage the risk mainly by preparing quarterly and monthlycash management plans.
Notional amounts of derivative transactions, disclosed in "(2) Fair value of financial instruments," do not indicate market risk in derivativetransactions.
The following table shows the carrying values and fair values of financial instruments as of March 31, and any differences. Certain financialinstruments for which it is extremely difficult to determine the fair value are not included (see Note 2 below).
Electronically recorded obligations
* Assets and liabilities arising from derivative transactions are shown at net value, with the amount in parentheses representing net liabilityposition.
106,456 106,456 - 961,578 961,578 -
22

Millions of yen Thousands of U.S. dollarsCarrying Carrying
At March 31, 2020 value valueAssets
Cash and deposits \ \ \ $ $ $
Accounts receivable―otherTotal \ \ \ $ $ $
Liabilities
\ \ \ $ $ $
Short-term loans payable
Deposits receivedBonds payableLong-term loans payableNonrecourse loans payableTotal \ \ \ $ $ $
Derivative transactions * \ \ \ $ $ $
Note 1. Method to determine the fair values of financial instruments, and other information related to marketable securities and derivativesAssets
Cash and deposits
Notes and accounts receivable from completed construction contracts and other and Electronically recorded monetary claims
Short-term investment securities and investment securities
Accounts receivable―other
Liabilities
Bonds payable
Long-term loans payable and Nonrecourse loans payable
DerivativesSee Note 15 "Derivative Transactions."
Note 2. Financial instruments for which it is extremely difficult to determine the fair valueMillions of yen Thousands of U.S. dollarsCarrying value Carrying value
At March 31 2021 2020 2021 2020Non-listed stocks and other \ \ $ $Stocks of affiliatesTotal \ \ $ $
361,304
6,458 64,47923,770
364,692
* Assets and liabilities arising from derivative transactions are shown at net value, with the amount in parentheses representing net liabilityposition.
7,105 7,105
75,125
6,988,481
2,475,409
Fair value
6,989,497
Difference
2,845,523 2,845,523 -
Fair value
1,016
Difference
773,694
-
Notes and accounts receivable fromcompleted construction contracts and other 773,807
Short-term investment securities andinvestment securities 274,052 274,061
112
678,580 678,580 -13,102,530 13,103,622
495,201 495,201
1,092
68,929 68,929 --
243,315 214,710
75,125 -
54,8237,631 7,631 -
54,823
8
-
4,849,274 4,849,274 -
762,475,486
120
17,312
40,000 40,375 375
26,9377,138
536,863 536,863 -
1,450,581 1,450,702
Current portion of nonrecourse loans payable
Notes and accounts payable for constructioncontracts and other
118,976 118,976 - 1,074,670 1,074,670 -
78,104 78,870 765
121,611 121,611
19,798
9,305,10764,180 -
37,614
The fair value of loans qualifying for special hedge accounting treatment of interest rate swaps is based on the present value of the totalprincipal and interest hedged by interest rate swaps, which is discounted by an interest rate to be applied if similar new loans were enteredinto.
It is extremely difficult to determine the fair values for these securities, since they have no quoted market prices available. Thus, they are notincluded in "Short-term investment securities and investment securities" above.
Since deposits are settled in a short period of time, the carrying value approximates fair value. The carrying value is the same as fair value.
The carrying value of the items that will be settled within a year approximates fair value. The carrying value is the same as fair value.The items that will be settled later than a year are determined based on the present value of carrying value, grouped by term of settlement,discounted at an interest rate determined taking into account the remaining period of those and credit risk.
The fair value of stocks is determined based on quoted market price and the fair value of debt securities is determined based on eitherquoted market price or prices provided by financial institutions making markets in these securities.Information on securities classified by holding purpose is disclosed in Note 14 "Securities."
Since accounts receivable―other are settled in a short period of time, the carrying value approximates fair value. The carrying value is thesame as fair value.
Notes and accounts payable for construction contracts and other, Electronically recorded obligations, Short-term loans payable, Currentportion of nonrecourse loans payable, Current portion of bonds payable and Deposits received
Since these accounts are settled in a short period of time, the carrying value approximates fair value. The carrying value is the same as fairvalue.
The fair value of bonds issued by the Company is based on the present value of the total principal and interest discounted by an interestrate determined taking into account the remaining period of bond and current credit risk.
178,835
- 64,1801,026,004 1,030,168 4,164
Electronically recorded monetary claims
Electronically recorded obligations
12,680 12,680 - 114,534 114,534 -
315,027 315,027
- 1,098,467 1,098,467 -
58,336
705,488 712,404 6,916641,465 27,309
9,267,492
156,374
For fixed rate loans, the fair value is based on the present value of the total principal and interest discounted by an interest rate to beapplied if similar new loans were entered into. For floating rate loans, since the market interest rate is reflected in the interest rate setwithin a short period of time, the carrying value is the same as the fair value.
3,388
67,993 71,016 3,023 614,156
23

Note 3. Redemption schedule for monetary claims and securities with maturities at March 31Millions of yen
At March 31, 2021Cash and deposits
Deposits \ \ \ \
Electronically recorded monetary claimsShort-term investment securities and investment securities
Held-to-maturity securitiesGovernment bonds and municipal bondsCorporate bonds
Total \ \ \ \
Thousands of U.S. dollars
At March 31, 2021Cash and deposits
Deposits $ $ $ $
Electronically recorded monetary claimsShort-term investment securities and investment securities
Held-to-maturity securitiesGovernment bonds and municipal bondsCorporate bonds
Total $ $ $ $
Millions of yen
At March 31, 2020Cash and deposits
Deposits \ \ \ \
Electronically recorded monetary claimsShort-term investment securities and investment securities
Held-to-maturity securitiesGovernment bonds and municipal bondsCorporate bonds
Total \ \ \ \
Thousands of U.S. dollars
At March 31, 2020Cash and deposits
Deposits $ $ $ $
Electronically recorded monetary claimsShort-term investment securities and investment securities
Held-to-maturity securitiesGovernment bonds and municipal bondsCorporate bonds
Total $ $ $ $
Due after1 year
through5 years
-
90,869
Due after5 yearsthrough10 years
1,625
Due after10 years
-
Accounts receivable―other 64,501 - -
Due in1 yearor less
Due after5 yearsthrough10 years
-293
258,432 - -
- -651,298 90,565 1,846 761
-
-1,846
10
941
-- -
180
-
192,644 - -818,045
2,334,314
5,882,922 16,683
-
6,881
1,131
-
-
-
Accounts receivable―other 582,621 - -
513 2,651-
Notes and accounts receivable from completed construction contracts andother
--
Due in1 yearor less
995,616
Due after10 years
Due after1 year
through5 years
-
56
21,327
Notes and accounts receivable from completed construction contracts andother
- 10 - 180154 319 30 -
Due in1 yearor less
8,507
90
314,880
8,993,016 820,787 16,683
Due after10 years
12,680 - - -
Due after1 year
through5 years
Due after5 yearsthrough10 years
675,907
-
94,809 1,846
-
75,125 - -
Due in1 yearor less
Due after1 year
through5 years
Due after5 yearsthrough10 years
Due after10 years
2,844,193 - - -
-
114,534 - - -
1,078,748 95,138 1,877 1,311
Accounts receivable―other 678,580 - -9,743,908 859,348 16,960 11,842
-- 90 - 1,625
2,881 277 -
6,105,205 856,376 16,683 10,216
1,394
Accounts receivable―other
Notes and accounts receivable from completed construction contractsand other
Notes and accounts receivable from completed construction contractsand other
24
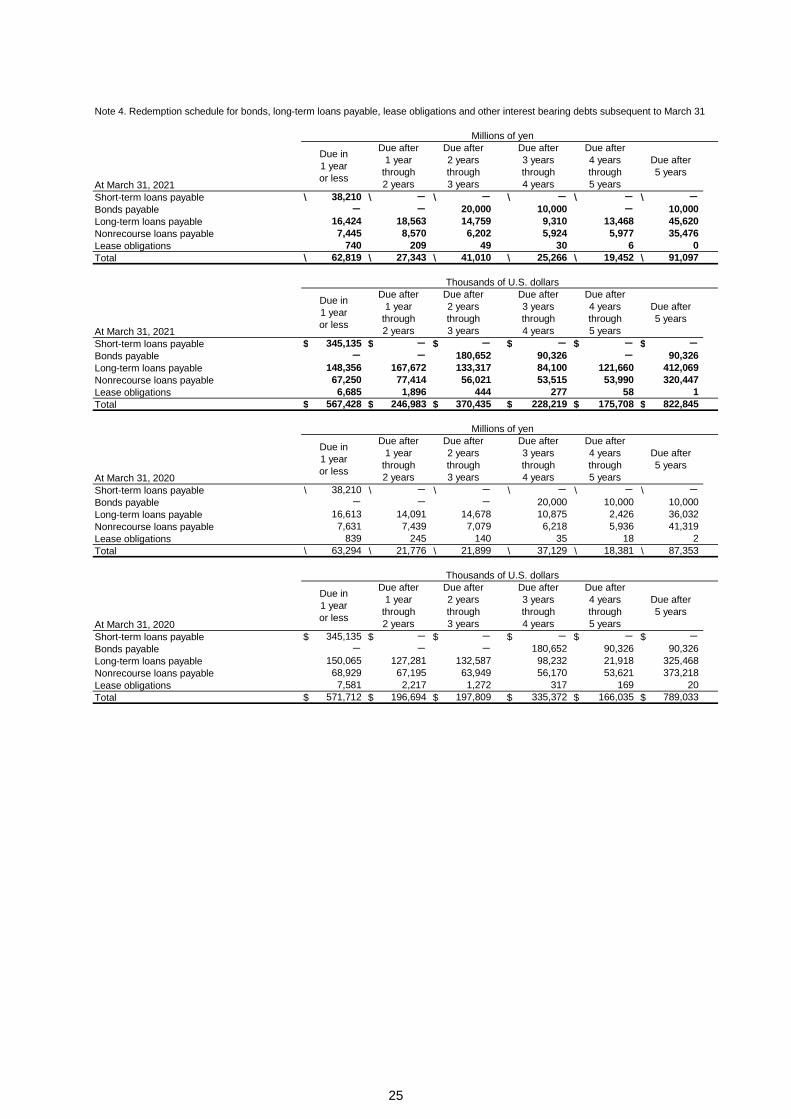
Millions of yen
At March 31, 2021Short-term loans payable \ \ \ \ \ \Bonds payableLong-term loans payableNonrecourse loans payableLease obligationsTotal \ \ \ \ \ \
Thousands of U.S. dollars
At March 31, 2021Short-term loans payable $ $ $ $ $ $Bonds payableLong-term loans payableNonrecourse loans payableLease obligationsTotal $ $ $ $ $ $
Millions of yen
At March 31, 2020Short-term loans payable \ \ \ \ \ \Bonds payableLong-term loans payableNonrecourse loans payableLease obligationsTotal \ \ \ \ \ \
Thousands of U.S. dollars
At March 31, 2020Short-term loans payable $ $ $ $ $ $Bonds payableLong-term loans payableNonrecourse loans payableLease obligationsTotal $ $ $ $ $ $
- - - 180,652
7,445 8,570 6,202 5,924 5,977 35,476
67,250 77,414 56,021 53,515 53,990 320,447
- - -
571,712 196,694 197,809 335,372 166,035 789,033
150,065 127,281 132,587 98,232 21,918 325,468
7,581 2,217 1,272 317 169373,218
2068,929 67,195 63,949 56,170 53,621
63,294 21,776 21,899 37,129 18,381 87,353
Due after1 year
through2 years
Due after2 yearsthrough3 years
Due after4 yearsthrough5 years
Due after5 years
Due in1 yearor less
Due after3 yearsthrough4 years
90,326 90,326345,135 - -
16,613 14,091 14,678 10,875 2,426 36,032
839 245 140 35 18 27,631 7,439 7,079 6,218 5,936 41,319
- - - 20,000 10,000 10,000
6,685 1,896 444 277 58 1
38,210 - - - - -
Due in1 yearor less
Due after1 year
through2 years
Due after2 yearsthrough3 years
Due after3 yearsthrough4 years
Due after4 yearsthrough5 years
Due after5 years
567,428 246,983 370,435 228,219 175,708 822,845
148,356 167,672 133,317 84,100 121,660 412,069- - 180,652 90,326 - 90,326
Due after1 year
through2 years
Due after2 yearsthrough3 years
Due after4 yearsthrough5 years
Due after5 years
Due in1 yearor less
Due after3 yearsthrough4 years
345,135 - - - - -
- - 20,000 10,000 - 10,000
62,819 27,343 41,010 25,266 19,452 91,097740 209 49 30 6 0
16,424 18,563 14,759 9,310 13,468 45,620
Due after1 year
through2 years
Due after2 yearsthrough3 years
Due after4 yearsthrough5 years
Due after5 years
38,210 - - - - -
Due in1 yearor less
Due after3 yearsthrough4 years
Note 4. Redemption schedule for bonds, long-term loans payable, lease obligations and other interest bearing debts subsequent to March 31
25

14. Securities
(a) Held-to-maturity debt securitiesMillions of yen Thousands of U.S. dollars
Carrying Estimated Unrealized Carrying Estimated UnrealizedAt March 31, 2021 value fair value gain (loss) value fair value gain (loss)
Government bonds and municipal bonds \ \ \ $ $ $
Corporate bonds
Total \ \ \ $ $ $
Millions of yen Thousands of U.S. dollarsCarrying Estimated Unrealized Carrying Estimated Unrealized
At March 31, 2020 value fair value gain (loss) value fair value gain (loss)
Government bonds and municipal bonds \ \ \ $ $ $
Corporate bonds
Total \ \ \ $ $ $
(b) Other securitiesMillions of yen Thousands of U.S. dollars
Carrying Acquisition Unrealized Carrying Acquisition UnrealizedAt March 31, 2021 value cost gain (loss) value cost gain (loss)
Stock \ \ \ $ $ $OtherSubtotal
StockOtherSubtotal
Total \ \ \ $ $ $
Millions of yen Thousands of U.S. dollarsCarrying Acquisition Unrealized Carrying Acquisition Unrealized
At March 31, 2020 value cost gain (loss) value cost gain (loss)
Stock \ \ \ $ $ $OtherSubtotal
StockOtherSubtotal
Total \ \ \ $ $ $
1,801,45117,678
-
Securities whose carrying values do notexceed their acquisition costs
17,505 22,228 (4,722)
It is extremely difficult to determine the fair values for non-listed stocks and other (carrying value \17,312 million (US$156,374 thousand)),since they have no quoted market prices available. Thus, they are not included in "Other" above.
93,392 155,722 2,250,161 843,577 1,406,583
2,469,140
Securities whose carrying values exceed theiracquisition costs
248,393 92,682
158,122 200,780
155,711 2,243,643 837,165 1,406,4786,412 105
249,115
1,105,214 1,363,92524,243 28,965 (42,657)
(42,657)6,737 6,737 - 60,856 60,856
721 709 11 6,517
(29,045)45,250
4,924 43
873,190 1,830,497
4,629 76
-
6,346 76
143,477
190 1,716 -
-
540
3,208
545 4 4,880
43
Securities whose fair values do not exceedtheir carrying values
190 1,7161,716190 -
3,164
- - - -
299,325
Securities whose fair values exceed theircarrying values
350 355 4
Securities whose carrying values exceed theiracquisition costs
299,325 96,670 202,654 2,703,688
Securities whose fair values exceed theircarrying values
504 512 8
Securities whose fair values do not exceedtheir carrying values
4,553
2,863,370 1,061,918(3,215)
190 - 1,716
694 702 8 6,269
-
873,190
5,009 5,009 -
12,668 15,884 (3,215) 114,431
Securities whose carrying values do notexceed their acquisition costs
-
96,670 202,654 2,703,688 1,830,497
It is extremely difficult to determine the fair values for non-listed stocks and other (carrying value \19,798 million (US$178,835 thousand)),since they have no quoted market prices available. Thus, they are not included in "Other" above.
45,25020,894 159,682 188,728
(4,722) 218,978 261,636273,358 122,358 151,000
(29,045)317,003 117,565 199,438
26

(c) Sales of securities classified as other securitiesMillions of yen Thousands of U.S. dollars
Sales Aggregate Aggregate Sales Aggregate AggregateFor the year ended March 31, 2021 proceeds gain loss proceeds gain loss
Stock \ \ \ $ $ $Other
Total \ \ \ $ $ $
Millions of yen Thousands of U.S. dollarsSales Aggregate Aggregate Sales Aggregate Aggregate
For the year ended March 31, 2020 proceeds gain loss proceeds gain lossStock \ \ \ $ $ $Other
Total \ \ \ $ $ $
(d) Write down of securities
For the year ended March 31 2021 2020 2021 2020"Stock" of other securities \ \ $ $Non-listed stocks included in "'Stock' of other securities" above 49
3,1160
448448
28,1470
Non-listed stocks, for which fair values are extremely difficult to determine, are included in "Stock" above. (Sales proceeds: \23 million(US$210 thousand), aggregate gain: \4 million (US$40 thousand)).
Millions of yen Thousands of U.S. dollars
11,607 5,362 50 104,849
46,9528 35,277
Fair values of non-listed stocks are extremely difficult to determine.
7,70276
3,9701,438 123 4 12,993
1,48848,440
Non-listed stocks, for which fair values are extremely difficult to determine, are included in "Stock" above. (Sales proceeds: \93 million(US$848 thousand), aggregate gain: \1 million (US$16 thousand), aggregate loss: \37 million (US$335 thousand)).
9,263 5,037 439 83,674
3803,905 164
456
5,198 42 69,571
4110,702 5,161 444 96,667 46,621 4,012
49
45,5021,118
27

15. Derivative Transactions
(1) Derivative transactions to which the hedge accounting method is not appliedAt March 31, 2021 and 2020None.
(2) Derivative transactions to which the hedge accounting method is appliedCurrency-related transactions
At March 31, 2021Deferral method
\ \ \ $ $ $
Total \ \ \ $ $ $
At March 31, 2020Deferral method
\ \ \ $ $ $
Total \ \ \ $ $ $Note: Estimated fair value was provided by the correspondent financial institutions.
Hedged item Contractamount
Contractamount
410,861
Millions of yen
44,442 70,066
Foreign exchangeforward contract(Buy CA$)
Imports of materials(Forecasted transaction) 6,687 6,534 1,063 60,402 59,021 9,608
Foreign exchangeforward contract(Buy US$)Foreign exchangeforward contract(Buy EURO)Foreign exchangeforward contract(Buy GBP)
Imports of materials(Forecasted transaction)
Estimatedfair value
(36)
39,201
Thousands of U.S. dollarsMillions of yenContract
amount ofmore than
1 year
Hedged item
-
45,393
354,094
430,262
632
Purchases of properties(Forecasted transaction) - - - -
Imports of materials(Forecasted transaction) 38,585
60,402
7,614
47,634 70,89160,402 2,930
348,526
-
Estimatedfair value
127
60,330
Contractamount
Contractamount ofmore than
1 year
Estimatedfair value
6,679
14
-
342,167348,526
1,933
37,881
Contractamount
26
Foreign exchangeforward contract(Buy US$)Foreign exchangeforward contract(Buy EURO)
Imports of materials(Forecasted transaction)
Foreign exchangeforward contract(Buy GBP)Foreign exchangeforward contract(Buy CA$)
Imports of materials(Forecasted transaction) 6,687
401,430
Contractamount ofmore than
1 year
241
45,486
Estimatedfair value
Imports of materials(Forecasted transaction)
7,757
Contractamount ofmore than
1 year
Purchases of properties(Forecasted transaction) 70 - (3)
38,585
214
68,782
6,687 3247,848
1,675
410,019
Thousands of U.S. dollars
120 (86) 15,132 1,090 (785)
28

Interest-related transactions
At March 31, 2021Deferral method
\ \ \ $ $ $Short-cut method
Long-term loans payable
Nonrecourse loans payableTotal \ \ \ $ $ $
At March 31, 2020Deferral method
\ \ \ $ $ $Short-cut method
Long-term loans payable
Nonrecourse loans payableTotal \ \ \ $ $ $Note: Estimated fair value was provided by the correspondent financial institutions.
[*]
Hedged item Contractamount
Hedged item
Nonrecourse loans payable(Forecasted transaction)
Contractamount
26,810
Interest rate swapsPayment fixed/Receipt floating [*]
7,164
26,810
55,919 (713)
Contractamount
Estimatedfair value
Thousands of U.S. dollars
505,09851,397
Contractamount
Estimatedfair value
(6,440)
[*]
[*](6,440)
Estimatedfair value
218,633
Millions of yen
22,194
Interest rate swapsPayment fixed/Receipt floating
Since these interest rate swaps, which are not remeasured at market value but the differential paid or received under the swapagreements is charged to income, are treated with long-term loans payable or nonrecourse loans payable, the fair values of thecontracts are included in the fair value of long-term loans payable or nonrecourse loans payable presented in Note 13 "FinancialInstruments (2) Fair value of financial instruments."
22,789 (6,711)
(6,711)[*]
[*]8,754
29,62561,169
[*]
(742) 205,846
Thousands of U.S. dollars
198,222 195,291
50,326
21,945
7,164
Interest rate swapsPayment fixed/Receipt floating
Interest rate swapsPayment fixed/Receipt floating
Millions of yen
56,168
464,251
Nonrecourse loans payable(Forecasted transaction)
79,080
267,594507,346
200,470
[*]
(713)
Contractamount ofmore than
1 year
Estimatedfair value
64,710
24,204
Contractamount ofmore than
1 year
[*]
5,571
64,710
242,166
Contractamount ofmore than
1 year
(742) 552,521
Contractamount ofmore than
1 year
242,166
21,620
29

16. Retirement Benefit Plans
(1) Defined benefit pension plans
Millions of yen Thousands of U.S. dollarsFor the years ended March 31At the beginning of current period \ \ $ $ Service cost Interest cost Actuarial loss Retirement benefit paid OtherAt the end of current period \ \ $ $
Millions of yen Thousands of U.S. dollarsFor the years ended March 31At the beginning of current period \ \ $ $ Expected return on plan assets Actuarial loss Contributions by the Companies Retirement benefits paidAt the end of current period \ \ $ $Certain consolidated subsidiaries adopted a simplified method.
Millions of yen Thousands of U.S. dollarsAt March 31Retirement benefit obligation under the funded plans \ \ $ $Plan assets at fair value
Retirement benefit obligation under the unfunded plansNet liability for retirement benefits in the balance sheets \ \ $ $
Liability for retirement benefits \ \ $ $Net liability for retirement benefits in the balance sheets \ \ $ $
Millions of yen Thousands of U.S. dollarsFor the years ended March 31Service cost \ \ $ $Interest costExpected return on plan assetsAmortization of actuarial lossAmortization of prior service costRetirement benefit expense \ \ $ $Certain consolidated subsidiaries adopted a simplified method.
2021
2021
2021
2021
49,875 46,658
1,474 1,486 13,315 13,425(3,966) (4,103) (35,825) (37,063)
450,510 421,443
The following table sets forth the funded status of the plans and the amounts recognized in the consolidated balance sheets as of March31, 2021 and 2020 for the Company's and the consolidated subsidiaries' defined benefit plans:
45,634 47,552 412,200 429,524(49,875) (46,658) (450,510) (421,443)(4,241) 894 (38,309) 8,08051,999 51,703 469,692 467,018
47,758 52,598
The changes in the projected benefit obligation for the years ended March 31, 2021 and 2020 are as follows:
(57)
(212) (329) (1,918) (2,975)(7,020) (7,062) (63,415) (63,794)
5,066 5,214 45,759 47,104602 613 5,443 5,545
564(518)
Certain consolidated subsidiaries adopted a simplified method to compute their projected benefit obligations.
1,123 1,207 10,149 10,9044,586 (1,892) 41,426 (17,095)
The changes in plan assets for the years ended March 31, 2021 and 2020 are as follows:
46,658 49,960 421,4432021 2020
451,273
431,382 475,098
47,758 52,598 431,382 475,098
99,256 100,757 896,542 910,099
97,634 99,256 881,892 896,54262
4,100 3,668 37,038 33,135
(445) (954) (4,027) (8,617)
2020
The components of retirement benefit expense for the years ended March 31, 2021 and 2020 are as follows:
5,066 5,214 45,759 47,104
1 0 12 8
2021
The Company and its subsidiaries have defined benefit pension plans (cash balance plan in the Company and its certain subsidiaries), inaddition to lump-sum payments. The Company and certain subsidiaries have defined contribution pension plans.The following tables show the funded and the amounts recognized in the consolidated balance sheets at March 31, 2021 and 2020 of theCompany and its subsidiaries.
20202021 2020
2020 2020
2021 2020 2020
602 613 5,443 5,545(1,123) (1,207) (10,149) (10,904)
431,382 475,098
47,758 52,598
30
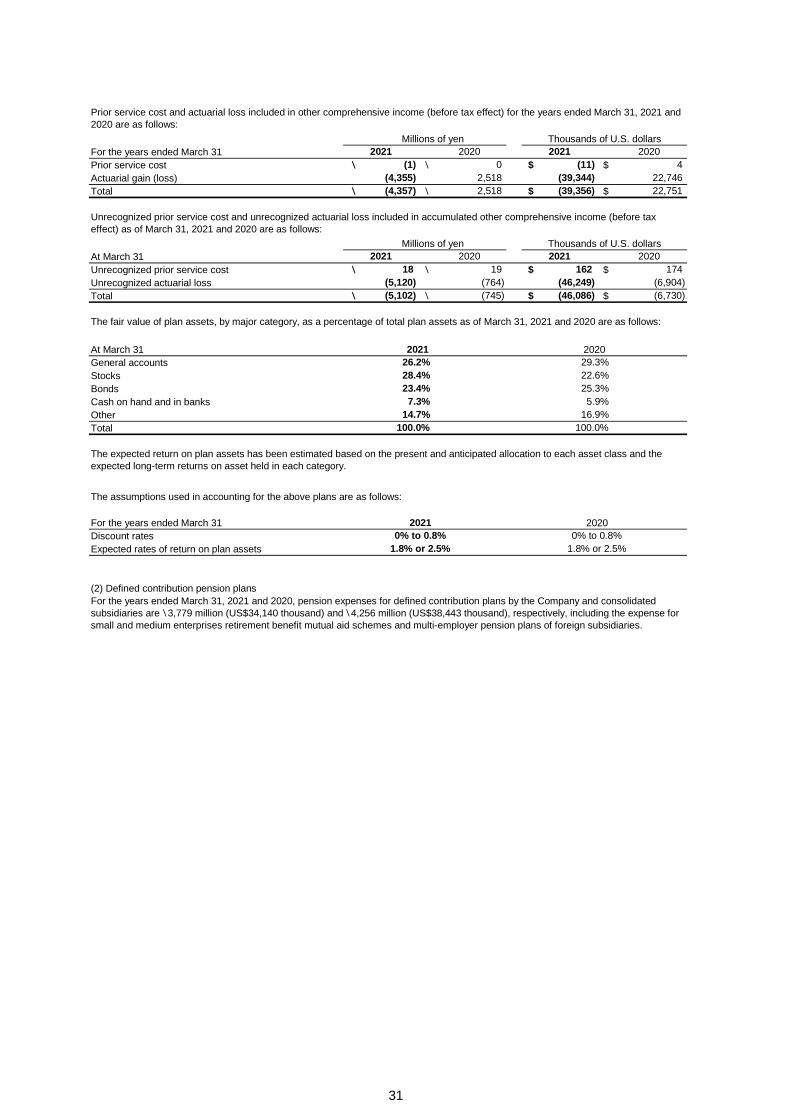
Millions of yen Thousands of U.S. dollarsFor the years ended March 31Prior service cost \ \ $ $Actuarial gain (loss)Total \ \ $ $
Millions of yen Thousands of U.S. dollarsAt March 31Unrecognized prior service cost \ \ $ $Unrecognized actuarial lossTotal \ \ $ $
At March 31 2021 2020General accountsStocksBondsCash on hand and in banksOtherTotal
The assumptions used in accounting for the above plans are as follows:
For the years ended March 31 2021 2020Discount ratesExpected rates of return on plan assets
(2) Defined contribution pension plans
2021
2021
For the years ended March 31, 2021 and 2020, pension expenses for defined contribution plans by the Company and consolidatedsubsidiaries are \3,779 million (US$34,140 thousand) and \4,256 million (US$38,443 thousand), respectively, including the expense forsmall and medium enterprises retirement benefit mutual aid schemes and multi-employer pension plans of foreign subsidiaries.
1.8% or 2.5% 1.8% or 2.5%0% to 0.8% 0% to 0.8%
(745) (46,086) (6,730)
26.2%
Unrecognized prior service cost and unrecognized actuarial loss included in accumulated other comprehensive income (before taxeffect) as of March 31, 2021 and 2020 are as follows:
18 19 162 174
The fair value of plan assets, by major category, as a percentage of total plan assets as of March 31, 2021 and 2020 are as follows:
(5,120) (764) (46,249)
29.3%
(6,904)(5,102)
2021 2020 2020
The expected return on plan assets has been estimated based on the present and anticipated allocation to each asset class and theexpected long-term returns on asset held in each category.
100.0%14.7%7.3%
23.4%28.4% 22.6%
25.3%5.9%
16.9%100.0%
(4,357) 2,518 (39,356) 22,751
Prior service cost and actuarial loss included in other comprehensive income (before tax effect) for the years ended March 31, 2021 and2020 are as follows:
(1) 0 (11) 4(4,355) 2,518 (39,344) 22,746
2021 2020 2020
31

17. Deferred Tax Accounting
The major components of deferred tax assets and liabilities at March 31, 2021 and 2020 are summarized as follows:Millions of yen Thousands of U.S. dollars
At March 31 2021 2020 2021 2020Deferred tax assets
Liability for retirement benefits \ \ $ $Costs on uncompleted construction contractsImpairment lossAccrued expenses (bonus)Unrealized gain on noncurrent assetsProvision for loss on construction contractsLoss on assets traded within the GroupOther
Valuation allowance *Total deferred tax assets
Deferred tax liabilities
Gain on assets traded within the Group
OtherTotal deferred tax liabilitiesNet deferred tax assets (liabilities) \ \ $ $* The change in the valuation allowance was mainly due to a decrease in the valuation allowance for impairment loss.
Millions of yen Thousands of U.S. dollarsAt March 31 2021 2020 2021 2020
\ \ $ $
For the years ended March 31
Statutory tax rates % %
Reconciliation:Permanent non-taxable itemsTax loss carryforwards
Tax credit for research and development expensesOther
Effective tax rates % %
2,551
(11,738)
(45,969)
64,602(16,536)
(16,143) (6,059)(465,687)
(172,546) (31,524)(19,102)
(106,029)
5,300 10,19910,443
103,246
48,066 434,163
(1,787) (670)
(60,719)
60,038
48,300
11,676
4,827 4,767
2,542
4,780 5,215
(3,738) (3,730)
0.825.1
(0.5)
(1.0)(4.2) (0.5)
(0.9)0.3
27.9
Change in valuation allowance
(608,825)
30.5
(67,403) (51,556)
Reconciliation between the statutory tax rates and the effective tax rates for the year ended March 31, 2021 and 2020 are as follows:
In addition to the above, the Companies recognized deferred tax liabilities related to reserve for land revaluation on the consolidatedbalance sheets:
(3,490)
(0.5)
2021 202030.5
(0.7)(0.8)
Reserve for advanced depreciation ofnoncurrent assets
92,12994,331
47,878
105,465
(415,225)
(149,370)
43,607 43,066
23,042 22,967
43,1804,064 3,655 36,711 33,020
47,113
112,575
436,278
542,307
145,439
(1,157) (1,185) (10,459) (10,705)
583,53311,430
14,620
(18,644) (18,893) (168,405) (170,660)
16,101 132,06412,463
(548,451)Valuation difference onavailable-for-sale securities
(33,771) (33,696)
32

18. Asset Retirement Obligations
(1) Estimated total non-refundable depositsMillions of yen Thousands of U.S. dollars
At March 31 2021 2020 2021 2020\ \ $ $
(2) Estimated period of useAt March 31 2020
19. Investment and Rental Properties
Millions of yen Thousands of U.S. dollars
For the years ended March 31 2021 2020 2021 2020
At the beginning of period \ \ $ $Increase (decrease)―netAt the end of period
Fair value at the end of period
2. "Increase (decrease)―net" for the year ended March 31, 2021 mainly consists of: increase in purchase of office buildings for lease(including land) and other in the amount of \36,549 million (US$330,140 thousand) and depreciation cost in the amount of \4,134 million(US$37,341 thousand)."Increase (decrease)―net" for the year ended March 31, 2020 mainly consists of: increase in purchase of office buildings for lease(including land) and other in the amount of \17,820 million (US$160,969 thousand) and depreciation cost in the amount of \4,444 million(US$40,141 thousand).3. Fair value at March 31, 2021 and 2020 was estimated in accordance with the "Real estate evaluation standards," and was adjustedusing official indices.
1. The carrying value represents the acquisition cost less the accumulated depreciation.
10,839369,570
5,878,101
3,715,889279,794
3,436,095
650,764 622,673 5,624,367
The Company and certain of its subsidiaries hold office buildings (including land), lands for redevelopment projects, etc., mainly in Tokyoand Osaka.Profit and impairment loss from these real estate properties for the year ended March 31, 2021 are \13,111 million (US$118,428thousand) and \540 million (US$4,880 thousand), respectively. Profit and impairment loss from these real estate properties for the yearended March 31, 2020 are \13,118 million (US$118,491 thousand) and \118 million (US$1,071 thousand), respectively. Sales and costson real estate are recorded as "Net sales on real estate business and other" and "Cost of sales on real estate business and other,"respectively. Impairment loss is included in "Other income (expenses)."Carrying value in the consolidated balance sheets and fair value of those real estate properties are as follows:
Carrying value
411,38630,976
380,410
380,410 3,436,09597,908
3,338,186
Asset retirement obligations recognized by the Companies are mainly obligations to restore rental properties for business use under realestate lease contracts at the time the lease agreement is terminated. Instead of recording asset retirement obligations, the Companieshave estimated total non-refundable deposits on lease contracts and expensed the current portion.Estimated total non-refundable deposits and periods of use of the rental properties are as follows:
9 years and 10 months to38 years from the initial day
of the contract
39,64840,4834,3894,481
9 years and 10 months to38 years from the initial day
of the contract
2021
33

20. Segment Information
(1) Segment information(a) Overview of reportable segments
(b) Accounting treatment for net sales, income (loss), assets, liabilities and others by each segment
(c) Reportable segment information (net sales and income)For the year ended March 31, 2021
Net salesSales to third parties \ 964,683 \ 304,388 \ 342,203 \ 72,004 \ 42,426 \ 1,725,707 \ 41,186 \ 1,766,893Intersegment sales and transfers 47,871 32 17,767 - 1,072 66,743 9,053 75,796Segment sales \ 1,012,555 \ 304,421 \ 359,971 \ 72,004 \ 43,498 \ 1,792,450 \ 50,239 \ 1,842,690
Operating income (loss)
\ 59,956 \ 3,445 \ 45,389 \ (210) \ 11,937 \ 120,517 \ 2,644 \ 123,161
61 - 106 - (38) 130 (103) 26Segment income (loss) \ 60,017 \ 3,445 \ 45,496 \ (210) \ 11,899 \ 120,647 \ 2,540 \ 123,188
For the year ended March 31, 2021
Net salesSales to third parties $ 8,713,611 $ 2,749,423 $ 3,090,991 $ 650,390 $ 383,221 $ 15,587,638 $ 372,017 $ 15,959,655Intersegment sales and transfers 432,402 292 160,487 - 9,683 602,865 81,778 684,643Segment sales $ 9,146,013 $ 2,749,715 $ 3,251,478 $ 650,390 $ 392,905 $ 16,190,504 $ 453,795 $ 16,644,299
Operating income (loss)
$ 541,560 $ 31,125 $ 409,982 $ (1,905) $ 107,827 $ 1,088,590 $ 23,883 $ 1,112,473
555 - 965 - (347) 1,174 (938) 235Segment income (loss) $ 542,116 $ 31,125 $ 410,948 $ (1,905) $ 107,480 $ 1,089,764 $ 22,944 $ 1,112,709
Notes:
3. The amounts of the assets are not shown since the assets are not divided by the segments.
The reportable segments of the Companies are components for which discrete financial information is available and whose operating results areregularly reviewed by the Executive Committee to make decisions about resource allocation and to assess performance.The Building Construction, Civil Engineering and Real Estate Development divisions at the Company are responsible for strategic planning andbusiness development of the building construction, civil engineering and real estate development businesses, respectively. Business operations of thebuilding construction and civil engineering divisions are classified geographically with headquarters and each branch as separate operating units andevaluated individually. The Company's subsidiaries are also evaluated on an individual basis. The building construction and civil engineeringbusinesses are segmented based on domestic and overseas areas.The Companies therefore have five reportable segments: "domestic building construction," "overseas building construction," "domestic civilengineering," "overseas civil engineering" and "real estate."The overview of each reportable segment is as follows: Domestic building construction: Execution of building construction contracts and related businesses within Japan Overseas building construction: Execution of building construction contracts and related businesses outside Japan Domestic civil engineering: Execution of civil engineering construction contracts and related businesses within Japan Overseas civil engineering: Execution of civil engineering construction contracts and related businesses outside Japan Real estate: Purchase, sale and rent of real estate properties, development of land parcels and related businesses
The accounting methods of the segment are substantially the same as those described in "3. Summary of Significant Accounting Policies." Segmentperformance is evaluated based on operating income or loss.Intersegment sales are recorded at the same prices used in transactions with third parties.
Domesticcivil
engineering
Operating income (loss) fromsales to third parties (Note 2)Intersegment operating incomeand transfers
Domesticbuilding
construction
Overseasbuilding
construction
Total
Reporting segmentDomesticbuilding
construction
Operating income (loss) fromsales to third parties (Note 2)Intersegment operating incomeand transfers
Overseascivil
engineering
Overseascivil
engineering
Real estate Subtotal
1. Businesses that cannot be classified into the reportable segments are shown as "Others." This includes PFI (Private Finance Initiative),renewable energy, finance, operation of golf courses and other businesses.
Millions of yen
Reporting segmentOthers
(Note 1) TotalReal estate Subtotal
Thousands of U.S. dollars
Domesticcivil
engineering
2. "Operating income (loss) from sales to third parties" was computed by subtracting "Intersegment operating income and transfers" from"Segment income (loss)." The total "Operating income (loss) from sales to third parties" equals to "Operating income" as shown in theconsolidated statements of income.
Others(Note 1)
Overseasbuilding
construction
34

For the year ended March 31, 2020 Millions of yenReporting segment
Net salesSales to third parties \ 1,138,934 \ 398,564 \ 342,704 \ 72,215 \ 55,043 \ 2,007,462 \ 65,580 \ 2,073,043Intersegment sales and transfers 54,200 679 18,702 - 1,023 74,605 8,181 82,787Segment sales \ 1,193,135 \ 399,244 \ 361,406 \ 72,215 \ 56,066 \ 2,082,068 \ 73,762 \ 2,155,830
Operating income
\ 82,680 \ 10,773 \ 39,602 \ 4,217 \ 13,256 \ 150,531 \ 2,340 \ 152,871
(1,463) - (81) (1) (118) (1,664) (104) (1,768)Segment income \ 81,217 \ 10,773 \ 39,520 \ 4,216 \ 13,137 \ 148,866 \ 2,236 \ 151,103
For the year ended March 31, 2020 Thousands of U.S. dollarsReporting segment
Net salesSales to third parties $ 10,287,552 $ 3,600,081 $ 3,095,513 $ 652,293 $ 497,184 $ 18,132,625 $ 592,361 $ 18,724,986Intersegment sales and transfers 489,571 6,133 168,934 - 9,246 673,885 73,902 747,787Segment sales $ 10,777,124 $ 3,606,214 $ 3,264,447 $ 652,293 $ 506,431 $ 18,806,510 $ 666,263 $ 19,472,774
Operating income
$ 746,824 $ 97,317 $ 357,711 $ 38,097 $ 119,737 $ 1,359,688 $ 21,143 $ 1,380,832
(13,221) - (734) (11) (1,067) (15,034) (941) (15,976)Segment income $ 733,603 $ 97,317 $ 356,977 $ 38,086 $ 118,669 $ 1,344,654 $ 20,201 $ 1,364,855
Notes:
3. The amounts of the assets are not shown since the assets are not divided by the segments.
For the year ended March 31, 2021Net sales
Total reportable segment \ 1,792,450 $ 16,190,504Sales from "Others" 50,239 453,795Elimination of intersegment transactions (75,796) (684,643)Sales in the statements of income \ 1,766,893 $ 15,959,655
Operating incomeTotal reportable segment \ 120,647 $ 1,089,764Income from "Others" 2,540 22,944Elimination of intersegment transactions (26) (235)Operating income in the statements of income \ 123,161 $ 1,112,473
For the year ended March 31, 2020Net sales
Total reportable segment \ 2,082,068 $ 18,806,510Sales from "Others" 73,762 666,263Elimination of intersegment transactions (82,787) (747,787)Sales in the statements of income \ 2,073,043 $ 18,724,986
Operating incomeTotal reportable segment \ 148,866 $ 1,344,654Income from "Others" 2,236 20,201Elimination of intersegment transactions 1,768 15,976Operating income in the statements of income \ 152,871 $ 1,380,832
(2) Related information(a) Information by product or serviceAs the same information is disclosed in "(1) Segment information," this information has not been presented.
(b) Information by regionNet sales by regionFor the year ended March 31, 2021
\ 1,389,338 \ 270,079 \ 100,555 \ 6,918 \ 1,766,893 $ 12,549,353 $ 2,439,526 $ 908,280 $ 62,495 $ 15,959,655Note: Net sales in the United States is \253,057 million (US$2,285,766 thousand).
(d) Reconciliation of difference between total reportable segment income and operating income as shown in the consolidated statements of income
Real estate SubtotalDomestic
civilengineering
Intersegment operating incomeand transfers
Overseascivil
engineering
Domesticbuilding
construction
Overseasbuilding
construction
Total
Real estate
2. "Operating income from sales to third parties" was computed by subtracting "Intersegment operating income and transfers" from "Segmentincome." The total "Operating income from sales to third parties" equals to "Operating income" as shown in the consolidated statements ofincome.
Millions of yen
Japan North America (Note) Asia Others Total Japan North America
(Note) Others
Thousands of U.S. dollars
Others(Note 1) TotalDomestic
civilengineering
Others(Note 1)
Total
Overseascivil
engineering
Domesticbuilding
construction
Asia
1. Businesses that cannot be classified into the reportable segments are shown as "Others." This includes PFI (Private Finance Initiative),renewable energy, finance, operation of golf courses and other businesses.
Operating income from sales tothird parties (Note 2)Intersegment operating incomeand transfers
Overseasbuilding
constructionSubtotal
Operating income from sales tothird parties (Note 2)
Thousands of U.S. dollars
Millions of yen Thousands of U.S. dollars
Millions of yen
35

For the year ended March 31, 2020
\ 1,600,355 \ 333,008 \ 127,851 \ 11,827 \ 2,073,043 $ 14,455,386 $ 3,007,932 $ 1,154,836 $ 106,831 $ 18,724,986Note: Net sales in the United States is \312,594 million (US$2,823,545 thousand).
Tangible assets by regionFor the year ended March 31, 2021
\ 540,372 \ 4,522 \ 26,502 \ 37,859 \ 609,256 $ 4,880,974 $ 40,852 $ 239,383 $ 341,965 $ 5,503,176
For the year ended March 31, 2020As Japan-based tangible assets account for over 90% of total tangible assets, this information has not been presented.
(c) Information by major customers
(3) Impairment loss on noncurrent assets by reportable segmentFor the year ended March 31, 2021
\ - \ - \ - \ - \ 540 \ 648 \ 1,188
For the year ended March 31, 2021
$ - $ - $ - $ - $ 4,881 $ 5,855 $ 10,737Note:
For the year ended March 31, 2020
\ - \ - \ 393 \ - \ 118 \ - \ 511
For the year ended March 31, 2020
$ - $ - $ 3,551 $ - $ 1,071 $ - $ 4,623
(4) Amortization and balance of goodwill by reportable segmentFor the year ended March 31, 2021
Amortization amount \ - \ - \ - \ - \ 125 \ - \ 125Balance - - - - 711 - 711
For the year ended March 31, 2021
Amortization amount $ - $ - $ - $ - $ 1,134 $ - $ 1,134Balance - - - - 6,430 - 6,430
For the year ended March 31, 2020
Amortization amount \ - \ - \ - \ 73 \ - \ 62 \ 136Balance - - - - - - -
For the year ended March 31, 2020
Amortization amount $ - $ - $ - $ 666 $ - $ 568 $ 1,235Balance - - - - - - -
Note:
(5) Amount of gain on negative goodwill by reportable segmentNone.
Millions of yen Thousands of U.S. dollarsJapan North America Asia Others Total Japan North America Asia Others Total
Of sales to external customers, sales to a specific customer account for less than 10% of net sales in the consolidated financial statements, andtherefore this information has not been presented for the years ended March 31, 2021 and 2020.
Amortization amount and balance of goodwill in "Others" are those of renewable energy business and other.
Domesticcivil
engineering
Overseascivil
engineering
Domesticbuilding
construction
Overseasbuilding
constructionReal estate Others
(Note)
Millions of yen
Thousands of U.S. dollars
Others (Note) Total
Total
Domesticcivil
engineering
Overseascivil
engineering
Domesticbuilding
construction
Overseasbuilding
constructionReal estate
Overseasbuilding
constructionReal estate Others
Thousands of U.S. dollars
TotalDomestic
civilengineering
Overseascivil
engineering
Domesticbuilding
construction
Domesticbuilding
construction
Overseasbuilding
constructionTotalReal estate Others
(Note)
Impairment loss of real estate reclassified as "held for development", which is not divided by reporting segment, is included \498 million(US$4,501 thousand) in "Others."
Total
Domesticbuilding
construction
Domesticcivil
engineering
Millions of yen
Thousands of U.S. dollars
Millions of yen
Real estate Others
Millions of yen
Domesticcivil
engineering
Overseasbuilding
construction
Overseasbuilding
constructionReal estate Others Total
Millions of yen Thousands of U.S. dollars
TotalJapan North America (Note) JapanTotal North America
(Note) Asia OthersAsia Others
Domesticcivil
engineering
Overseascivil
engineering
Domesticcivil
engineering
Overseascivil
engineering
Thousands of U.S. dollars
Others
Total
Overseascivil
engineering
Domesticbuilding
construction
Overseasbuilding
constructionReal estate
TotalOverseas
civilengineering
Domesticbuilding
construction
Domesticbuilding
construction
Domesticcivil
engineering
Overseascivil
engineering
Overseasbuilding
constructionReal estate
Others (Note)
36

21. Related Party Transactions
(1) Transactions of the Company with related partiesNone.
(2) Transactions of the Company's consolidated subsidiaries with related partiesDetails of transactions with related parties and the respective balances as of and for the years ended March 31, 2021 and 2020 are as follows:
For the year ended March 31, 2021
CapitalNature of
transactionMillionsof yen
Thousandsof U.S.dollars Accounts
Millionsof yen
Thousandsof U.S.dollars
759WinstonChurchillGP Inc.(Note 2),Ontario,Canada
CA$100 Acquisition,development,management,operation andsale of realestate
- ConstructioncontractConcurrentdirector
Constructioncontract byKenaidan (Note 3)
¥368 $3,324 Accountsreceivablefromcompletedconstructioncontracts
¥260 $2,348
Notes: 1. Consumption taxes are not included in the transaction amounts.
3. Transaction conditions including the transaction amounts are determined in the same method as for other general transactions.
For the year ended March 31, 2020
Capital
Millionsof yen
Nature oftransaction
Millionsof yen
Thousandsof U.S.dollars Accounts
Millionsof yen
Thousandsof U.S.dollars
ObayashiKosanLtd(Note 2),Minato-ku, Tokyo
¥5 Tenementmanagement
- HousingconstructioncontractConcurrentdirector
Housingconstructioncontract byObayashiFacilities (Note 3)
¥49 $450 - - -
MuneoMinobe-
- Director ofObayashi-ShinseiwaReal Estate
- Sale of realestate forsale
Sale of realestate forsale byObayashi-ShinseiwaReal Estate (Note 4)
¥12 $116 - - -
Notes: 1. Consumption taxes are not included in the transaction amounts.2. The Company's chairman, representative director Takeo Obayashi directly owns 100 percent of the voting rights.3. Transaction conditions including the transaction amounts are determined in the same method as for other general transactions.4. Sales price of the real estate for sale is determined in the same method as for general transactions in view of the market price.
Balance at theend of the year
Companieswith majorityof the votingrightsowned bythe directorsand theircloserelatives ofa materialsubsidiarycompany
% of votingrights held (held byothers)Classification
Relatedparty andaddress
Type ofbusiness Relationship
Amount oftransaction (Note
2. 759 Winston Churchill GP Inc. is a subsidiary of M.I.S. Investments Limited, of which 100 percent of the voting rights are directlyowned by Kenaidan director Aidan Flatley and his close relatives.
Amount oftransaction (Note
Balance at theend of the year
Companieswith majorityof the votingrightsowned bythe directors
Director of amaterialsubsidiarycompany
Classification
Relatedparty andaddress
Type ofbusiness
% of votingrights held (held byothers) Relationship
37
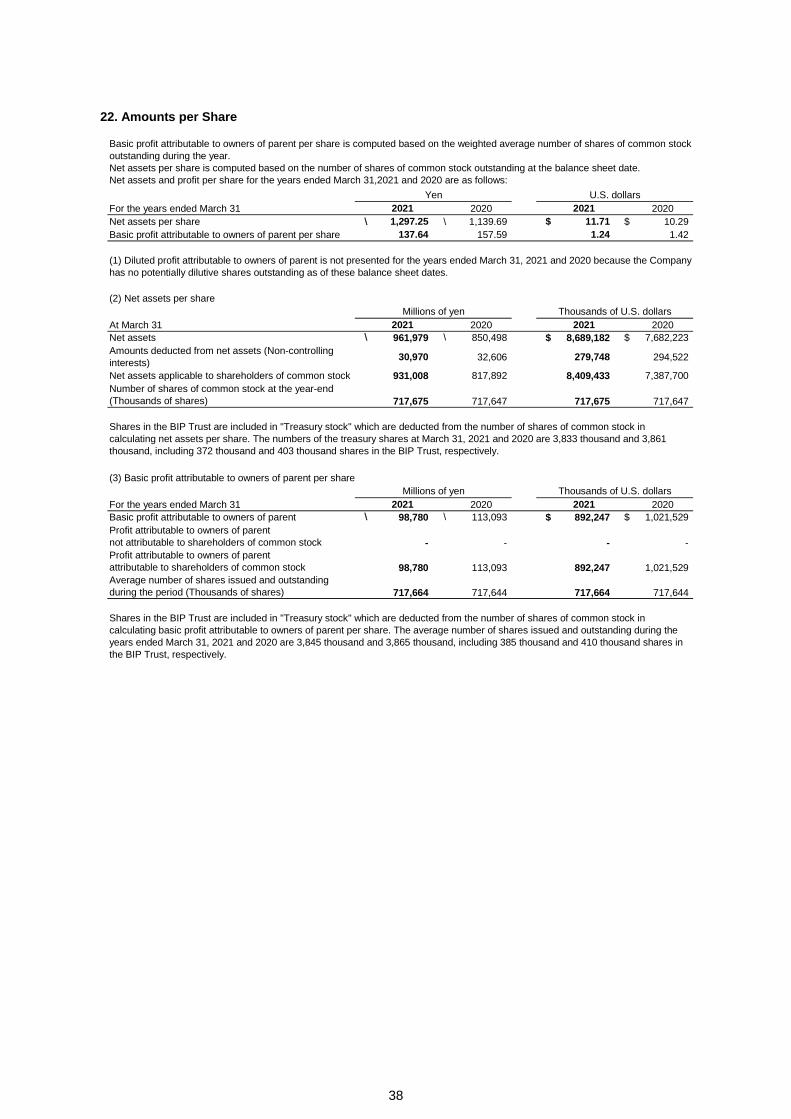
22. Amounts per Share
For the years ended March 31 2021 2020 2021 2020Net assets per share \ 1,297.25 \ 1,139.69 $ 11.71 $ 10.29Basic profit attributable to owners of parent per share 137.64 157.59 1.24 1.42
(2) Net assets per share
At March 31 2021 2020 2021 2020Net assets \ 961,979 \ 850,498 $ 8,689,182 $ 7,682,223
30,970 32,606 279,748 294,522
Net assets applicable to shareholders of common stock 931,008 817,892 8,409,433 7,387,700
717,675 717,647 717,675 717,647
(3) Basic profit attributable to owners of parent per share
For the years ended March 31 2021 2020 2021 2020Basic profit attributable to owners of parent \ 98,780 \ 113,093 $ 892,247 $ 1,021,529
- - - -
98,780 113,093 892,247 1,021,529
717,664 717,644 717,664 717,644
Millions of yen
Basic profit attributable to owners of parent per share is computed based on the weighted average number of shares of common stockoutstanding during the year.Net assets per share is computed based on the number of shares of common stock outstanding at the balance sheet date.Net assets and profit per share for the years ended March 31,2021 and 2020 are as follows:
Number of shares of common stock at the year-end(Thousands of shares)
Average number of shares issued and outstandingduring the period (Thousands of shares)
Profit attributable to owners of parentnot attributable to shareholders of common stockProfit attributable to owners of parentattributable to shareholders of common stock
(1) Diluted profit attributable to owners of parent is not presented for the years ended March 31, 2021 and 2020 because the Companyhas no potentially dilutive shares outstanding as of these balance sheet dates.
Amounts deducted from net assets (Non-controllinginterests)
Shares in the BIP Trust are included in "Treasury stock" which are deducted from the number of shares of common stock incalculating net assets per share. The numbers of the treasury shares at March 31, 2021 and 2020 are 3,833 thousand and 3,861thousand, including 372 thousand and 403 thousand shares in the BIP Trust, respectively.
Shares in the BIP Trust are included in "Treasury stock" which are deducted from the number of shares of common stock incalculating basic profit attributable to owners of parent per share. The average number of shares issued and outstanding during theyears ended March 31, 2021 and 2020 are 3,845 thousand and 3,865 thousand, including 385 thousand and 410 thousand shares inthe BIP Trust, respectively.
U.S. dollarsYen
Thousands of U.S. dollarsMillions of yen
Thousands of U.S. dollars
38

23. Corporate Bonds
Millions of yen Thousands of U.S. dollars
\ \ $ $
The annual redemption schedule of corporate bonds subsequent to March 31, 2021 is as follows:
Less than 1 year \ $Over 1 year less than 2 yearsOver 2 years less than 3 yearsOver 3 years less than 4 yearsOver 4 years less than 5 years
24. Loans
At March 31Short-term loans payable \ \ $ $Current portion of long-term loans payable
Current portion of lease obligations
Lease obligations (excluding current portion)Total \ \ $ $1. The "Average interest rate" is the weighted average interest rate for the average balance of loans during the given fiscal year.
Long-term loans payableOver 1 year less than 2 years \ $Over 2 years less than 3 yearsOver 3 years less than 4 yearsOver 4 years less than 5 years
Nonrecourse loans payableOver 1 year less than 2 years \ $Over 2 years less than 3 yearsOver 3 years less than 4 yearsOver 4 years less than 5 years
Lease obligationsOver 1 year less than 2 years \ $Over 2 years less than 3 yearsOver 3 years less than 4 yearsOver 4 years less than 5 years
25. Subsequent Event
None.
Nonrecourse loans payable(excluding current portion)
8,570 77,414
2. The annual repayment schedule of long-term loans payable, nonrecourse loans payable and lease obligations subsequent to March 31,2021 is as follows:
Current portion of nonrecourse loans payable
Long-term loans payable(excluding current portion)
839
296 2022 ~ 2027
-
0.58
442 -3,997
6,685 7,5817,445 7,631 67,250 68,929 1.76
0.39
2022 ~ 2038
740
18,563
62,151 67,993 561,390 614,156 1.41 2022 ~ 2039
78,104101,722
0.39
Averageinterest rate (%)
148,35616,613345,135150,065
2021 2020Thousands of U.S. dollarsMillions of yen
2020 2021 2020
None
0.385 None
10,000 10,000
\
2021Interestrate (%) CollateralIssue type Issue
date
Obayashi Corp.
Obayashi Corp. 23th unsecuredstraight bond
Oct. 25,2018
Obayashi Corp. May 9,2013
22th unsecuredstraight bond
Sept. 13,2018
20th unsecuredstraight bond
Obayashi Corp. 24th unsecuredstraight bond
June 20,2019
Issued byAt March 31
Sept. 13,2028
-
90,326 90,32610,000
10,000
2021
90,326
10,000
\
40,000 40,000 361,304
2020
-
--
-
Maturity
226,990 209,834 2,050,316 1,895,354
- -20,000 180,652
Thousands of U.S. dollarsMillions of yen
10,000 90,326-
-
38,210 345,13538,21016,424
-
Maturity
277
2,677
918,820
$ 0.970 None
90,326
None Oct. 25,202390,326 90,326 0.130
0.110 June 20,2024
361,304
May 9,2023
3. The "Average interest rate"columns for the "Current portion of lease obligations" and the "Lease obligations (excluding current portion)"are left blank, as the lease obligations stated on the consolidated balance sheets include the interest portion of the lease payments.
4930
58
705,488
444
Millions of yen Thousands of U.S. dollars
6
167,672133,31784,100
121,660
1,896
13,468
209
14,7599,310
6,202 56,0215,924 53,5155,977 53,990
Total
10,000
10,000 90,326
10,000 90,326
$
39