
Oak Ridge National Laboratory - US Department of … · OAK RIDGE NATIONAL LABORATORY U. S....
58
OAK RIDGE NATIONAL LABORATORY U. S. DEPARTMENT OF ENERGY Oak Ridge National Laboratory David L. Greene Engineering Science and Technology Division Paul N. Leiby Environmental Sciences Division Juan Ferrada Nuclear Science and Technology Division DOE Hydrogen, Fuel Cells, and Infrastructure Technologies Program Systems Analysis Workshop July 28-29, 2004 Washington, D.C.
Transcript of Oak Ridge National Laboratory - US Department of … · OAK RIDGE NATIONAL LABORATORY U. S....
OAK RIDGE NATIONAL LABORATORYU. S. DEPARTMENT OF ENERGY
Oak Ridge National Laboratory
David L. GreeneEngineering Science and Technology Division
Paul N. LeibyEnvironmental Sciences Division
Juan FerradaNuclear Science and Technology Division
DOE Hydrogen, Fuel Cells, and Infrastructure Technologies Program
Systems Analysis WorkshopJuly 28-29, 2004
Washington, D.C.
2
OAK RIDGE NATIONAL LABORATORYU. S. DEPARTMENT OF ENERGY
Charter• The Engineering Science and Technology Division, National
Transportation Research Center conducts engineering and analytical R&D for DOE, other federal sponsors and the private sector.
• The Environmental Sciences Division conducts interdisciplinary research, develops technology, and performs analyses to understand and assess responses to global and regional change, environmental stress, and resource use.
• TPP carries out research, modeling and analysis for DOE and other federal sponsors.− DOE – Modeling and analysis of fuel economy standards, Transition
Alternative Fuels and Vehicles Model, Refinery Impacts Modeling for reformulated fuels, costs of oil dependence, SPR optimization.
− EIA – Model development for NEMS Transportation Sector − DOD – Airlift Deployment Analysis System, Defense Logistics− DOT – Modeling, Forecasting and Analysis of Freight Flows, Vehicle
Travel Forecasting, Traffic Simulation and Optimization
3
OAK RIDGE NATIONAL LABORATORYU. S. DEPARTMENT OF ENERGY
History
• ORNL’s Transportation Energy Group began modeling and analysis R&D in 1980.
• Transition Alternative Fuels and Vehicles Model: Analysis of EPACT alternative fuels targets, expanded private fleet rulemaking.
• World Energy Scenarios Model: DOE/NRCanada2050 Study.
• NEMS Alternative Fuel Vehicle Choice Model: currently incorportated in NEMS.
• We are relatively new to hydrogen, having begun our transition in 2002.
4
OAK RIDGE NATIONAL LABORATORYU. S. DEPARTMENT OF ENERGY
Transportation policy and planning continues a 25-year research program at ORNL.
• Energy Policy Analysis− Fuel Economy Policy Analysis− Oil Dependence Analysis− Greenhouse Gas Mitigation− Fuel Economy Information Program (Clean Cities)− Hydrogen Transition (HYTRANS) Model− Hydrogen Education and Outreach
• Planning and Operations− Solving Defense Logistics and Problems Since 1982− Travel and Traffic Modeling− Freight data and freight activity modeling− Transportation security analysis− Safety studies
5
OAK RIDGE NATIONAL LABORATORYU. S. DEPARTMENT OF ENERGY
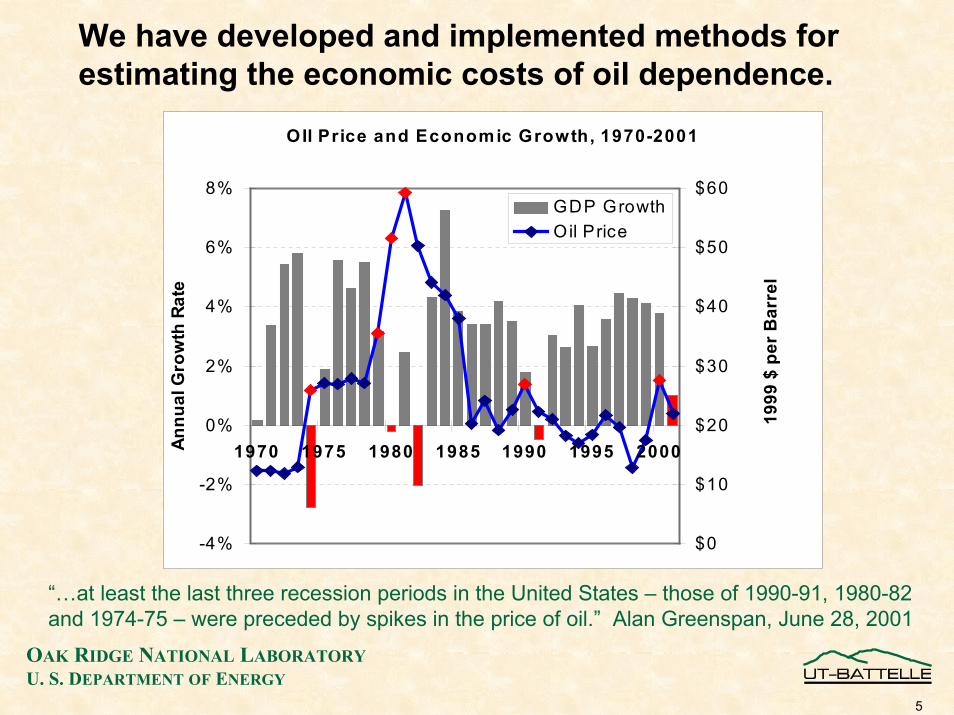
We have developed and implemented methods forestimating the economic costs of oil dependence.
OIl Price and Economic Growth, 1970-2001
-4%
-2%
0%
2%
4%
6%
8%
1970 1975 1980 1985 1990 1995 2000Annu
al G
row
th R
ate
$0
$10
$20
$30
$40
$50
$60
1999
$ p
er B
arre
l
GDP GrowthOil Price
“…at least the last three recession periods in the United States – those of 1990-91, 1980-82 and 1974-75 – were preceded by spikes in the price of oil.” Alan Greenspan, June 28, 2001
6
OAK RIDGE NATIONAL LABORATORYU. S. DEPARTMENT OF ENERGY
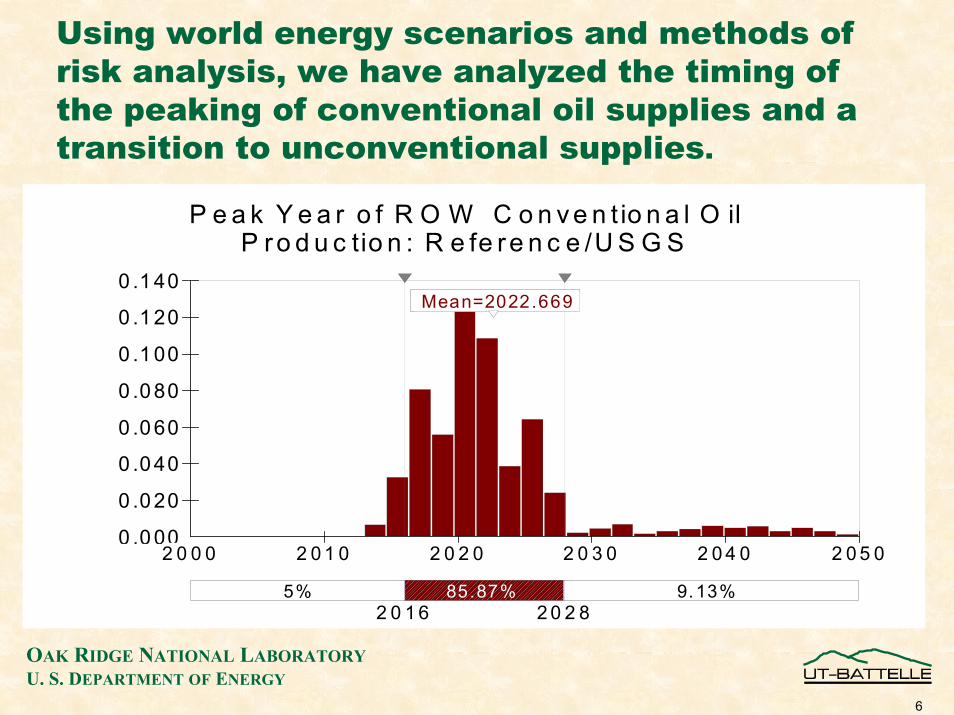
Using world energy scenarios and methods of risk analysis, we have analyzed the timing of the peaking of conventional oil supplies and a transition to unconventional supplies.
P e a k Y e a r o f R O W C o n v e n t io n a l O ilP ro d u c tio n : R e fe re n c e /U S G S
0 .0 00
0 .0 20
0 .0 40
0 .0 60
0 .0 80
0 .1 00
0 .1 20
0 .1 40
Mean=2022.669
2 0 0 0 2 0 1 0 2 0 2 0 2 0 3 0 2 0 4 0 2 0 5 02 0 0 0 2 0 1 0 2 0 2 0 2 0 3 0 2 0 4 0 2 0 5 0
5% 85.87% 9.13% 2 0 1 6 2 0 2 8
Mean=2022.669
7
OAK RIDGE NATIONAL LABORATORYU. S. DEPARTMENT OF ENERGY
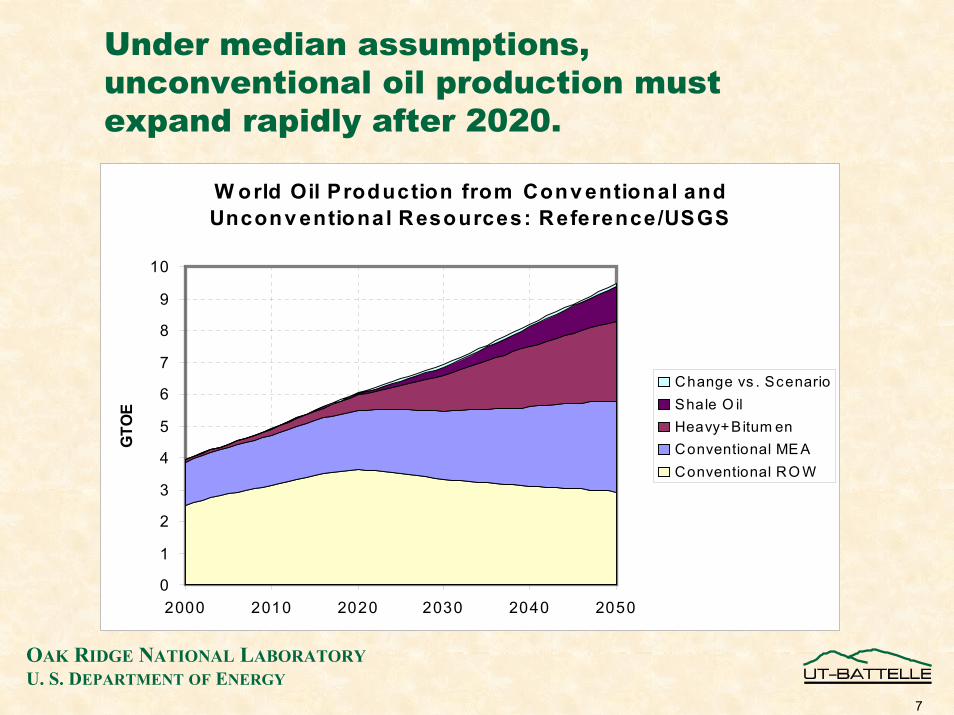
Under median assumptions, unconventional oil production must expand rapidly after 2020.
W orld Oil Production from Conv entional and Unconv entional Resources: Reference/USGS
0
1
2
3
4
5
6
7
8
9
10
2000 2010 2020 2030 2040 2050
GTO
E
Change vs . ScenarioShale O ilHeavy+Bitum enConventional ME AConventional RO W
8
OAK RIDGE NATIONAL LABORATORYU. S. DEPARTMENT OF ENERGY
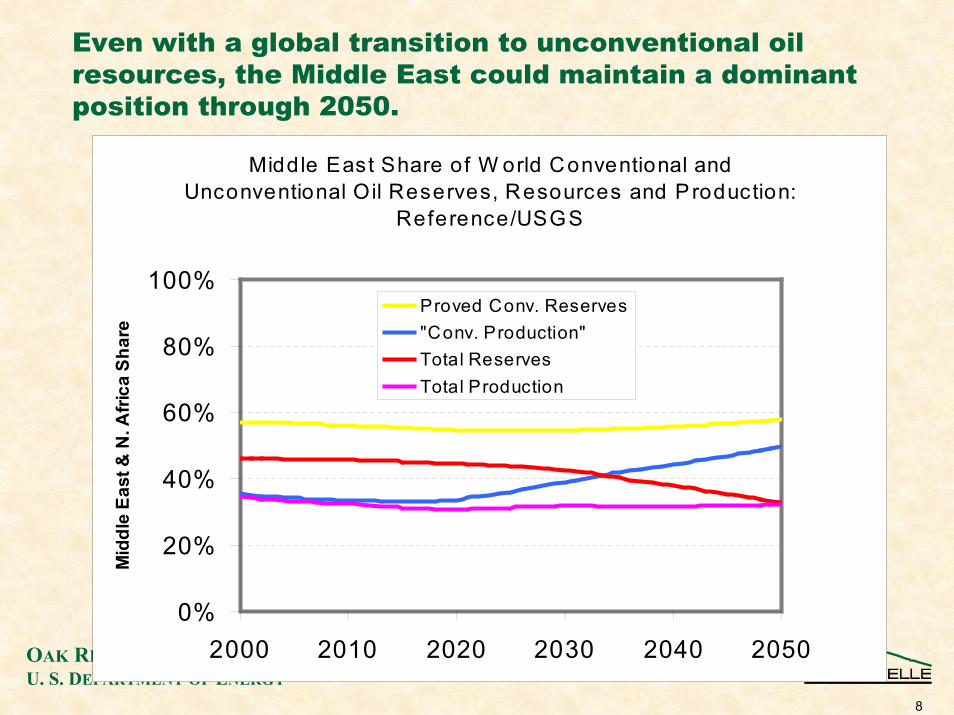
Even with a global transition to unconventional oil resources, the Middle East could maintain a dominant position through 2050.
Middle East Share of W orld Conventional and Unconventional Oil Reserves, Resources and P roduction:
Reference/USGS
0%
20%
40%
60%
80%
100%
2000 2010 2020 2030 2040 2050
Mid
dle
East
& N
. Afri
ca S
hare
Proved Conv. Reserves"Conv. Production"Total ReservesTotal Production
9
OAK RIDGE NATIONAL LABORATORYU. S. DEPARTMENT OF ENERGY
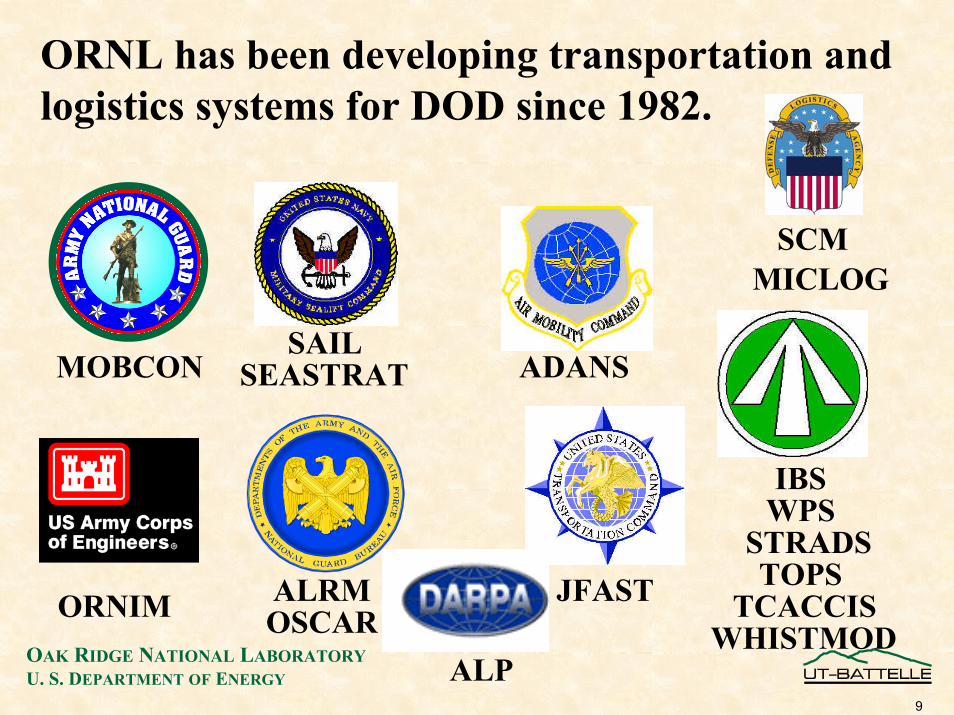
JFAST
ADANS
WPS
SAIL
ALRMOSCAR
STRADSTOPS
IBS
SEASTRAT
TCACCISWHISTMOD
ALP
ORNL has been developing transportation and logistics systems for DOD since 1982.
SCMMICLOG
MOBCON
ORNIM

10
OAK RIDGE NATIONAL LABORATORYU. S. DEPARTMENT OF ENERGY
Developer of the AMC Deployment Analysis System (ADANS)
• Operational in early 1990 planning and scheduling worldwide airlift for DoD
• Scheduled the largest airlift in history (DESERT STORM)
• Scheduling algorithms, centralized database, and a suite of flexible analysis tools
LAD Violationreqt 1: 1000 tons, C0 - C0reqt 2: 1200 tons, C0 - C1reqt 3: 2000 tons, C0 - C2
C-5 200 tons/dayC-141 400 tons/dayC-130 200 tons/day
200
600
C0 C1 C2 C3 C4
tons
days
800The Planning Horizon Determines theDetail Needed
Execution
Sche
dule
Estim
ate
Planning
Det
ail n
eede
d
Planning Horizon
Course of Action Tools
Mission Editor
User-Based Scheduler
Automated Scheduler
11
OAK RIDGE NATIONAL LABORATORYU. S. DEPARTMENT OF ENERGY
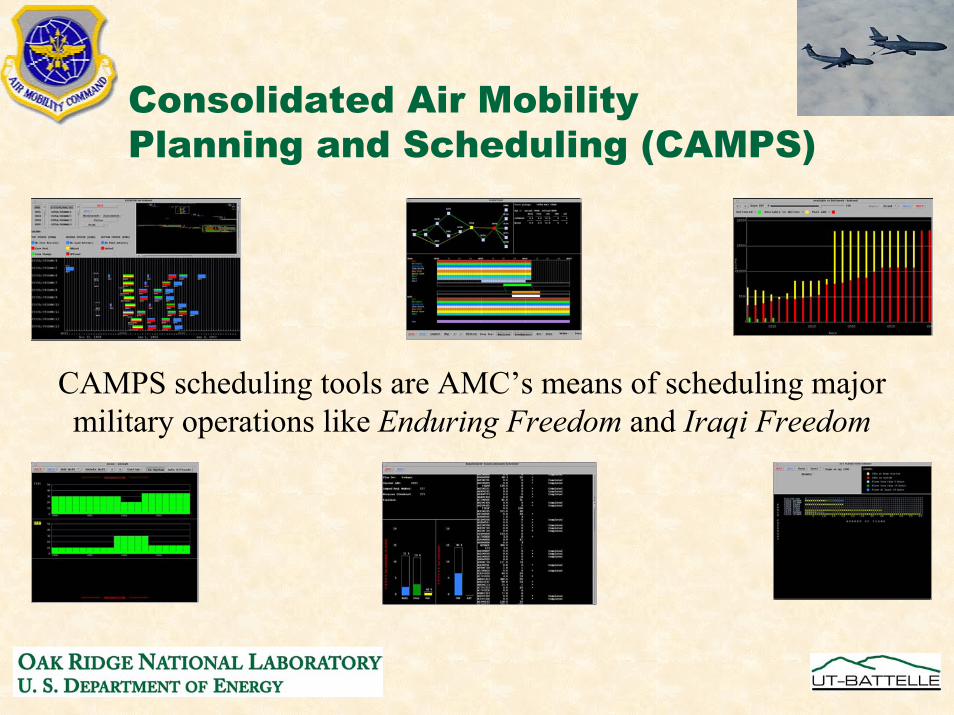
Consolidated Air MobilityPlanning and Scheduling (CAMPS)
CAMPS scheduling tools are AMC’s means of scheduling major military operations like Enduring Freedom and Iraqi Freedom
12
OAK RIDGE NATIONAL LABORATORYU. S. DEPARTMENT OF ENERGY
Ohio River Navigation Investment Model
• A spatially-detailed partial equilibrium model
• Built by ORNL in collaboration with the U.S. Army Corps of Engineers’ Center of Excellence in Navigation Planning
• Estimates net economic benefits of river system infrastructure improvements− New locks/Lock extensions− Maintenance plans− Operations policies
13
OAK RIDGE NATIONAL LABORATORYU. S. DEPARTMENT OF ENERGY
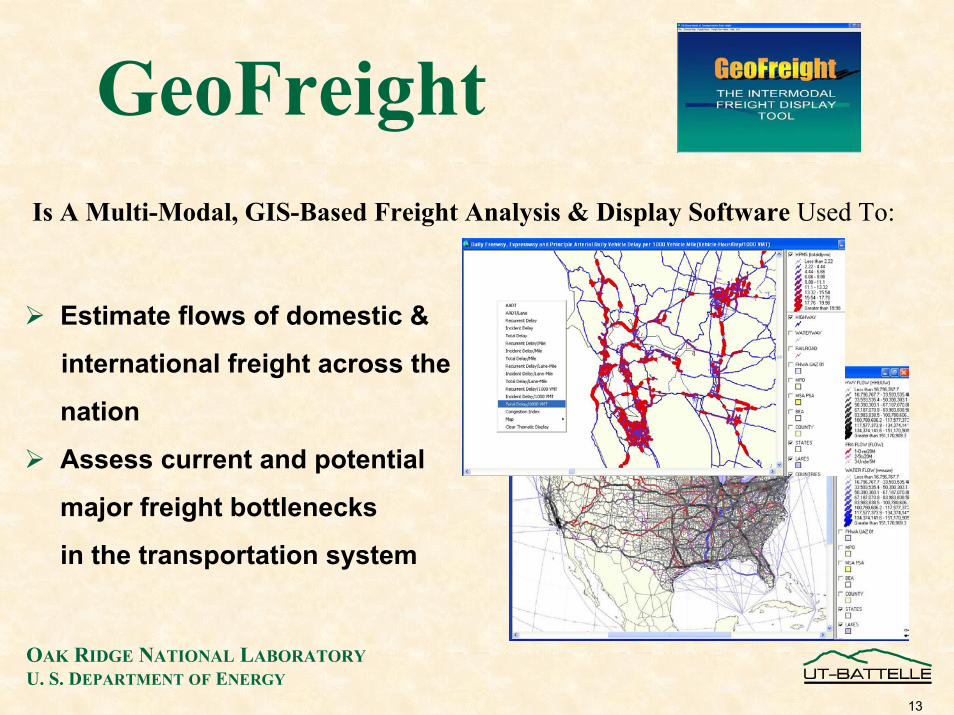
GeoFreightIs A Multi-Modal, GIS-Based Freight Analysis & Display Software Used To:
Estimate flows of domestic &
international freight across the
nation
Assess current and potential
major freight bottlenecks
in the transportation system
14
OAK RIDGE NATIONAL LABORATORYU. S. DEPARTMENT OF ENERGY
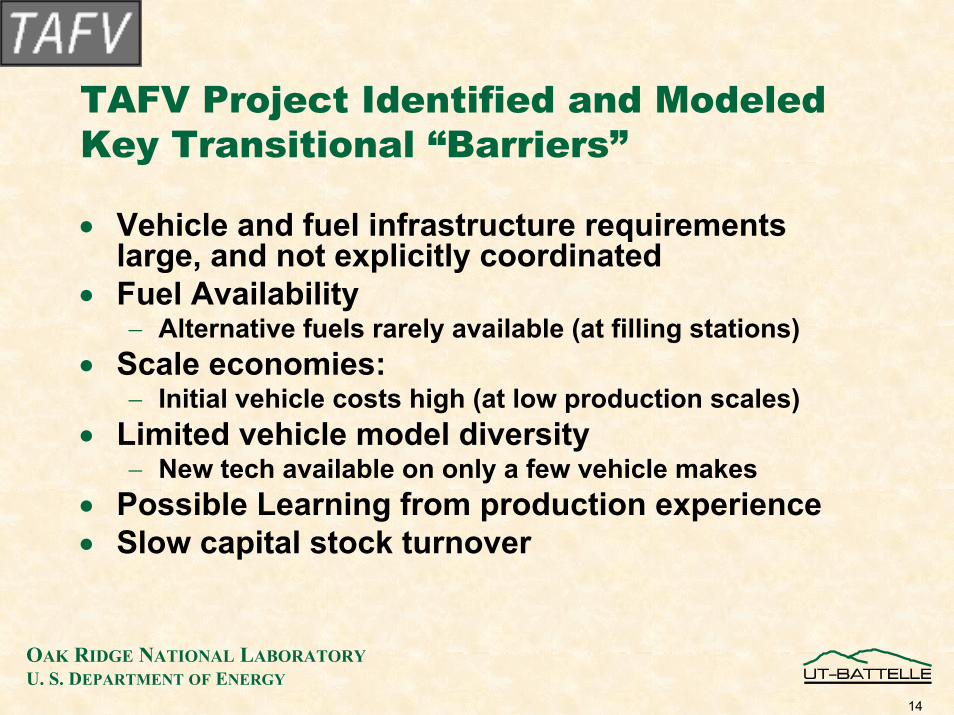
TAFV Project Identified and ModeledKey Transitional “Barriers”
• Vehicle and fuel infrastructure requirements large, and not explicitly coordinated
• Fuel Availability− Alternative fuels rarely available (at filling stations)
• Scale economies:− Initial vehicle costs high (at low production scales)
• Limited vehicle model diversity− New tech available on only a few vehicle makes
• Possible Learning from production experience• Slow capital stock turnover
15
OAK RIDGE NATIONAL LABORATORYU. S. DEPARTMENT OF ENERGY
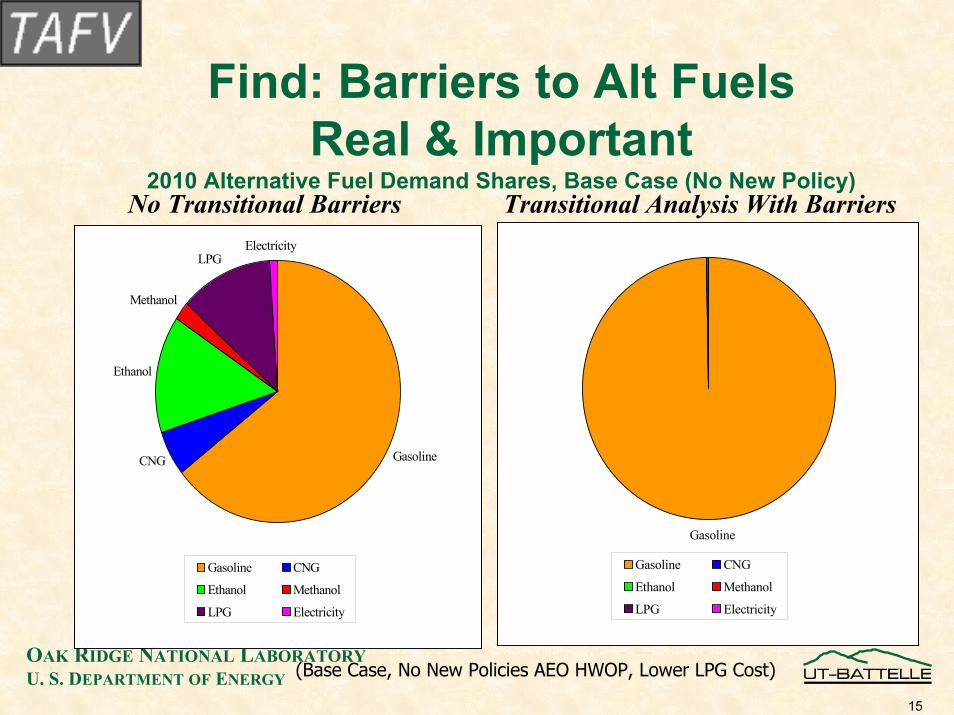
“Market Potential and Impacts of Alternative Fuel Use in Light Duty Vehicles: A 2000/2010 Analysis, DOE/PO-0042, Office of Policy
Analysis, U.S. Department of Energy, Washington, DC, January, 1996.
Find: Barriers to Alt Fuels Real & Important
2010 Alternative Fuel Demand Shares, Base Case (No New Policy)
GasolineCNG
Ethanol
Methanol
LPGElectricity
Gasoline CNG
Ethanol Methanol
LPG Electricity
No Transitional Barriers
Source: Leiby, P.N. Leiby, D.L.
Greene and Harry Vidas.
1996.*
Gasoline
Gasoline CNG
Ethanol Methanol
LPG Electricity
Transitional Analysis With Barriers
(Base Case, No New Policies AEO HWOP, Lower LPG Cost)

16
OAK RIDGE NATIONAL LABORATORYU. S. DEPARTMENT OF ENERGY
Working together with teams from other National Laboratories, academia and industry, ORNL is helping to create analytical tools for understanding the transition to a hydrogen economy.
• In what scenarios (under what conditions) will the hydrogen economy succeed?
• How do individual technologies affect the transition to and functioning of the system?
• How do alternative energy sources affect the transition to and functioning of the system?
• How will the evolution of the system over time and geographically affect costs and benefits?
• What is the role for policy in the transition and maintenance of the hydrogen economy?
• What are the costs and benefits (including the global macroeconomic effects) of a hydrogen economy?
17
OAK RIDGE NATIONAL LABORATORYU. S. DEPARTMENT OF ENERGY
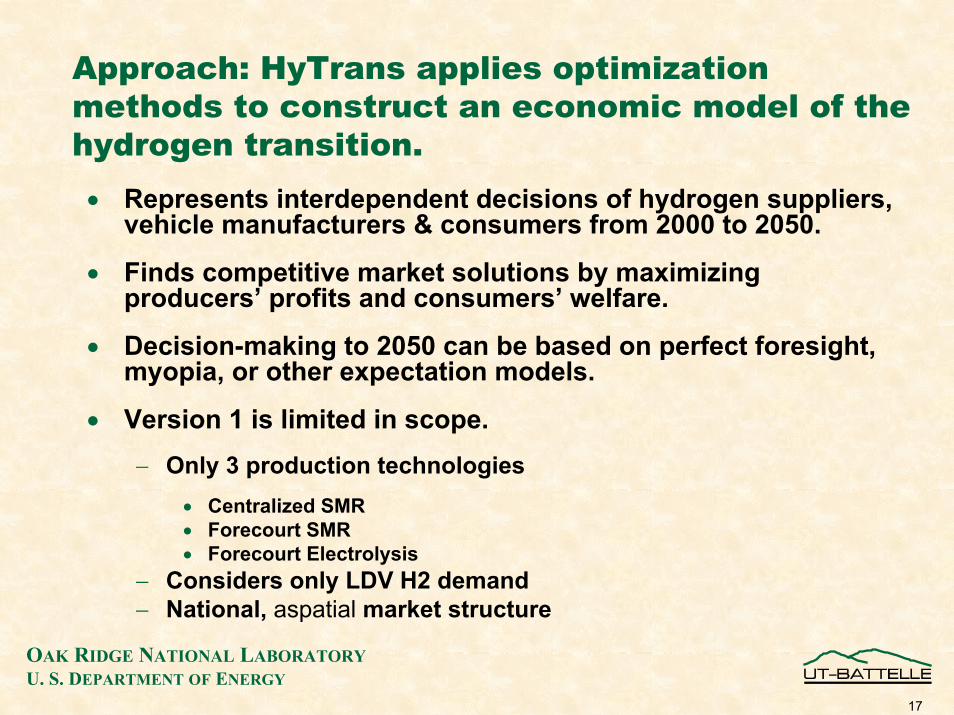
Approach: HyTrans applies optimization methods to construct an economic model of the hydrogen transition.• Represents interdependent decisions of hydrogen suppliers,
vehicle manufacturers & consumers from 2000 to 2050.
• Finds competitive market solutions by maximizing producers’ profits and consumers’ welfare.
• Decision-making to 2050 can be based on perfect foresight, myopia, or other expectation models.
• Version 1 is limited in scope. − Only 3 production technologies
• Centralized SMR• Forecourt SMR• Forecourt Electrolysis
− Considers only LDV H2 demand− National, aspatial market structure
18
OAK RIDGE NATIONAL LABORATORYU. S. DEPARTMENT OF ENERGY
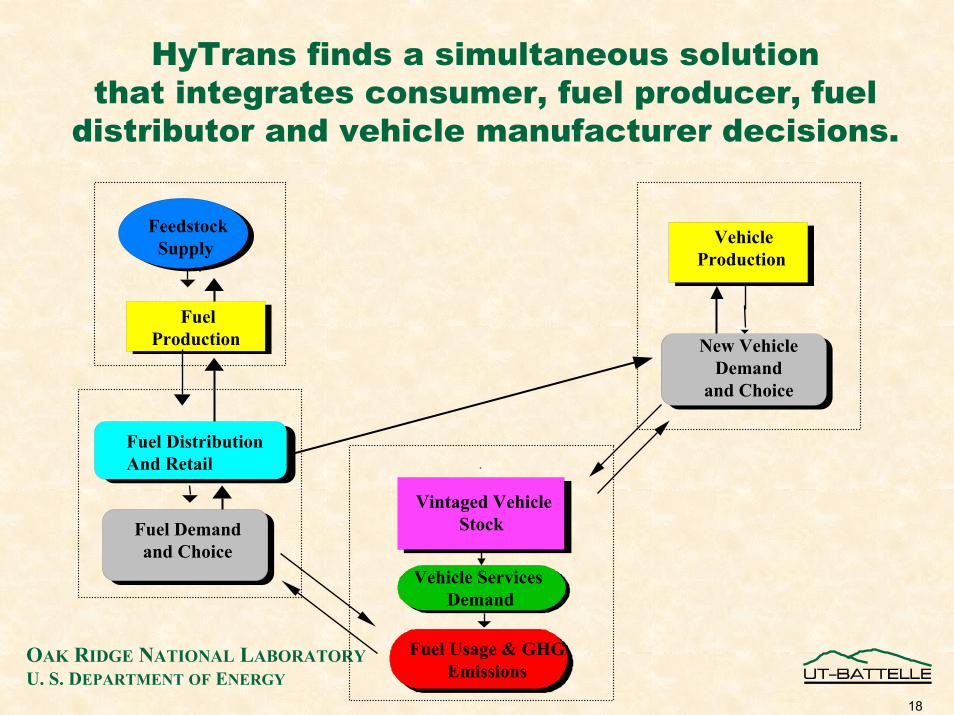
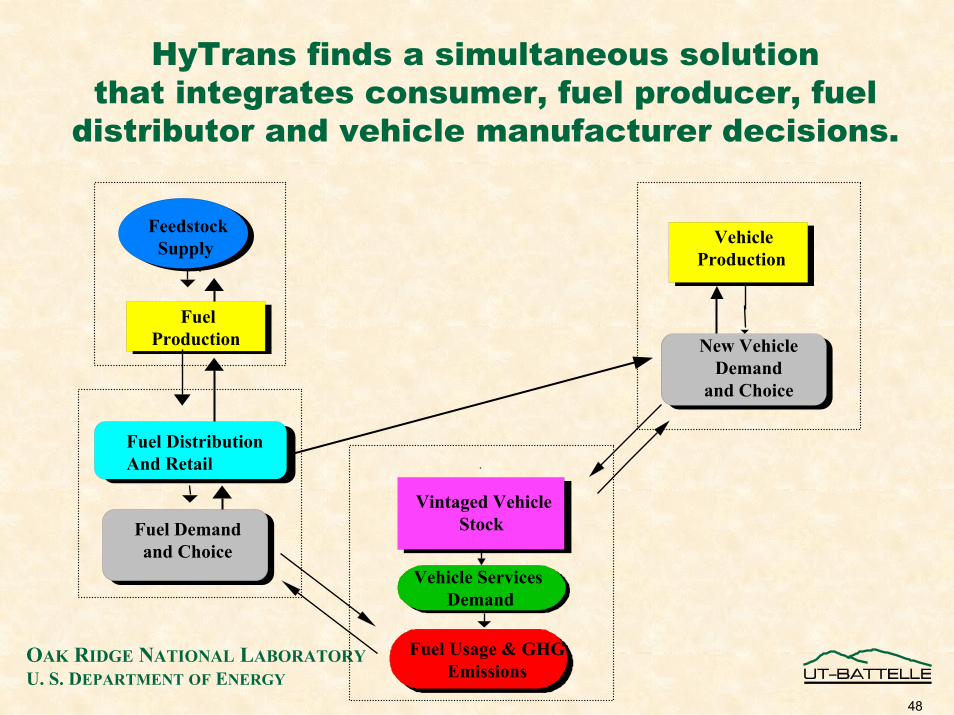
HyTrans finds a simultaneous solutionthat integrates consumer, fuel producer, fuel
distributor and vehicle manufacturer decisions.
Fuel Demandand Choice
FuelProduction
FeedstockSupply
New Vehicle Demand
and Choice
VehicleProduction
Fuel Usage & GHG Emissions
Vehicle Services Demand
Vintaged VehicleStock
Fuel DistributionAnd Retail
19
OAK RIDGE NATIONAL LABORATORYU. S. DEPARTMENT OF ENERGY
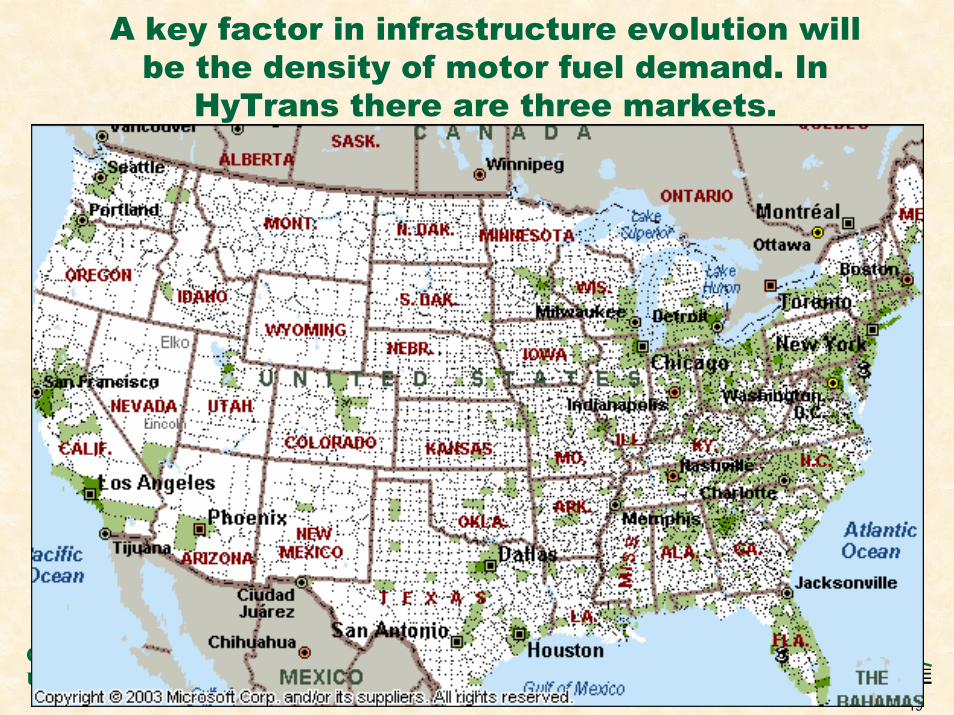
A key factor in infrastructure evolution will be the density of motor fuel demand. In
HyTrans there are three markets.
20
OAK RIDGE NATIONAL LABORATORYU. S. DEPARTMENT OF ENERGY
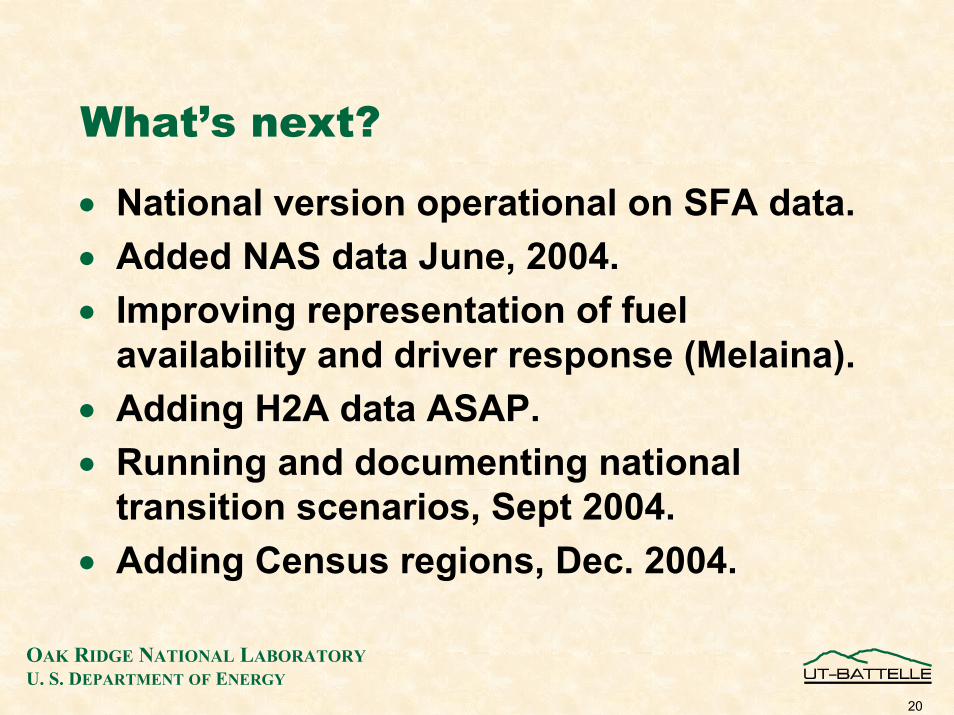
What’s next?
• National version operational on SFA data.• Added NAS data June, 2004.• Improving representation of fuel
availability and driver response (Melaina).• Adding H2A data ASAP.• Running and documenting national
transition scenarios, Sept 2004.• Adding Census regions, Dec. 2004.
OAK RIDGE NATIONAL LABORATORYU. S. DEPARTMENT OF ENERGY
Oak Ridge National Laboratory Nuclear Science and Technology
Division
Juan J. Ferrada, PhDPrincipal Investigator
DOE Hydrogen, Fuel Cells, and Infrastructure Technologies Program
Systems Analysis WorkshopJuly 28-29, 2004
Washington, D.C.
22
OAK RIDGE NATIONAL LABORATORYU. S. DEPARTMENT OF ENERGY
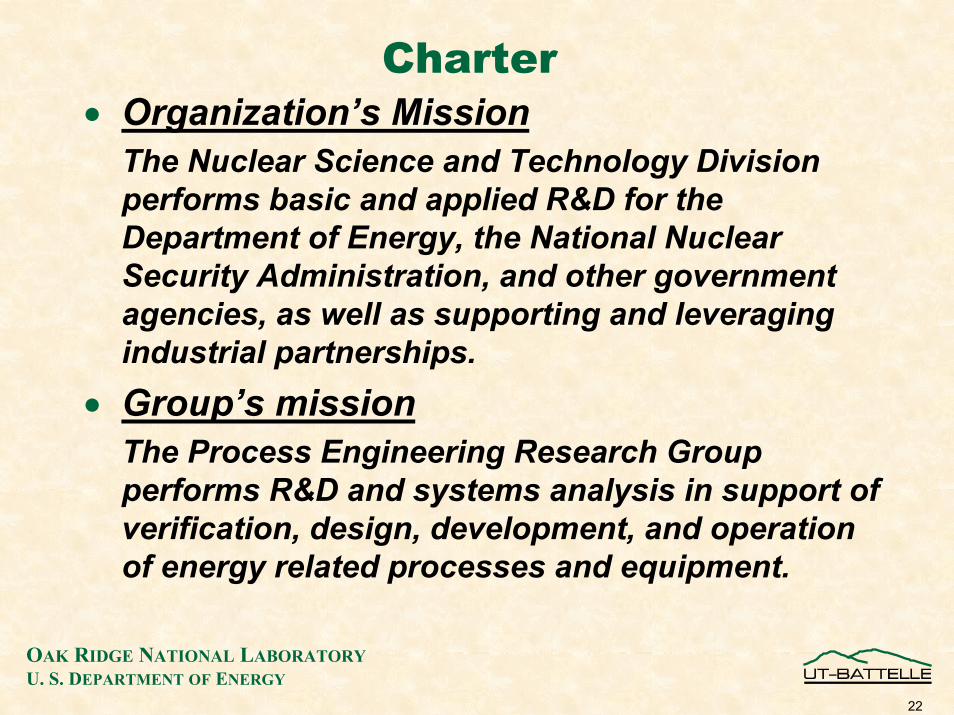
Charter• Organization’s Mission
The Nuclear Science and Technology Division performs basic and applied R&D for the Department of Energy, the National Nuclear Security Administration, and other government agencies, as well as supporting and leveraging industrial partnerships.
• Group’s missionThe Process Engineering Research Group performs R&D and systems analysis in support of verification, design, development, and operation of energy related processes and equipment.
23
OAK RIDGE NATIONAL LABORATORYU. S. DEPARTMENT OF ENERGY
Charter (continued)Past funding• DOE Mixed Waste Focus Area: $400K• DOE Mixed Waste Integrated Program: $350K• DOE Transportable Vitrification System: $100K• CRADA with SEPRADYNE: $300K• Non-Proliferation: $250K• Pu Vitrification System: $80K• Space Power Options: $100K• Liquid Low Level Waste Treatment Options: $100K
24
OAK RIDGE NATIONAL LABORATORYU. S. DEPARTMENT OF ENERGY
Charter (continued)
Exploratory Funding• Hydrogen Economy System Demo: $30K• Hydrogen Production Using TVA Off-peak power: $20K• Hydrogen Production Using a Novel Thermochemical
Cycle: $50K• Hydrogen Storage and Recycle System using
NaBH4: $80K
25
OAK RIDGE NATIONAL LABORATORYU. S. DEPARTMENT OF ENERGY
History• Our group is doing analysis for the past 15 years• Significant past analysis projects include the following:
− Mixed Waste Focus Area: DOE Wixed Waste Systems Analysis− Mixed Waste Integrated Program: Multicriteria Evaluation
Methodology− Engineering Assessment for the DOE Transportable
Vitrification System− Hg Recuperation from the Copper Industry: CRADA− Uranium Conversion Process: Non-Proliferation− Innovative Technology Performance Assessment: Pu
Vitrification System− Liquid Low Level Waste Treatment Alternative− Fuel Cycle Flowsheet Analysis for both Domestic and
International Sponsors− Alternatives for Tank Waste Disposal at ORNL− Life Cycle Analysis Projects− H2 Economy Integration/Systems Analysis: Demo Seed Money− H2 Production from TVA’s Off-Peak Electric Production− H2 Production from Thermo Cycle process
• We have considered H2 for the last 3 years
26
OAK RIDGE NATIONAL LABORATORYU. S. DEPARTMENT OF ENERGY
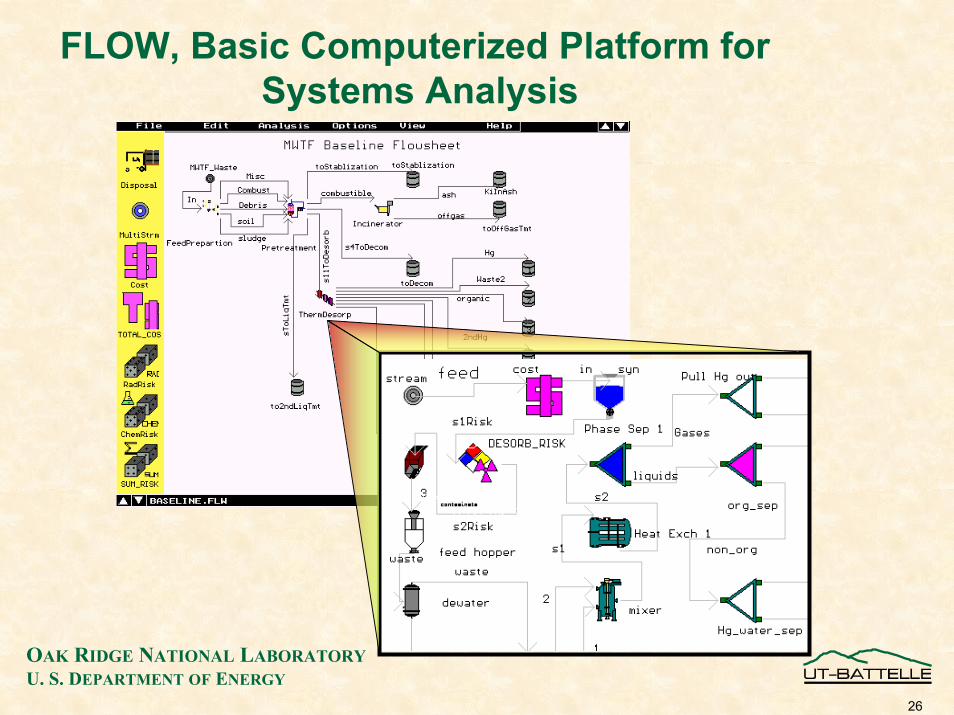
FLOW, Basic Computerized Platform for Systems Analysis
27
OAK RIDGE NATIONAL LABORATORYU. S. DEPARTMENT OF ENERGY
Skill Set - People
Analysts that helped develop our group’s capabilities• Irvin Osborne-Lee, Chem. Eng. PhD,Texas A&M
University• Tim Welch, Chem. Eng. ORNL• Jim Nehls, MBA, Y-12• Hom-Ti Lee, Chem, Eng. PhD, K25• Jason Giardina, Chem. Eng. University of Kentucky• Ethan Turner, Chem. Eng. University of Tennessee• Juan J. Ferrada, Chem. Eng, PhD, ORNL• Les R. Dole, Physical Chem. PhD, ORNL
28
OAK RIDGE NATIONAL LABORATORYU. S. DEPARTMENT OF ENERGY
Skill Set - People
Current analysts• Juan J. Ferrada, Chem. Eng. PhD, ORNL, process modeling, cost
analysis, evaluation, management, integration• Les R. Dole, Physical Chemistry, PhD, ORNL, thermodynamics,
process development, evaluation, integration• David Keffer, Chem. Eng. PhD, University of Tennessee, Molecular
Modeling• Darlene K. Slattery, PhD, University of Central Florida, Fuel Cells,
Storage, Solar Energy• Tim Armstrong, Materials Science, PhD, ORNL, Fuel Cells,
Separation, Management• Beth Armstrong, Materials Science, Master Sc., ORNL, Advanced
Process and Manufacturing• Joe Birdwell, Chem. Eng. PhD, ORNL, process verification, process
development, process evaluation• Joe Walker, Chem. Eng. ORNL, management, process
development• Ben Lewis, Chem. Eng. ORNL, management, process verification
29
OAK RIDGE NATIONAL LABORATORYU. S. DEPARTMENT OF ENERGY
Skill Set – Models that include H2
• H2 System including Reforming and Shifting, Piping, and Storage− 2003− System integrates H2 production, PSA purification, compressing
and piping, and Storage. Estimates production, production costs, can optimize piping system.
− Models are based on thermodynamic, heuristics, and mass and energy balance. Cost models are programmed into system (ENREL, LBNL, LLNL, German, Sandia models).
− Model platform FLOW accessing HSC5 equilibrium models. − Limitations: Does not have large thermodynamic databases,
but may import from other programs.
30
OAK RIDGE NATIONAL LABORATORYU. S. DEPARTMENT OF ENERGY
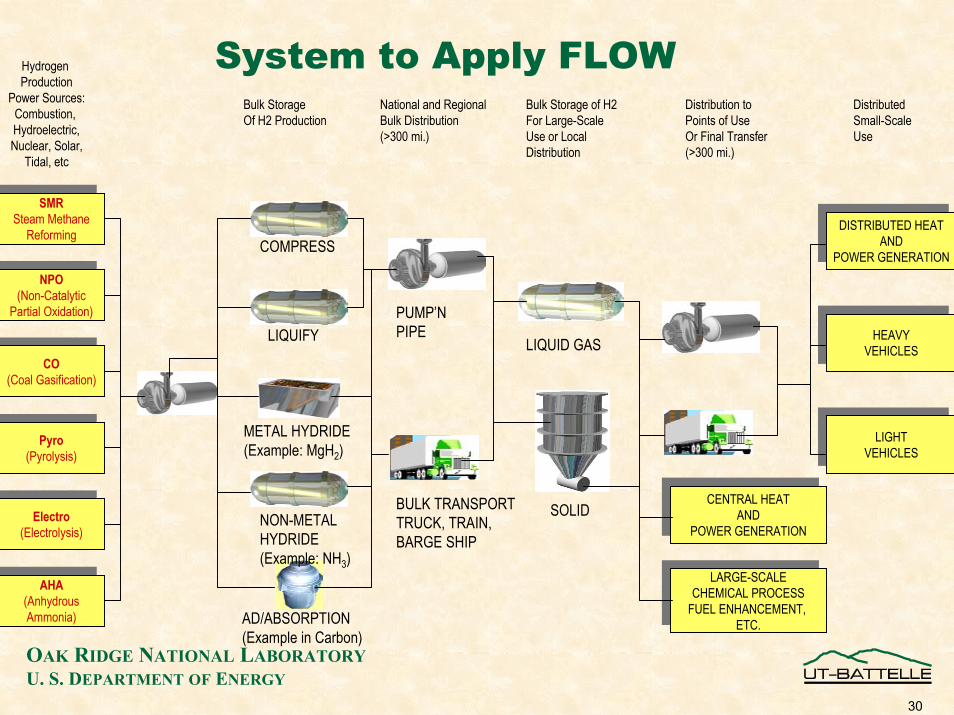
System to Apply FLOWHydrogen Production
Power Sources:Combustion, Hydroelectric,Nuclear, Solar,
Tidal, etc
SMRSteam Methane
Reforming
SMRSteam Methane
Reforming
NPO(Non-Catalytic
Partial Oxidation)
NPO(Non-Catalytic
Partial Oxidation)
CO(Coal Gasification)CO
(Coal Gasification)
Pyro(Pyrolysis)Pyro
(Pyrolysis)
Electro(Electrolysis)Electro
(Electrolysis)
AHA(AnhydrousAmmonia)
AHA(AnhydrousAmmonia)
Bulk StorageOf H2 Production
National and RegionalBulk Distribution(>300 mi.)
Bulk Storage of H2For Large-ScaleUse or LocalDistribution
Distribution toPoints of UseOr Final Transfer(>300 mi.)
DistributedSmall-ScaleUse
DISTRIBUTED HEATAND
POWER GENERATION
DISTRIBUTED HEATAND
POWER GENERATION
HEAVYVEHICLESHEAVY
VEHICLES
LIGHTVEHICLESLIGHT
VEHICLES
CENTRAL HEATAND
POWER GENERATION
CENTRAL HEATAND
POWER GENERATION
LARGE-SCALECHEMICAL PROCESS
FUEL ENHANCEMENT, ETC.
LARGE-SCALECHEMICAL PROCESS
FUEL ENHANCEMENT, ETC.
COMPRESS
LIQUIFY
METAL HYDRIDE(Example: MgH2)
NON-METAL HYDRIDE(Example: NH3)
AD/ABSORPTION(Example in Carbon)
PUMP’NPIPE
BULK TRANSPORTTRUCK, TRAIN, BARGE SHIP
LIQUID GAS
SOLID
31
OAK RIDGE NATIONAL LABORATORYU. S. DEPARTMENT OF ENERGY
Skill Set – Models that include H2 (continued)• H2 System including Electrolysis Using TVA Off-peak
Power, Piping, and Storage− 2004− System integrates H2 production by electrolysis, compressing
and piping, and Storage. Estimates production, production costs, can optimize piping system.
− Models are based on thermodynamic, heuristics, and mass and energy balance. Cost models are programmed into system (ENREL, LBNL, LLNL, German, Sandia models, vendors).
− Model platform FLOW accessing HSC5 equilibrium models. − Limitations: Does not have large thermodynamic databases,
but may import from other programs
32
OAK RIDGE NATIONAL LABORATORYU. S. DEPARTMENT OF ENERGY
0
5
10
15
20
25
30
35
40
$/M
Wh
of P
ower
1 3 5 7 9 11 13 15 17 19 21 23Hour of Day
Nuclear Energy Electrolysis
CompressionH2 Storage
H2O
H2
Pipe Distribution
O2 Storage
O2Electricity
H2
Pipe Distribution
H2
Nuclear Energy Electrolysis
CompressionH2 Storage
H2O
H2
Pipe Distribution
O2 Storage
O2Electricity
H2
Pipe Distribution
H2
$2.00
$2.50
$3.00
$3.50
$4.00
$4.50
$5.00
5,000 10,000 15,000
Ton H2/yr
$/K
g H 2 20 $/MWh
30 $/MWh40 $/MWh
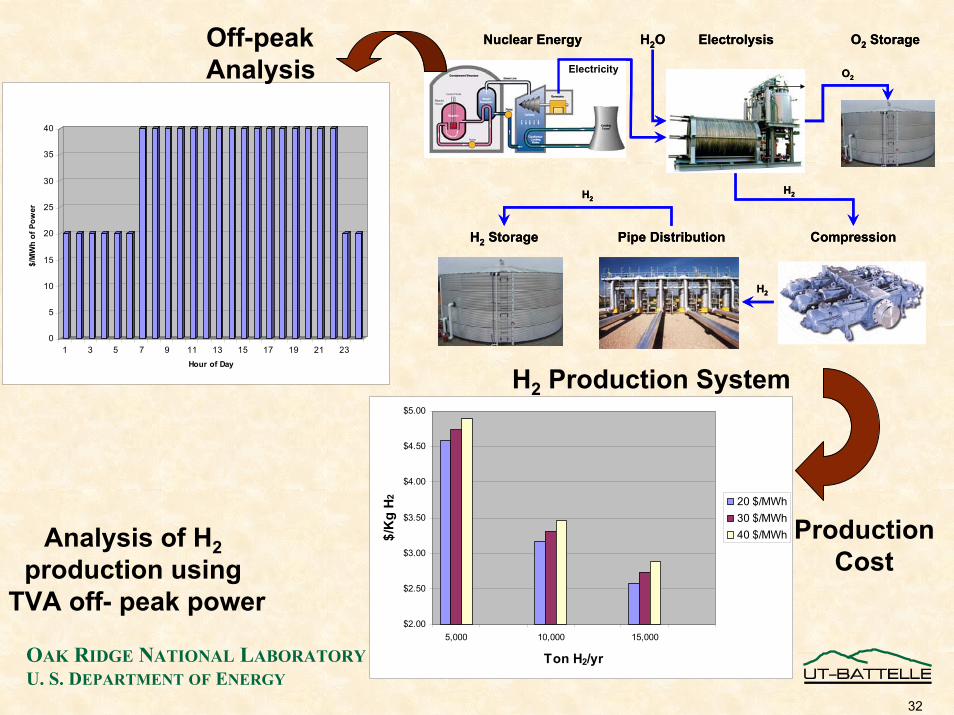
Off-peak Analysis
H2 Production System
ProductionCost
Analysis of H2production using
TVA off- peak power
33
OAK RIDGE NATIONAL LABORATORYU. S. DEPARTMENT OF ENERGY
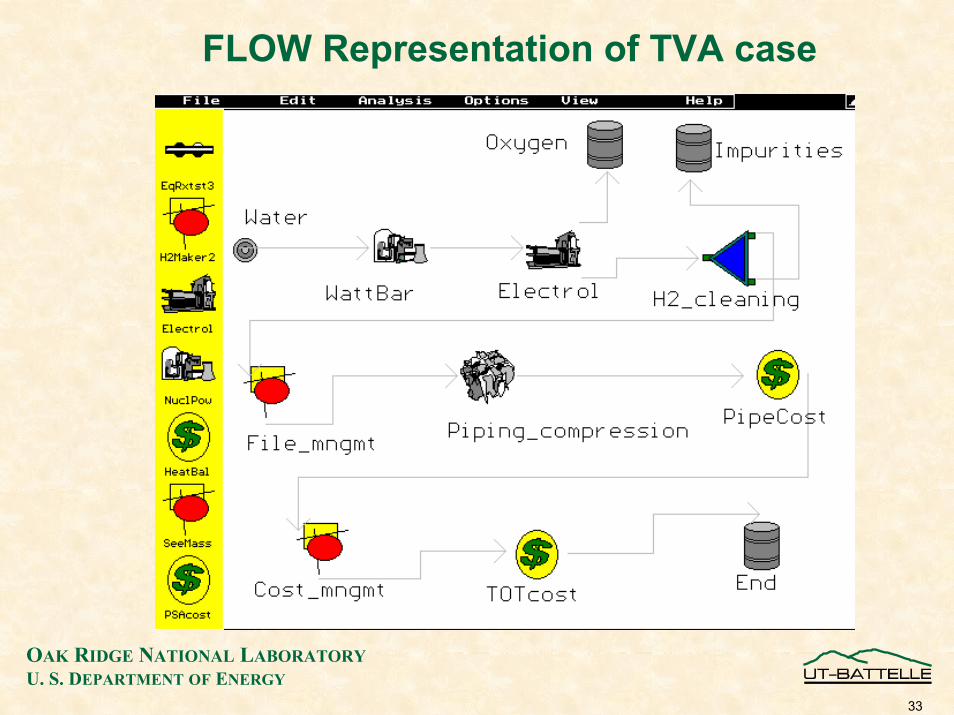
FLOW Representation of TVA case
34
OAK RIDGE NATIONAL LABORATORYU. S. DEPARTMENT OF ENERGY
Skill Set – Models that include H2 (continued)
• H2 System including Thermochemical Cycles (U3O8, NaOH, and H2O)− 2004− System integrates process stages− Models are based on thermodynamic, heuristics, and mass and
energy balance. − Model platform FLOW accessing HSC5 equilibrium models. − Limitations: Does not have large thermodynamic databases,
but may import from other programs
35
OAK RIDGE NATIONAL LABORATORYU. S. DEPARTMENT OF ENERGY
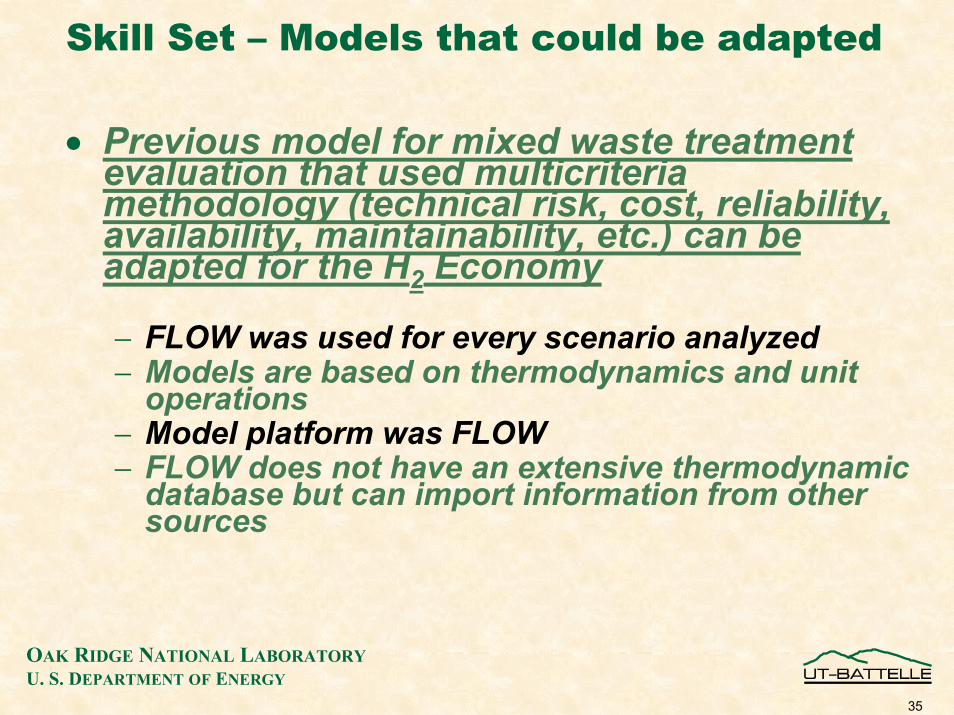
Skill Set – Models that could be adapted
• Previous model for mixed waste treatment evaluation that used multicriteriamethodology (technical risk, cost, reliability, availability, maintainability, etc.) can be adapted for the H2 Economy
− FLOW was used for every scenario analyzed− Models are based on thermodynamics and unit
operations− Model platform was FLOW− FLOW does not have an extensive thermodynamic
database but can import information from other sources
36
OAK RIDGE NATIONAL LABORATORYU. S. DEPARTMENT OF ENERGY
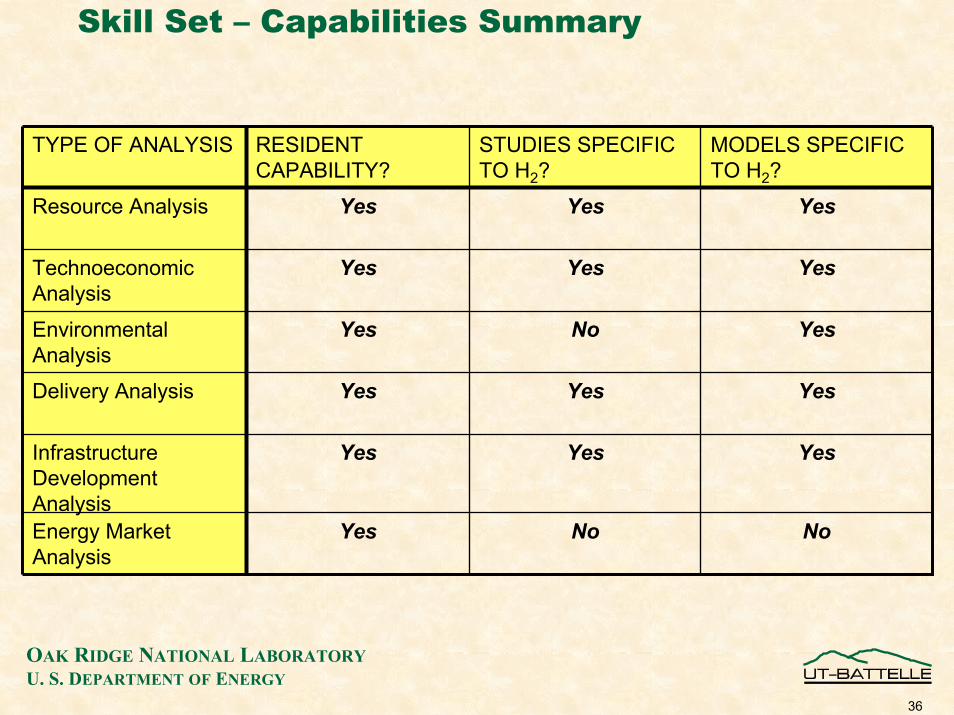
Skill Set – Capabilities Summary
No
Yes
Yes
Yes
Yes
Yes
MODELS SPECIFIC TO H2?
No
Yes
Yes
No
Yes
Yes
STUDIES SPECIFIC TO H2?
RESIDENT CAPABILITY?
TYPE OF ANALYSIS
YesEnergy Market Analysis
YesInfrastructure Development Analysis
YesDelivery Analysis
YesEnvironmental Analysis
YesTechnoeconomicAnalysis
YesResource Analysis
37
OAK RIDGE NATIONAL LABORATORYU. S. DEPARTMENT OF ENERGY
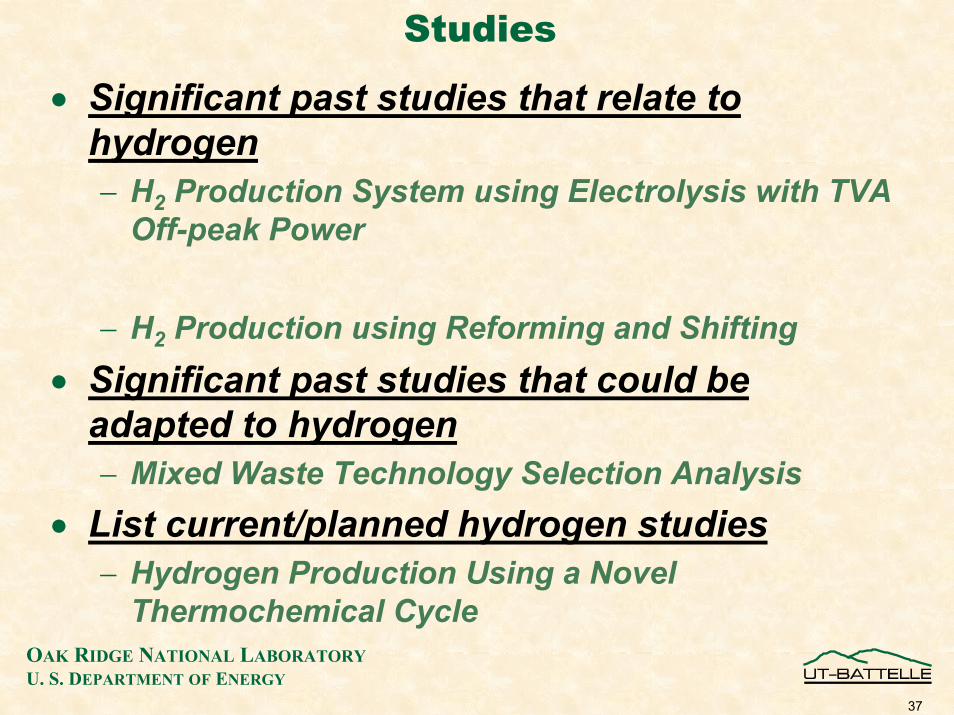
Studies
• Significant past studies that relate to hydrogen− H2 Production System using Electrolysis with TVA
Off-peak Power
− H2 Production using Reforming and Shifting• Significant past studies that could be
adapted to hydrogen− Mixed Waste Technology Selection Analysis
• List current/planned hydrogen studies− Hydrogen Production Using a Novel
Thermochemical Cycle
38
OAK RIDGE NATIONAL LABORATORYU. S. DEPARTMENT OF ENERGY
FuturePlans/commitments from our OrganizationOur Organization is providing:• University students are being sponsored
at ORNL to participate in various assignments to build relationships and to assess their future employment potential
• Seed money is being used to further enhance and develop H2 analysis capabilities
39
OAK RIDGE NATIONAL LABORATORYU. S. DEPARTMENT OF ENERGY
David Greene Backup Slides
40
OAK RIDGE NATIONAL LABORATORYU. S. DEPARTMENT OF ENERGY
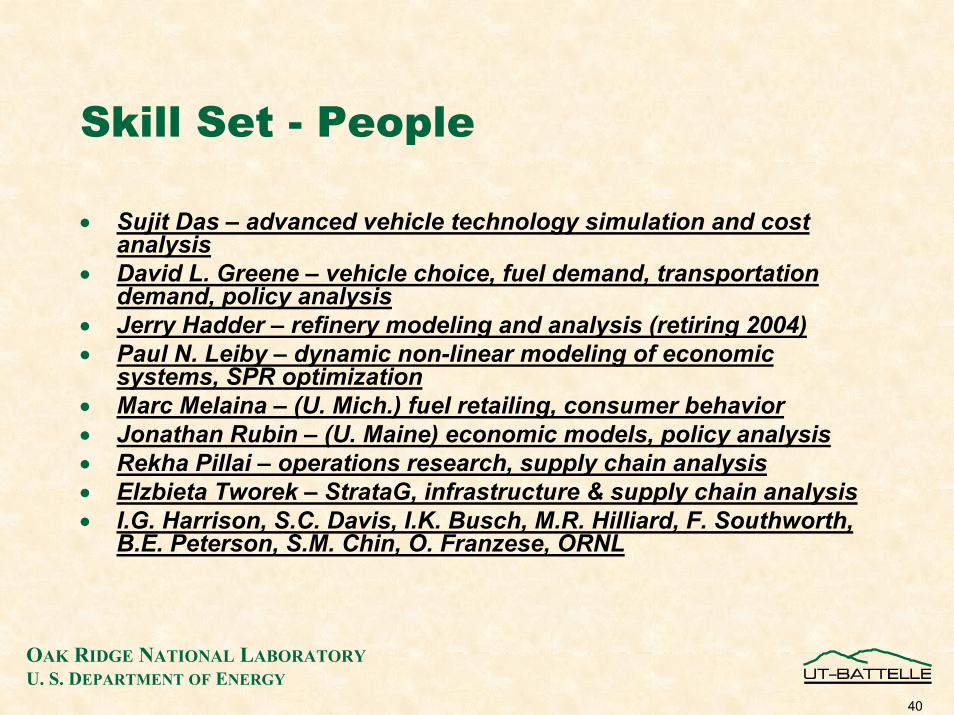
Skill Set - People
• Sujit Das – advanced vehicle technology simulation and cost analysis
• David L. Greene – vehicle choice, fuel demand, transportation demand, policy analysis
• Jerry Hadder – refinery modeling and analysis (retiring 2004)• Paul N. Leiby – dynamic non-linear modeling of economic
systems, SPR optimization• Marc Melaina – (U. Mich.) fuel retailing, consumer behavior• Jonathan Rubin – (U. Maine) economic models, policy analysis• Rekha Pillai – operations research, supply chain analysis• Elzbieta Tworek – StrataG, infrastructure & supply chain analysis• I.G. Harrison, S.C. Davis, I.K. Busch, M.R. Hilliard, F. Southworth,
B.E. Peterson, S.M. Chin, O. Franzese, ORNL
41
OAK RIDGE NATIONAL LABORATORYU. S. DEPARTMENT OF ENERGY
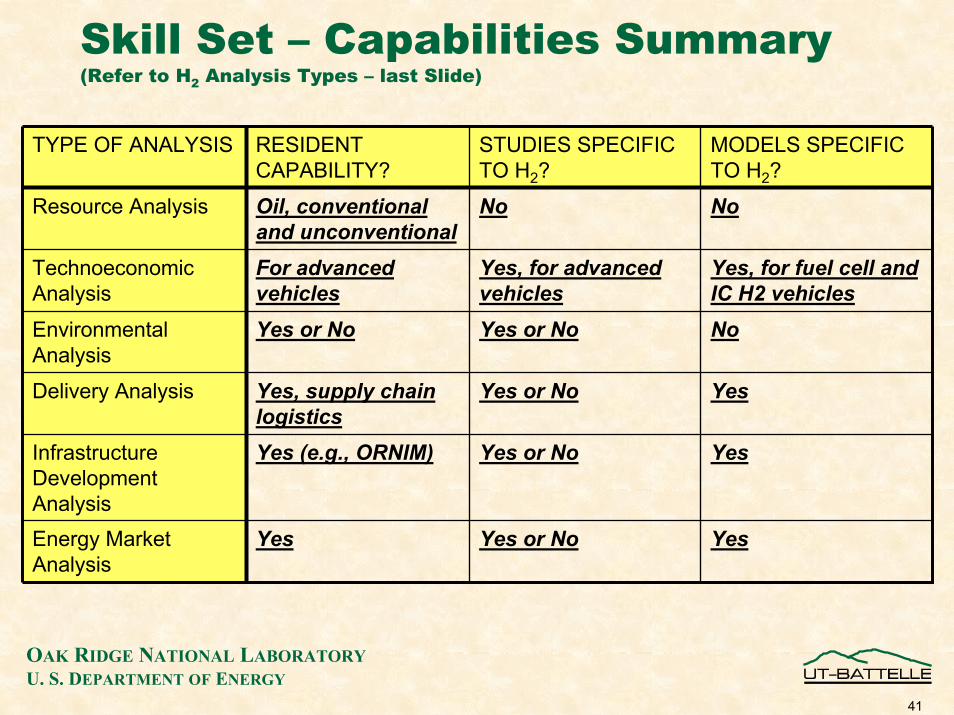
Skill Set – Capabilities Summary(Refer to H2 Analysis Types – last Slide)
Yes
Yes
Yes
No
Yes, for fuel cell and IC H2 vehicles
No
MODELS SPECIFIC TO H2?
Yes or No
Yes or No
Yes or No
Yes or No
Yes, for advanced vehicles
No
STUDIES SPECIFIC TO H2?
RESIDENT CAPABILITY?
TYPE OF ANALYSIS
YesEnergy Market Analysis
Yes (e.g., ORNIM)Infrastructure Development Analysis
Yes, supply chain logistics
Delivery Analysis
Yes or NoEnvironmental Analysis
For advanced vehicles
TechnoeconomicAnalysis
Oil, conventional and unconventional
Resource Analysis
42
OAK RIDGE NATIONAL LABORATORYU. S. DEPARTMENT OF ENERGY
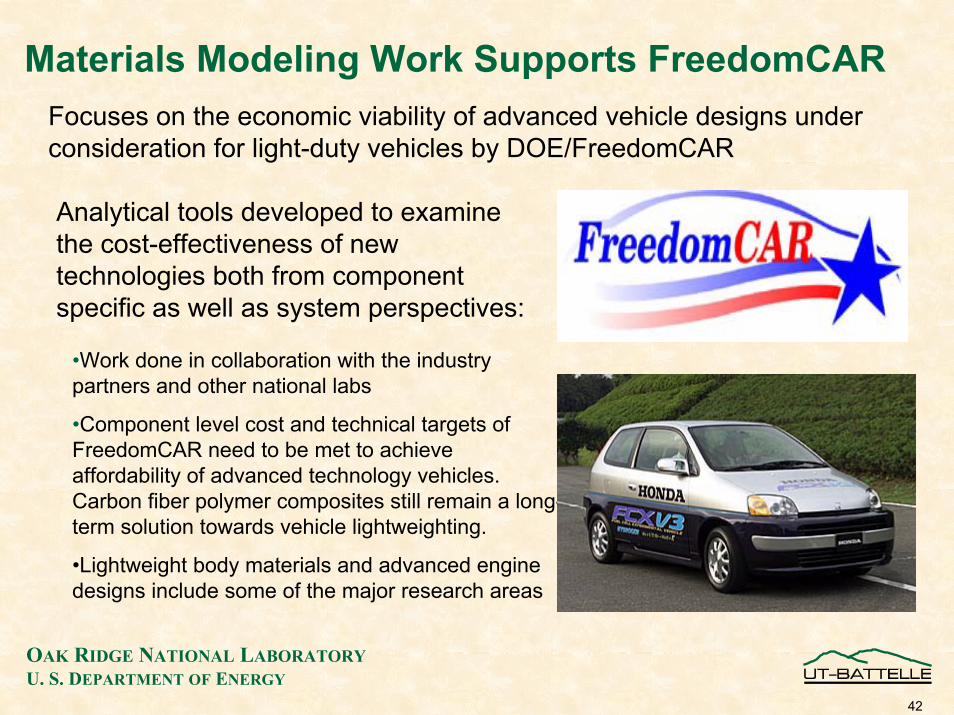
Materials Modeling Work Supports FreedomCARFocuses on the economic viability of advanced vehicle designs under consideration for light-duty vehicles by DOE/FreedomCAR
•Work done in collaboration with the industry partners and other national labs
•Component level cost and technical targets of FreedomCAR need to be met to achieve affordability of advanced technology vehicles. Carbon fiber polymer composites still remain a long-term solution towards vehicle lightweighting.
•Lightweight body materials and advanced engine designs include some of the major research areas
Analytical tools developed to examine the cost-effectiveness of new technologies both from component specific as well as system perspectives:
43
OAK RIDGE NATIONAL LABORATORYU. S. DEPARTMENT OF ENERGY
ORNL has been a leader in Freight Transportation Research:
1) GeoFreight GIS/Bottleneck Analysis Tool(US Dept. of Transportation)
2) 2002 Commodity Flow Survey: Inter-modal Shipment Routing Models (US Dept. of Transportation)
3) Enterprise Model of Dynamic freight Supply Chains(National Science Foundation)
4) Maritime Input-Output Model for North America(US Army Corps of Engineers)
44
OAK RIDGE NATIONAL LABORATORYU. S. DEPARTMENT OF ENERGY
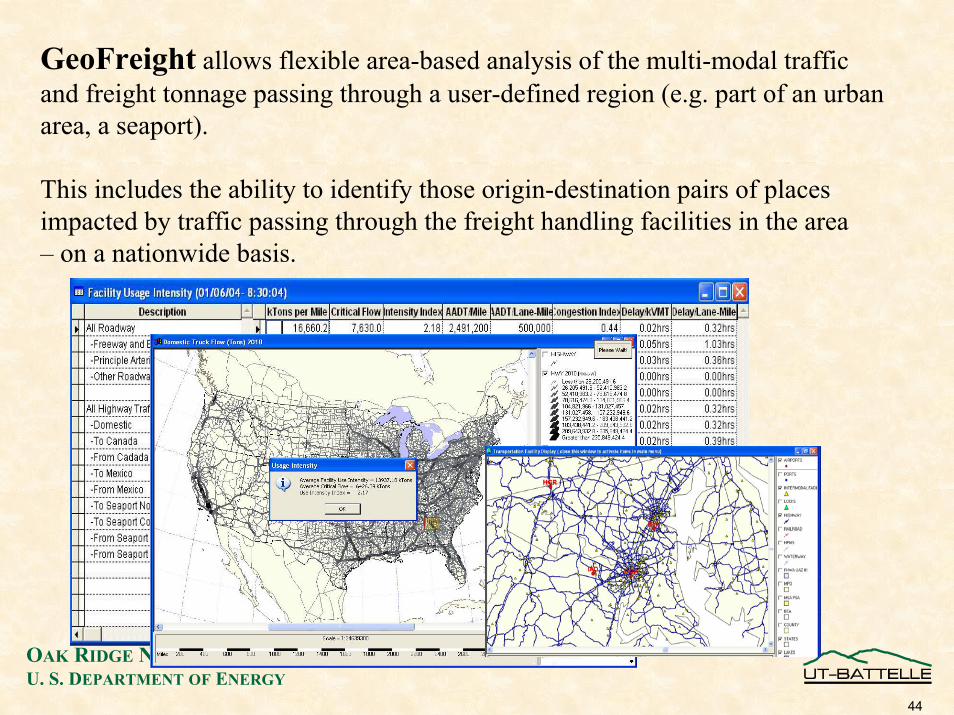
GeoFreight allows flexible area-based analysis of the multi-modal traffic and freight tonnage passing through a user-defined region (e.g. part of an urban area, a seaport).
This includes the ability to identify those origin-destination pairs of placesimpacted by traffic passing through the freight handling facilities in the area – on a nationwide basis.
OAK RIDGE NATIONAL LABORATORYU. S. DEPARTMENT OF ENERGY
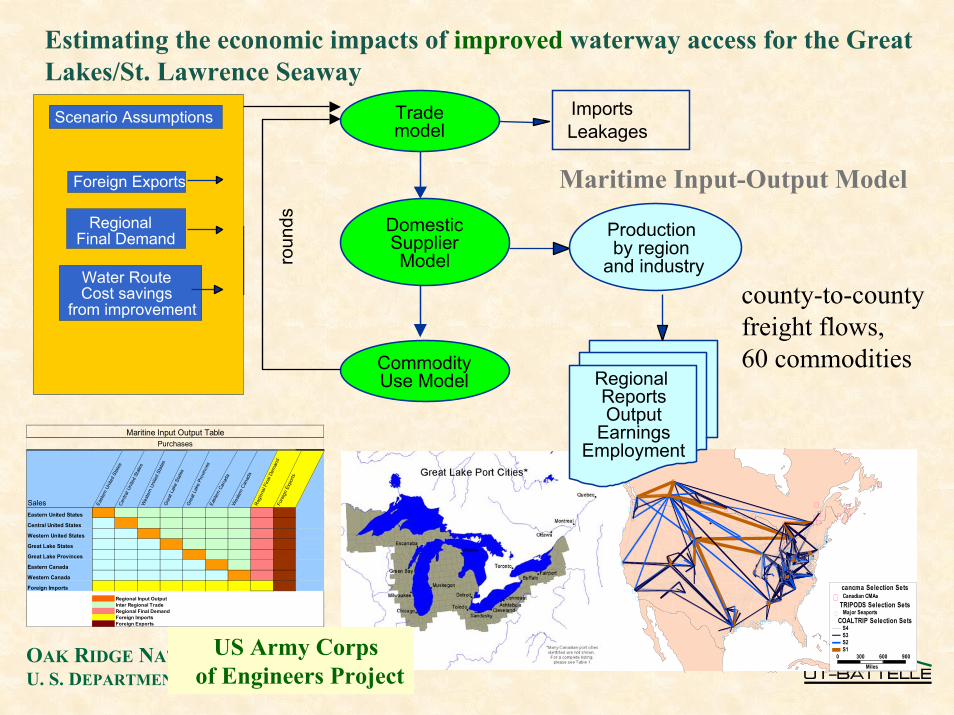
Estimating the economic impacts of improved waterway access for the Great Lakes/St. Lawrence Seaway
0 300 600 900Miles
cancma Selection SetsCanadian CMAs
TRIPODS Selection SetsMajor Seaports
COALTRIP Selection SetsS4S3S2S1
Trade model
Commodity Use Model
Domestic Supplier Model
Regional ReportsOutput
EarningsEmployment
ImportsLeakages
Production by region
and industryroun
ds
Scenario Assumptions
Foreign Exports
Regional Final Demand
Water RouteCost savings
from improvement
Maritine Input Output TablePurchases
Sales East
ern
Unite
d St
ates
Cent
ral U
nite
d St
ates
Wes
tern
Uni
ted
Stat
esG
reat
Lak
e St
ates
Gre
at L
ake
Prov
ince
sEa
ster
n Ca
nada
Wes
tern
Can
ada
Reg
iona
l Fin
al D
eman
dFo
reig
n Ex
ports
Eastern United States
Central United States
Western United States
Great Lake States
Great Lake Provinces
Eastern Canada
Western Canada
Foreign Imports
Regional Input OutputInter Regional TradeRegional Final DemandForeign ImportsForeign Exports
Maritime Input-Output Model
US Army Corpsof Engineers Project
county-to-county freight flows, 60 commodities
46
OAK RIDGE NATIONAL LABORATORYU. S. DEPARTMENT OF ENERGY
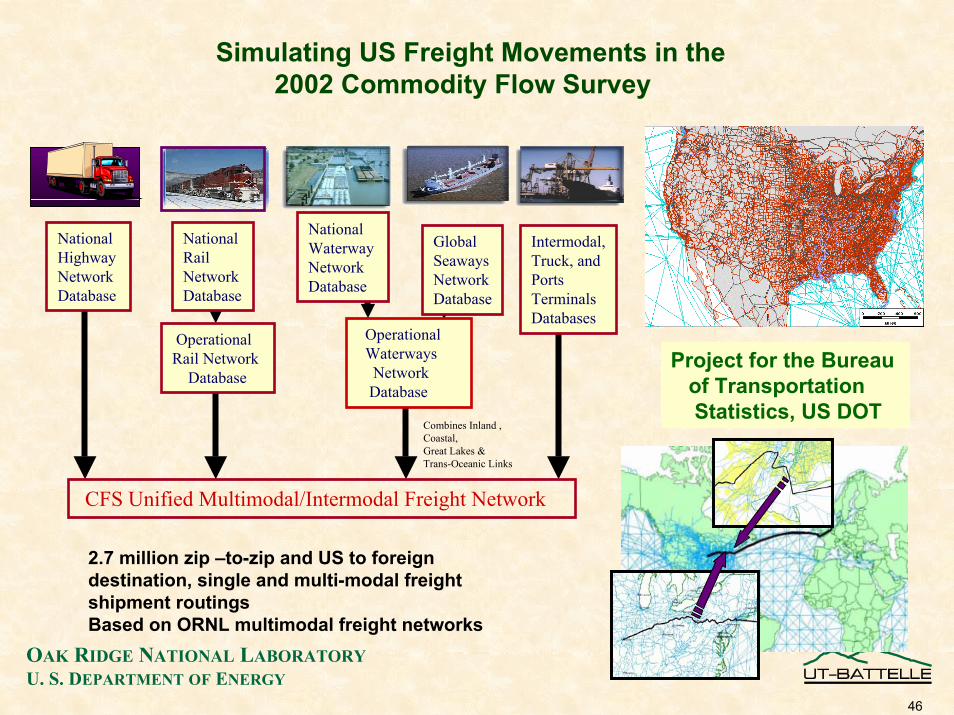
Simulating US Freight Movements in the 2002 Commodity Flow Survey
National Highway NetworkDatabase
National RailNetworkDatabase
CFS Unified Multimodal/Intermodal Freight Network
Combines Inland , Coastal,Great Lakes & Trans-Oceanic Links
National Waterway NetworkDatabase
Global SeawaysNetworkDatabase
OperationalWaterways NetworkDatabase
OperationalRail Network
Database
Intermodal,Truck, andPortsTerminalsDatabases
Project for the Bureau of TransportationStatistics, US DOT
2.7 million zip –to-zip and US to foreign destination, single and multi-modal freight shipment routingsBased on ORNL multimodal freight networks
47
OAK RIDGE NATIONAL LABORATORYU. S. DEPARTMENT OF ENERGY
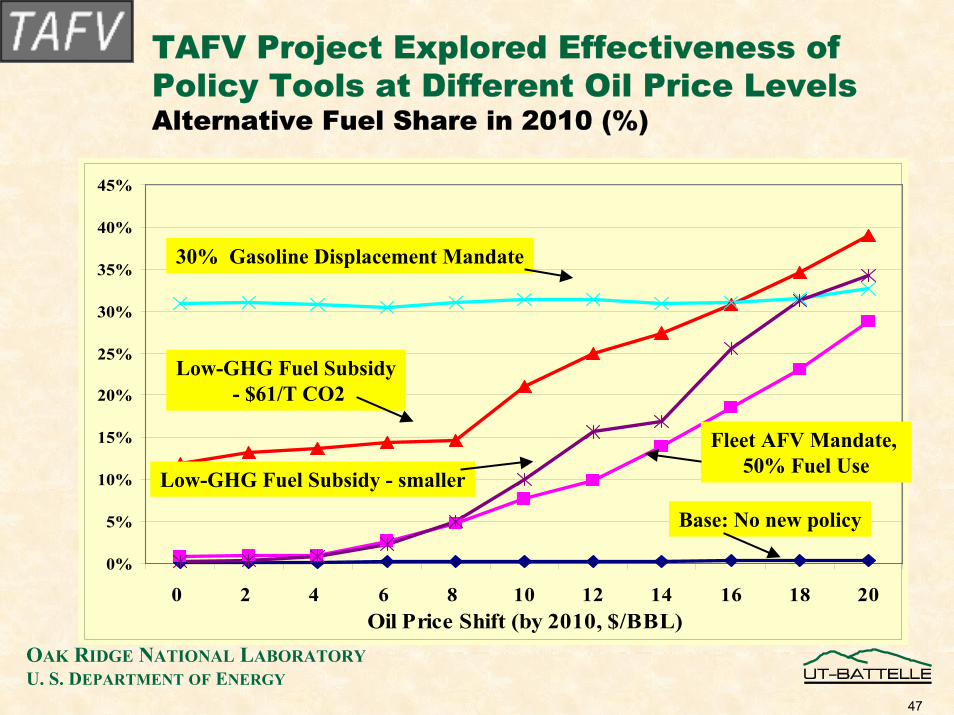
TAFV Project Explored Effectiveness of Policy Tools at Different Oil Price LevelsAlternative Fuel Share in 2010 (%)
0%
5%
10%
15%
20%
25%
30%
35%
40%
45%
0 2 4 6 8 10 12 14 16 18 20Oil Price Shift (by 2010, $/BBL)
Base: No new policy
Fleet AFV Mandate, 50% Fuel Use
30% Gasoline Displacement Mandate
Low-GHG Fuel Subsidy- $61/T CO2
Low-GHG Fuel Subsidy - smaller
48
OAK RIDGE NATIONAL LABORATORYU. S. DEPARTMENT OF ENERGY
HyTrans finds a simultaneous solutionthat integrates consumer, fuel producer, fuel
distributor and vehicle manufacturer decisions.
Fuel Demandand Choice
FuelProduction
FeedstockSupply
New Vehicle Demand
and Choice
VehicleProduction
Fuel Usage & GHG Emissions
Vehicle Services Demand
Vintaged VehicleStock
Fuel DistributionAnd Retail
49
OAK RIDGE NATIONAL LABORATORYU. S. DEPARTMENT OF ENERGY
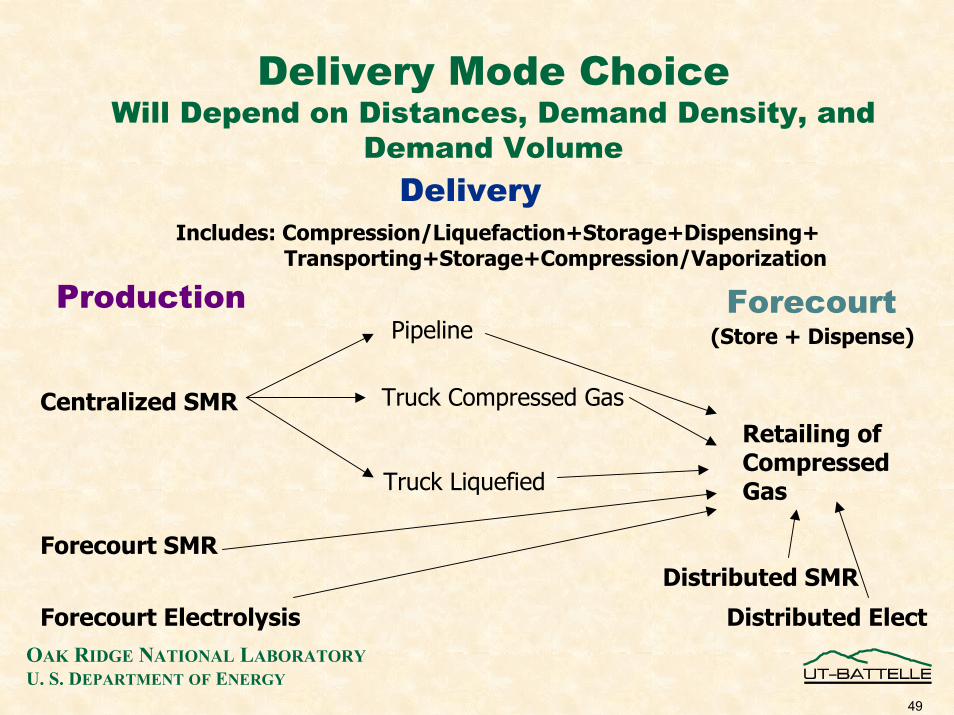
Delivery Mode ChoiceWill Depend on Distances, Demand Density, and
Demand VolumeDelivery
Includes: Compression/Liquefaction+Storage+Dispensing+Transporting+Storage+Compression/Vaporization
Production ForecourtPipeline
Centralized SMR Truck Compressed Gas
Truck Liquefied
(Store + Dispense)
Distributed SMR
Retailing ofCompressedGas
Forecourt SMR
Distributed ElectForecourt Electrolysis
50
OAK RIDGE NATIONAL LABORATORYU. S. DEPARTMENT OF ENERGY
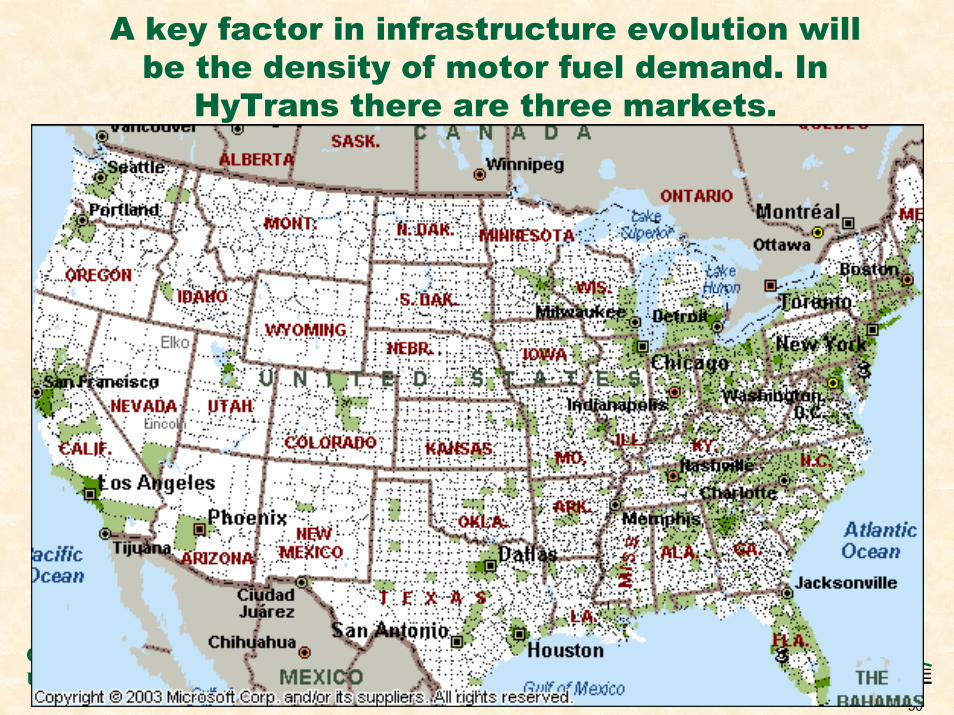
A key factor in infrastructure evolution will be the density of motor fuel demand. In
HyTrans there are three markets.
51
OAK RIDGE NATIONAL LABORATORYU. S. DEPARTMENT OF ENERGY
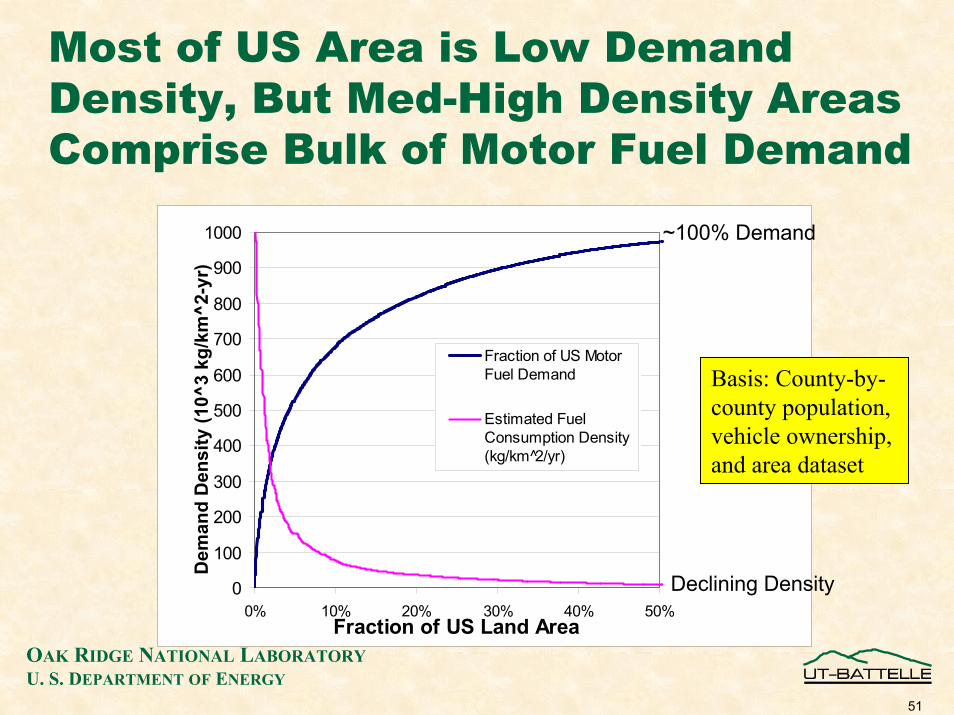
Most of US Area is Low Demand Density, But Med-High Density Areas Comprise Bulk of Motor Fuel Demand
0
100
200
300
400
500
600
700
800
900
1000
0% 10% 20% 30% 40% 50%Fraction of US Land Area
Dem
and
Den
sity
(10^
3 kg
/km
^2-y
r)
Fraction of US MotorFuel Demand
Estimated FuelConsumption Density(kg/km 2̂/yr)
~100% Demand
Declining Density
Basis: County-by-county population, vehicle ownership, and area dataset
52
OAK RIDGE NATIONAL LABORATORYU. S. DEPARTMENT OF ENERGY
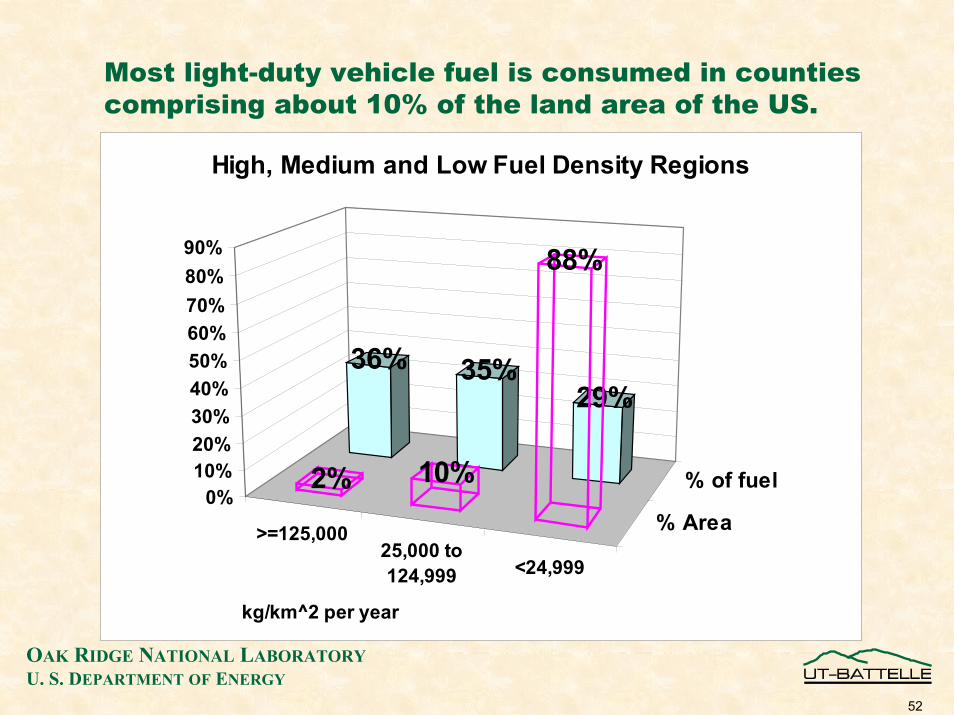
Most light-duty vehicle fuel is consumed in counties comprising about 10% of the land area of the US.
>=125,00025,000 to124,999 <24,999
% Area
% of fuel
36% 35%29%
2% 10%
88%
0%10%20%30%40%50%60%70%80%90%
kg/km^2 per year
High, Medium and Low Fuel Density Regions
53
OAK RIDGE NATIONAL LABORATORYU. S. DEPARTMENT OF ENERGY
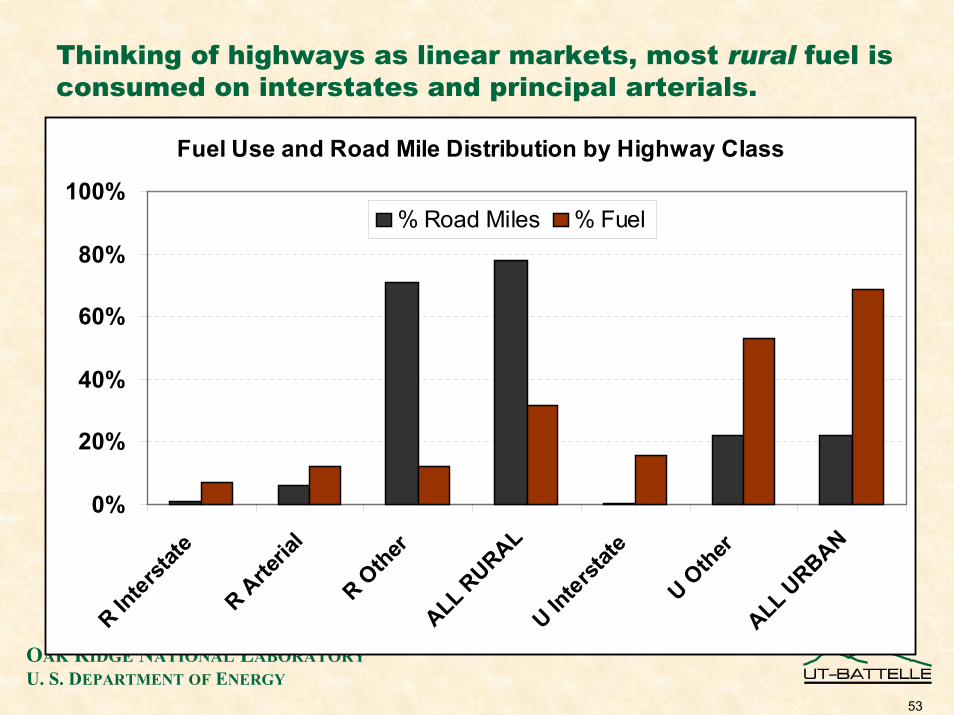
Thinking of highways as linear markets, most rural fuel is consumed on interstates and principal arterials.
Fuel Use and Road Mile Distribution by Highway Class
0%
20%
40%
60%
80%
100%
R Interst
ate
R Arte
rial
R Other
ALL RURAL
U Interst
ate
U Other
ALL URBAN
% Road Miles % Fuel
54
OAK RIDGE NATIONAL LABORATORYU. S. DEPARTMENT OF ENERGY
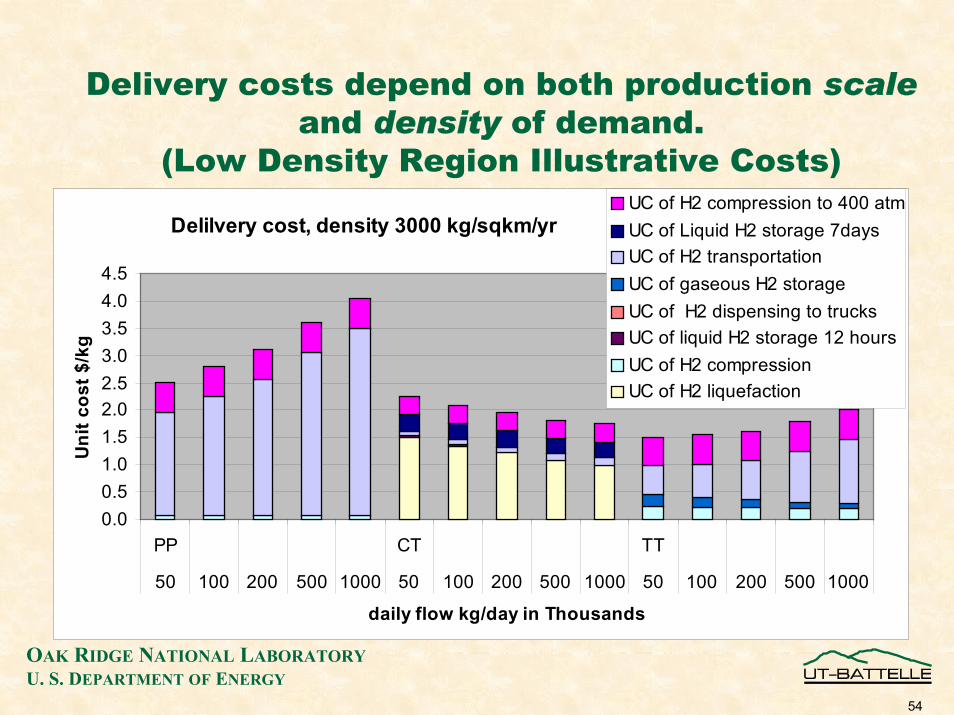
Delivery costs depend on both production scaleand density of demand.
(Low Density Region Illustrative Costs)
Delilvery cost, density 3000 kg/sqkm/yr
0.00.51.01.52.02.53.03.54.04.5
PP CT TT
50 100 200 500 1000 50 100 200 500 1000 50 100 200 500 1000
daily flow kg/day in Thousands
Uni
t cos
t $/k
g
UC of H2 compression to 400 atmUC of Liquid H2 storage 7daysUC of H2 transportationUC of gaseous H2 storageUC of H2 dispensing to trucksUC of liquid H2 storage 12 hoursUC of H2 compressionUC of H2 liquefaction
55
OAK RIDGE NATIONAL LABORATORYU. S. DEPARTMENT OF ENERGY
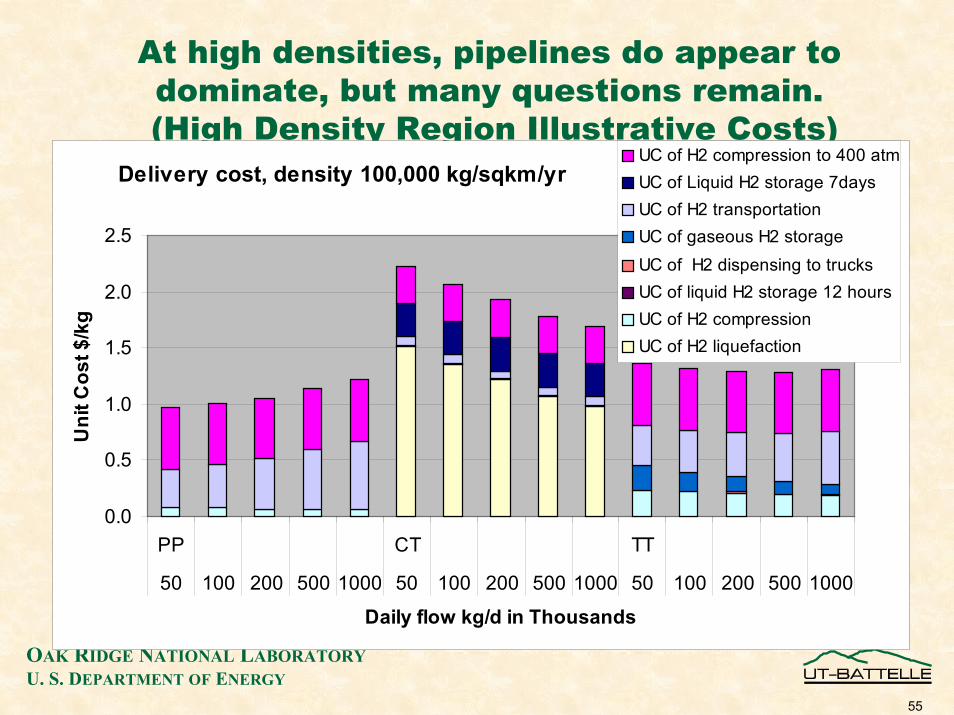
At high densities, pipelines do appear to dominate, but many questions remain.(High Density Region Illustrative Costs)
Delivery cost, density 100,000 kg/sqkm/yr
0.0
0.5
1.0
1.5
2.0
2.5
PP CT TT
50 100 200 500 1000 50 100 200 500 1000 50 100 200 500 1000
Daily flow kg/d in Thousands
Uni
t Cos
t $/k
g
UC of H2 compression to 400 atmUC of Liquid H2 storage 7daysUC of H2 transportationUC of gaseous H2 storageUC of H2 dispensing to trucksUC of liquid H2 storage 12 hoursUC of H2 compressionUC of H2 liquefaction
56
OAK RIDGE NATIONAL LABORATORYU. S. DEPARTMENT OF ENERGY
Improving our representation of fuel availability value to vehicle owner, via spatially explicit analysis (side-studies)
• UC Davis using urban models to measuring increased trip distance and travel time for limited local availability.
• The value of availability in non-local markets and other regions needs a rigorous logical framework.
• Availability in linear markets needs a rigorous formulation. Marc Melaina (U. Mich) addressing.
57
OAK RIDGE NATIONAL LABORATORYU. S. DEPARTMENT OF ENERGY
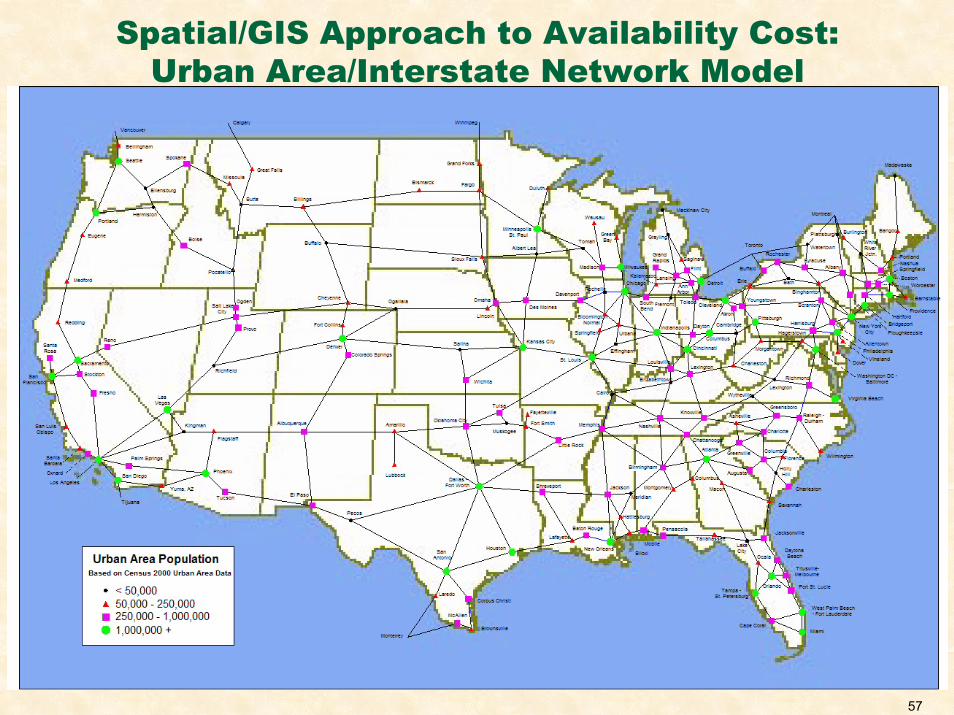
Spatial/GIS Approach to Availability Cost:Urban Area/Interstate Network Model
58
OAK RIDGE NATIONAL LABORATORYU. S. DEPARTMENT OF ENERGY
Hard problems remain for demand modeling:
• How to determine the value of availability in other regions?− Own region− Intercity− Other regions
• How to explore the unique value of the hydrogen fuel cell vehicle?
• How to design the most competitive vehicles?