o0 TEST AND EVALUATION OF THE MOVING …Repoit No. FAAE-1-7-118 o0 00 TEST AND EVALUATION OF THE...
126
Repoit No. FAAE-1-7-118 o0 00 TEST AND EVALUATION OF THE MOVING TARGET DETECTOR (MT0 1 RADAR SRonald S. Bassford "Wiliam Goodchild and Aflred De La Marche k.-% 0, & TR4 -0 FLEAi REPORT Document is available to the public through the National Technical hiformation Service Springfield, Virginia 22151 l Prepared fir U. S. DEPARTMENT OF TRANSPORTATION HFPE2IA AVIATIPH AIMINISTRATIOH CD Sstas lesiarck & Sevele aut service C= C= waslugltsu, I.C. 2151S 6= C=
Transcript of o0 TEST AND EVALUATION OF THE MOVING …Repoit No. FAAE-1-7-118 o0 00 TEST AND EVALUATION OF THE...

Repoit No. FAAE-1-7-118
o0
00 TEST AND EVALUATION OF THE MOVING
TARGET DETECTOR (MT0 1 RADAR
SRonald S. Bassford
"Wiliam Goodchildand
Aflred De La Marche
k.-%
0,
& TR4
-0
FLEAi REPORT
Document is available to the public through the
National Technical hiformation ServiceSpringfield, Virginia 22151
l Prepared fir
U. S. DEPARTMENT OF TRANSPORTATIONHFPE2IA AVIATIPH AIMINISTRATIOH
CD Sstas lesiarck & Sevele aut service
C= C= waslugltsu, I.C. 2151S
6= C=
NOTICE
This document is disseminated undei the sponsorsiupof the Depa.-tment of Transportation in the interest ofinformation exchange. The United States Governrunnt,asaurnes no liability for its contents or use thereof.
I•

Id
0 A
IIt
I31P
-¢ I IIU
Ii I I ,6..•*
U -I "a * o
-la ~ll,.- --

Technical Report Documentation Page
1. Rvpo't No Go~..mment Accesslon NO. 3. Ree~ip~en.' Catalog No
FAA-RP-i1--118 ______________ ___
K Tteend- Sutol*te~ Report Date
-~ ES N EVALUATION OF THE MiOVING TARGET DETECTORf (It Oct411111111O77 _
<. Alfredjte La Marche ila/odhl FAA-NA-77-29T Forlopmeng Orgwr~vat..n Nome and Add,,s
Federal Aviation Administration_______ _______
National Aviation Facilities Experimental Center- 11. Centrect a, Grant No
Atlantic! City, New Jersey 022-243-51013. Type of R. 0 ,ep,t ad Per.ad Coý*r*d
12SosrgAgency Name Fina rddf -
Fdral Aiatin Administration OcZ-OISystems Research and Developmental Service 1. ii PPV1111m ~~---- _.
Washington, D.C. 20590 ARD- 243IS Supplementary Notes
'46 Alpstrect
The moving target detector (MTm) terminal radar processor system was evaluated todetermine its capability to provide radar data suitable for utilization by theAutomated Radar Terminal System.
The major objective of testing was to compare the target detection in clutterperformatice of the WID system with that of the best terminal radar proceasorsystem in the FAA inventory. The comparative tests imere conducted us:~ng testsignals and flight test aircraft. The test signals were used to determine falsealarm rates, probability of detection, accuracy, velocity response, and subcluttervisibility capabilities. Flight testing was performed to determine subcluttervisibility, subweather visibility, and target resolution capabilities.
Additional tests were peidormed to determine the compatibility of the MTID processorwith terminal radar systems currently in use in the Federal Aviation AdministrationK (FAA).
The results of the testa demonstrated that the MTD rystem capability to detecttargets in a clut,.er environment was much better than that of present FAA systems.r It effectively eliminated all clutter experienced in the National Aviation Facili-ties Experimental Center (NAFEC) radar environment. The MTD processor is compatiblewith present FAA rada'r systea,
17. Key Word.i.DsrbtonSaeet0
Ai4rport Surveillance Radar Document is availqble to the pliblicIHoving Target Detector through the National Technical InformationU.d..r Processors Service, Springfield, Virginia 22151
Radar Quantizers-
Ki. Uevrity C186611. (of this "port) seourity Clessif.4(of hi.leg.) 2. No. of eoles 22. Price
_____ Unclassified IUnclassified 123
Feas DOT f1700.7 (r.2 Reproduction of completed P030 outheti sod
Al"

PREFACE
Acknowledgement is made to the following personnel for their contribution tothis project:
1. Mr. Lincoln Cartledge, Lincoln Laboratory, for his assistance in MTDoperation and data collection.
2. Mr. Gerald Decker, NAFEC project pilot, for ar-:anging and participating inthe test flight program.
3. Mr. Edward Ezekiel, NAFEC, for his expertise as project air traffic-introller.
4. Mr. Mark Schoenthal, NAFEC, for his help in developing and debuggingsoftware used with the Automated Radar Terminal System (ARTS) for MovingTarget Detector (MTD) operation and data collection.
5. Mr. Ken Tachetter, Sperry Univac, for his assistance in developing anddebugging clutter reduction software for the ARTS III R&dar Input ProcessorkRIP) MTD report processing.
lp' ,
iL
I;- -
TABLE OF CONTENTS
Page
INTRODUCTION 1
Purpose I
Bq- -ground I
Description of Equipment I
DISCUSSION 3
SYSTEM TESTS AND RESULTS 4
Test Configuration 4
Syotem Certification 7
Radar/Processor Perfermance Tests 7
System Flight Tests 25
ASR-5 and ASR-7 HTD Compatibility Tests 29
SU•MARY OF RESULTS 32
CONCLUSIONS 35
RECOM•ENDATIONS 36
REFERZXCLS 37
APPENDICES
A - Description of Equipment
B - Test Equipment
C - Probability of False Alarm in Thermal Noise
D - MTD Interface with ASR-5 and ASR-7 Radars
v
e.1

LIST OF ILLUSTRATIONS
Figure Page
I MTD Equipment 38
2 Simplified MTD Processor Block Diagram 39
3 ARTS III WD RIP Simplified Block Diagram 40
4 Comparative Dace Acquibition and Reduction System 41
5 NOVA-1220 Subsystem 42
6 HTD Thermal False Alarm Curves 43
7 HTD Interference Elimination 44
8 Target Displays with and without Second-,Level Thresholding 45
in a Light Angel Environment (5-nmi Range Rings)
9 Target Displays with and without Second-Level Thresholding 46
in a Heavy Angel Environment (5-nmi Range Rings)
10 Second-Level Threshold Qtrength Number as a Function of '47
Signal Strength
11 larget Display with and without Second-Level Thresholding 48
in an kngel Environment, 54-dB STC (5-nim Range Rings)
12 Target Display with and without Second-Level Thresholding 49
in an Angel Environment, 48-dB STC (5-nmi Range Rings)
13 Target Display with and without Second-Level Thresholding 50
in an Angel Environment, 42-dB STC (5-mni Range Rings)
14 Target Display with and withouL Second-Level Thresholding 51
in an Angel Environment, 36-dB STC (5-nmi Range Rings)
15 ARTS III Tracker Output for MMD Operation in WeatheL with 52
and without Software Thresholding (10-nmi Range Rings)
16 ARTS III Tracker Output for MTD Operation on a Clear Day 53with and without Second-Level Thrasholding, .No Track
Coasting (lO-nmi Range Rings)
17 System STC Curves 54
18 WTD STC Value 'Curve 55
vi
,, ... * . I•.-

LIST OF I.LUSTRATIONS (Cont'd)
Figure Page
19 Aircraft Echo Strength versus STC 56
20 MTD/RVD-4 Comparative Probability of Detection 57
21 Velocity Response of MTJD Nonzero Filters 58
22 KTU Velocity Response in Weather 59
23 Precipitation Spectra GO
24 MTD Velocity Response Filters 1 through 7 Combined 6b
25 Velocity Response of KTD Zero Filter 62
26 Comparative Subclutter Visibility 63
2? Comparative Frequency Distributions of Range Accuracy 64
28 Comparative Frequency Distributions of Azintth Accuracy 65
29 ASR-7/RVD-4 System Sensitivity Flight Test (10-nrl Range 66Rings)
30 FPS-18I'/4iD System Sensitivity Flight Test (lO-nmi Range 67Rings)
31 Ground Clutter in tht NAFEC/Atlantic City Area (5-nml Range 68Rings, 54-dB STC)
32 ASR-7/RVD-4 Tangential Detection in Clutter (5--nmi Range 69Rings)
33 FPS-18/MTD Tauigential Detection in Clutter (5-nam Range 70Rings)
34 SCV Teat Flight with Fitiperi-powed Attenuated (25 dB) 71
Ground Clutter (2-nal, Range Rings)
35 Flight Teat Weather (Noisal Video, 5-rmi Rante Rings) 72
36 ASR-7/RVD-4 Target Detection in Weather (5-nai Range Rings) 73
37 PPS-18/MTD Target Detection in Weather (5-nmi Range Rings) 74
38 Comparative System Detection la Wtather 75
vii
e-

LIST OF ILLUSTRATIONS (Cont'd)
Figure Page
19 Comparative Tir[ct ResoluLion Capability 76
40 Comparative Target Resolution Capabillt'y (8 sheets) 77
41 System Stability Determined vith Single Gate Processor 85
42 Phase Detector Coiversion Losses 86
43 Subclutter Visibility as a Function of COHO Level 86
44 ASk-5 and ASK-7 KTD Subclutter Visibility 37
viii
1I
LIST Of TABLES
Table Page
I Run Summary (Reduced Data) 5
2 Scan Szwry (ReducMd Datt) 6
3 Test Parameters, FPS-18/IMrD System 8
4 ASR-7 System Parameters 9
5 Nuzaber of MTD Reports during Light Angel Activity 13
6 Nmber of MTD Reports during Heavy Angel Activity 13
7 Percentage of 128 Thresholds in each 4-nti Range Interval 14within a Civen Strength Range during Light Angel Activity
8 Pwrcentage of 128 Thresholds in each 4-nmi Range Interval 14within a Given Strength Range during Heavy Angel Activity
9 Percentage of 128 Thresholds in each 4-nmi Range Interval 16within a Given Strength Range during Angel Activity forFour Values of STC
10 Number of KM Reports before Second-Level Threcholding in 17the First 16 nmi for Four Values of STC-by individualDoppler Fil" ers
11 Total Number of PiD Reports after Second-Level Thresholding 17in the First 16 nri for Four Values of STC
12 Percentage of 128 Thresholds in each 4-nmi Range Interval 18within a Given Strength Range during Weather Activity
13 Average number of Single-- and Multiple-CPI Returns from 19each HTD Doppler Filter for One Antenna Scan duringWeather Activity
ix
WN 1 M"1-11

INTRODUCTION
7URPOSE.
The purpose of this project was to test and evaluate the Moving Target Detector(MTD) radar/processor system to determine its capability to provide AirportSurveillance Radar (ASR) data suitable for Automated Radar Terminal System(ARTS ill) processing. The primary area of concern was the ability of the KTDto function acceptably in a terminal radar cluzter environment.
BACKGROUN!.
The ?TD radar/processor was developed for the Federal Aviation Administration(FAA) by the Massachusetts Institute of Technology (MIT) Lincoln Laboratoryunder tAsks B and G of interagency agreement DOT-FA71-lAI-242. It was designedto providz radar data suitable for utilizotion by the ARTS III system. Primar-ily, this wan to be accomplished by providing improved target detection in
ground, weathcr, anr angel clutter. To this end, the MTD was designed toprovide stable linear '?eration with wide dynamic range and sophisticateddigital processing. The MTD was integrated into the Terminal Facility forAutomated Surveillance Testing (TFAST) ARTS III system at the National AviationFacilities Experimental Center (NAFEC) and tested by a Joint Lincoln Labora-tory and MAFEC team. Software for integration of the MTD/processor and theARTS Ill system was developed by Sperry Univac 4nd NAFEC.
DESCRIPTION OF EQUIPMENT.
System processing was performed in two stages. First, the MTD system (figure 1)developed by Lincoln Laboratory provided coherent radar signal processing usingadaptive thresholding techniques to discriminate against undesirable signalscaused by nonsynchronous interference, ground clutter, and weather clutter.Second, further processing was performed in the ARTS III radar input processor(RIP) software developed for HITM operation. This additional adaptive threshold-ing was performed to remove any false alarms caused by residue from clutter,interference, and angels, thereby preventing initiation of false tracks. TheARTS III tracker provided further velocity discrimination against false alarms.Descriptions of NTD and ARTS III processing are given below.
Figure 2 shows the basic components of the MTh radar digital signal processingsystem. In the NAFEC tests, intermediate frequency (IF) signals input to theprocessor wetre taken from the preamplifler output of the radar system beingused. A moxLiflid Military Fixed Radar Detector (FPS)-i.8 klystron-type radarwas used for the basic KMT testing. ,Idifications included a new analog IFreceiver subsystem designed to provide stable, wide-dynamic-range signalssuitable for MTD processing and a Coherent Oscillator (COHO) and videodetectors for providing the in-phaa* (I) and quadrature (Q) bipolar videos tothe input processor. A description of the modified FPS-]8 system is containedin appendix A.
I
& _ ____ ____ ____ ___
S . . .. . -,• • ... .. . . .• -•.-- . , . -~ ...-. ,.-m. *-.-

The input processor shown in figure 2 consisted of two analog-to-digital (A /•I)converters and two 8K memories. A 10-bit A/D converter was used for each(I or Q) video chalnnel. The digitizer video from each A/D was stored inmemo-.v until data trom 10 interpulse periods had been accumulated. This grokipof data was termed a coherent processing interval (CPI). There wLre 480 CHl'sper antenna scan. The 10 samples in each range gate were then outputted tothe canceller, beginning with the first range gate and continuing in rangeorder. The first two azimuth samples from each range gate were used to"charge up" the three-pulse canceller, and the remaining eight provided thenecessary inputs for the eight-point discrete Fourier transform. The MT[)operated with a 1/16 noutical mile (nrmi) range gate length and a maximum raung,oti 47.5 nmi.
The saturation detector determined if any of the 10 samples saturqted the AIDconverter resulting in distorted information. If so, the information from thatrange cell was discarded.
The interference eliminator compared the magnitude of each of the 10 sampleswith the average magnitude of the 10. If any sample was greater than fivetimes the average, it was considered to be interfercnce from another radar, andthe informationin that range cell was discarded.
The three-pulse canceller removed low-velocity information (ground clutter)prior to discrete Fourier transform (DFT) filtering. Since low radial velocity(tangential) targets were removed along with the clutter echoes, a separatezero velo'ity filter (ZVF) was implemented. It allowed detection of a low-radial-velocity target when its echo strength exceeded the level of the clutterin the same range-azimuth cell, The ZVF was implemented using a disc memory tostore the clutter level Information in every range azimuth cell from scan toscan. This information was used to establish thresholds for deciding whether alow-velocity return represented clutter or a target. ZVF rar.ge azimuth cellswere 10-pulse repetition periods by 1 range cell in extent.
A moving target would, in most cases, occupy a different range azimuth celleach antenna scan. Therefore, the threshold which built up over a number ofscans, did not inhibit its being outputted in the ARTS III Input OutputProcessor (IOP).
The DFT circuitry performed an eight-point DFT implementation of the fastFourier transform (FFT). The eight time samples from each range gate werethereby converted to frequency (Doppler) information. Seven fil.er outputsfrom the DFT were utilized. The DFT zero filter output was replaced with theoutput from the separate ZVF.
In the weights and magnitudes circuits, the sidelobes generated in the DFTwere lowered, and the I and Q signals were combined.
Thresholding was performed on each filter output. For the seven nonzero(weather) filters, the threshold was coatrolled by the average level of thereturns in l-nmi range segments centered on the cell of interest. The thresholdfor the ZVF was based on the clutter value stored on the disc memory for the
2

range azimuth cell of interest. Both thresholds adaptively adjusted to theenv •ronmen t.
The LOP interface performed the necessary timing and buffering between theMTD and ARTS III systems. Azimuth, velocity, range, amplitude, an' pulserepetition frequency (PRF) information were outputted by the MTD. A completedescription of the MTD processor is contained in reference I. Figure 3 showsthe basic ARTS III RIP processing unique to MTD operation (discussed fully inappendix A). The input function shown provided handshaking between the NTDand the RIP processor. The range and Doppler consolidation function combinedadjacent MTD range and Doppler filter information into a single target responsefor each CPI. The target record processor merged these new target responsesinto existing target record stores. It outputted completed target records tothe target report processor. The target report routine processed target recordsinto target reports or noise responses. It outputted finalized target reportscontaining range, azimuth, strength, number of CPI's involved, and Dopplerfilter numbers.
The second-level thresholding capability shown in figure 3 was developed atNAFEC to eliminate residual MTD clutter from angels, weather, nonsynchronousinterference, and inversion. Each of these areas is discussed fully underFALSE ALARM TESTING. Targets determined to be valid by the above processingwere outputted to the ARTS III -orrelarion and tracking functions.
DISCUSSION
The basic philosophy followed in testing was to compare thi! capabilities ofthe MTD/processor system to that of the best radar data acquisition system(RDAS) then in the FAA inventory. This was determined to bA the combinationof an airport surveillance radar (ASR-7) and the radar video digitizer (RVD-4).
First, the parameters of the two systems were investigated to insure valid testresults. This also provided the basis f,-r system normalization in later testsso that a valid system-to-system comparison could be made.
Second, each system was tested to determine its capability with respect tostandard radar performance factors. These included probability of falsealarm (Pfa), probability of detection (Pd), subclutter visibility (SCV),Sub-Weather VIibility (SWV), and velocity response. Coherent S-Band radio-frequency (Ri) test targets were generated for the Pd, SCV, SWV, and velocityresponse tests using the NAFEC TFAST Test Target Generator (TTG). The TTGoutput was variable in frequency, pulse width, phase, range start, range rate,azimuth position, intenna scan modulation, amplitude modulation (scintillation),and radar cross section (strength). A description of the TTO is contained inappendix B.
3

rFhrd, flight testing was conducted to determiine the target detection capabil-ities of the two systems in the clear, over clutter (both t&ngentially andradially), and in weather. Target resolution capabilities were tested bydirecting a pa!r of ePrcraft through a series of crossing tracks.
Tests were also conducted to detecrmine the capability of the MTD to functionas the processor for present FAA ASR-type radars. This is discussed belowunder ASR-5 and ASR-7 compatibility testing.
Concurrent with the MTD/RVD-4 comparison testing, a separate investigationof the RVD-4 systeir was conducted. The resulting NAFEC report containingpertinent parameter and performance data has been published (reference 2).Results from the above investigation were used to establish system operatingparameters and will be referred to thrnughout this report.
SYSTEM TESTS AND RE¶ULTS
TEST CONFIGURATION.
The basic system for data acquisition for the comparison of the ASR-7/RVD-4and FPS-18 (S-band coherent radar)/MTD systems is shown in figure 4. Thetwo radars located at the NAFEC TFAST facility were operated independently(asynchronously) by means of a waveguide diplexer. The normal, log normal,and moving target indicator (MTI) video outputs of the ASR-7 were availableto the RVD-4. Low-level IF information from the FPS-18 was sent to the MTDreceiver/processor.
The RVD-4 output was processed with the All Digital Tracking Level (ADTL)program in real time in the ARTS III lOP with the extracted system data beingrecorded on magnetic tape via the ARTS III Integral Magnetic Tape (IMT) unit.Meanwhile, the MTD output was recorded on magnetic tape via a Bucode digitalrecorder. Subsequent to this operation, the Bucode tape was played back intothe ADTL program in the ARTS III lOP, and the MTD system data were extractedon magnetic tape via the ARTS III IMT.
The two comparative system data extractions were then reduced at the NAFECTerminal Automated Test Facility (TATF). Scan and run summaries of eachsystem were printed out for comparative analysis (tables I and 2). Theextracted data tapes from both systems could also be displayed on ARTS IIIData Entry and Display System (DEDS) indicators. This allowed data controlwith the DEDS keyboaro and visual analysis of system performance.
Beacon data were sent to the lOP via the Beacon Data Acquisition System (BDAS).It was processed with both the RVD-4 and KT1D data for aorrelation analysis.The ASR ' .-nalog videos were also recorded on magnetic tape via the TFASTFR-950 video recorder. This analog information was used for backup in caseof incorrect video processing and was also used as a repeatable source foioptimizing thi- RVD-4 processor parameters.
4

TABLE 1. RUN SUMMARY (REDUCED DATA)
1. Run PArameters
Scan start numberScan stop numberSelected track gate (RI, R2, AZi, AZ2)Selected track beacon codeThreshold (RVD)
2. All Report Statistics
Beacon reports/scanRadar reports/scanRadar-beacon correlating reports/scanBeacon false alarms/scanRadar false alarms/scan
3. All Track Statistics
Number beacon tracksNumber radar only tracksMean beacon track lifeMean radar only track lifeBeacon blip/scanRadar blip/scan
4. Selected Track Statistics
Beacon blip/scanRadar blip/scanBeacon report standard deviation ( R, AZ)Radar-beacon correlated report deviation ( R, AZ)Track position deviation ( R, AZ)Track speed deviationTrack heading deviation
5. Processing Load
Radar average and peak/sectorSystem average and peak/sector
Legend
R - Range
AZ - Azimuth
5
i
:4
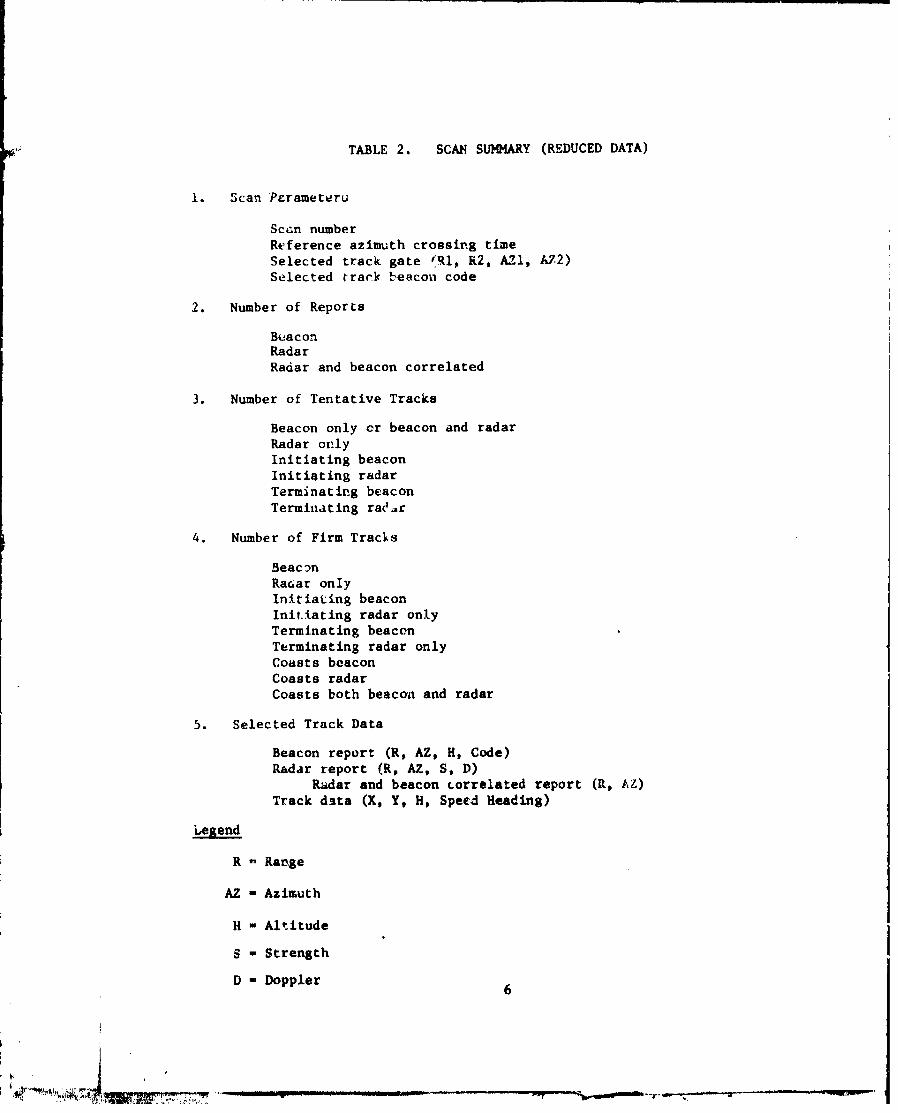
TABLE 2. SCAN SUMMARY (REDUCED DATA)
1. Scan Parameteru
Scan numberReference azimuth crossing timeSelected track gate tRI, R2, AZI, A72)Selected track beacon code
2. Number of Reports
BeaconRadarRadar and beacon correlated
3. Number of Tentative Tracks
Beacon only or beacon and radarRadar onlyInitiating beaconInitiating radarTerminating beaconTerminating raer
4. Number of Firm Tracks
BeaconRaaar onlyInitiating beaconInitiating radar onlyTerminating beaconTerminating radar onlyCoasts beaconCoasts radarCoasts both beacon and radar
5. Selected Track Data
Beacon report (R, AZ, H, Code)Radar report (R, AZ, S, D)
Radar and beacon correlated report (R, AZ)Track data (X, Y, H, Speed Heading)
Legend
R - Range
AZ - Azimuth
H - Altitude
S - Strength
D - Doppler 6
7~-F
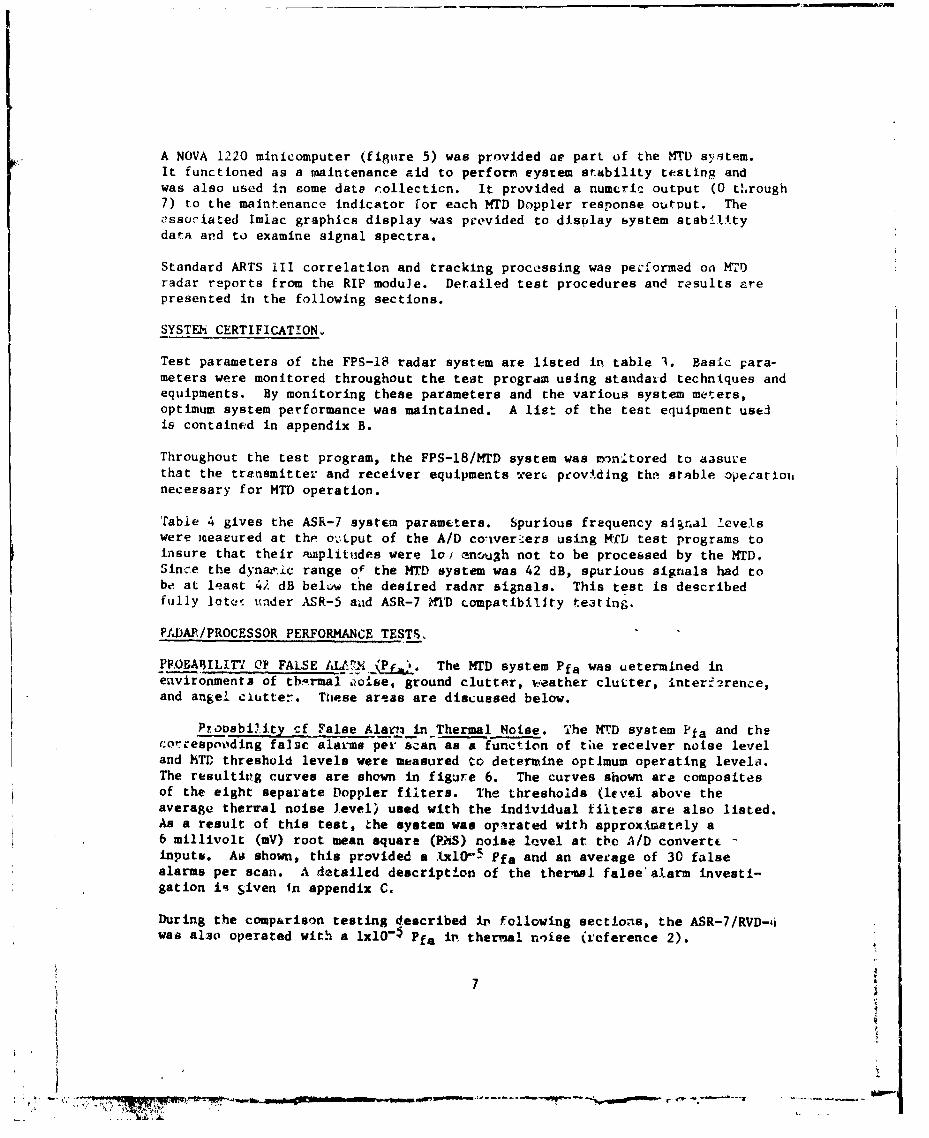
A NOVA 1220 minicomputer (figinre 5) was provided as part of the MTD system.It functioned as a maintenance aid to perforr system stability testing andwas also used in some data collecticn. It provided a numeric output (0 tUrough7) to the maintenance indicator for each MTD Doppler response output. Thecssociated Imlac graphics display was provided to display system stabilltydata and to examine signal spectra.
Standard ARTS Ii correlation and tracking processing was performed on MWT)radar reports from the RIP modu]e. Detailed test procedures and results arepresented in the following sections.
SYSTEM CERTIFICATION.
Test parameters of the FPS-18 radar system are listed in table 3. Basic para-meters were monitored throughout the test program using standard techniques andequipments. By monitoring these parameters and the various system meters,optimum system performance was maintained. A list of the test equipment usedis contained in appendix B.
Throughout the test program, the FPS-18/MTD system was mn.tored to aasurethat the transmitter and receiver equipments werc providlng the stable operatiOrtnecessary for MTD operation.
fable 4 gives the ASR-7 system parameters. Spurious frequency sibnal levelswere iceacured at the oLput of the A/D coliver-ers using MWD test programs toinsure that their amnplitudes were Io, c•nough not to be processed by the MTD.Sinc-e the dynaric range o'f the MTD system was 42 dB, spurious signals had tobe at least 4; dB below the desired radar signals. This test is describedfully loteý under ASR-5 and ASR-7 MT'D compatibility teating.
PRDAR/PROCESSOR PERFORMANCE TESTS.
PROBAMILITY Q2 FALSE IL"_f7YX jP o. The MTD system Pfa was uetermined inenvironments of thormal oolse, ground clutter, ieather clutter, interference,and angel ciutter. Ttiese areas are discussed below.
Probabi'.iity cf False Alam in Thermal Noise. The MTD system Pfa and thecorrespooding false alaims per scan as a function of the receiver noise leveland MTD threshold levels were measured to determine optimum operating levels.The resulting curves are shown in figure 6. The curves shown are compositesof the eight separate Doppler filters. The thresholds (level above theaverage therral noise level) used with the individual filters are also listed.As a result of this test, the system was orprated with approximately a6 millivolt (mV) root mean square (PAS) noise level at the A/D converteinputs. Ao shown, this provided a Ux10 5 rfa and an average of 30 falsealarms per scan. A detailed description of the thermal false'alarm investi-gation ii Siven in appendix C.
During the comp&rison testing described ir following sections, the ASR-7/RVD-4was al3o operated with a 1xlO-5 Pfa in thermal noise (reference 2).
7

TABLE 3. TEST PARAMETERS, FPS-18/MTD SYSTEM
Transmitter (FPS-18)
Power Output (Variable PRF)
Average 57 dBm
Frequency 2710 MHz
Pulse Width 1 ps
Oscillator Klystron Varian 87-B
Receiver
Dynamic Range (IF) 42 dB
Noise Level 6 mV
I 6 mV
Q 6 mV
Noise Figure (Diplexer Antenna Port) 8 dB
STC R74 to 12 nmi
System Timing
Scan Stagger OFF
Low PRF 1.1131 kHzHigh PRF 1.3677 kHzAverage PRF 1.2320 kHz
Scan Stagger ON
Low PRF 1.2080 kHzHigh PRF 1.3794 kHzAverage PRF 1.2415 kHz
8

TAB•E 4. ASR-7 SYSTEM PARAMETERS
Transmitter
Power Output (Stagger-d PRF)
Average 54.6 dBm
Frequency 2795 MHz
Pulse Width .833 ps
Oscillator Magnetron(Amperex DX-276)
Receiver
HTI System Three-Pulse Canceller
Noise Figure (Diplexer AntennaPort) 4 dB
Sensitivity Time Control (STC) R74 to 12 nmi
System Timing
Nonstaggered1.200, 1.173, 1.120, 1.050, .950, or .713 k1,z
StaggeredPseudorandom combination of above 6 PRF's,Average - 1.034 kHz
Antenna Parameters (ASR-5 Antenna)
Rotation (ASR-7 Drive Motor) 12.75 rpmTilt + 2.750Polarization Used LinearkBeamidth (two-way) 10
Gain 34 dB
9
__7'.71. 7r._ _ _ _ _ _ _ _ _ _"_

Probability of False Alarm with an Operating 1ystem. In order toqintain a 10-'FPfa into the trhcker with an operating radar system, the
following improvements were added to the MTD and RIP:
I. MTD interference eliminator,2. RIP interference eliminator, and3. RIP second-level thresholding.
The following discussion defines the need for each of these improvements andany resulting loss in system sensitivity.
Interferer.ce Elimination - The MTrD experienced an increase in falsealarm rate when operating in an RF interference (RFI) environment. An ASR-7radar and an ASR- 4 radar. each located approximately 1 nmi from the TFAST site,were the primary causes •f this nonsynchronous interference. To prevent thesefalse alarms from being outputted by the MTD, an interference eliminatorcapability was added. The interference eliminator algorithm compared themagnitude of any received signal in a CPI range cell with that of 'the averagemagnitude level of the possible 10 signals in the same CPI range cell. If asignal magnitude, exceeded five times the average magnitude, it was consideredto be an interference signal. Information from that CPI range was inhibited atthe MTD thresholding circuitry from being outputted by the MTD.
The MTD output for an equal length of time (multiscan) with and without theinterference eliminator is shown in figure 7. The numerics shown were gcnera-ted using the NOVA minicomputer. Each numeric represented an MTD thresholdcrossing. The value of the numeric indicated which filter had the thresholdcrossing.
As shown, virtually all the interference was eliminated. The remainingisolated numerics were caused by thermal false alarms as previously discussed.Those thermal false alarms satisfying the interference elimination algorithmwere also eliminated. Due to the small number of thermal false alarms, withamplitudes five times the average, this resulted in no appreciable loss ofdata or sensitivity.
The following is a brief discussion of the effept of the interference elimina-tor on system performance as shown in figure 7. The total numbec of CPI/rangecells "i the HTD coverage was 364,800 (760 range gates x 480 CPI's per scan).A typical interfering FAA S-band radar would result in a maximum of 9,bOO CPI/range cells containing interference signals (assuming one reception per PRF and100-percent range splits). The above rate of interference would thereforeresult in inhibiting the information from 2.6 percent of the CPI/range cells.Since the above interference signals were nonsynchronous with the MTD, theywould not correlate in range and azimuth on a scan-to-scan basis. Also, whenan interference signal occurred in tha same CPI/range cell as an aircraft echosignal, the combined information would not necEssarily be discarded. That is,if the interference rejection algorithm was not satisfied (interference magni-tude not more than five times the average magnitude) and the MTD thresholdcriteria were met, the combined information was outputted by the !4TD. The
10
41 - - -- t

resulting target signal, however, necessarily contained spurious frequencyinforriation due to the interference.
For those cases of soqperposition of aircraft and iaterference signals wherethe interference .lgoritim vat c tisfied, two alternatives were possible.First, wher the aircraft signal occurred in more than one CP (this was truein the majority of cases), the loss of information from one CPI had a mini-mized effect on subsequent target declaration and tracking. Second, when theaircraft signal occurred In only one CPI, the resulting loss o' informationwas mitigated by the ability of the tracker to coast f.r up to two scans onuncontrolled tracks and up to 10 scans on controlled tracks.
The above factors indicate why the interference eliminatox had a minimaleffect on system target detection and tracking performance.
In the presence of ground or weather clutter, the MTD interference eliminationalgorithm's capaMlity was again a function of the relative interferenceand clutter signal magnitudes. Therefore, all interference was not removed.To correct this problem, the following interference rejection algorithm wasadded to the RIP. Interference was detected by counting the number ot single-(PI responses occurring in each 50 by 48 nmi sector of radar coverage. Upondetection of 15 or more single-CPI responses in a sector, all single-CPIresponses in that sector were discarded. If the antenna coupling between theradars was such that the interference rotated (changed loca Ion) from scan toscar, the results would be similar to that discussed previously for the MTDinterference eliminator. However, if the antenna coupling resulted in astationary interference patterr, all slngle-CPI signals would be eliminatedin the affpcted sectors for the duration of the interference. The resultingeffect on srstem sensitivity will be discussed later under Pd testing. Itwill be shown that detection of a two-CPI target required a 3-decibels (dB)greater signal level than for a single-CPI target.
Second-Level Thresholding. Second-level thresholding in the RIP toprevent clutter residue and angels from initiating false tracks and to maintainthe number of false alarms at desired levals was implemented as follows. Theradar surveillance area was divided into 4 nmi by 22.5* sectors for a total of192 sectors. Each sector contained eight thresholds (one for each Dopplerfilter) for a total of 1,536 independent sector Doppler thresholds in thecoverage area. The threshold level in each sector Doppler filter was basedupon the frequency of occurrence of single-CPI signals in it. The thresholdlevel in each sector filter was adaptively set by incrementing it by anamount equal to 2.00 strength numbers (defined under angel false alarm tests)each time a single-CPT signal with a strength number (amplitude) greater thanthe threshold occurred. Tho threshold was decremented by 0.125 strength numberif there were no single-CPI signals in that sector from the filter beingexamined during an antenna scan period.
Each HTD output signal was tested against these thresholds. If the signalsamplitude was less than the applicable threshold, it was discarded. Thethresholds derived by this process were applied in the first 16 nmi againstall signals (single and multiple CPI) and from 16 nmi to 48 nmi on single-CPI
11

returns onlv. This range-dependent thresholding was based upon the fact that
most Lngel returns occurred within 16 nmi in the NAFEC rada," environment.
Also, in the first 16 runmi, RIP thresholding was applied before range Doppler,
or CPI .7onsolidation. By applying the threshold in this ntnrer, a coislderable
saving in proce.ing was realized. Beyond 16 nmi, however, since thresholcing
was only performed against single-CPi signals, consolidatlon had to be performedfirst to determine which signals were only in a single CPI.
Angel re~arns detected by the MTD on occasion exc-eded 1,300 targets per scan
while using an R- 4 STC curve extending to 12 nmi. These angels occurred pre-
dominantly in the low-velocity filters as discussed below. Runlengths up to
four CPI's were observed.
The MT,)/processor ',ystt_.n virtually eliminated the resulting false alarm and
false track initiation by a combination of using an R- 4 STC curve, second-level
thresholding in the RIP, desensitizing the tracker bf requiring a two-CPI rin-.
length for track initiation, and the requirement of a target velocity .f at
least 50 knots for track initiation and continuation. Targets appearing in
only one CPI were allowed to initiate tracks beyond lb nm! and to continue
tracks from 0 to 16 nmi,
Figures 8 and 9 show this angel elimination capability in light and heavy
angel clutter. Forty scans of data are presented for each case. Tracking
parametei- used in these and all subseq~ient figures required data from three
scans to initiate a crack and one more befo'- it was displayed. If the tracker
receJ•r. . no return for a track uuring a &can, no symbol was displayed (no
coasting). Notice that both seccnd-level thresholding and the tracker contri-
bute to angel elimin.tion. In each figure, target reports or tracks caused by
automobi!e traffic at 0* and from 0.5 nmi to 3 nmi can be observed. No attempL
.;.s aede during this project to eliminate these automobile targets.
Sincs tne tracker -ias Aesigned to handle a maximum of 100 tracks at a time, the
data 9;iao in figure 9(c) represented only &out 15 percent cf the angels
present. Al1 .,' ng more data into the tracker would have resulted in improper
processing. An example of the inability of the ARTS III system to process
J, rge angel populations is shown in figure 9(a). The program was unable to
display the reports contained in the 2700 to 360" sector.
Table 5 lists the single- and -aultiple-CPI returns corresponding to figures 8(a)
and 8(b). Table 6 presents the same data corresponding to figurec 9(a) and 9(b).
The data contained in these and successive tables were obtained by modifying
the ARTS III operational program to provide the desired outputs. Individual
filter outputs for the thresholded case are not presented, since the number of
reports obtained per filter war too mall to give accurate data.
To further analyze the second-level thresholding capability, the level of each
of the 1,536 sector/Doppler thresholds ws obtained for typical operatiu.g
conditions. Data for the light angel clutter condition are presented in table 7.
Corresponding data for the heavy angel situation are contained in table 8. By
comparing the data in tables 7 and 8, the system desensitization necessary to
eliminate angels for these typical cases can be determined.
12
'.t

TABLE 5. NUMBER OF MM REPORTS DURIPG LIGHT ANGEL ACTIVITY
Before Secind-Level Threwholding
Filtei" Number Single CPI Multiple CPI's
0 10 71 18 122 13 83 8 94 8 55 5 76 11 117 20 21
Total 93 80
After Second-Level Thresholding
Total 16 13
TABLE 6. NUMBER OF MTD REPORTS DURING HEAVY ANGEL ACTIVITY
Before Second-Level Thresholding
Filter Number Single CPI Multiple CPI'8
0 145 391 110 482 128 883 9C 594 80 425 95 736 142 947 115 46
Total 905 489
After Second-Level Thresholding
Total 16 13
13
7p)W

III
040
1-
z 0 1 00
ote
N ~-4--0 u C4 -T
If%% *I "
rI-
PI:B 0i .i 9 "4C n *
4"1
I -14

Figure 10 shows the relationship between !he cecond-level thresholdb discussedabove and system signal-to-noise ratio.
The effects of combined STC and second-level thresholding to eliminate angelsa-e shown in figures 1) through 14. Fout levels at STC were tested as indica-ted. Note that the four individual STC curves had maximum range extents asgiven in table 9.
The sector/Doppler threshold levels resulting from using the four values of STCas a tunction of range are given in table 9. Threshold levels were influencedby the STC attenuation only to the maximum extent (range) of each STC value asindicated. Table 9 snows that an overall increose in system sensitivity withinthe STC range was obtained by using less STC and allowing the second-ieveithrepheld6 to adapt to the environment. For example, lowering the STC trom54 dB to 48 dB allowed 6 dB more sensitivity, while the average second-levelthreshold attenuation values for the 54-dB and 48-dB cases from 0 to 4 nmi were(from table 9) 3.42 dB and 8.08 dB, respectively. Thus, within the above rangeinterval, the average increase in system sensitivity was 1.34 dB. From 4 nlito 8 nmi. the average second-level threshold attenuation values for STC valuesof 54 dB and 48 6B were 1.22 dB and 4.14 dB, respectively. This provided anoverall increase in sensitivity of 3.08 dB for the range interval. Similarcalculations can be made for the other STC values using the data in table 9.
The distribution of angel returns as a function of STC attenuation beforesecond-level thresholding is presented in table 10. Data for both single- andmultiple-CPI reports by Doppler filter number are included. Table 11 containscorresponding data after second-level thresholding. Due to the small number ofreports, in this case only the combined filter total is given.
The benefits derived from the above second-level threshold processing can besusmarized as follows. Angels are distributed nonuniformly-in range, azimuth,and Doppler. The adaptive sector/Doppler thresholds are able to eliminateangels selectively without desensitizing in a blanket fashion like STC does.
Second-level thresholding complemented STC rather than replacing it. STCremained useful in preventing ground clutter from exceeding the system dynamicrange and in preventing too large a data load from angels etc. from overloadingthe system. A discussion dealing with the effect of STC on system aircraftdetection capability is presented later in this report.
Data were taken for two cases of second-level thresholding in weather.Figure 15 shows the plan position indicator (PPI) presentation for both cases.Corresponding to figure 15, table 12 shows the effect of weather on the levelof the second-level thresholds throughout the radar coverage area. Table 13gives the distribution of the data iong the Individual Dcppler filters.Linear polarization was used throughout the WTD testing.
Data for the first case were recorded during the passage of a weather frontin April of 1975. The front passed through the radar coverage area at approxi-mately 60 knots velocity. As can be determined from table 13. this resulted in
15

TABLE 9. PERCENTAGE OF 128 THRESHOLDS IN EACH 4-NMl RANGE INTERVALWITHIN A GIVEN STRENGTH RANGE DURING ANGEL ACTIVITY FORFOUR VALUES OF STC
Range (nmi)
Strength(dB) 0-4 4-8 8-12 12-16 STC
0 56 75 86 880-3 4 8 13 8 54 dB3-6 11 7 36-9 13 9 1 1 (Maximum Extent9-12 12 1 12.25 nmi)
12-15 215-18 118-21 1
0 29 42 77 820-3 9 19 6 93-6 11 7 5 36-9 9 13 8 39-12 12 8 3 212-IS 6 3 1 115-18 13 8 48 dB18-21 321-24 3 (Maximum Extent24-27 4 8.56 rnti)27-30 1
0 23 31 70 81.0-3 5 13 16 83-6 7 14 6 66--9 11 8 2 2 42 dB9-12 9 8 3 2
12-15 8 9 3 1 (Maximum Extent15-18 12 8 6.0 nmi)18-21 10 521-24 6 324-27 7 127-30 2
0 18 24 64 790-3 8 14 19 73-6 5 14 9 66-9 9 9 4 7 36 dB9-12 11 11 1 1
12-15 8 8 1 (Maximum Extent15-18 11 10 2 4.31 nmi)18-21 13 421-24 10 424-27 5 227-30 2
16
.,c ; • ; .. . --... ---- --- _ _, - --

r4J N- N NVL .9-
(14 IT cn C% n m H00 :3 u
s 0% 0F-4
bl 1-4-I P- r-4 (A %D 00 ON00 -4 009- VP
c en C'T. en N N. NT its wl C
4-4 z- 4)u
z.9- (E4 M 9-4 -4 I "1 59- 14
0 '0.
N N Tc 414 N4 4 -
.4 E4
w) L. 1- 40 1 1,-
-4 P--4
000q 0-4 V
00 cn 4
0 0
%4m 0N..4O44~~ a, C-L4 I-
0- w -I r-4Un
o- -44
.4 0 L)
4) 04
" "4 N N H "4r-4 -4 Q -4
'P-4
0 r49- N0C45f en-; 0 0
o ~4ow i
-t I4~17

%D fcn 0 eq cn t IT H1 40
Ito ~00 fO~O
o~~L O-0-4 N~ r-DC 0 0
cy o
I A O C4en -t r%- % 4
H ~n '
I -4 ~ ~ 0~-'-C.c00
-H _ 10 I i NN.ý! ~ ~ U N- tNN 9 .n- 4 ý 9 ý- r i
U>
o-4 04% IJ N ( 14 ý1 ý C 1 ý ý ýC-4 Il *.-4. 4.0 .. .. 0% a' .nr 0k T0 0 4 D % :
0 M~ -4
z N .- r- .- V 4 4 ** 4 .
ý--4
N 0
N r-4 N .- IV-4 -4 --4
Go -4 -4 v-4P-4 P4-4 -4
~I %Tr -4 Mr4ýN4000cle - n-40m ' ý D00
%n CO v4 -*tl,- 0 4 LM 00 9-4 -,t r-. 0C"NN NO 0%NP-4
181

TABLE 13. AVERAGE NUMBER OF SINGLE- AND MULTIPLE-CPI RETURNS FROM EACH MTDDOPPLER FILTER FOR ONE ANTENNA SCAN DURING WEATHER ACTIVITY
Case 1
Filter Single MultipleNumber CPI CPI's
0 97.0 17.41 10.6 2.82 27.4 1.83 26.2 3.04 32.4 5.85 27.4 5.86 33.4 6.47 20.6 4.2
Total 275 47.2
Case 2
Filter Single MultipleNumber CPI CPI's
0 32.2 3.61 13.2 5.62 44.0 5.83 56.2 4.64 52.0 9.45 50.8 6.66 38.8 6.47 12.6 3.4
Total 299.8 45.4
19
•. ~ ~ ~ ~ 7 ",r: ,• • ,'•••!-•• 17...7q TrI.. •_m-

a large number of false alarms from the zero Doppler filter. The large groupof false tracks shown in figure 15(a) centered at approximately 20 nmi and1200 correspocad to the front leading edge. Due to the high velocity of thefront, the clutter map was unable to adapt in time, resulting in the falsealarms shown. The corresponding case 1 data in table 12 show a high averagethreshold level (compared to data in table 7), while table 13 shows that thedata were fairly evenly distributed among the seven nonzero Doppler filters.The results of this thresholding can be seen in figures 15(a) and 15(b) whichshow a loss of aircraft tracks with thresholding. A study of the trac:ks lostwhen the thresholds were applied showed that they were primarily from single-CPI (weak) targets.
The second weather case Is shown in figures 15(c) and 15(d). The weatherin this case was accompanied by high winds and extended over the entiredisplay area. The MTD hardware thresholding eliminated the weather exceptfor the two small areas of false tracks shown. The second-level thresholdingfurther reduced the number of false tracks as shown. In this case, table 13shows that data were concentrated more toward the central Doppler filters.
Taken together, the data show that each weather system had unique characteris-tics. The combined MTD and second-level thresholding were successful ineliminating false alarms and tracks. System desensitization was experienced inareas in which weather was present.
Due to the inability of the clutter map to adapt to fast moving weather whichresulted in excessive false alarms from the zero velocity filter, no trackinitiation was allowed on zero velocity filter single-CPI reports.
The effect of second-level thresholding on target detectioi, in the clear isshown in figure 16. Note that there was only a small amount of additionaltarget loss. Thus, the level of the thresholds in a clutter environment andthe resulting loss of aircraft detection shown previously were caused by theclutter. That is, the thresholds did not rise appzeciably as the result ofaircraft signals. This compares favorably with the data given in table 7.
SYSTEM STC. Figure 17 shows the STC curvet; used with the ASR-7 and the FPS 18/MTD systems. Range to the minus fourth power curves (R- 4 ) were uscd to bestmatch ground-clutter-receired signal characteristics. For thz NAFEC tests, theFPS-18/MTD curve shown provided a ccmpromise between elimination of angelclutter and detection of small aircraft near the antenna cone of silence.The ASR-7 curve was tailored to match the FPS-le/MTD curve as closely aspossible for normalization of system detection capabilities.
The ASR-7 STC PIN diode had a maximum attenuation of A0 dB as shown in figure 17.A typical FAA CSS (cross sectional sensitivity)-! curve is also shown forreference.
Figure 18 shows the manner in which the MTD STC was implemented. The desiredrange zero STC attenuation was preset with switches in the MTD timing section.From this maximum attenuation value shown on ýi-ure 18, the Lttenuaticn wasdecreased as an R- 4 function in 1.5-dB steps reaching zero decibels at therange shown.
20
___.1 __ _a

Investigation determined that the HTD receiv'.r/processoz. ;as linear throughoutits dynamic range. The STC valuzs shown ini figure 17 were used tnroughout the-.onparative system testing.
Flight testing was performed to determine the effect of STC attenuation onaircraft detection. For this test, t he flight test aircraft was flown on aradial course at 4,000 and 8,000 feet. "lhese tests were conducted .ear thecone of silence as this antenna radiation region is most affected ,, STC. Theresulting target strength as a function of STC and range is shcwn in figure 19.The data shown are smooth curve fits to the data collected. The 54-dB testswere made using a Piper Commanche aircraft. All, other runc were made usiag aPiper Arrow. For comparison purposes, the test target strength level requiredfor a 50-percent Pd (from the Pd tests discussed subsequently) is included infigure 19. From this, it can be seen in figure 19 that at an 8,000-feet alti-tude, an STC value of 60 dB exceeds the maximum value that could be expected toprovide a 50,.percent Pd. By extrapolating the. data shcwn, it can be determinedLhat at higher altitudes, the desired Pd could be maintained only by loweringthe STC attenuation.
Some difficulty was experiencel in getting the flight test aircraft to flyexactly o-ver the tndcr site, bot'i on the inbound and outbound radials. Sincethe data shown were extracted in a wedge centered on the desired radial (toavoid overloading the ARTS III computer), any signlficant deviation from anexactly radial course resulted in loss of close-in data. Therefore, theminimum ranges shown are not reliable indicators of setiaitivity, Rather, therelative levels of the target strength are intended to show performance.
PROBABILITY OF DEIECTION "PA. The Pd for the ASR-7/RVD-4 and FPS-I8/MTDsystems in thermal noise was determined using the TFAST test target generator(TTG). Each system was operated with a 10-5 Pfa. One hundred and twenty eightRF antenna scan-modulated test targeta (32 in each of 4 concentric rings) weremoved in range (TTG velocity) and azimuth (I ACP) each antenna revolution.These targets were varied in amplit.Ae usiig a precision HIP-S382C RF attenuatorfrom below noise level to the point where lO0-percent Pd wes obtained in 1-dBsteps. Fifteen scans of data were taken for eich ste9. Pulse widths for bothsystems were set to 1.0 microsecond (us). The TTG runlegth set to 1.0 micro-second (ps). The WO, runlength (antenna beam shaped) was set to equal the two-way 3-dB antenna (ASR-5) runlength at the pulse repetition rate of the radarsyuzem used. Both systems were operated on dummy load. The TTG variable•':elocity control wes wet to provide near-optimum speed targets.
The following calibration method was used to determine the signal-squal-to-noise point for both wystemp. First, the receiver IF noise level was measureduming an rms voltmeter. Then, a TTG RF continuous wave (CW) signal wasintroduced which provided a sigual-plus-noi. & power level 3 dB above that ofthe noire alone. This TTG signal output level corresponded to a sign"I-!o-noise ratio of approximately unity.
The nmber of lOP radar taraet reports (prior to tracking) for each systemwas used to determine its Pdo The resultiag data are presented in figure 20.For the ASR-7/RVD-4, data for the normal receiver are preseixted. For the MED
21

system, the curve for detection in two CPI's is included to show the addedsignal strength required for multiple CPI detection. Since the test targetswere moving in a spiral fashion, possible range and azimuth gate-splittinglosses are included in the data shown in figure 20. Separate tests were madeto isolate these factors so that the data shown could be compared totheoretically predicted values. For the MTD-equipped system, a test targetwas moved in range only and then azimuth only, and the resulting variation in
Pd was measured. It was thus determined that an average Pd loss of I dB wasexperienced due to range gate-splitting losses, and an average 1.5-dB loss wasexperienced due to azimuth splitting. These azimuth-splitting losses wereascribed to the following factor. The MTD processing algorithms did notutilize all the possible data. That is, only 3,840 pulse repetition periods(PRP's) (480 CPI's x 8 DFT pulses per CPI) out of a possible 5,828 (1,240average PRF x 4.70 seconds per antenna scan) were directly processed. Thenonused PRP information between CPI pairs required for antenna/processorsynchronization (to compensate for antenna wind loading) and the two pulseseacL CPI required to "charge" the three-pulse canceller resulted in the abovereduction in data processed.
Separate tests of the ASR-7/RVD-4 system (reference 2) determined that itexperienced a 2.0-dB loss due to range gate-splitting losses.
The IF passbands of both systems were considerably wider than an optimumfilter. From thc literature, an optimum filter bandwidth for a I- s pulsewould be approximately 1.2 megahertz (Milz). The FPS-18/MTD and ASR-7 band-widths were measured to be 3.65 and 2.75 MHz, respectively. Each IF wasfollowed by a narrow video bandwidth which increased the signal energy tonoise power ratio to approximate a matched filter. A collapsing loss(reference 3) may have resulted from the instrumentation of this type offiltering, since the 50-percent Pd points for both systems were approximately1.0 dB higher than expected from theoretical Pd data (reference 4) when theabove range and azimuth losses were considered.
VELOCITY RESPONSE. The velccity response of the MTD filters individually andcombined are shown in figures 21 through 25. These responses were determinedby meaauring the TTG signal strength (variable velocity ring-around target)necessary to obtain a 50-percent probability of detection. The probability ofdetection waa measured at the maintenance DEDS indicator using numericsgenerated by the NOVA minicomputer.
Figure 21 shows the velocity response of the nonzero filters. Since filters 1,2, and 3 are mirrot images of filters 7, 6, and 5, they are not included, butcan be deduced from the data shown. The effect of the three-pulse canceller onthe shape of the individual filters and their sidelobes can be seen. Also notethat the low-velocity filter sidelobes were highest in 4mplitude. This wascaused by the effect of the three-pulse canceller preceding the DFT. Theseeidelobes which extended thioughout the Doppler range limited the amount ofsubweather visibility obtainable. For instance, an aircraft signal with aradial velocity of 110 knots would have its maximum response in the number 7filter. it would, however, have to compete against any weather entering the
filter via its low-velocity sidelobes shown. The number 7 filter sidelobe at
22
. .
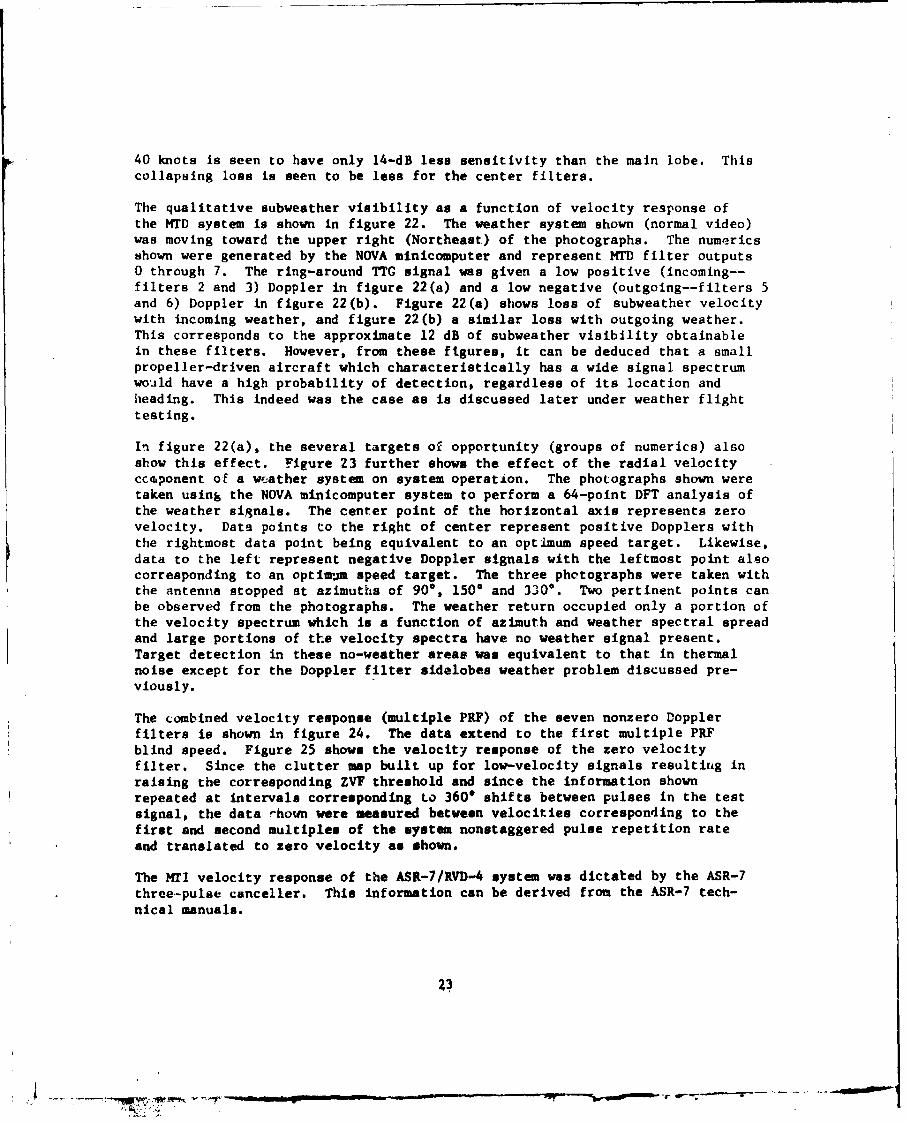
40 knots is seen to have only 14-dB less sensitivity than the main lobe. Thiscollapsing loss is seen to be less for the center filters.
The qualitative subweather visibility as a function of velocity response ofthe MTD system is shown in figure 22. The weather system shown (normal video)was moving toward the upper right (Northeast) of the photographs. The numericsshown were generated by the NOVA minicomputer and represent MTD filter outputs0 through 7. The ring-around TTG signal was given a low positive (incoming--filters 2 and 3) Doppler in figure 22(a) and a low negative (outgoing--filters 5and 6) Doppler in figure 22(b). Figure 22(a) shows loss of subweather velocitywith incoming weather, and figure 22(b) a similar loss with outgoing weather.This corresponds to the approximate 12 dB of subweather visibility obtainablein these filters. However, from these figures, it can be deduced that a smallpropeller-driven aircraft which characteristically has a wide signal spectrumwould have a high probability of detection, regardless of its location andheading. This indeed was the case as is discussed later under weather flighttesting.
In figure 22(a), the several targets of opportunity (groups of numerics) alsoshow this effect. Figure 23 further shows the effect of the radial velocityccaponent of a weather system on system operation. The photographs shown weretaken using the NOVA minicomputer system to perform a 64-point DFT analysis ofthe weather signals. The center point of the horizontal axis represents zerovelocity. Data points to the right of center represent positive Dopplers withthe rightmost data point being equivalent to an optimum speed target. Likewise,data to the left represent negative Doppler signals with the leftmost point alsocorresponding to an optimjm speed target. The three photographs were taken withthe antenna stopped at azimuths of 90, 150* and 330*. Two pertinent points canbe observed from the photographs. The weather return occupied only a portion ofthe velocity spectrum which is a function of azimuth and weather spectral spreadand large portions of the velocity spectra have no weather signal present.Target detection in these no-weather areas was equivalent to that in thermalnoise except for the Doppler filter sidelobes weather problem discussed pre-viously.
The combined velocity response (multiple PRF) of the seven nonzero Dopplerfilters is shown in figure 24. The data extend to the first multiple PRFblind speed. Figure 25 shows the velocity response of the zero velocityfilter. Since the clutter map built up for low-velocity signals resultinLg inraising the corresponding ZVF threshold and since the information shownrepeated at intervals corresponding to 360* shifts between pulses in the testsignal, the data rhown were measured between velocities corresponding to thefirst and second multiples of the system nonstaggered pulse repetition rateand translated to zero velocity an shown.
The MTI velocity response of the ASR-7/RVD-4 system was dictated by the ASR-7three-pulse canceller. This information can be derived from the ASR-7 tech-nical manuals.
23
4 -- -[.- ~ m r- -

SUBCLUTTER VISIBILITY (SCV). The comparative subclutter visibilities of thetwo systems are shown in figure 26. SCV was determined by exactly super-imposing a modulated (antenna beam shaped) TTG test target of the correctsystem runlength over isolated fixed-clutter echoes of known amplitude. Then,the test signal was adjusted in amplitude until the desired probability ofdetection was obtained. The resulting difference in amplitude between theclutter echoes and the test signal was defined as the system SCV. The MTDSCV was measured at the maintenance DEDS indicator using the NOVA minicomputer.The RVD-4 SCV was measured usiing Lhe ARTS III equipment. For this test, aclutter echo with a strength of 42 dB with respect to receiver noise was used.
When the clutter-received echo strength exceeded the dynamic range at the A/Dconverters (approximately 42 dB), splattering resulted. When this occurred,the HTD outputted spurious Doppler information (nonzero velocity) resulting infalse targets. To overcome this problem, the COHO input to the I and Q phasedetectors was attenuated. The resulting conversion loss was utilized to main-tain clutter echoes within the dynamic range capabilities of the MTD system.This mode of operation resulted in loss of SCV in conjunction with some clutterechoes. This phenomenon is discussed later in this report under ASR-5 andASR-7 testing. As shown, several test target velocities were used to betterdefine the relative SCV capabilities. The HTD zero-velocity filter providedinterclutter and superclutter visibility but not subclutter visibility.This resulted in the loss of SCV at low velocities.
TARGET DETECTION ACCURACY. To determine the relative capabilities of theASR-7/RVD-4 and FPS-18/MTD systems to provide accurate target location data inboth range and azimuth, the following tests and analyses were performed.
Target report data (ARTS III before tracking) were collected for both systemsusing the same targets of opportunity and identical scan numbers. Thirty scansof data were analyzed for each 30 aircraft tracks. Nearly straight trackswere chosen. The data were recorded on magnetic tape for analysis. A varietyof track locations and headings were used.
A least squares fit of the data to a fifth-order polynomial was chosen a6 thecriterion for accuracy. That is, the deviation of the data from the polynomialcurve determinated its smoothness and hence accuracy,
The equation of the polynomial used was:
Y -o + B1 X + B2 X2 + -------------.. +Bk Xk
Where:
cL, B'- the coefficients of the polynomialX - the scan numberY - range or azimuth
24

The deviation was calculated as follows:
Ns E (Yk -) 2
K-iN-i
Where:
S - -tandard deviationN - 7imber of data pointsK - degree of polynomial
Yk - observee data
Y - mean value of observed data
The deviations determined by computer analysis using the above equations areplotted in figures 27 and 28.
Subsequent to the comparison accuracy tests described above, an additionaleffort was undertaken to determine if additional MTD range accuracy could beobtained by employing a range-centroiding technique similar to that used forazimuth centroiding. The centroiding was performed according to the equation:
NR(centroid) - E Rj S
J-i
where R and S are the ranges and strengths of the signals in each CPI makingup the target report.
Seventeen aircraft tracks wets analyzed using the techniques described above.The results of this test are shown in figure 27.
SYSTEM FLIGHT TESTS.
Results from five areas of comparative performance flight testing are presentedbelow. These areas are system seneitivity, tangential target deLection inclutter, subclutter visibility, subweather visibility, and target resolution.Blip/scan information for both systems was colleLted at two points in theARTS III ADTL Program. The data collected at the first point were radarreports from the output of the previously mentioned RIP po:tion of theprogram. The second data collection point was at the output of the ADTL program(tracking output).
Both radars were operated with similar A-4 STC curves extending out to 12.25 nmi.The transmitter/receiver loop gains of the two systems were norw-lized based ontheir respective receiver noise figures and average trenswitter powers.
25
• -- 7 .---

Two factors should be considered in Lhe normalization of the FPS-18/MTD andthe ASR-7/RVD-4. Firstly, the MTD system, due to its longer runleng'" (21.53hits/3-dB one-wny antenna beatwidth vers, s 17.29 hits for the ASR-7/RVD-4)would have an advantage in detection capability. Secondly, the ASR-7/RVD-4system would have, at the same time, an offsetting advantage due to its higherenergy in each pulse processed. This is, with its lower pulse repetitionfrequency, each transmitted pulse of the ASR-7 had to contain proportionatelymore energy to provide the necessary average power for equalizing the transmit/receive loop gains of the two systems. Equalizing the loop gains likewisecompensated for the difference in transmitter pulse widths between the twosystems. The FPS-18 and ASR-7 radars operate with 1.O-ps and 0.833-ps trans-mitted pulse widths, respectively.
The average power and noise figure measuremento were made at the diplexerantenna port to eliminate differences in waveguide losses.
SENSITIVITY. Sensitivity flight testing was conducted to determine thecomparative perfermance of the two radar/processor systems in detection of alow-flying small aircraft. This was done at the outer limit of radar coveragein a clutter-free environment. To accomplish this, a Piper Arrow test aircraftwas orbited between 20 and 22 nmi in range, first at an altitude of 1,000 feet,and then at 1,500 feet. The ASR-7/RVD-4 system used log normal video duringthis test. Data from 365 antenna scans were analyzed yielding the followingblip scan ratios:
ASR-7/RVD-4 Radar Reports 75 percentFPS-18/;4TD Radar Rep.,rts 73 percent
These data show that approximately the same blip/scan ratios were obtainedfrom the two sensors. Their approximately equal performance in this test wasexpected both from the probability of detection tests discussed previously andfrom theoretical considerationa of detection probability as a function oftarget runlength and probability of false alarm. Particularly important, itfollows that the normalization of the two systems to achieve equal transmitter/receiver loop gain was effective.
Therefore in the subsequent flight tests described below, any disparitybetween these systems was attributed to the relative performance of the systemsin a clutter environment. Figures 29 and 30 illustrate the tracker output ofthe two systems during the sensitivity tests. It is important to note thatthese photographs and subsequent photographs represent radar-only tracking.These pictures and subsequent photos were obtained from data extraction tapes.These comparative photographs were made from the same flight test segmentsand dieplay every scan of information for 50 scans. The symbol "A" on thephotographs represents a radar track output. Other aircraft tracks shown arefrom targets of opportunity.
TANGENTIAL IARGET DETECTION OVER CLIrTTU. Tangential target detection capa-bility over clutter was determined by making tangential test flights over theAtlantic City area. The flight test aircraft (Piper Arrow) was flown atan altitude of 1,000 feet. The clutter is shown centered at 7.5 mii and 145"
26

in figure 31. Maximum clutter peaks in this area are approximately 45 dB abovenoise level. For the purpose of this test, a tangential target was definedas one with a radial velocity of less than 30 knots. Thirty knots representsapproximately the knee of SCV curve ir figure 26 for the MTD system. A totalof 10 runs over the clutter were analyzed, resulting in the following blip/scanratios.
ASR-7/RVD-4 Radar Reports 50 percentFPS-18/MTD Radar Reports 96 percentASR-7/RVD-4 Tracking Outputs 33 percentFPS-18/MTD Tracking Outputs 96 percent
Tracking specifications for both systems for uncontrolled tracks are the same;i.e., three scans for automatic track initiation and one more for display withautomatic track drop after loss of detection for three consecutive scans.Figures 32 and 33 illustrate 50 scans of tracker outputs during one the tangen-tial detection runs. Radial velocities exceeding 30 knots are also shown infigures. The test aircraft was broadside to the radar during these runs withan average quantized MfrD signal strength of 37 dB above noise level. Therefore,this test was not used for SCV determination.
SUBCLUTTER VISIBILITY. Subclutrer visibility was determined by having a flighttest aircraft (Piper Arrow) perform a holding pattern at the Northeast end ofAtlantic City (figure 34). In order to show any SCV improvenent of the FPS-18/MIT) system relative to the ASR-7/RVD-4 system in ground clutter, it can bedetermined from figure 26 that a minimum of 20 to 25 dB of ground clutter isrequired. Figure 34 shows the level of ground clutter in the NAFEC/Atlantic Cityarea after 25 dB attenuation was added to the receiver front end. Figure 34depicts radar reports (a "+" symbol is used) from the test aircraft for 40 scans.The flight test aircraft made 16 separate runs over a piece of ground clutterapproximately 1/3 nmi by 3/4 nmi, resulting in the following blip/scan ratios:
ASR-7/RVD-4 Radar Reports 38 percentFPS-'18!/TD Radar Reports 95 percent
The maximum SCV capabilities of the respective systems can be ascertained fromfigure 26.
SUbWEA.THER VISIBILITY. Subweather visibility of the two systems was comparedby vectoring a flight test aircraft (Piper Arrow) through areas of precipita-tion and comparing the resulting blip/scan ratios. The weather used in thistest consisted of scattered high-asplitude cells (up to 40 dB above recjivernoise level).
The aircraft was slow moving and therefore did not provide optimum testing ofthe MTD's Doppler filtering capability. Figure 35 shows the' PPI display ofthe weather. The flight test aircraft was vectored eastbound and then west•-bound through the weather. Three hundred and ten scans of information wereanalyzed with the following blip/scab ratios reaulting:
27

ASR-7/RVD-4 Radar Reports 41 percentFPS-18/HTD Radar Reports 96 percentASR-7/RVD-4 Tracking Outputs 35 percentFPS-18/rTD Tracking Outputs 96 percent
Figures 36 and 37 illustrate part of the flight test. Note the false tracksfrom the RVD-4 system in the weather.
Blip/scan ratios for hundreds of scans of data necessarily contained data whenthe aircraft was in light weather or entirely out of the weather. This occursat the weather system fringe and at areas of light weather within the system.Blip/scan ratios from any actual weather system might therefore be expected tobe higher than would be obtained from a theoretical uniform intensity, large--area system. To show this effect, a small portion (51 scans) of data repre-senting one run through a high-amplitude weather cell was analyzed. The plotof this run is shown in figure 38. Blip/scan ratios for the data shown are:
FPS-18/MTD Radar Reports 94 percentASR-7/RVD-4 Radar Reports 22 percent
The average MrD target signal (ARTS III target report) strength for the51 scans shown was 22 dB above noise level.
The above data show that, as the test was made more stringent, no additionalloss in MTD Pd was experien:ed. The ASR-7/RVD-4, however, experienced asignificant additional loss. Note, that this loss was complete at the center(high-level) portion of the weather cell.
AIRCRAFT RESOLUTION. The ability of the two systems to resolve signalb was afunction of the radar parameters, processor capabilities, and software manage-menL of the data in the ARTS III equipment.
The transmitted pulse widths of 1.0 ps and 0.833 us (for the FPS-18 and ASR-7radars) limit the minimum range separation capabilities to 0.081 nmi and0.067 nmi, respectively. The ASR-5 antenna used by both systems had a one-way3-dB beamwidth of 1.330.
Each CPI used in the HIM processor subtended 0.6180 in azimuth. This contri-buted to increasing coarseness of azimuth data. The 1/16-ami range incrementsused in both processors corresponded to 0.0625-nmi minimum resolution.
The processing ailorithms used in the MTD ARTS III RIP consolidated data inadjacent range bins into a single target report, making the minimum possiblerange resolution 0.125 mi. Likewise data in adjacent CPI's were consolidateditto a target report.
The resolution capabilities of the two systems were tested by flying two flighttest aircraft (a Piper Arrow and an Aero Commander) in a series of crossingmaneuvers while proceeding radially, tangentially, and obliquely with respectto the radar site.
28

The resulting data were analyzed in two ways. First, data from 15 aircraftcrossinga were analyzed from computer prictouts to determine the minimunk rangeresulutien when the azimuth separation was zero, and conversely, the minimumazimuth resolution when the range separation was zero. The minimum range andazimuth separations obtained for the MTD were 0.125 nmi and 2.2%, respectively.
This agrees closely with predictions based on analysis of the parameters givenabove; the ASR-7/RVD-4 system provided minimum range and azimuth separationsof 0.125 nmi and 2,5%, respectively.
The second analysis was performed by making computer plots (in X-Y coordinates)of the flight tests and measuring the minimum resolution obtained before andafter each aircraft crossing. For the MTD. the average minimum resolution for77 cases was 0.25 nmi. For the ASR-7/RVD-4 system the average minimum resolu-tion for 30 cases was 0.44 nul. Fewer casei were obtained for the ASR-7/RVD-4system, since its poorer resolution capability prevented its distinguishing allaircraft separations and mergings.
Figure 39 shows the resulting data ou the capabilities of the two systems toprovide resolution as a function of combined range and azimuth separation(X-Y coordinates).
The qualitative resolution capabilities of the two systems are shown infigure 40. The photolraphs show simultaneous outputs of both systems. Thedata shown are radar reports from the ARTS III system before tracking.
Additional loso of tesolution was experienced in the ARTS III tracker due tothe size of the primary tracker window. Figure 40 (sheets 7 and 8) show thetracker (radar only) output corresponding to the radar reports shown infigure 40 :veers 5 and 6). This indicates that further improvements in thetracker a1D�oitnms and possibly more use of available MTD information (e.g.,DoTpler/scrjitngth) are required to make full use of the radar data inputted totiie tracke ".
ASR-5 AND ASR-7 MTD COMPATIBILITY TESTS.
STABILITY 'CESTS. The MTD processor was also operated with the ASR-5 and ASR-7radars located in the TFAST. These tests were made to determine if the radarsprovided operacion stable enough for an NTD system. In these tests, the ASR-5was operated with magnetron tuning from a solid state fixed-frequency STALObeing tested for field tue. Likewise, the ASR-7 had a tuned magnetron utilizingits own STALO operating at a fixed frequency. The timing of both radars wereslaved to the MTD. Otherwise. both systems were unmodified. No attempt wasmade to optimize the two radars operation for this test. Preamplifier outputsfrom the radars were used an Inputs to the MTD and to the frequency stabilitytest circuitry described below.
Comparative stability photographs of the FPS-18, ASR-5, and ASR-7 radars areshown in figure 41. These photographs were t-tken using the Single Gate Proces-sor (SGP) Fast Fourier Transform (FIT) anal! routine furnished with the WTDsoftware for the NOVA maintenance/test minicLputer. The resulting information
29
,,7

was then presented on an Imlac graphics display for analysis and photographing.To make these photographs, a fixed target was spotlighted with the antenna beam,and an SGP analysis wac performed on its received signal. The center of thehorizontal scale in each photograph represents zero frequency. NegativeDopplers are to the left of zero, and positive Doppiers are to the right. The64 segments of the horizontal axis mark the 64 outputs of the FFT (64-point).These 64 points cover the unambiguous Doppler range of the three radars. Thus,zero Doppler is at the center, and optimum Doppler at both edges of the lisplay.The trequencies of responses seen can be determined by interpolation. Thefigure of merit in this test is the difference in amplitude between the desiredfixed-target zero-Doppler response and any spurious frequencies generated inthe radar systems. For the engineering mod. I MTD at NAFEC, these spuriousfrequency components must be at least 42 dB (the MTD processor dynamic range)below the zero-Doppler signal to avoid being outputted as targets. The low-amplitude responses in each photograph represent system noise. Each of thethree radars provided operation stable enough for MTD processing. A descriptionof the ASR-5 and ASP-7 modifications necessary for MTD operation are given '.nappendix D.
SUBCLUTTER VISIBILITY. The SCV capabilities of the ASR-5 and ASR-7 radarswith the MTD were also tested. In preparation for these tests, the effect oflimiting the received radar information prior to digitizing was investigated.Two types of limiting were involved. The first was implemented by attenuatingthe COHO signal to the phase detectors. The resulting conversion loss wasutilized to maintain (limit) strong signals withL. the dynamic range of theMTD system. This was done to avoid limiting in the A/D's, which resulted ingeneration of spurikus frequencies causing false Doppler information to beoutputted by the MT)D.
Figure 42 shows typical conversion losses caused by attenuation of the COHOsignal. Note how strong signals are attenuated (limited) due to lack ofsufficient COHO signal. Typical corresponding SCV losses for severalclutter levels are shown in figure 43. The SCV was measured using the TTGas described previously under comparative SCV testing. These curves show thatsome optimization of the phase detector input signal levels can be performed.Thus, in the MTD system tested, COHO attenuation was used to keep clutterechoes within the system dynamic range with nominal sacrifice of SCV. WithoutCOHIO attenuation, false alarms were generated by large-amplitude clutter echoes.Note that SCV in excess of the systems dynamic range wae obtained from largeclutter signals. In conjunction with this phenomenon, the dynamic range of theIF amplifier was investigated. First, the linear dynamic range at the ASR-7preamplifier output was measured to be at least 75 dB. Therefore, any nonlinear-ities were attributed to the IF amplifier.
The dynamic range of the IF amplifier was determined by viewing its output onan oscillosccpe when large-amplitude signals were inputted to it. Signalsaturation occurred at 45 dB above noise level. Strong signals were limited,therefore, in the IF amplifier.
30
This was the second type of limiting. Thus, the individual effects on SCV ofCOHO attenuation and IF limiting on large-amplitude clutter (greater than thesystem dynamic range) were not defined. The combination of COHO attenuationand IF limiting did not generate false Doppler informati.,. and did maintainsignals within the system's dynamic range capabilities. For example, two casesof large-amplitude clutter were investigated. With the 50-dB clutter depictedin figure 43, an SCV of 45 dB was obtainable (with low COHO attenuation). Inthe second case, a 62-dB clutter echo yielded an SCV of 47 dB.
The SCV capabilities uf the two radars for pertinent velocities are shown infigure 44. The curves shown compare closely with those in figure 26 of theFPS-18/MTD combination. Thus, the MTD provides approximately a 20-dB improve-ment in SCV compared with conventional MTI systems for each of the radarstested.
31

SUMMARY OF RESULTS
1. The MTD system was operated with a I0-5 false alarm rate. This corres-ponded to a 6-mV receiver noise level and a 42-dB receiver dynamic range.This false alarm rate produced approximately 30 thermal false alarms per scan.
2. The MTD interference eliminator removed RFI in a clutter-free environment.When clutter was present, the MTD interference elimination algorithm did notfunction acceptably. In this instance, an ARTS III RIP interference elimina-tion algorithm was used to remove the remaining interference.
3. With an R- 4 STC curve extending to 12 nmi, the number of MTD reports dueto angels on occasion exceeded 1,300 per scan. Second-level thresholdingin the ARTS III RIP was developed which prevented these angel reports fromcausin& false tracks.
4. Without second-level thresholding, the ARTS III system was unable toprocess heavy angel clutter data outputted by the MTD.
5. Angel clutter extended throughout the MTD Doppler range, appearing asboth single-and multiple-CPI reports.
6. Second-level thresholding in an angel environment resulted in a loss ofsensitivity proportional to the amount of angel clutter present. Since thesecond-level threshoiding adapted to the environment, it was more selectivethan STC and hence allowed greater overall sensitivity than STC.
8. Weather systems tested with the MTD on occasion extended throughout theunambiguous Doppler range during an antenna scan. The MTD thresholdq eliminatedalmost all of the resulting clutter information. However, sharp leading andtrailing edge discontinuities resulted in false targets being outputted bythe MTD. This was particularly so for the zero-velocity filter, due to itsunique implementation using the clutter map. Most of the false target infor-mation was from single CPI's and was fairly evenly distributed in Doppler.Sccond-level thresholding in the ARTS III was developed which eliminatedvirtually all remaining false tracks due to weather phenomena.
9. A loss of system sensitivity was experienced due to the MTD hardware andthe second-level thresholding in weather. This loss was a function of weatheramplitude velocity, and spectral spread.
10. Second-level thresholding resulted in no appreciable loss of systemsensitivity when operating in a clutter-free environment.
11. Flight tests showed that at 8,000 feet at a range of between 3 nni and 6 nmi,54 dB was the maximum STC value which would allow a 50-percent Pd. This factprecluded use of large-attenuation STC curves to remove all angel clutter.
32
~i

12, With a 1,0- a test signal moving in range and azimuth, the FPS-18/MTDand ASR-7/RVD-4 systems provided 50-percent Pd at 5.2 dB and 5.7 dB abovereceiver noise level, respectively.
13. The MTD DFT velocity filtering scheme accurately separated informationinto eight Doppler filters with target strength numbers for each filter.This Doppler and strength information enabled subsequent selective processingand thresholding of targets and clutter on the basis of strength and radialvelocity.
14. The first multiple PRF blind speed occurred at 594 knots.
15. Weather signals typically occupied only a portion of the unambiguousDoppler range. The portion occupied was a function of the radial velocityof the weather as determined by its location and direction with respect tothe radar and by the radar pulse repetition frequency.
16. The MTD provided a minimum of 12 dB of subweather visibility. This lowerlimit was imposed by sidelobes frow the combined three-pulse canceller andDFT filtering. The wide spectra of propeller aircraft returns enabled smallaircraft detection in several DFT filters (some with possible lower levelweather signals) which mitigated the above limitation.
17. The MTD provided a 20-dB improvement in SCV over the ASR-7/RVD-4 system.
18. The MTD zero velocity filter provided superclutter visibility and inter-clutter visibility for low-velocity targets.
19. The MTD system, as delivered to NAFEC, provided better range and azimuthaccuracy than the ASR-7/RVD-4 system.
20. Range centroiding (developed at NAFEC) In the ARTS III RIP provided afurther improvement in accuracy.
21. The MTD and ASR-7/RVD-4 systems provided equal target detection capabili-ties in the clear during controlled aircraft flight tests.
22. The MTD system provided superclutter visibility for tangential targetsduring controlled aircraft flight tests. In tangential segments (within30 Vnots radial velocity of the tangential point), the MTD and ASR-7/RVD-4systems provided Pd's of 96 and 33 percent, respectively.
23. Controlled aircraft subclutter visibility flight tests of the MTD andASR-7/RVD-4 systems produced Pd'S of 95 and 39 percent, respectively.
24. Controlled aircraft subweather visibility flight tests Produced thefollowing Pd's:
ASR-7/RVD-4 Radar Reports 41 percentMTD Radar Reports 96 percentASR-7/RVD-A Tracking Outputs 35 percentMTD Tracking Outputs 96 percent
33
K1

25. The average minimum targe't resolution distances for two flight testaircraft for the ASR-7//VD-4 and HTD systems were 0,44 and 0.25 nmi, respec-tively,
26. The ARTS III tracker was not capable of resolving all the target informa-tion provided by the MTD. The tracker window size was too large for fineresolution.
27. The FPS-18, ASR-7, and ASR-3 (with solid state STALO) radars providedsufficient ntabiltty (greater than 42 dB) for ZITD operation.
28. MTD SCV when operated with ASR-5 and ASR-7 radars was equal to thatobtainabte when operated with the FPS-18 radar.
34
m

CONCLJSIONG
From the results, it was concluded that:
1. The MTD/processor system is superior to the ASR-7/RVD-4 system.
2. The MTP/processor provides data suitable (low false alarm rdte and highprobability of detection) for automated system processing.
3. The combination of MTD and ARTS III processing effectively eliminatesclutter (weather, ground, and angel) and nonsynchronous interference experiencedin the NAFEC environment.
4. Terminal radars in the FAA Inventory are capable with minimal modificationof providing outputs suitable for HTD processing.
35
2

RECOMMENDAT IONS
It is recommended that:
1. The MTD/processor concept be used in all future FAA surveillance radarsystems.
2. A cost benefit analysis be performed to determine desirability ofretrofitting existing FAA surveillance radar systems for MTD operation.
3. Second-generation MTD's be procured for operational tEcsts at selectedfield sites, both terminal and en route.
4. Further work be accomplished to refine ARTS III MTD processing algorithmsto provide optimum false alarm management and use of Doppler information forimproved tracking.
5. Fzrther work be accomplished to determine the best radar system config-uration for MTD operation. Radar equipments and concepts such as circularpolarization, frequency diversity, and the passive horn should be investigated.
36
mo

REFERENCES
1. Prury, William H., Improved MTI Radar Signal Processor, Report No.FAA-RD-74-185 (Lincoln Laboratory Report ATC-39, 1975).
2. Holtz, Martin H. and Wapleborst, Leo J., Test and Evaluation of the RadarProcessing Subsystem of the All Digital Tracking Level System, Report No.FAA-RD-76-197.
3. Barton, D. K., Radar System Analysis, Prentice-Hall, 1964.
4. Skolnik, M. I., Radar Handbook, McGraw-Hill, 1970.
37
•~~~~~771 7.... woo" -. ,-' ..-- ••- -- _

FIUR 1 * KD EQUPMEN
O-NOV iNTEF 38
TEST CNTROLER AN

0 0 0
"0 --
c44
L4IJw 1-4
39
it.-w

I-. I
0:owIu u~.-
1.4cH
:13
MzH
0.
40

i-
45>
15
I..1
414
v- o_ __ - - - - -

424

THRESHOLDS/FILTERS 1 AND ? 12. 81 dBiFILTERS 2 THROUGH 6 11.91 dBFILTER 0 14.8 dB
rU
44
~AA
o 4<
I. <,..u
4:4s
FAS ALRSPR SCAN
i0-6.. loS4 6 1 0 12 14
A/D INPUT NOISE LJEVEL (MILLIVOLTS RMS)
77-29-6
FIGURE 6. NTD TBERIAL FALSE AARM CURVES
43
S ..... •- • " --- •' • .... • " - ,,r' -- , - - -- - . •- - -

FIGURE 7. * ?D INTERFERENCE ELIMINATION
44

Inn[
45
"|,-
Ci[E_
. • H
"•J •'A rl
SI n

In
I- A-4
46

500
400
300
200
w
S100z
z
I 40.40
, 30
S-4 ZO
I 10
0U•
5
4
3
, II I _
1 S 10 15 20 zs 30 35SIGNAL LEVEL ABOVE NOISE (dB) 77-29-10
FIGUUE 10. SCOND-LEVCL THEi3K)LD STREOOG'YH IMUBR AS A YUNCTION OFSIGNAL STREW=
47

z
.1-
ml ,,
48

z
00
49

z
o bo
90
NI
50

boo
a
cn~I
5-4
r 4
51
I Em
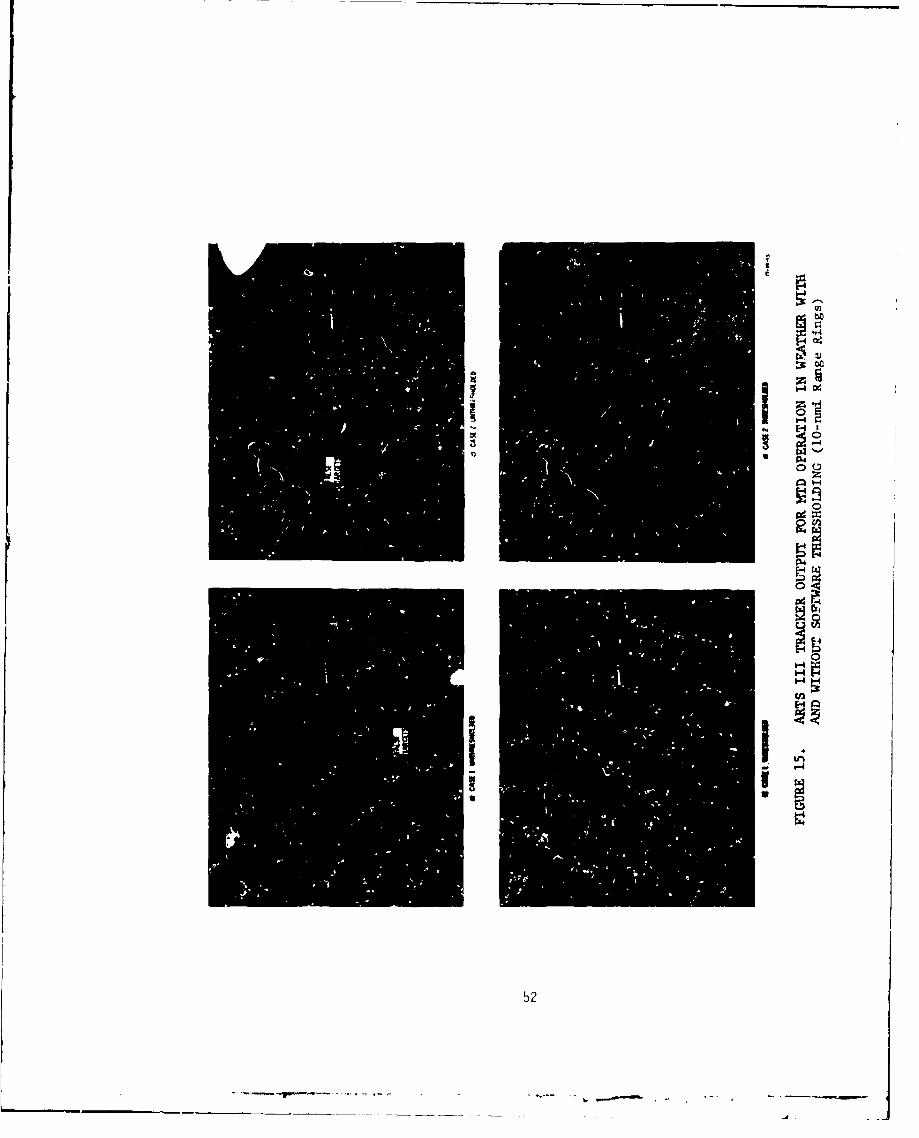
z
1-4
cn
52
52

(a) [P INF1 SWi N 1f)
(bl THRECHOL.DE 0
FIGURE 16. ARTS III TRACKER OUTPUT 11)R MTD OPERATION ON A CLEAR DAYWITH AND WITHOUT SECOND-LEVEL THRESHOLDING, NO TRACKCOASTING (10-nti Range Rings)
53

> 0
Z4,4
0a
, H
040
>4Z2
2 U9
7a 7,l (-
'11. "Fr-

__________________________ ____________ 0- 0
-4
.4
5-r.
c.'LO
o-4
0
<I0
4
j p p p ft.1: 0 0
'.0 1S .4 0
(gP) 1flIVA DJS OEEZ 1DMV�55

100 - 8,0000 FEET ALTITUDE RUNS
4,000 FEET ALTITUDE RUNSSI at00 Z
50 -400
30
a -.00 .0
50%P -d tA
3I 6<6
2c
z 3 4 56 7RANGE (uml) 77-2919
FIGURE 19. AIRCRAFT HCMO 33TRENGrli VERSUS STC
56

800
90
u/
60
70/
10
~ 0 2/ z1T13 A O TSIN LT -41E d)7-92
oIW 20IT/tD4CWRTVIPOALT FDNT
I-.57

p
t -°.o •'•
%b'
i..-
Ar-
I"%OIL
C° 1-4...
•dell
p,,w I..•
Soo
DN.w
I-
. . ..-- . ..............j--d
S• -H
,• ,l•,1*-'
- @ 1 '
I A A I l
-~~ N-
(UP) HJ.DN•3U±.IS "IY4D1S •[AI."1V•i
58
i-4
* i

K~G~KE 2. MD VELOCITY RESPONSE TN '4EAT'ik-i
59

(a \F N N' 'A A\ 1'
(b) ANTENNA AT 150* (c) ArN.JTENNA AT 330'
FIGURE 23. PRECIPITATIOA SPECTRA 77-29-23
60
ho:|

ON
z z
CID4
0.4.
U-1%
lz Z.
Ln~
(lap H.Lmmu r~volsIAIIý13

-4X
04
0q
(S)I ON11L ZINI AIr~f
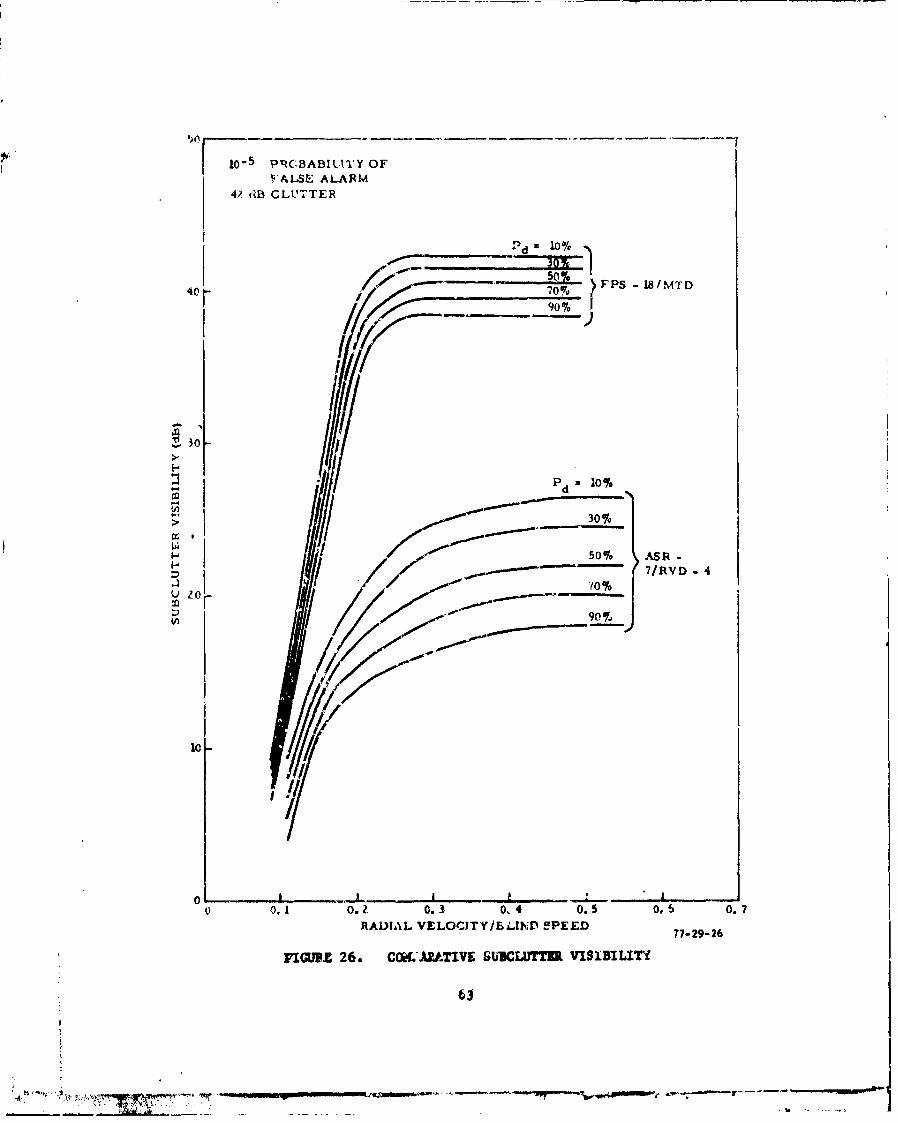
I 110 -5 VRC.8ABItýlTY OFFALSE ALARM
42 (-B CLUTTER
Ind l0% -'
50%-1 FPS-1SIMATD
40 761
~~300/6
- I I '10%- Io
0 0,1 I .I. , 05os0
HAM LV L CT I LN SP E 7 7-29-264
IIZ 6 COA.T-'' G10%TRlaIIL

I'FPS-8/MTD (WITH RAN(AE
I FPS-18/MTD
< 8 AS H-7/RVD-4
AI~ .
7. o
2
x
.0 OZ.4o/0 1 1 1 1
,,r/Hi
©
I,:
.0 .0 2 .04 .06 .08 . I0 . 1I 2 .14 o.!6
RANGE DEVIATION (mini) 77-29-21
FIGURE 27. COMFPARTIVE FRQUUCY DISTIIWTIOIIS OF RANGE ACCURcY
64
S *''-* < - • • - •. , = '

100
90-
FPS-1S/MTD80-
z 70- '" ASR-7/RVD-4
.4• 60-
40
.>
z
I14 30-04
20- 0
10
0 .10 .zo .30 .40 .50 .60 .70AZIMUTH DEVIATION (DEGREES) 77-29-28
FIGURE 28. CCMPARATIVE FREQUEICY DISTRIBUTIONS OF AZIMUTH ACCURACY
65
' "' ' • • rl •" I I I i n

(I'
"-4
t-4
H
H
HH
>4
a'N
6b
-- -a

I
0
H
H
H
H
H
C.,-'
0
b7
1��� -

0
L)
�-4
U'-4'I

00
jLI

9
*1Lfl
'-4
0-4
-4
'-4
it)

U
0
U
c'J
-4
-4
4-4 �.)
U,
>1
11

Li,
H
E-4
It)
I
72

10-
Hr.
owe#,
Jr., 4
. N.,
73

lipi
400

H SYSTEM HITI I SYSTEM MISS
z; RADAR REPORT DATAZ 51 SCANS OF DATA
>4
z
w
F P5'-18/ ------- .' •
MTD
ASR-7/ w - -- -RVD-4
1, 500 1, 5ZO 1, 540 1, 560SCAN NUMBER 77-29-38
FIGURE 38. COMWAPATIVE SYSTEK DETECTION IN WEATHER
75

10
IJ4
40-
~ 0DL..ý
ZV-
.4 .6IAICAT EAAIOINI
c177-29-39
FTGF- Ii 01AAI9 AGTRBLTINCPBL
I7

co440
-I
I41
z
E-40
H
77e

00
4-4
0
-:1
0.
78

00
cu
E-4
E-4
79H

0i
C
E-.
P-4
-44
80

q440
Lt)
174
E-4
8
0
81

0
H
C
H
.4:H
4:
0U
0
1-4
82

or.
83

tr."
VIM
0-
84;
8 i
0
n 4

(a) ASR-5/MID (b) ASR-7/Mt-D
(c) FPS-18/TrD
FIGURE 41. SYSTEM STABILITY DETERMINED WITh SINGLE GATE PROCESSOR
85

40 40f" dB COHO ATTENUATION
OPTIMUM SPEED TESTTA HG ET 1 BCH rEUTTA r 1,, 20dB COHO ATTE.NUATION
24dB COHO ATTENUATION
. 0
0 30 dB COHO ATTENUATIONt-o
36 dB COHO ATTENUATION
i I I I I
lo 2' 40 50 77-29-42
RF TEST SIGNAL INPUT (dB)
FIGURE 42. PHASE DETECTOR CONVERSION LOSSES
OPTIMUM SPEED TESTTrA H4 GE ,F
" 40o
I-l
42 dB CLUTTER
> 3o -50 dB CLUTTER (LIMITED)
38 dB CLUTTERu
AT LEAST 6db OFtn . COHO ATTENUATION
NECESSARY TO AVOIDAID LIMITING
0 10 20 30 77-29--.3COHO ATTENUATION (dB)
FIGURE 43. SUBCI'TTER VISIZILITY AS "!'UNCTION OF COHO LEVEL

5o
10-5 PROBABILITY OFFALSE ALARM
50% PROBABILITY OFDETECTION ASR-5iMTD SCV (46dB CLUTTER)
40-
ASR-7/MTD SCV (41 dB CLUTTER)
S30-
-4
[.-4
F-
u
m 20-
10-
0 I I I I I
0 o.1 0.2 0.3 0.4 0.5 0.6 0.7RADIAL VELOCITY/BLIND SPEED 77-29-44
FIW•,K 44. ".R-5 A4NfD AJR-7 WD SUBCLUIflER V13'1BILITY
8'7
'I,.,

APPEN*DYX A
DESCRIPTXON OF EQUIPM.ENT

APPENDIX A
LIST OF ILLUSTRATIONS
Figure Page
A-1 Transmitter System Simplified Block Diagram A-6
A-2 FPS-l8/MTD Receiver Simplified Block Diagram A-7
A-3 ARTS III System Configured for MTD Test Operation A-9
A-4 Radar Input Processor Simplified Block Diagram A-10
LIST OF TABLES
Table Page
A-1 Doppler Strevgth Normalization Factors A-11
A-2 Doppler Interpolation Values A-12
A-i

APPENDIX A
DESCRIPTION OF EQUIPMENT
The MIT Lincoln Laboratory MTD radar-signal processor (figure A-I) was adevelopmental system which was integrated into the existing TFAST (TerminalFacility for Automated Surveillance testing) at NAFEC. The sensor portion ofthe MTD was comprised of a modified Bendix FPS-18 S-band medium-power, short-range air search radar system previously employed in the SAGE system by theAir Force.
Important modifications to the radar analog system included the installation ofa solid state receiver/exciter with additional filtering and regulation tothe Klystron high-voltage power supply for improved stability. The thyratronmodulator charging circuits were modified to allow for operation at variablepulse repetf.tion rates. The receiver subsystem was redesigned to providewide dynamic range, stability, and two-channel synchronous (quadrature video)detection.
The master timer for the radar transmitter was located in the MTD signalprocessor. It provided a 1-us gated 30.987-MHz COHO signal, an HVPS gate, anda system trigger. The gated COHO signal was mixed with the 2741-MHz solidstate crystal oscillator (STAT] to establish the basic radar frequency of2710 MHz. The pulsed RF excitation signal was amplified through a VarianVA-87B water-cooled klystron which was modulated at intervals determined bythe MTD timing and control unit.
Figure A-2 shows the signal flow of the receiver system. Received RF energyfrom the antenna/dipiexer was channeled to a Hyletronics LS-25 microwavesensitivity-time control (STC) attenuator. STC timing was Zontrolled by thedigital control system through a D/A converter providing R- attenuationcapability from 0 to 94 1/2 dB.
A standard ASR-7 parametric amplifier, tunable from 2.7 to 2.9 GHz, wasinstalled after the RF STC unit to amplify incoming RF signals and provide animproved receiver noise figure.
Thc IF frequency was produced by mixing the 2710-MHz radar signal with the2741-MHz STALO signal. A MPX2-4/2c RHG Electronics mixer-preamplifier wasused to accomplish the mixing.
The MTD analog subsystem was assembled almost entirely from commerciallyavailable items. The low-pass filter which followed the double balancedmixers were fabricated by Lincoln Laboratory.
IF and COHO amplification was accomplishec by using high-gain Avantek ampli-fiers, while IF filtering was achieved by using a CIR-Q-TEL 3.75-MHz(3-dBpoints) band-pass filter. IF signals were then distributed equally to thedouble-balanced mixers through a Merrimac PD-20-50 power divider. The COHOwas fed to a Merrimac CHM-3-30 quadrature hybrid which established the 90*
A-1

phase difference necessary for in-phase and quadrature video detection."1" and "q" videos were channeled to the low-pass filters and then to th.? A/Dconverters.
The low-pass video filters were provided to filter out the excess noise passedby the wide IF band-pass filter. The in-phase (I) and quadraturc (Q) bipolarvideo signals were sampled at 2.6 MHz rate by 10 bit, Computer Labs 5103, A/Dconverters. The sampled video was then interfaced into the MTD input processinglogic.
A complete description of the MTD processor is contained in reference 1.
Figure A-3 shows the basic flow of MTD signals in the ARTS III system. Exceptfor the new RIP and data extraction portions, standard TFAST ARTS III hardwareand software were used. The data extraction capability shown in more detail infigure 4 (i' the body of the report) produced magnetic extraction tapes andsurmari.ee of ..Ata as listed in tables A-1 and A-2.
A block diagram of the RIP is shown in figure A-4.
The MTD information to the RIP input buffer consisted of two 32-bit words.These were termed the PAS (PRF, azimuth, status) and VRS (velocity, range,strength) words. A PAS word occurred at the beginning of each CPI and providedbasic information for processing VRS words within the CPI. Within the PASwrd, the PRF field designated which one of four possible PRF's was used duringthe M~. The azimuth field provided the CPI center azimuth data. The statusfield indicated whether the maximum of 40 target responses allowed in a CPI
was exceeded and whether any communication problem existed between the MT1D anuRIP. The VRS word velocity and strength field contained the ITD Doppler filternumber and amplitude of the target response. The range field containea thetarget position in range. A threshold field was included in the VRS wordto define the levels of the weather and clutter thresholds.
The input control/buffer functions shown in figure A-4 provided the linkbetween the MTD and the computer processing functions. These functio'ýsincluded the provision of synchronization between the MTD and the ARTS IIIand the detection of and response to parity error conditions. The inputbuffer contained 300 words of storage.
The CPI data consolidation function provided for the combining of multipleDoppler and range responses into a single response. Prior to the actual con-solidation, hormalization of the Doppler strengths was performed. This wasmade necessary by the effect of the three-pulse canceller preceding the DFTprocessor resulting in the lower velocity filters having a lesser output ampli-tude. This effect was discussed m*e fully in the body of this report undervelocity response testing. Table A-1 contains the normalization factor foreach filter. Normalization consisted of the division of the output of a filterby its normalization factor.
A-2
iý

Following Doppler strength normalizazion, all adjacent Doppler responses atthe same range were consolidated into a single response. For this purpose,Doppler adjacency was defined as occurring when signals within a CPI were inthe same range gate and from adjacent Doppler filters. If an adjacency wasfound, an interpolated Doppler number end corrected strength value weredetermined as follows. First, determinations were made as to which of themultiple Doppler responses had the highest strength number and then as towhich of the two possible adjacent responses had the larger strength. Then thefollowing determinations were made:
1. A strength ratio was computed by dividing the selected adjacent normalizedstrength.
2. The Doppler was interpolated to six-bit accuracy (0-64) from table A-2using i'oppler filter numbers and strength ratio.
3. The strength of the largest response was corrected for off-filter (non-centered) loss by dividing it by correction factor from table A-2.
If a single isolated response was obtained (no adjacencies), the response wasassumed to represent the maximum response of the Doppler filter ideta_ adby the VRS word. An interpolated Doppler number was derived from table A-2using the Doppler number and a strength correction factor of unity.
The above consolidation procedure resulted in a single response with aninterpolated Doppler number, normalized and corrected strength, range, thresholdindicator (clutter or weather), and a count of the number in the range cell.
Range consolidation combined Doppler-consolidated responses satisfying thefollowing range/Doppler adjacency criteria into a single response. Rangeadjacency was obcained when two responses occupied adjaceikt range gates(l/16-nmi separation). Doppler adjacency was obtained when two responses hadan interpolated Doppler number separation of less than fo ir (the 0 and 54interval numbers were also adjacent). When two resarnses satisfied the abovecriteria, they were assumed to represent the same target, and the one with thelargest target strength was selected as the output. Responses without adjacen-cies were passed directly to the output. The number of VRS words associatedwith a consolidated response was indicated by quality bits. Azimuth and PRFinformation were added to the output to complete the target response data.
Following CPI data consolidation, target record processing was performed.This function created or updated records of target data using the targetresponse data. Each CPI's consolidated response data were entered separately.When the processing began wv.th data froe a new CPI, all tsrget records fromprevious CPI's were located in target store A. The target record proiessingroutine first perfcrmed a correlation between these records and the newconsolidated response data on a comparative range basis. The basic operationperformed for the match/no match determination is described below:
A-3

1. Match condition - Existing record and new data (within I/16-nmi) weremerged and updated into a new zecord and stored in record store B.
2. Miss Update - No new data to match existing record data. The recordwas updated to show the miss and put in record store B.
3. New target - No existing record to match new data. A new recerd wasgenerated and put in store B.
4. Target report - Initiation of target finalization occurred when there weretwo consecutive misses (no target response for two information occurred inCPI's) or when information occurred in seven successive CPI's.
The target finalization routine processed completed target records into targetreports or noise responses. The routine first checked the record bit countto determine the type of processing required. A bit count of I representedeither a noise response or a single-CPI target response. Such a recurd With aquality number of zero wan considered to be from a noise response and wasentered in the noise count store. Those with a quality of greater than zerewere considered to be from a valid target, and their range, strength, azimuth,and Doppler data were used to make up a target report. As a selectable optior,all single-CFI records could be processed into noise responses.
A hit count greater than 1 (multiple-CPI responses) was processed as follows.The target record content was examined to determine which responses belongedtogether as representing data from the same target. Within a CPI, recordswith an interpolate4 Doppler number separation of less than 4 were consideredto be from the same target. Responses from adjacent CPI's were then associatedtogether to form a final set representing the target.
The target record was then completed by computing and entering its velocity andcenter azimuth. The velocity was computed using the Doppler information inthe target records. The center of azimuth was computed by applying the formula-
N r[Aj K)1 rS (K)1AZ Z N
k=l E s(K)k-1
where:
AZ- - the target report azimuthAZ(K) - the azimuth position of the Kth CPI response (from the target
record)S(K) - the corrected strength values of the responses (from the target
record)N - the number of responses in the target record
A-4

The resulting output was a 12-bit azimuth word to the target report store. Thefinalized target reports contained range, azimuth, strength, number of CPI'sinvolved, and Doppler filter numbers.
Second-level thresholding was adopted to remove residual ciutter signals,thereby utilizing the maximum sensitivity of the radar for track initiation.This thresholding was fully automatic and ads'tive to the radar environment(weather, angels, inversion, etc.).
The algorithm employed divided the surveillance area (48 nmi) into 4 nmi by22.50 sectors for a total of l12 sectors. Each sector contained eight inde-pendent thresholds (one for each 1flD Doppler filter) yielding a total of1,536 thresholds. The 48-nmi coverare area was further divided into two zones.The first zone extended from range zero to 16 nmi. Th.s zone size was decidedupon, since it contained most of the return from clutter experienceu in theNAFEC radar enviropment. The second zone extended from 16 nmi to 48 nmi.
Theý adaptive threshold in each sector/Doppler filter was derived from thenumber of single CPI's it contained. Thege threshold levels wert derived asdescribed in the body of the repcrt.
The thresholds were applied according to major range zone number. In the firstzone ( 0 nmi to lb nmi), all MTD replies were tested (by strer.6th number) atthe RIP input to determina if they exceeded the pertinent sector/Doppler filterthreshold levels. In the second zone, only single-CPI replies were testedagainst the thresholds.
To iniziate a track in the first zone, a target report was required to c.,ntainreplies from at least two CPI's to have a tracker velocity of at least 50 knotsand a scan history of three scans. hiowever, airigle-CPI target reports wereused for updating existing tracks.
All of the previous conAitions for tracking were also required in zone two,except that track initiation was possible using single-CPI target reports.
Nonsynchronous interference detection and rejection waE impleinsnted in theRIP. The MTD employed an interference rejection algorithm ab previouslydescribed. However, when inttrference and ground or weather clutter signalswere concomitant, the algorithm did not function properly.
Interference signals were found to occur in one CPI and multiple Dopplerfilters. Being random in nature, they did not activate the second-levelthresholds. To prohibit the interference from initiating false tracks, thenumber of single-CPI reports in each 5* by 48 nmi sector of the radar coveragearea were counted. When this number exceeded a threshold value of 15, trackinitiation in that sector by single-CPI targets was prihibited. Thi3 effec-tivity eliminated track initiation by aonsynchronoua interference. The radar/beacon correlation, tracking, aud display functLicns shown ii tigure A-1 wereaccomplishad using existing ARTS III software.
A-5

ASR-5-- ANTENNA
CGROUP
ACP/ARP
yS YSTE.M TRIG"1-MTD COHO
.HVPS GAT TIMING & CONTROL 30. 987MHZ
STC TIMING -j --
GATED~F0, ?8 t?A!.;Z
,ENERATOR
ITG ISOLATOR
ILL) TEE.
- TRANSMITTER -- wVA-87Eý wF-'- AE
20.9 7MIE 17--9A
DIPLXER Y241H
S Z710I tIZ 7 -9--
FIGURE A-1. TRANSMITTER SYSTEM SIMPLIFIED BLOCK DIAGRAM
A-6

ASR-5ANTENNAGROUP
DIPLEXER KAjjV712710MHZ Fc : ER
RADAR 275Mi 1
HARDWARE i
DRIER STALO
STC TIMING--m ¶ DRIVER/ AMPLIFIERARAMP 2741MHZ
P 31MHZ
IFAMPLIFIER
MrDHARDWARE
[0-12.DBVARIABLEATTENUATOR
FBAND PASSI FILTER
IF
AMPLIFIER
TO SHEET 77-29-4-2
2
FIGURE A-2. FPS-18/MTD RECEIVER SIMPLIFIED BLOCK DIAGRAM (SHEET 1 OF 2)
A-7
__ _ _ _ _ _ _ _ _ _ _ _

P,~ % il I1P.t
A~I' l& I NM''S~ tijti 0 1 '& I , ]' Pt .
I ~ IRLVCtIL.JNA I t
I I I-UI . I 1r
AMPU lip
-7-

0%
0
00z0
U I
0 0
• u
z 1.4
- U
000
A-9
" 1' .. .•.• •,••, . • ,,,, • • u nal • m mw wmnmmmnn I mw•,|,,,,•m ipmmmn • . " --

z0
w
IY.< 0
00
z0
00<
0.
0 0 0
zz.
Ia4W
W A-0
*~~ J w

TABLE A-I. DOPPLER STRENGTH NORMALIZATION FACTORS
Filter Number Normalization Factor
0 0.33631 0.018972 0.10573 0.25614 0.33635 0.25616 0.10577 0.01897
A-i1

TABLF A-2. DOPPLER INTERPOLATION VALUES
Larger ResponseInternal Larger Smaller Response Strength Smaller Larger IntervalNumber Filter Filter Strength Ratio Filter Filter Number
0 1.000 0 641 0.9880 0.000001832 632 0.9527 0.0005000 62
3 0.8960 0.003978 614 0 1 0.8211 0.01852 60
5 0.7319 0.06315 59
6 0.6331 0.1750 587 0.5297 0.4177 578 0.4268 0.8910 56
9 0.5740 0.5730 5510 1 0 0.7704 0.3116 0 7 54
11 0.9262 0.1765 53
12 1.0000 0.1795 52,3 1 2 0.9683 0.3095 6 7 5114 0.8353 0.5427 5015 0.6350 0.9876 49
16 0.7957 0.5214 4817 0.9693 0.2400 47
18 1.0000 0.1365 4619 0.9906 0.2394 4520 2 3 0.9005 0.4127 5 6 4421 0.7471 0.7116 43
22 0.6992 0.8014 4223 3 2 0.8497 0.4404 6 5 4124 0.9570 0.2268 40
25 1.0000 0.1384 3926 0.9693 0.2518 3827 3 4 0.8697 0.4415 4 5 3728 0.7195 0.7613 36
29 0.7159 0.7618 3530 4 3 0.8631 0.4344 5 4 3431 0.9641 0.2388 3332 1.000 0.1229 32
A-12
S. . ... • ,to 4

APPENDIX B
TEST EQUIPMENT
APPENDIX B
TEST EQUIPMENT
The coherent S-band test Target Generator (TTG) used to generate simulated-adar target information is described in this appendix. A list of standardequipments used in testing the MTD is also given.
The coherent RF TTC was designed by Westinghouse Electric Corporation for theFAA to provide realistic simulated RF radar targets for S-band radar sensors.The TTG was interfaced into the MTD/RVD test facility and was used extensivelythroughout the MTD test and evaluation. Figure B-1 illustrates the TTG/RADAR/MTD interface.
RF test tazgets were generated by mixing 30-MHz IF (ASR-7) test targets with asample of the STALO frequency from the radar. The phase modulator was mcdifiedto accept 31-MHz IF test targets from the FPS-18. Two external switchesenabled the TTG to accept either 30-MHz or 31-MHz IF signals. Coherent ornoncoherent targets could be generated by selecting either the COHO signalfrom the radar or an internal 30-MHz oscillator as the IF signal source. AllMTD!RVD tests used the controlled phase mode of operation (variable mode).The simulated RF test targets were controllable in azimuth, range, range rate,velocity, pulse width, and amplitude.
Azimuth control was accomplished by a counter which counied azimuth changepulses (ACP's) and was reset by the north azimuth reference pulse (ARP) fromthe azimuth pulse generator (APG). Thumbwheel switch control permitted theazimuth start to be set to any selected ACP, providing 4096 possible azimuthpositions per 3600. Another thumbwheel switch controlled the selection ofazimuth steps per target, up to a total of 99. The time interval betweenazimuth steps was controlled by anotrher set of thumbwheel switches which wereadjustable from 10 us to 10 as, A manually programmable diode matrix was usedto establish the antenna scan pattern. The test target could be wuindow gatedas programmed by the antenna pattern, or it could be of constant amplitudeevery PRP.
Range control was accomplished by a range counter which was reset by a zeromile trigger, A thumbwheel switch s•2-.;cted the range of the RF test targetand was variable from 0 to 60 miles in 1 ps steps. Two modes of range controlwere available: the "fixed made" providod a stationary target at a selectedrange and the "moving mode" simulated a radially moving target. Eitherincoming or outgoing test targets were selectable. Simulated velocity c¢cntrolselected the target velocity and controlled the range rate, The velocitycontrol was variable from 0 to 1,000 knots. The FPS-18 and ASR-7 radarsoperated with 1.0 and 0.833 Vs transmitted pulse widths, respeýctively. Thfore, the TIf. was adjusted to provide the necessary test target pulse ,idt|hI.
A Hewlett Packard direct-reading precision variabie attenuator, model S382C,controllbd the RF output amplitude to +1 percent of reading or 0.1 dB, which-ever 'as greater. The attenuation range was from 0 to 60 dB.
B-I

For the probability of detection test, a higher data rate was necessary toprovide adequate sampling of RF levels from the TTG. This was accomplishedby generating four concentric rings of test targets, each separated in rangefrom the preceding target by approximately 3.75 nmi. An azimuth trigger whichoccurred 32 times per scan (RVD-4 azimuth 27 bit) was used to generate 32 testtargets per scan at the same range providing 128 targets per scan. The velocityof the targets was controlled by the velocity-controlled crystal oscillator(VCXO) of the TTG. In addition, the azimuth trigger was incremented by oneACP each antenna scan to provide azimuth changes to test CPI boundaries.
Table B-1 contains a list of the test equipment used in maintenance and calibra-tion of the MTD radar/digital signal processor.
B-2

COHO COHO FS1ASA 7 SALO 'M SALORADAR
RAA TRIG A.-• TRIG (MTD)
128 TRIOS PER SCAN
clp5 RF CPI
INACP CP3
TTG
ARP CP2 RF
OUT
VARIABLEATTENUATOR
HP S382C
DIRECTIONALCOUPLER
TO ASR-7 RECEIVER* (20 dB) & TO FPS-18 RECEIVER
DIPLEXER77-29-B-1
FIGURE B-1. TEST TARGET GENERATOR/RADAR INTERFACE
B-3

TABLE B-1
Type Mode] Source
Oscilinscope 7603 Tektronix
Time Base Unit 7B53A Tektronix
Dual Trace Amplifier 7A26 Tektronix
Voltage Probe P6053B Tektronix
Voltage Probe P6011 Tektronix
Oscilloscope 475 Tektronix
Power Meter 431B Hewlett Packard
Thermistor Mount 478A Hewlett Packard
True RMS Voltmeter 3403C Hewlett Packard
Electronic Counter 5248M Hewlett Packard
Frequency Converter 5254C Hewlett Packard
Time Interval Unit 5267A Hewlett Packard
Sweep Oscillator 8690B Hewlett Packard
Solid State RF Plug In 8698B Hewlett Packard
Solid State RF Plug In 8699B Hewlett Packard
Variable Attenuator S382C Hewlett Packard
VHF Attenuator 355C Hewlett Packard
VHF Attenuator 355D Hewlett Packard
Attenuator Set 11581A Hewlett Packard
Coaxial Frequency Meter 536A Hewlett Packard
Signal Generator 8616A Hewlett Packard
General Purpose Aimplifier 465A Hewlett Packard
Crystal Detector 420A Hewlett Packard
Variable Phase Generator 203A Hewlett Packard
RF Voltmeter 91CA Boonton
RF Probe 91-12 Boonton
Digital Hultimeter 8000A Fluke
Pulse Generator 7260 Exact
Pulse Generator 1OOA Systron Donner
Pulse Generator 11OB Systron Donner
Echo Box TS-270-AUP Johnson Elec. Co.
System Noise Monitor Ailltech
Noise Sourct Ailtech
3-4
APPENDIX C
MTD PROBABILITY OF FALSE ALARM IN THERMAL NOISE
i

p APPENDIX C
LIST OF ILLUSTRATIONS
Figure Page
C-I Probability ot False Alarm from Receiver Noise Filters 1 C-3through 7
C-2 Probability of False Alaim from Receiver Noise Filter 0 C-4
! I

APPENDIX C
MTD PROBABILIT.' OF FALSE ALARM IN THERMAL NOISE
The MTD probability of false alarm in therrwal noise (Pfa) was determined bymeasuring the time it took to receive 100 thermal false alarms and thencalculating Pfa a 1 0 0 x n
tfa
where tfa was the time elapsed in seconds per 100 false alarms aad n was thenumber of independent opportunities for false alarm per second. In the MTDsystem, n for each Doppler filter was equal to the product of the number ofrange gates processed (760) in a coherent processing interval (CPI) and thenumber of CPT's processed per second (102.13). This product equaled 77,617opportunities per second per filter. For all seven weather filters, therewere therefore 543,319 false alarm opportunities per second. For all Lightfilters taken together, there were 620,936 false alarm opportunities prsecond which, at 4.70 seconds per antenna scan, yielded 2,918,400 false alarmopportunities per antenna scan.
It was desired to set the MTD system thresholding so that between 10 and 100thermal false alarms would be outputted to the ARTS III system each antennascan. Considering the above false alarm opportunity uumbers, it follows thatoperating with approximately a ten to the minus fifth power probability offalse alarm would yield the desired false alarm rate. To determine thecorrect thresholding levels, receiver noise only (radar transmitter OFF andreceiver input connected to the system dummy load) was inputted to the i4TDprocessor, and the false alarm time measured using the NOVA minicomputer.In initial testing, the NTD thresholding was varied to determine its effecton false alarm time. A threshold ot 12 dB provided approximately the desired10-5 Pfa- The receiver noise level was then varied in amplitide by means ofa step attenuator, and the false alarm time of each of the eight Dopplerfilters was measured.
Figure C-1 shows the resulting data from the seven weather filters (numbers 1through 7) and figure C-2 the corresponding data from the zero velocityfilter. As seen in figure C-l, the number of false alarms increased at lowernoise levels in the weather filters. The exact cause of the increase was notdetermined. Twi possible causes were (1) the exact accuracy of the A/Dconverters was closer to 9 bits than to the rated 10 bits and (2) quantiza-tion noise in the MTD processor due to truncations. By operating with ab-6.V noise level (measured using a true voltmeter), the desired false alarmrate was obtained. Sir. millivolts corresponded to approximately three A/Dconverter counts. Originally, the system was desired to operate with a 2-mVLoise level equal to one A/D least count. Operation with a 6-mV noise levelresulted in the loss of approximately 9 dB in systm dynamic range capabil-ity.
C-1

During the testing, it was found that a disproportionately large percentage of
the false alarms were produced by the numbers one and seven filters. This was
deemed to be due to the effect of the three-putlse canceller filter preceding
the DFT filter. The canceller modified the velocity resporse oOL&Iazd at th4
output of the individual FFT filters. Due to the significcntly lesser canceller
output at frequencies corresponding to the low velocity filters (particularly
numbers one and seven), there resulted an increase in the false alarm rate.
This was compensated for by operating the number 'ne anO seven filters with a
higher threshold. While filters two through six had the desired ialse alarm
rate when operated with a threshold 3.94 times (11.91 dB) the average noise
level, filters one and seven required a threshold of 4.38 times (12.83 dB) the
average noane level. As can be seen in figure B-l, ohen operated at the above
thresholds and at 6-mV rms noise, each of the seven weather filters produced
approximately the desired false alarm rate.
Due to the different nature (recursive filter and disc memory) of the zero
velocity filter (ZVF), its probability of false alarm curve had a different
shape. At the 6-mV operating point dictated by the other Doppler filters, the
ZVF had opproximately the desired false alarm rate when operated with a threshold
of 5.5 times (14.8 dB) the value stored on the disc memory. The ZVF clutter map
recursive filter could be adjusted to provide the desired rate of clutter map
buildup. The algorithm for the recursive filter (which determined what
iiiformation was to be stored on the clutter map each scan) was M-I/ 2 n (M-N)
where M and N represented information from the Hap and New information from the
magnituder, respectively, for each range/azimuth cell. The value of n was
selectable, controlling the rate of clutter map update. Testing resulted in
the selection of an n value of 3 (yielding an algorithm of M-1/8 (M-N)) so
that 1/6 of the information on the clutter map was replaced with new informa-
tion each antenna scan. This provided a good compromise between too fast a
clutter map change (resulting in a high false alarm rate) and too slow a
change (resultinb in the inability of the clutter map to accurately follow
environmental changes such as weather).
C-2

THRESHOLDS
FILTERS I AND 7 12. 83 dBFILTERS 2 THROUGh 6 11. 9k d1I
5 \
4 -
3\
10-5
La 4T5
0
0 4
8
0.3
2
10.61IA2 4 6 a 10 12 14 16
AID INPUT NOISE LEVEL (MILLZVOLTS RMS)77-29-C-1
FIGURE C-1. PROBABILITY OF FALSE ALARM FROM RECEIVER NOISEFILTERS 1 THIROUGH 7
C-3

10-31 -THRESHOLD
SET AT 5.5 RECEIVER AVERAGENOISE (14.8 dB)
5
4
3
2
. lO 1-4--
< 5-
4
•4 3
0
• 2
10-5
s
4-
3-
ZOF~ 4 6 8 10 1
A/D INPUT NOISE LEVEL (MILLIVOLTS RMS)77-29-C-2
FIGGLUMS C-2. PROBABILITY OF FALSE ALARM FROMK R9CRIVER NOISE FILTER 0
C-4t

APPENDIX D
MTD INTERFACE WITH ASR-5 AND ASR-7 RADARS
I

APPENDIX D
LIST OF ILLUSTRATIONS
Figure Page
D-1 ASR-7/MTD Interconnection Diasram D-2
D-2 ASR-5/HTD Interconnection Diagram D-2
D-i
APPENDIX D
MTD INTERFACE WITH ASR-5 AND ASR-7 RADARS
The equipment modifications and interconnecting cabling changes necessary tointerface the MTD with the TFAST ASR-7 and ASK-5 radars are &hown in figures D-1and D-2, respectively. Both radars were operated with fixed-frequency crystalcontrolled STALOS. The magnetrons were automat i cally tuned to maintain thecorrect frequency with respect to the STALOS. The ASR-7 radar was retuned tooperate with the 31-MHz IF frequency used with the FPS-18. A new 30-MHz IFband-pass filter was subsequently procured for ASR-5 operation to avoidretuning it to 31 MHz.
To accmodate the timing interface between the ASR-7 and MTD, the ASR-7 controlselector assembly, 6A2A19, was modified to enable the external tuning signalINT. This was accomplished by opening the printed circuit between 95D pin 13and 98A pin 1 and inserting a jumper from -5D pin 13 to grouiLd for internaloperation or open for external operation. An open at 95D pin 13 enabled 95Cpin 8 which in turn enabled gates 9120, 91D, and 920D on the repetition ratedecoder module 6A2A39. The external timing signals from the MTD which appearedon 6AZA39 pins 7, 37, and 40 were then distributed throughout the ASR-7. TheASR-7 COHO and preamplifier output signals were inputted to the MTD. Inter-equipment trigger cabling is shown in figure D-1.
The following steps were taken to interface the ASR-5 and MTD equipments inaddition tc the trigger cable interconnection shown in figure D-2:
1. Connect MTD Mod trigger to J8805 using BNC "T".
2. Install Coax from J8805 (BNC "T") to J6614.
3. Connect MTD STC trigger to J6613 using BNC "T".
4. PRF stagger uait - remove V13.
5. Normal video realignment unit - remove V17 and V18.
6. Connect RG-58 Coax from ASR-5 COHO output to MTD COHO input.
7. Connect RG-58 Coax from ASR-5 preamplifier to MTD IF input.
D-1
~t

MTD ASR-7i STC TRIG
MTD/ASR "STC TRIG MDARwJ1
STC & MODTRIGGER MOD TRIGGENERATOR J13 PROCESSOR
ENTRY
PANELPRETRIGGER
... 39
COHO OUTPUT-- , .. . . ..... COH O
PREAMPLIFIER OUTPUT 4 PREAMPLIFIER
77-29-D-1
FIGURE D-1. ASR-7/MTD INTERCONNECTION DIAGRAM
MTD ASR-5
MTD/ASR MOD TRIGSTC & MOD -
STC TRIG TRIGGER J8805scRGENRIGR NORMAL VIDEOGENERATOR DREALIGNMENT UNITAND
AMPLIFIER
J 6614PRF STAGGER
STC TRIG UNIT.j 6613
COHO OUTPUT COHO
PREAMPLIFIER OUTPUT PREAMPLIFIER
77-29-D- 2
FIGURE D-2. ASR-5fMTD INTERCONNECTION DIAGRAM
D-2