O’ LEVEL MATHEMATICS NOTES
158
STANDARD HIGH SCHOOL ZZANA O’ LEVEL MATHEMATICS NOTES
Transcript of O’ LEVEL MATHEMATICS NOTES
STANDARD HIGH SCHOOL ZZANA
O’ LEVEL MATHEMATICS NOTES
S.3 Mathematics Page 1
S.3 WORK ONLY
S.3 Mathematics Page 2
Contents
Chapter Page
1. Vector Geometry ................................................................................... 4 Vector addition and subtraction .............................................................. 4 Multiplication by a scalar ........................................................................ 5 Parallel vectors ...................................................................................... 5 Collinearity ............................................................................................. 5
2. Matrices ............................................................................................. 15 Elementary operations with matrices .................................................... 16 The Determinant of a 2 × 2 Matrix ........................................................ 23 The inverse of a 2 × 2 matrix ................................................................ 23
3 Matrices and Transformations ....................................................... 27 Translations ......................................................................................... 27 Rotations ............................................................................................. 28 Reflections ........................................................................................... 29 Enlargements ...................................................................................... 30 Shears ................................................................................................. 31 Stretches ............................................................................................. 32 Transformation matrices....................................................................... 33 Successive transformations.................................................................. 40 Matrices of successive transformations ................................................ 43 The inverse of a transformation ............................................................ 47 Area and the determinant of a matrix. ................................................... 48
4. Statistics ............................................................................................ 54 Methods of presentation of data ........................................................... 55 Pie Chart. ............................................................................................ 55 Frequency Distributions ....................................................................... 56 Cumulative frequency .......................................................................... 58 Histograms .......................................................................................... 58 Frequency polygons. ............................................................................ 60 Cumulative frequency curve (Ogive) ..................................................... 62 The mean ............................................................................................ 63 The Median.......................................................................................... 66 The mode ............................................................................................ 69 Quartiles .............................................................................................. 70
5. Probability ......................................................................................... 79 Definitions............................................................................................ 79 Review of terms used in set theory ....................................................... 79 Independent events ............................................................................. 80
S.3 Mathematics Page 3
Venn diagrams..................................................................................... 80 Basic rules of probability ...................................................................... 81 Tree diagrams ..................................................................................... 86
6. Sets .................................................................................................... 91 Symbols, Problems involving three sets ................................................ 91
7. Formulae ........................................................................................... 99 subject of the formula ........................................................................... 99 Substitution ........................................................................................ 103
8. Functions ......................................................................................... 106 Inverse of a function ........................................................................... 109 Composite functions .......................................................................... 110 Rational functions .............................................................................. 111
9. Trigonometry (2)............................................................................. 113 Tan, sin and cos of 450 ....................................................................... 114 Tan, sin and cos of 600 and 300 .......................................................... 114 The graph of y = sin x (Sine Curve) .................................................... 116 The graph of y = cos x ........................................................................ 117 The sine rule ...................................................................................... 117 The Cosine Rule ................................................................................ 120 The area of a triangle ......................................................................... 121
10. Three dimensional geometry ....................................................... 126 Geometrical properties of solids ......................................................... 127 Projection of a line on a plane ............................................................ 127 An angle between two lines ................................................................ 129 Skew lines ......................................................................................... 130 The length of a line on a solid ............................................................. 133 Angle between a line and a plane ....................................................... 135 Angle between two planes.................................................................. 140
11. Further Logarithms……………………………………………………………………………… 158 Logarithmic notation…………………………………………………………………………………………………..158
Laws of logarithms…………………………………………………………………………………158 Simplification of logarithmic expressions …………………………………………………………159 Solution of logarithmic equations…………………………………………………………………………162
S.3 Mathematics Page 4
1. Vector Geometry
1.1 Revision of Vectors
A scalar is a quantity with magnitude (size) only. A vector is a quantity with both magnitude and direction. Velocity is speed in a given direction and is thus a vector. e.g 15 m/s is a speed. 15 m/s on a bearing 0700 is a velocity since the direction is given.
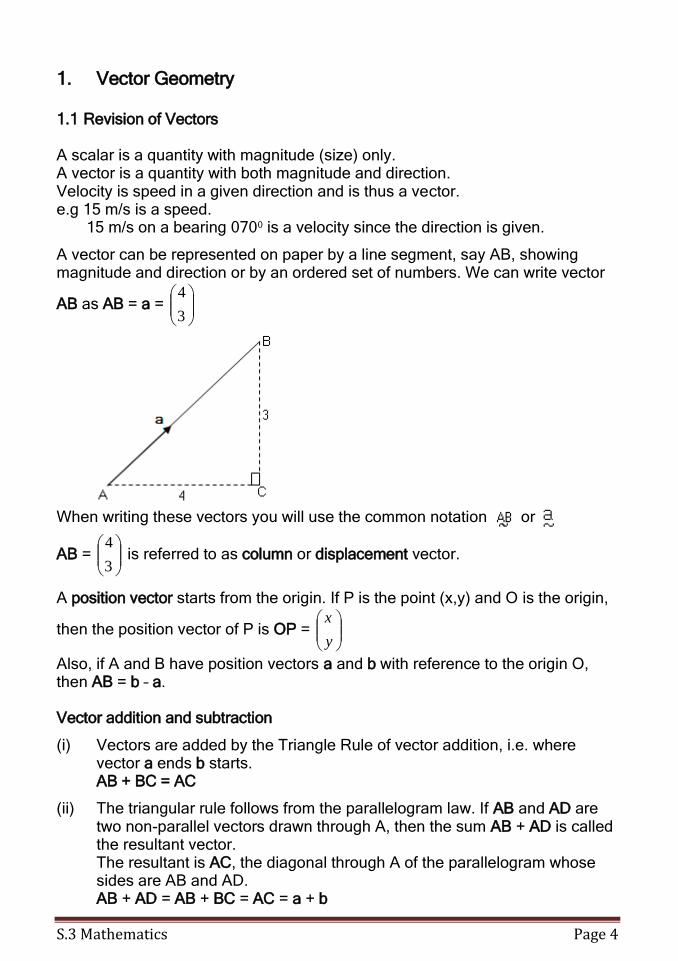
A vector can be represented on paper by a line segment, say AB, showing magnitude and direction or by an ordered set of numbers. We can write vector
AB as AB = a =
3
4
When writing these vectors you will use the common notation
or
AB =
3
4 is referred to as column or displacement vector.
A position vector starts from the origin. If P is the point (x,y) and O is the origin,
then the position vector of P is OP =
y
x
Also, if A and B have position vectors a and b with reference to the origin O, then AB = b – a. Vector addition and subtraction
(i) Vectors are added by the Triangle Rule of vector addition, i.e. where vector a ends b starts.
AB + BC = AC
(ii) The triangular rule follows from the parallelogram law. If AB and AD are two non-parallel vectors drawn through A, then the sum AB + AD is called the resultant vector.
The resultant is AC, the diagonal through A of the parallelogram whose sides are AB and AD.
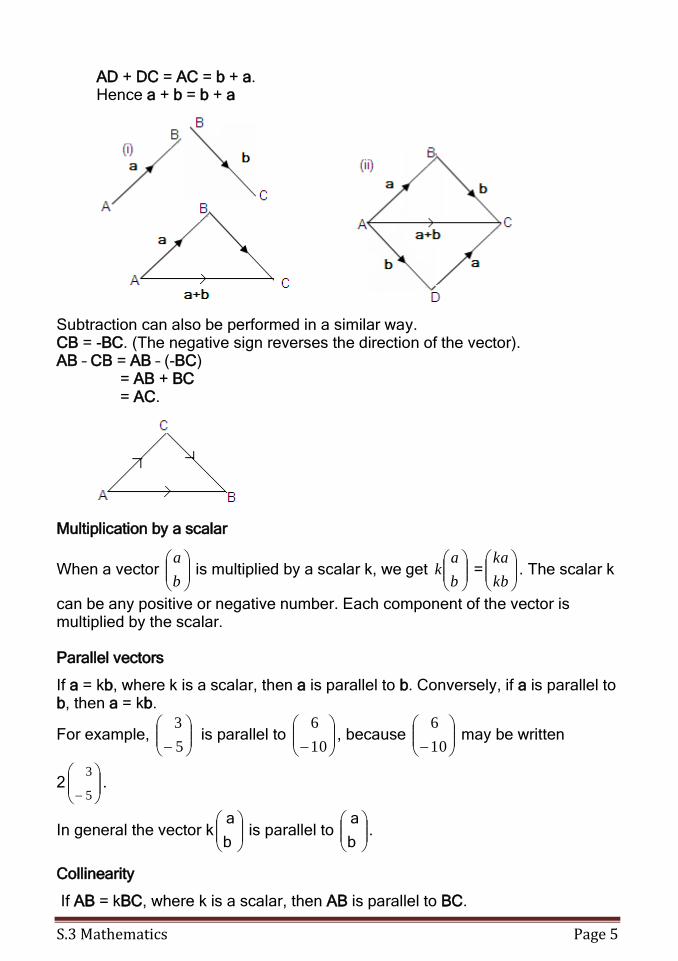
AB + AD = AB + BC = AC = a + b
S.3 Mathematics Page 5
AD + DC = AC = b + a. Hence a + b = b + a
Subtraction can also be performed in a similar way. CB = -BC. (The negative sign reverses the direction of the vector). AB – CB = AB – (-BC) = AB + BC = AC.
Multiplication by a scalar
When a vector
b
a is multiplied by a scalar k, we get
b
ak =
kb
ka. The scalar k
can be any positive or negative number. Each component of the vector is multiplied by the scalar. Parallel vectors
If a = kb, where k is a scalar, then a is parallel to b. Conversely, if a is parallel to b, then a = kb.
For example,
5
3 is parallel to
10
6, because
10
6 may be written
2
5
3.
In general the vector k
b
a is parallel to
b
a.
Collinearity
If AB = kBC, where k is a scalar, then AB is parallel to BC.
S.3 Mathematics Page 6
But B is common, so A, B and C lie on a straight line, i.e. the points A, B and C are collinear. Proportional division of a line
(a)
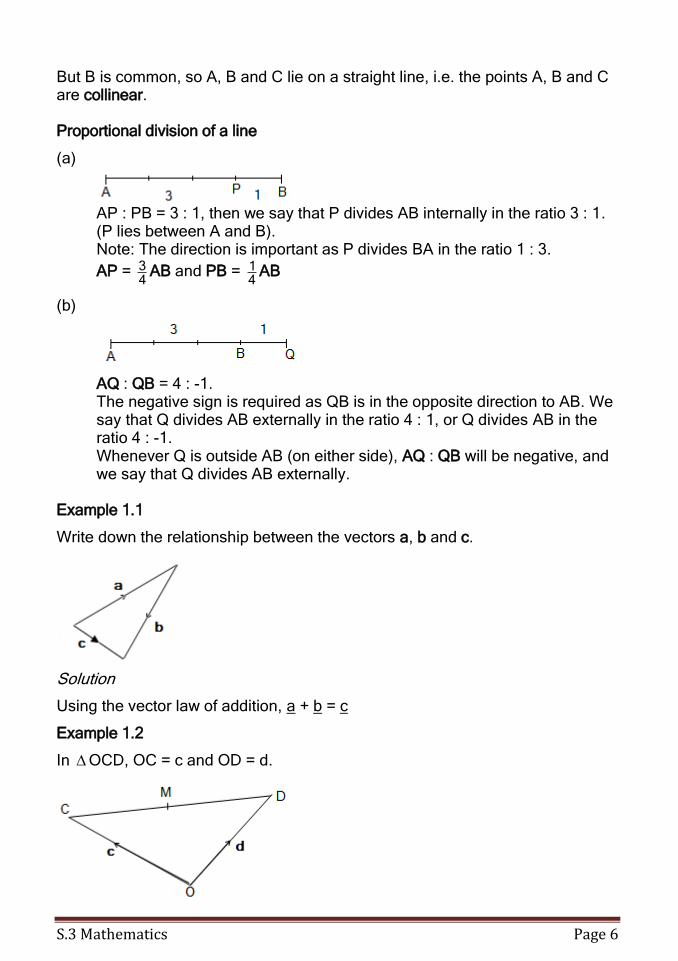
AP : PB = 3 : 1, then we say that P divides AB internally in the ratio 3 : 1.
(P lies between A and B). Note: The direction is important as P divides BA in the ratio 1 : 3.
AP = 43 AB and PB =
41 AB
(b)
AQ : QB = 4 : -1. The negative sign is required as QB is in the opposite direction to AB. We say that Q divides AB externally in the ratio 4 : 1, or Q divides AB in the ratio 4 : -1. Whenever Q is outside AB (on either side), AQ : QB will be negative, and we say that Q divides AB externally.
Example 1.1
Write down the relationship between the vectors a, b and c.
Solution
Using the vector law of addition, a + b = c
Example 1.2
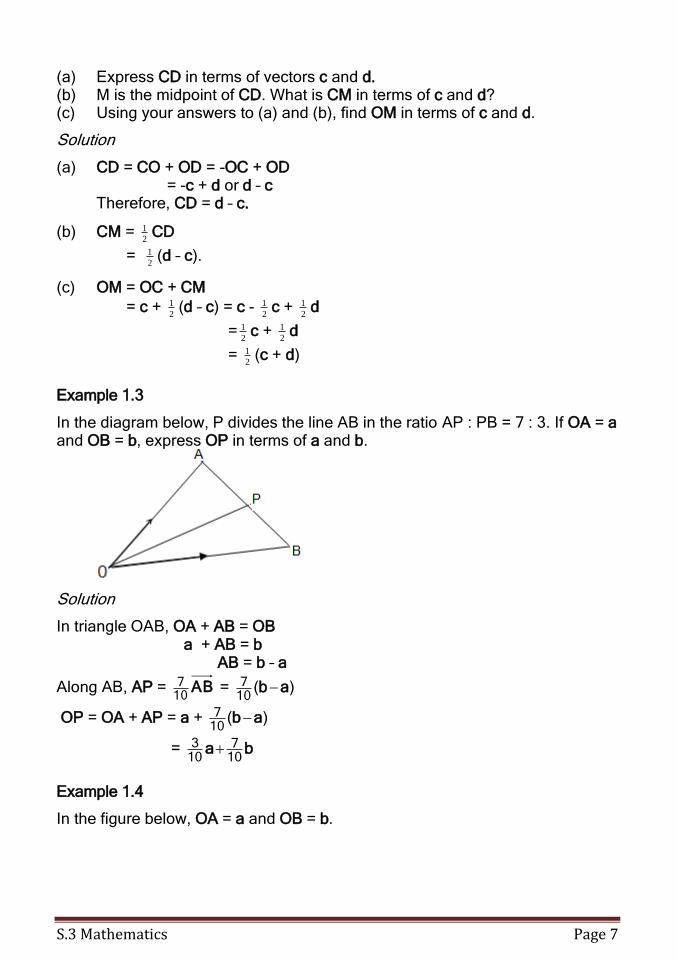
In OCD, OC = c and OD = d.
S.3 Mathematics Page 7
(a) Express CD in terms of vectors c and d. (b) M is the midpoint of CD. What is CM in terms of c and d? (c) Using your answers to (a) and (b), find OM in terms of c and d.
Solution
(a) CD = CO + OD = -OC + OD = -c + d or d – c Therefore, CD = d – c.
(b) CM = 2
1 CD
= 2
1 (d – c).
(c) OM = OC + CM
= c + 2
1 (d – c) = c - 2
1 c + 2
1 d
=2
1 c + 2
1 d
= 2
1 (c + d)
Example 1.3
In the diagram below, P divides the line AB in the ratio AP : PB = 7 : 3. If OA = a and OB = b, express OP in terms of a and b.
Solution
In triangle OAB, OA + AB = OB a + AB = b AB = b – a
Along AB, AP = AB107 = )(
107 ab
OP = OA + AP = a + )(107 ab
= ba107
103
Example 1.4
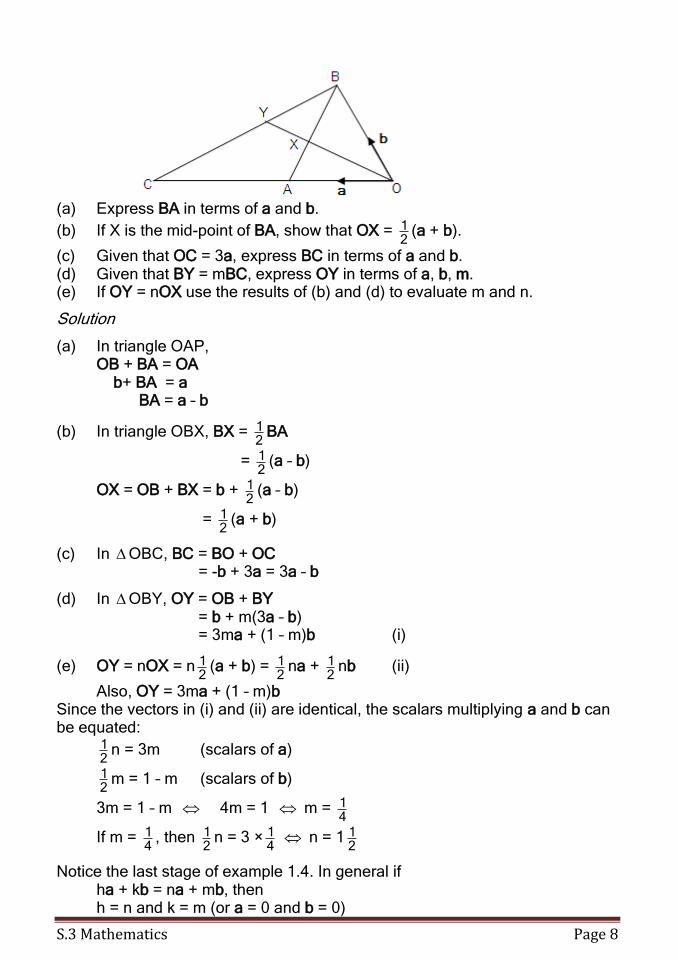
In the figure below, OA = a and OB = b.
S.3 Mathematics Page 8
(a) Express BA in terms of a and b.
(b) If X is the mid-point of BA, show that OX = 21 (a + b).
(c) Given that OC = 3a, express BC in terms of a and b. (d) Given that BY = mBC, express OY in terms of a, b, m. (e) If OY = nOX use the results of (b) and (d) to evaluate m and n.
Solution
(a) In triangle OAP, OB + BA = OA b+ BA = a BA = a – b
(b) In triangle OBX, BX = 21 BA
= 21 (a – b)
OX = OB + BX = b + 21 (a – b)
= 21 (a + b)
(c) In OBC, BC = BO + OC = -b + 3a = 3a – b
(d) In OBY, OY = OB + BY = b + m(3a – b) = 3ma + (1 – m)b (i)
(e) OY = nOX = n21 (a + b) =
21 na +
21 nb (ii)
Also, OY = 3ma + (1 – m)b Since the vectors in (i) and (ii) are identical, the scalars multiplying a and b can be equated:
21 n = 3m (scalars of a)
21 m = 1 – m (scalars of b)
3m = 1 – m 4m = 1 m = 41
If m = 41 , then
21 n = 3 ×
41 n = 1
21
Notice the last stage of example 1.4. In general if ha + kb = na + mb, then h = n and k = m (or a = 0 and b = 0)
S.3 Mathematics Page 9
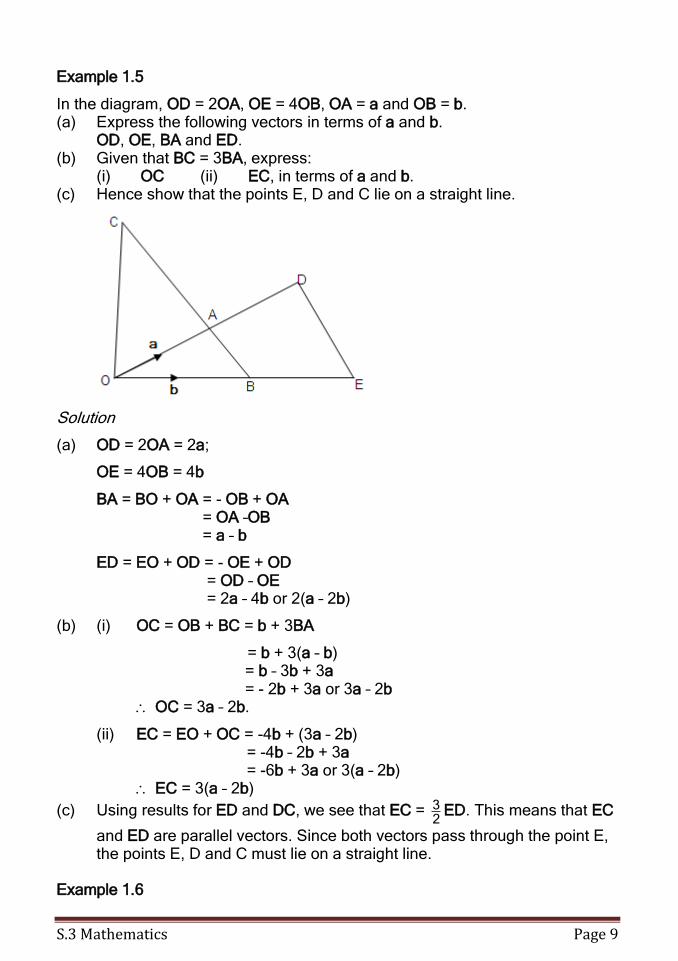
Example 1.5
In the diagram, OD = 2OA, OE = 4OB, OA = a and OB = b. (a) Express the following vectors in terms of a and b. OD, OE, BA and ED. (b) Given that BC = 3BA, express: (i) OC (ii) EC, in terms of a and b. (c) Hence show that the points E, D and C lie on a straight line.
Solution
(a) OD = 2OA = 2a;
OE = 4OB = 4b
BA = BO + OA = - OB + OA = OA –OB = a – b
ED = EO + OD = - OE + OD = OD – OE = 2a – 4b or 2(a – 2b)
(b) (i) OC = OB + BC = b + 3BA
= b + 3(a – b) = b – 3b + 3a = - 2b + 3a or 3a – 2b OC = 3a – 2b.
(ii) EC = EO + OC = -4b + (3a – 2b) = -4b – 2b + 3a = -6b + 3a or 3(a – 2b) EC = 3(a – 2b)
(c) Using results for ED and DC, we see that EC = 23 ED. This means that EC
and ED are parallel vectors. Since both vectors pass through the point E, the points E, D and C must lie on a straight line.
Example 1.6
S.3 Mathematics Page 10
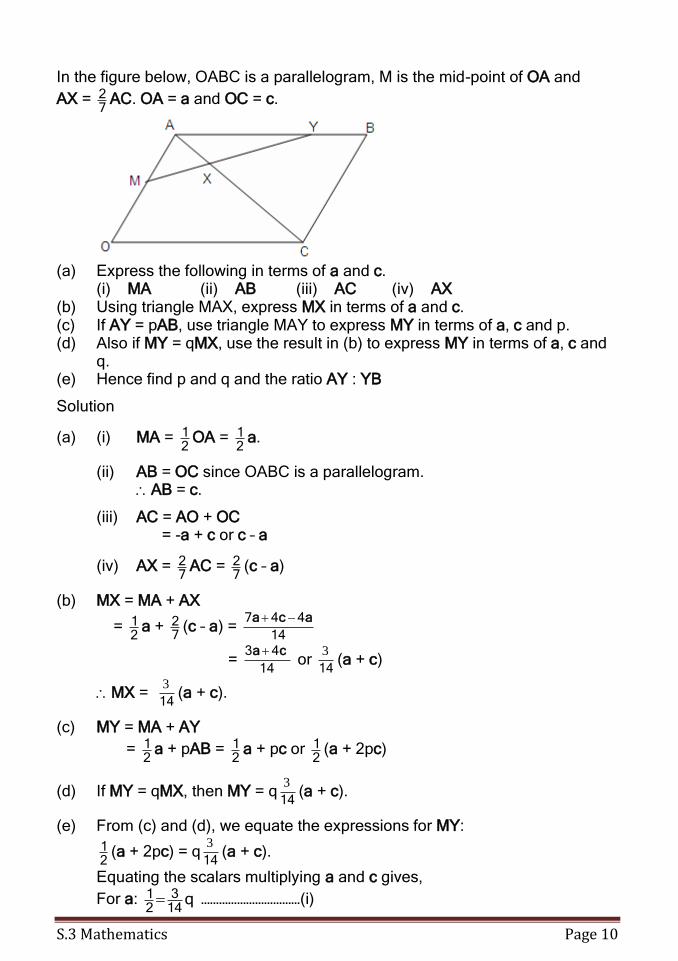
In the figure below, OABC is a parallelogram, M is the mid-point of OA and
AX = 72 AC. OA = a and OC = c.
(a) Express the following in terms of a and c. (i) MA (ii) AB (iii) AC (iv) AX (b) Using triangle MAX, express MX in terms of a and c. (c) If AY = pAB, use triangle MAY to express MY in terms of a, c and p. (d) Also if MY = qMX, use the result in (b) to express MY in terms of a, c and
q. (e) Hence find p and q and the ratio AY : YB
Solution
(a) (i) MA = 21 OA =
21 a.
(ii) AB = OC since OABC is a parallelogram. AB = c.
(iii) AC = AO + OC = -a + c or c – a
(iv) AX = 72 AC =
72 (c – a)
(b) MX = MA + AX
= 21 a +
72 (c – a) =
14
447 aca
= 14
43 ca or
14
3(a + c)
MX = 14
3(a + c).
(c) MY = MA + AY
= 21 a + pAB =
21 a + pc or
21 (a + 2pc)
(d) If MY = qMX, then MY = q14
3(a + c).
(e) From (c) and (d), we equate the expressions for MY:
21 (a + 2pc) = q
14
3(a + c).
Equating the scalars multiplying a and c gives,
For a: q143
21 ……………………………(i)
S.3 Mathematics Page 11
For c: p = 14
3q ………………………….(ii)
From (i), q = 37 .
Substituting for q into (ii) gives,
P = 37 ×
14
3 =
21
Hence, AY = 21 AB and AY : YB = 1:1
Exercise 1.1
Make sketches where necessary.
1. Using the figure below represent each of the following by a single vector.
(a) PQ + QR (b) PR + RS (c) PS + ST (d) PR + RT (e) PQ + QR + RS (f) PQ + QT + TS (g) PQ + QR + RS (h) PQ + QT + TR + RS
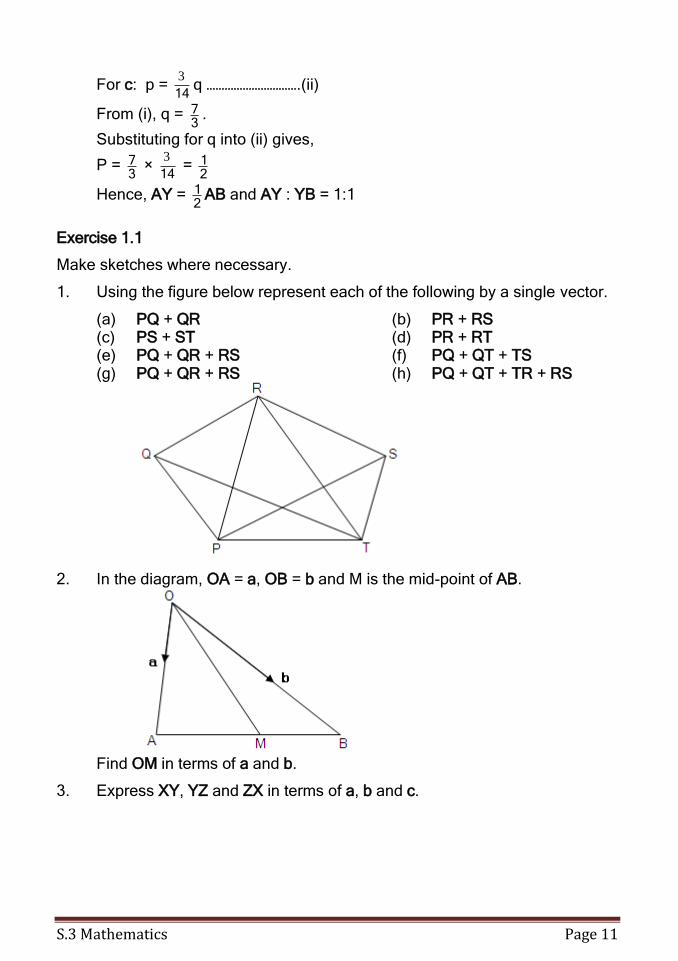
2. In the diagram, OA = a, OB = b and M is the mid-point of AB.
Find OM in terms of a and b.
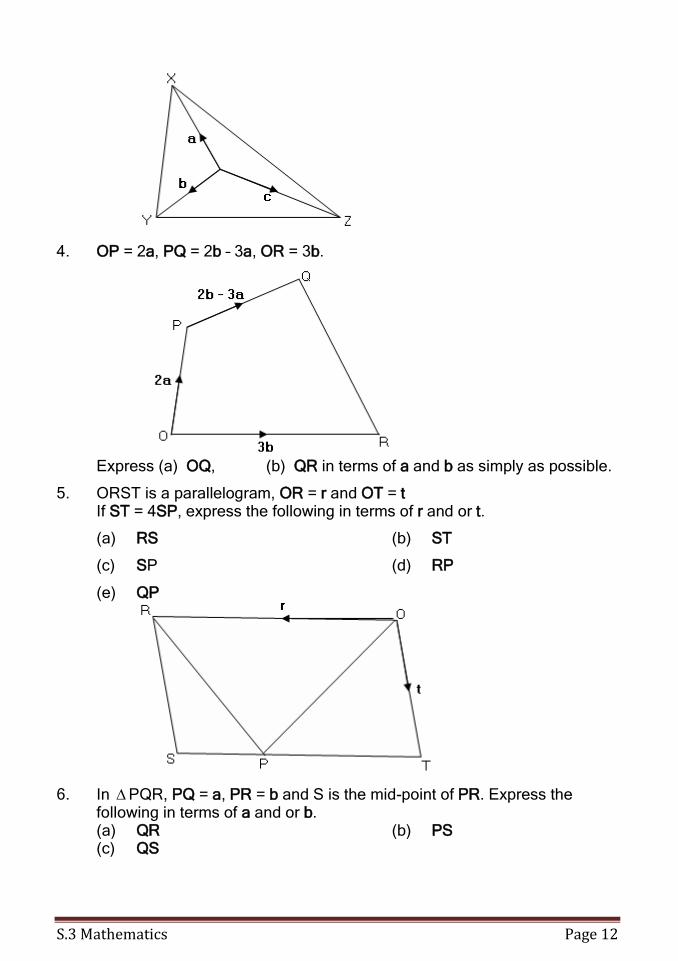
3. Express XY, YZ and ZX in terms of a, b and c.
S.3 Mathematics Page 12
4. OP = 2a, PQ = 2b – 3a, OR = 3b.
Express (a) OQ, (b) QR in terms of a and b as simply as possible.
5. ORST is a parallelogram, OR = r and OT = t If ST = 4SP, express the following in terms of r and or t.
(a) RS (b) ST
(c) SP (d) RP
(e) QP
6. In PQR, PQ = a, PR = b and S is the mid-point of PR. Express the following in terms of a and or b.
(a) QR (b) PS (c) QS
S.3 Mathematics Page 13
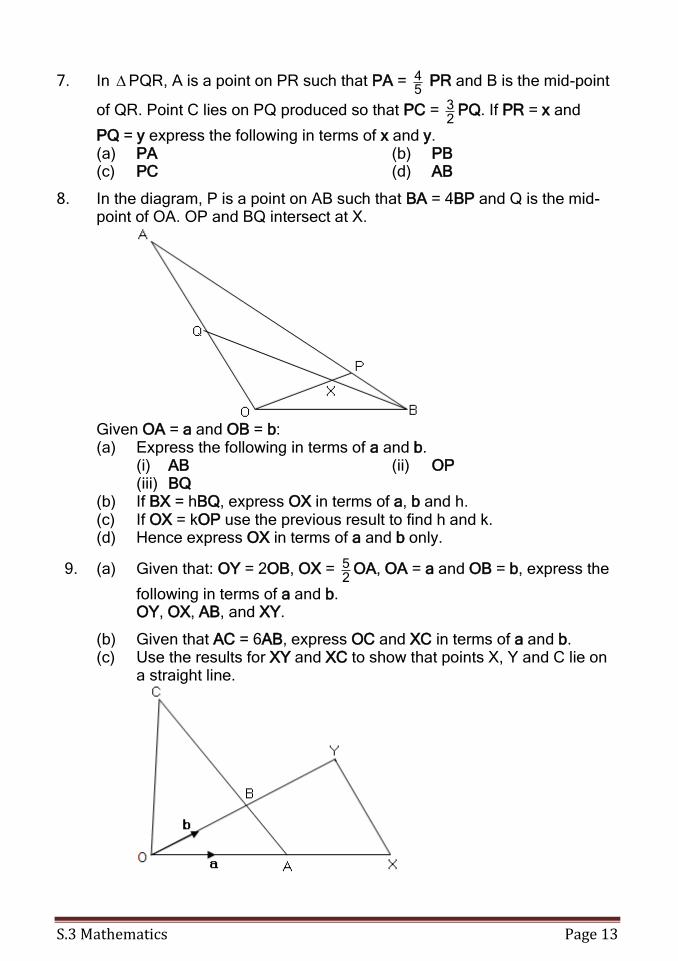
7. In PQR, A is a point on PR such that PA = 54 PR and B is the mid-point
of QR. Point C lies on PQ produced so that PC = 23 PQ. If PR = x and
PQ = y express the following in terms of x and y. (a) PA (b) PB (c) PC (d) AB
8. In the diagram, P is a point on AB such that BA = 4BP and Q is the mid-point of OA. OP and BQ intersect at X.
Given OA = a and OB = b: (a) Express the following in terms of a and b. (i) AB (ii) OP (iii) BQ
(b) If BX = hBQ, express OX in terms of a, b and h. (c) If OX = kOP use the previous result to find h and k. (d) Hence express OX in terms of a and b only.
9. (a) Given that: OY = 2OB, OX = 25 OA, OA = a and OB = b, express the
following in terms of a and b. OY, OX, AB, and XY.
(b) Given that AC = 6AB, express OC and XC in terms of a and b. (c) Use the results for XY and XC to show that points X, Y and C lie on
a straight line.
S.3 Mathematics Page 14
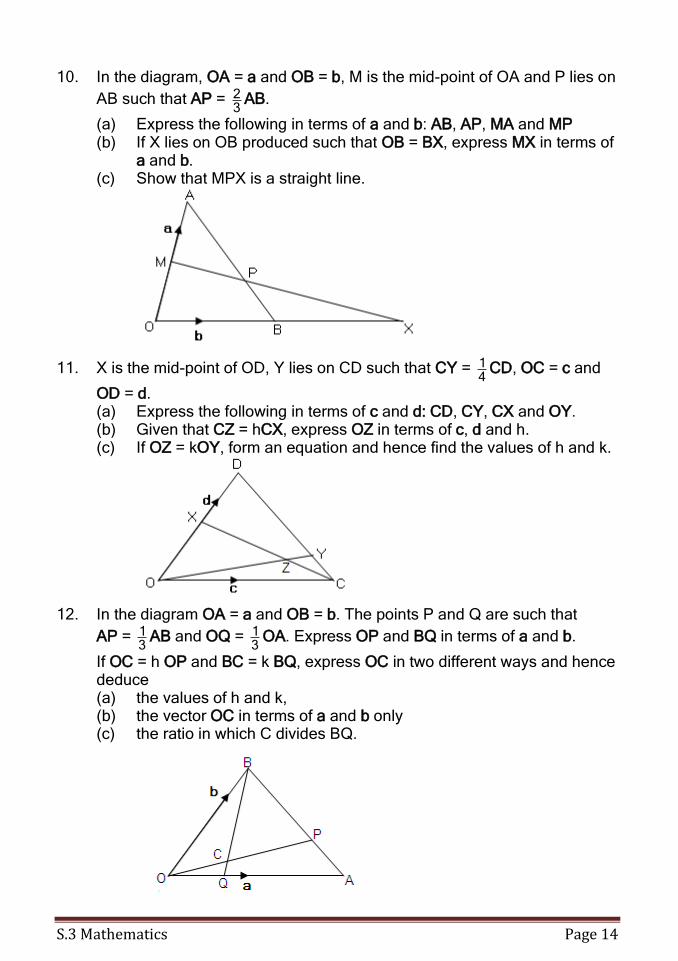
10. In the diagram, OA = a and OB = b, M is the mid-point of OA and P lies on
AB such that AP = 32 AB.
(a) Express the following in terms of a and b: AB, AP, MA and MP (b) If X lies on OB produced such that OB = BX, express MX in terms of
a and b. (c) Show that MPX is a straight line.
11. X is the mid-point of OD, Y lies on CD such that CY = 41 CD, OC = c and
OD = d. (a) Express the following in terms of c and d: CD, CY, CX and OY. (b) Given that CZ = hCX, express OZ in terms of c, d and h. (c) If OZ = kOY, form an equation and hence find the values of h and k.
12. In the diagram OA = a and OB = b. The points P and Q are such that
AP = 31 AB and OQ =
31 OA. Express OP and BQ in terms of a and b.
If OC = h OP and BC = k BQ, express OC in two different ways and hence deduce (a) the values of h and k, (b) the vector OC in terms of a and b only (c) the ratio in which C divides BQ.
S.3 Mathematics Page 15
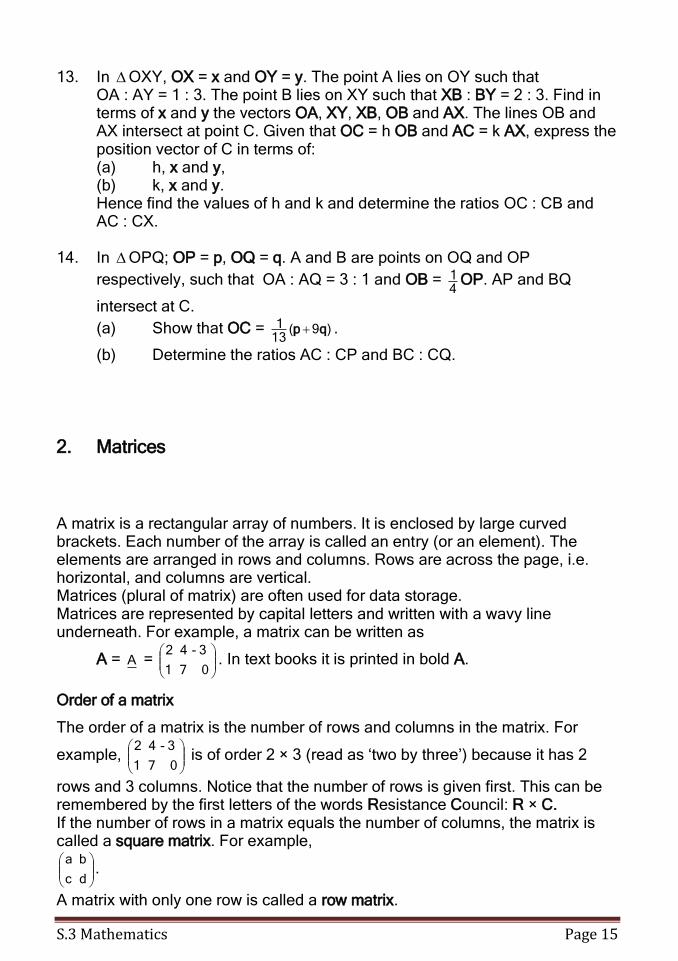
13. In OXY, OX = x and OY = y. The point A lies on OY such that OA : AY = 1 : 3. The point B lies on XY such that XB : BY = 2 : 3. Find in terms of x and y the vectors OA, XY, XB, OB and AX. The lines OB and AX intersect at point C. Given that OC = h OB and AC = k AX, express the position vector of C in terms of: (a) h, x and y, (b) k, x and y. Hence find the values of h and k and determine the ratios OC : CB and AC : CX.
14. In OPQ; OP = p, OQ = q. A and B are points on OQ and OP
respectively, such that OA : AQ = 3 : 1 and OB = 41 OP. AP and BQ
intersect at C.
(a) Show that OC = )9(131 qp .
(b) Determine the ratios AC : CP and BC : CQ.
2. Matrices
A matrix is a rectangular array of numbers. It is enclosed by large curved brackets. Each number of the array is called an entry (or an element). The elements are arranged in rows and columns. Rows are across the page, i.e. horizontal, and columns are vertical. Matrices (plural of matrix) are often used for data storage. Matrices are represented by capital letters and written with a wavy line underneath. For example, a matrix can be written as
A = A =
071
3-42. In text books it is printed in bold A.
Order of a matrix
The order of a matrix is the number of rows and columns in the matrix. For
example,
071
3-42 is of order 2 × 3 (read as ‘two by three’) because it has 2
rows and 3 columns. Notice that the number of rows is given first. This can be remembered by the first letters of the words Resistance Council: R × C. If the number of rows in a matrix equals the number of columns, the matrix is called a square matrix. For example,
dc
ba.
A matrix with only one row is called a row matrix.
S.3 Mathematics Page 16
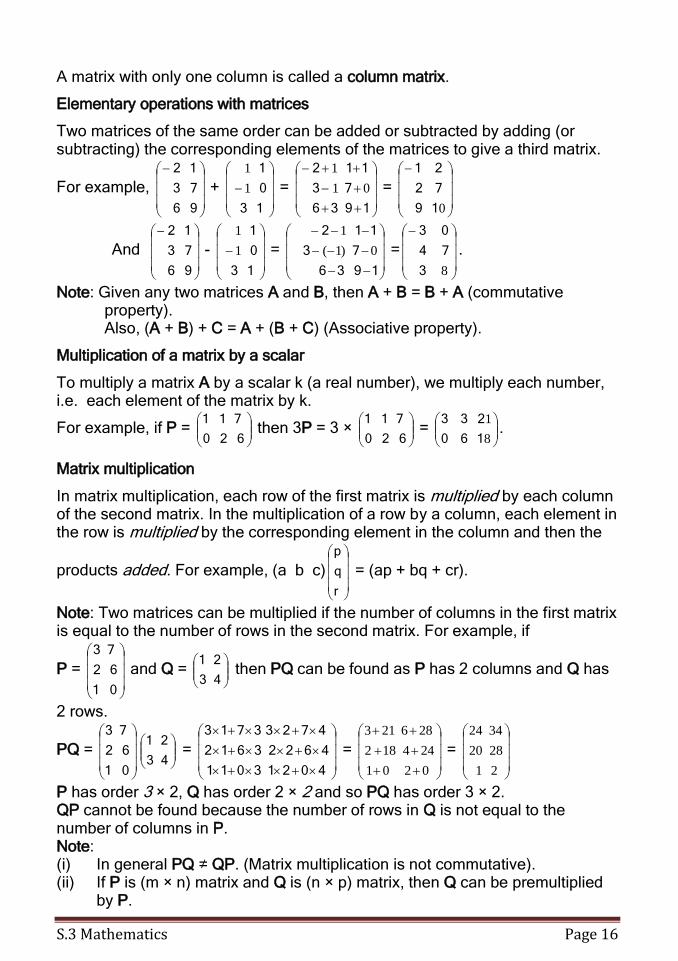
A matrix with only one column is called a column matrix.
Elementary operations with matrices
Two matrices of the same order can be added or subtracted by adding (or subtracting) the corresponding elements of the matrices to give a third matrix.
For example,
96
73
12
+
13
0
1
1
1
=
1936
73
112
01
1
=
019
72
21
And
96
73
12
-
13
0
1
1
1
=
1936
73
112
0)1(
1
=
83
74
03
.
Note: Given any two matrices A and B, then A + B = B + A (commutative property).
Also, (A + B) + C = A + (B + C) (Associative property).
Multiplication of a matrix by a scalar
To multiply a matrix A by a scalar k (a real number), we multiply each number, i.e. each element of the matrix by k.
For example, if P =
620
711 then 3P = 3 ×
620
711 =
8
1
160
233.
Matrix multiplication
In matrix multiplication, each row of the first matrix is multiplied by each column of the second matrix. In the multiplication of a row by a column, each element in the row is multiplied by the corresponding element in the column and then the
products added. For example, (a b c)
r
q
p
= (ap + bq + cr).
Note: Two matrices can be multiplied if the number of columns in the first matrix is equal to the number of rows in the second matrix. For example, if
P =
01
62
73
and Q =
43
21 then PQ can be found as P has 2 columns and Q has
2 rows.
PQ =
01
62
73
43
21 =
40213011
46223612
47233713
=
0201
244182
286213
=
21
2820
3424
P has order 3 × 2, Q has order 2 × 2 and so PQ has order 3 × 2. QP cannot be found because the number of rows in Q is not equal to the number of columns in P. Note: (i) In general PQ ≠ QP. (Matrix multiplication is not commutative). (ii) If P is (m × n) matrix and Q is (n × p) matrix, then Q can be premultiplied
by P.
S.3 Mathematics Page 17
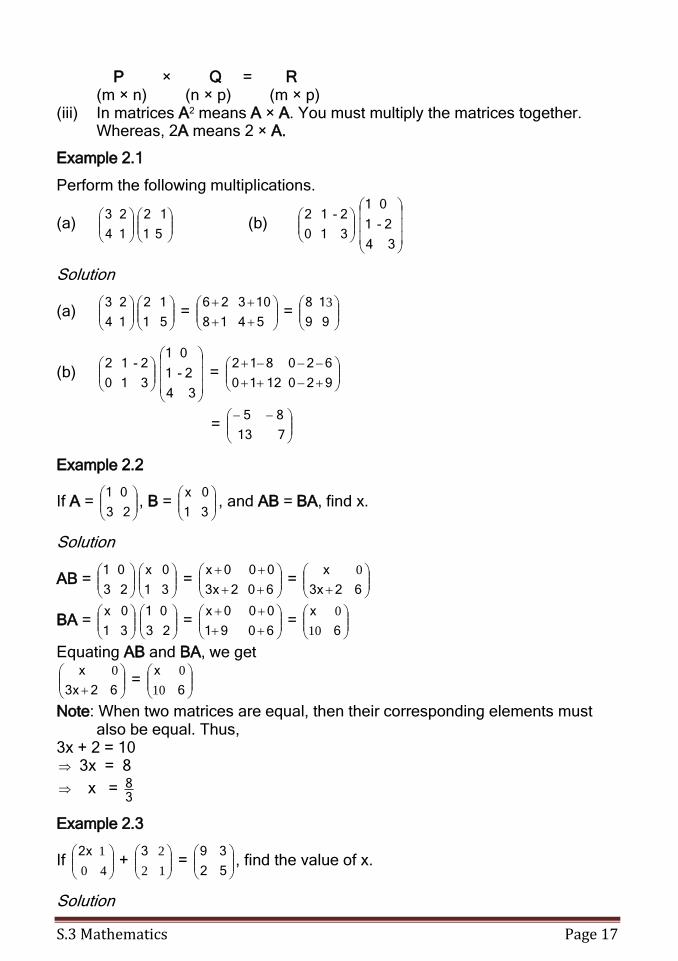
P × Q = R (m × n) (n × p) (m × p) (iii) In matrices A2 means A × A. You must multiply the matrices together. Whereas, 2A means 2 × A.
Example 2.1
Perform the following multiplications.
(a)
14
23
51
12 (b)
310
2-12
34
2-1
01
Solution
(a)
14
23
51
12 =
5418
10326 =
99
18 3
(b)
310
2-12
34
2-1
01
=
9201210
620812
=
713
85
Example 2.2
If A =
23
01, B =
31
0x, and AB = BA, find x.
Solution
AB =
23
01
31
0x =
6023x
000x =
623x
x 0
BA =
31
0x
23
01 =
6091
000x =
6
x
10
0
Equating AB and BA, we get
623x
x 0 =
6
x
10
0
Note: When two matrices are equal, then their corresponding elements must also be equal. Thus,
3x + 2 = 10 3x = 8
x = 38
Example 2.3
If
40
12x +
12
23 =
52
39, find the value of x.
Solution
S.3 Mathematics Page 18
40
12x +
12
23 =
52
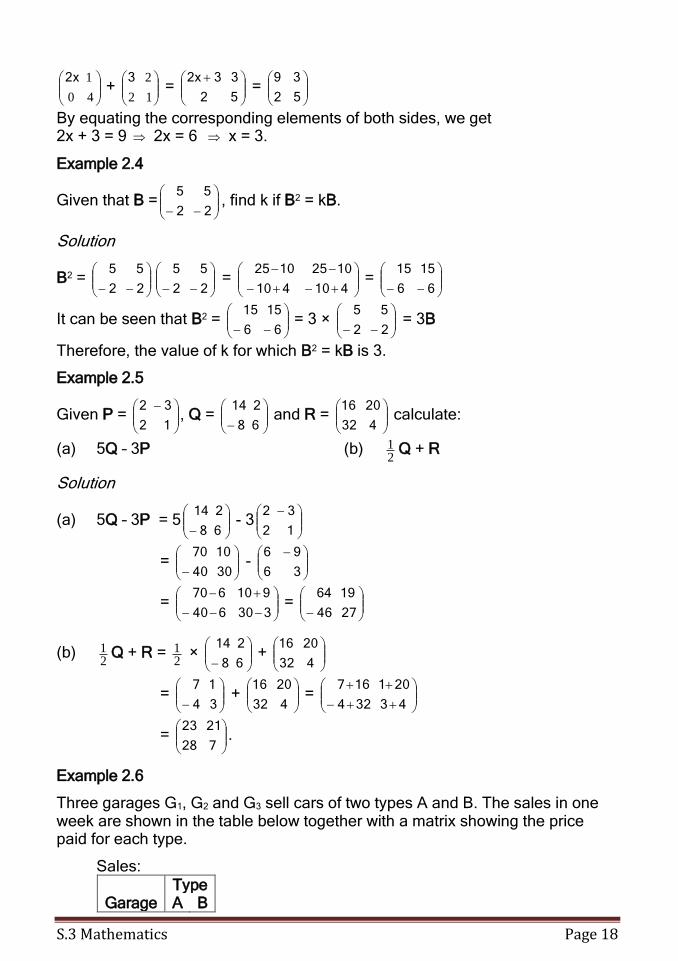
332x =
52
39
By equating the corresponding elements of both sides, we get 2x + 3 = 9 2x = 6 x = 3.
Example 2.4
Given that B =
22
55, find k if B2 = kB.
Solution
B2 =
22
55
22
55 =
410410
10251025 =
66
1515
It can be seen that B2 =
66
1515 = 3 ×
22
55 = 3B
Therefore, the value of k for which B2 = kB is 3.
Example 2.5
Given P =
12
32, Q =
68
214 and R =
432
2016 calculate:
(a) 5Q – 3P (b) 21 Q + R
Solution
(a) 5Q – 3P = 5
68
214 - 3
12
32
=
3040
1070 -
36
96
=
330640
910670 =
2746
1964
(b) 21 Q + R =
21 ×
68
214 +
432
2016
=
34
17 +
432
2016 =
43324
201167
=
728
2123.
Example 2.6
Three garages G1, G2 and G3 sell cars of two types A and B. The sales in one week are shown in the table below together with a matrix showing the price paid for each type.
Sales: Type
Garage A B
S.3 Mathematics Page 19
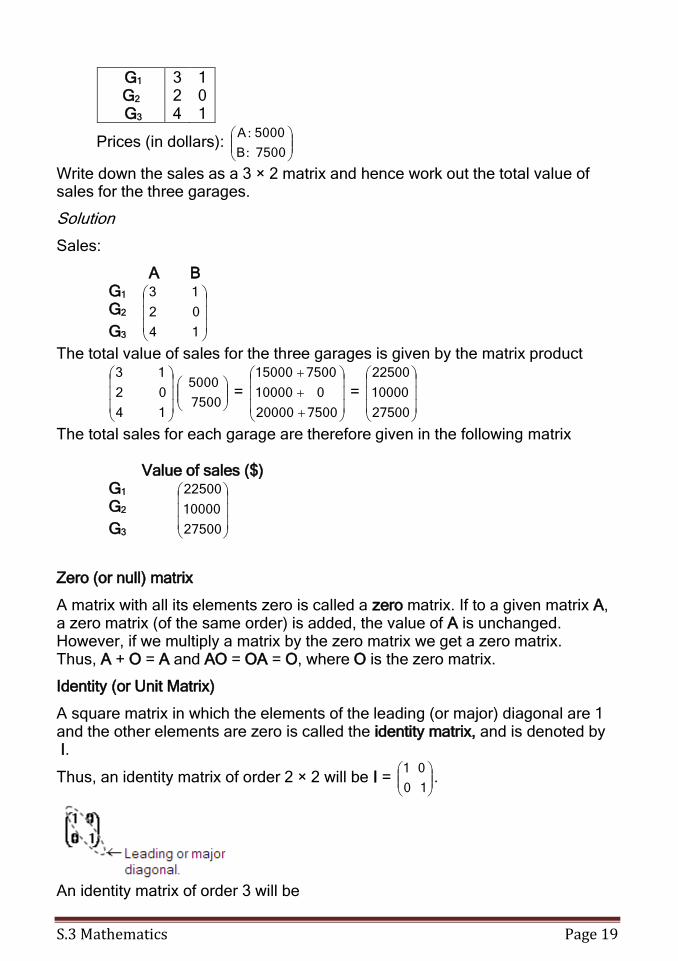
G1 3 1 G2 2 0 G3 4 1
Prices (in dollars):
7500B
5000A
:
:
Write down the sales as a 3 × 2 matrix and hence work out the total value of sales for the three garages.
Solution
Sales:
A B G1
14
02
13
G2
G3
The total value of sales for the three garages is given by the matrix product
14
02
13
7500
5000 =
750020000
010000
750015000
=
27500
10000
22500
The total sales for each garage are therefore given in the following matrix
Value of sales ($) G1
27500
10000
22500
G2
G3
Zero (or null) matrix
A matrix with all its elements zero is called a zero matrix. If to a given matrix A, a zero matrix (of the same order) is added, the value of A is unchanged. However, if we multiply a matrix by the zero matrix we get a zero matrix. Thus, A + O = A and AO = OA = O, where O is the zero matrix.
Identity (or Unit Matrix)
A square matrix in which the elements of the leading (or major) diagonal are 1 and the other elements are zero is called the identity matrix, and is denoted by I.
Thus, an identity matrix of order 2 × 2 will be I =
10
01.
An identity matrix of order 3 will be
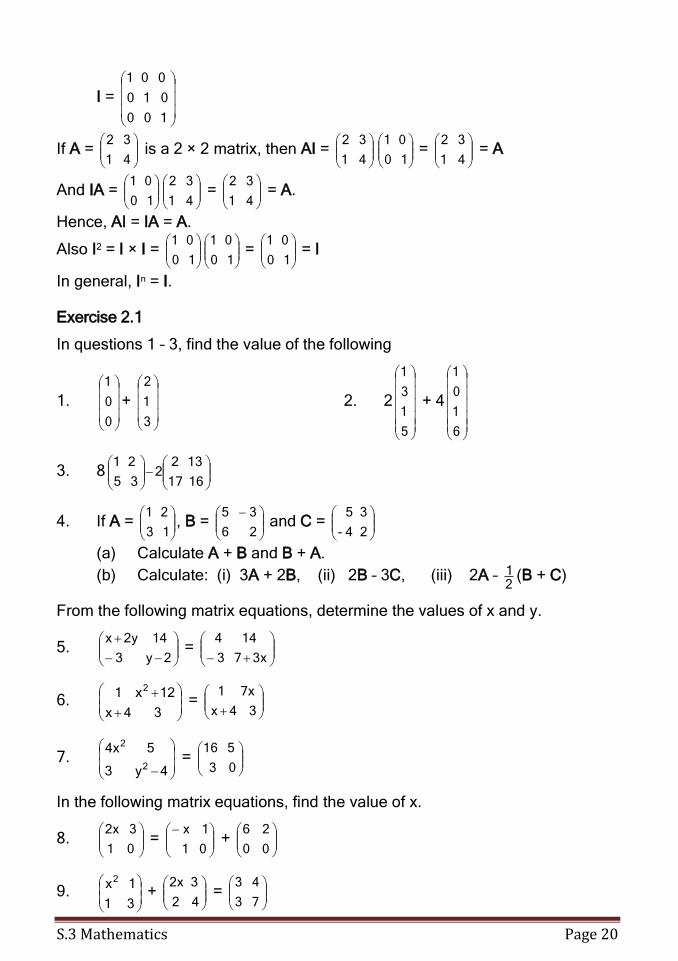
S.3 Mathematics Page 20
I =
100
010
001
If A =
41
32 is a 2 × 2 matrix, then AI =
41
32
10
01 =
41
32 = A
And IA =
10
01
41
32 =
41
32 = A.
Hence, AI = IA = A.
Also I2 = I × I =
10
01
10
01 =
10
01 = I
In general, In = I.
Exercise 2.1
In questions 1 – 3, find the value of the following
1.
0
0
1
+
3
1
2
2. 2
5
1
3
1
+ 4
6
1
0
1
3. 8
1617
1322
35
21
4. If A =
13
21, B =
26
35 and C =
24-
35
(a) Calculate A + B and B + A.
(b) Calculate: (i) 3A + 2B, (ii) 2B – 3C, (iii) 2A – 21 (B + C)
From the following matrix equations, determine the values of x and y.
5.
2y3
142yx =
3x73
144
6.
34x
12x1 2
=
34x
7x1
7.
4y3
54x
2
2
=
03
516
In the following matrix equations, find the value of x.
8.
01
32x =
01
1x +
00
26
9.
31
1x2
+
42
32x =
73
43
S.3 Mathematics Page 21
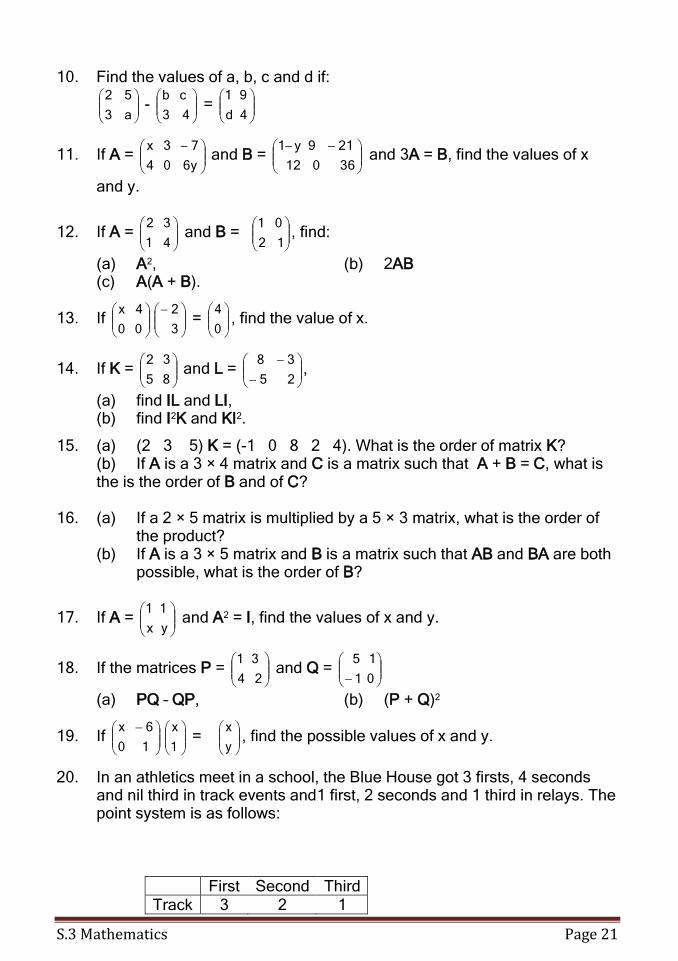
10. Find the values of a, b, c and d if:
a3
52 -
43
cb =
4d
91
11. If A =
6y04
73x and B =
36012
219y1 and 3A = B, find the values of x
and y.
12. If A =
41
32 and B =
12
01, find:
(a) A2, (b) 2AB (c) A(A + B).
13. If
00
4x
3
2 =
0
4, find the value of x.
14. If K =
85
32 and L =
25
38,
(a) find IL and LI, (b) find I2K and KI2.
15. (a) (2 3 5) K = (-1 0 8 2 4). What is the order of matrix K? (b) If A is a 3 × 4 matrix and C is a matrix such that A + B = C, what is
the is the order of B and of C?
16. (a) If a 2 × 5 matrix is multiplied by a 5 × 3 matrix, what is the order of the product?
(b) If A is a 3 × 5 matrix and B is a matrix such that AB and BA are both possible, what is the order of B?
17. If A =
yx
11 and A2 = I, find the values of x and y.
18. If the matrices P =
24
31 and Q =
01
15
(a) PQ – QP, (b) (P + Q)2
19. If
10
6x
1
x =
y
x, find the possible values of x and y.
20. In an athletics meet in a school, the Blue House got 3 firsts, 4 seconds and nil third in track events and1 first, 2 seconds and 1 third in relays. The point system is as follows:
First Second Third Track 3 2 1
S.3 Mathematics Page 22
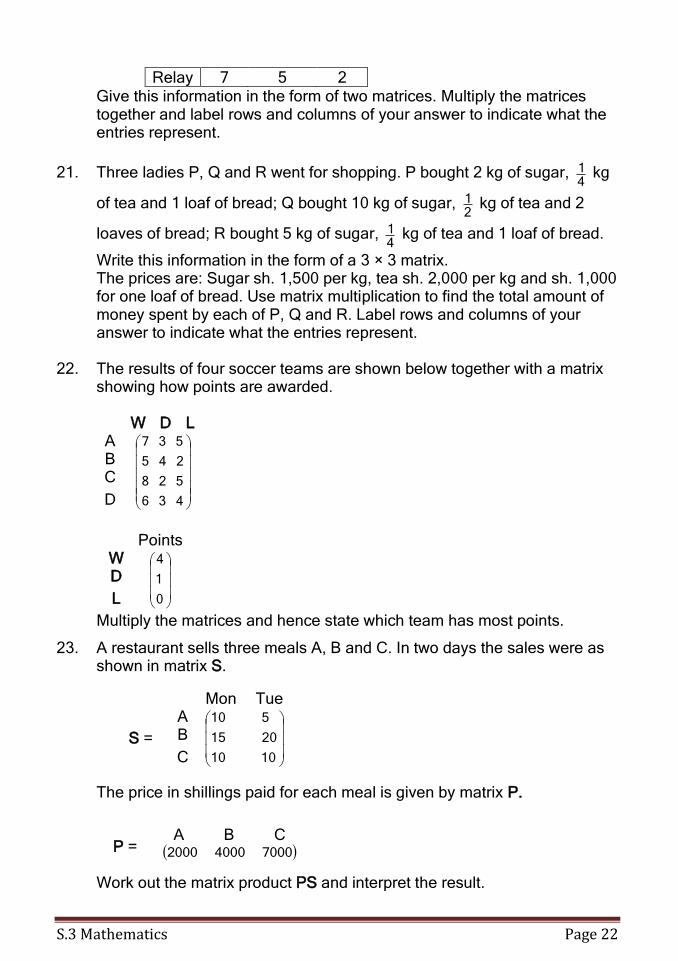
Relay 7 5 2 Give this information in the form of two matrices. Multiply the matrices
together and label rows and columns of your answer to indicate what the entries represent.
21. Three ladies P, Q and R went for shopping. P bought 2 kg of sugar, 41 kg
of tea and 1 loaf of bread; Q bought 10 kg of sugar, 21 kg of tea and 2
loaves of bread; R bought 5 kg of sugar, 41 kg of tea and 1 loaf of bread.
Write this information in the form of a 3 × 3 matrix. The prices are: Sugar sh. 1,500 per kg, tea sh. 2,000 per kg and sh. 1,000
for one loaf of bread. Use matrix multiplication to find the total amount of money spent by each of P, Q and R. Label rows and columns of your answer to indicate what the entries represent.
22. The results of four soccer teams are shown below together with a matrix
showing how points are awarded.
W D L A
436
528
245
537
B C
D
Points
W
0
1
4
D
L
Multiply the matrices and hence state which team has most points.
23. A restaurant sells three meals A, B and C. In two days the sales were as shown in matrix S.
S = The price in shillings paid for each meal is given by matrix P. P = Work out the matrix product PS and interpret the result.
Mon Tue A
1010
2015
510
B
C
A B C 700040002000
S.3 Mathematics Page 23
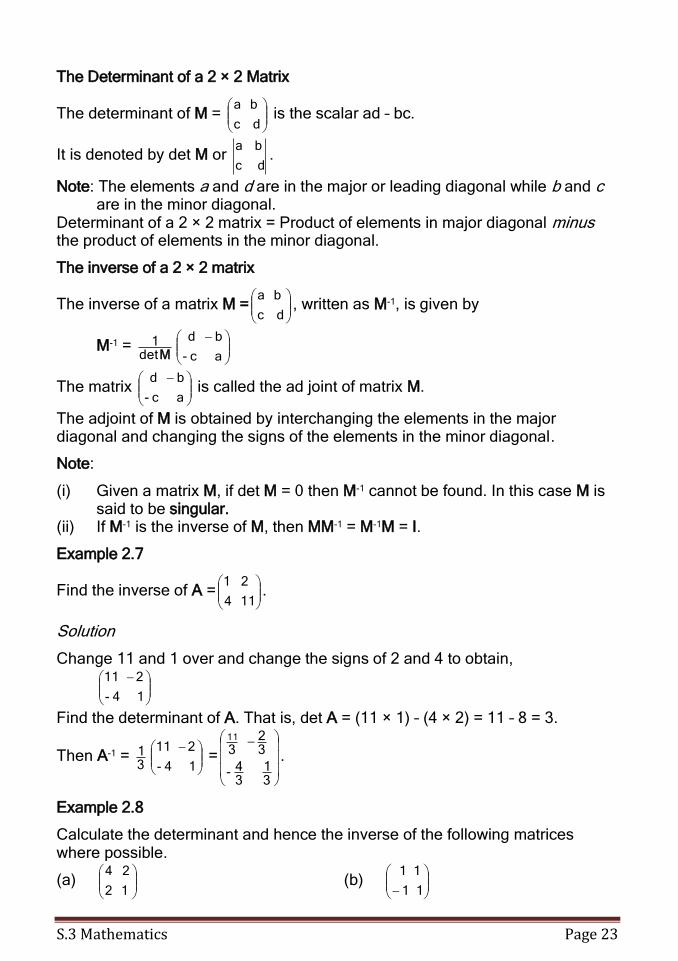
The Determinant of a 2 × 2 Matrix
The determinant of M =
dc
ba is the scalar ad – bc.
It is denoted by det M or dc
ba.
Note: The elements a and d are in the major or leading diagonal while b and c are in the minor diagonal.
Determinant of a 2 × 2 matrix = Product of elements in major diagonal minus the product of elements in the minor diagonal.
The inverse of a 2 × 2 matrix
The inverse of a matrix M =
dc
ba, written as M-1, is given by
M-1 = Mdet
1
ac-
bd
The matrix
ac-
bd is called the ad joint of matrix M.
The adjoint of M is obtained by interchanging the elements in the major diagonal and changing the signs of the elements in the minor diagonal.
Note:
(i) Given a matrix M, if det M = 0 then M-1 cannot be found. In this case M is said to be singular.
(ii) If M-1 is the inverse of M, then MM-1 = M-1M = I.
Example 2.7
Find the inverse of A =
114
21.
Solution
Change 11 and 1 over and change the signs of 2 and 4 to obtain,
14-
211
Find the determinant of A. That is, det A = (11 × 1) – (4 × 2) = 11 – 8 = 3.
Then A-1 = 31
14-
211 =
31
34-
32
311
.
Example 2.8
Calculate the determinant and hence the inverse of the following matrices where possible.
(a)
12
24 (b)
11
11
S.3 Mathematics Page 24
Solution
(a) 12
24 = 4 × 1 – 2 × 2
= 4 – 4 = 0 Since the determinant is 0 the inverse cannot be found.
(b) 11-
11 = 1 × 1 – (-1) × 1
= 1 + 1 = 2
Inverse of
11
11 is
11
11
21 =
21
21
21
21
.
Note: If A, B and C are matrices such that AB = C, then A-1AB = A-1C IB = A-1C, since A-1A = I B = A-1C (IB = B).
Example 2.9
If B =
21
43 and AB = I, find A.
Solution
Since AB = I A is the inverse of B.
21
43
= 3 × (-2) – 1 × (-4)
= -6 - (-4) = -6 + 4 = -2
B-1 = 21
31-
42- =
23
21
-1 2
Therefore, A =
23
21
-1 2
.
Solution of simultaneous equations by matrix method
A pair of simultaneous equations can also be written in matrix form to obtain the required solutions.
Example 2.10
Solve the following pair of simultaneous equations: 2x – 3y = 7; 4x + 3y = 5
Solution
Expressing the equations in matrix form we have, M
S.3 Mathematics Page 25
34
32
y
x =
5
7 where M is the matrix of the coefficients.
Write down the inverse of M which is
24
33
181
Premultiply both sides of the equation by
24
33. We need not multiply by
181
as multiplying both sides by 181 does not alter the equation.
24
33
34
32
y
x =
24
33
5
7
180
018
y
x =
18-
36
18
10
01
y
x = 18
1-
2 or
18y
18x =
18-
36
10
01
y
x =
1-
2 18x = 36 x = 2
y
x =
1-
2 18y = -18 y = -1
x = 2 and y = -1
Exercise 2.2
Write down the inverse of the following matrices where possible.
1.
93
62 2.
32
75
3.
12
1
--
-2
1
4.
43-
32-
5.
10
04 6.
6
4
-3
-2
7. Find the inverse of the matrix A =
32
15and show that AA-1 = A-1A = I,
where I is the identity matrix.
8. Given P =
3-
-3
2
4, find matrix A, given that AP = I, where I is the identity
matrix. Find the values of x and y in Q 9 – 12:
9.
0
1 =
y
x
31
22 10. ( )yx
21
32 = ( )53
S.3 Mathematics Page 26
11.
4
7
21
32 =
y
x 12.
y
x
42
21 =
2
1
13. Find the inverse of
22
35 and hence solve the simultaneous equations:
5x + 3y = 7, 2x + 2y = 2.
14. A =
23
45 and B =
48
36.
(a) Calculate the determinant of the matrices A and B. (b) Which of the matrices has an inverse? What is the inverse in this
case?
15. Given P =
11 aa
2a a is a singular matrix, find the possible values of a.
16. P =
13
12 and Q =
02
1-1. Find the determinant in each case. Find
PQ and hence show that det. (PQ) = det. (P) det. (Q).
17. A =
40
03, B =
c0
ba and AB = A + B. Find the values of a, b and c.
18. M is the matrix
54
23 and P is the matrix
2
5. Calculate the matrices
M-1 and M-1P. Hence solve the equations: 3x + 2y = 5 4x + 5y = 2.
19. Given that P =
21
32 and Q =
2-
-2
1
3, find the matrix product PQ and P-
1Q. A matrix R of order 2 × 2 is such that QR = P. Find the matrix R.
20. The determinant of matrix A is 2 and A-1 =
2211-
1-1. Find A and show
that AA-1 = I.
21. (a) Express the matrix equation
43
65
y
x =
b
a into two
simultaneous equations. (b) Express, as a matrix equation, the two simultaneous equations 5x + 6y = 25 and 3x + 4y = 17.
(c) Hence or otherwise, find the values of x and y.

S.3 Mathematics Page 27
Solve the following pairs of simultaneous equations using matrix method:
22. 2x + 3y = 7 23. 5a – 12b = 4 x + 2y = 3 4a – 7b = -2
24. 3x – 4y = 7 25. 2p + 3q = 4 4x + 6y = 15 4p + q = -2
26. -r + t = 1 27. 4x + y = 0 3r – 4t = -3 6x – y = 5
3. Matrices and Transformations
In Book 2, we discussed four types of transformations. These were translations, reflections, enlargements and rotations. There are two other transformations, namely shears and stretches. Each transformation has different properties on a Cartesian plane. In this topic we shall consider transformations of the Cartesian plane and the connection between matrices and transformations. Translations
A translation is a transformation such that the points in the object can be joined to the corresponding points in the image by a set of straight lines which are all equal in length and parallel. A translation is described by the direction and magnitude of movement (vector). Under a translation, all the points in the object move through the same distance and in the same direction. In order to obtain the image of a point under a translation we add the vector of translation to the position vector of the point.
S.3 Mathematics Page 28
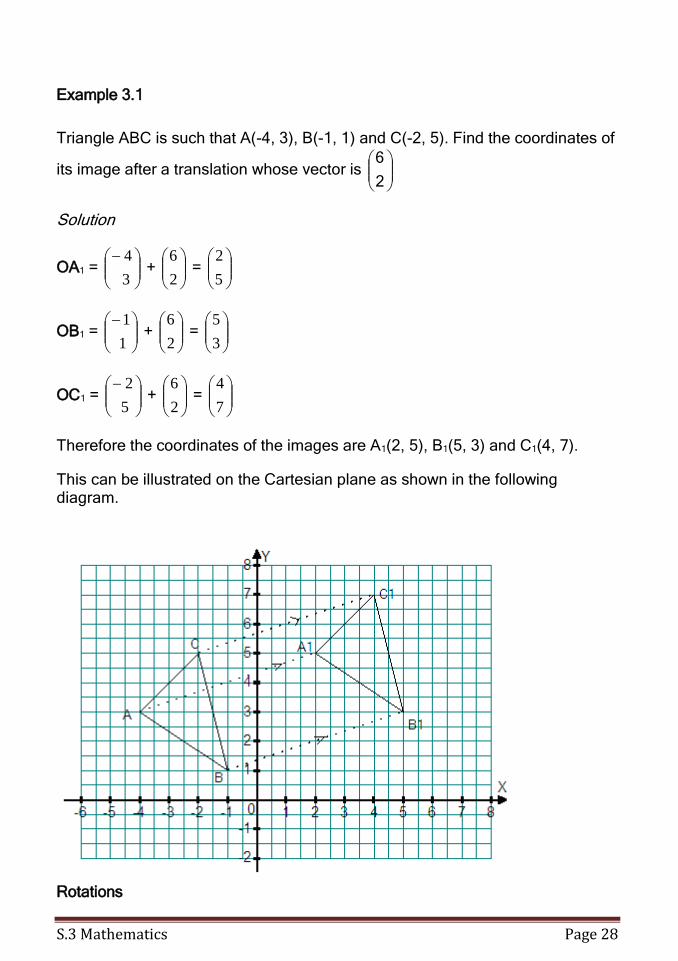
Example 3.1
Triangle ABC is such that A(-4, 3), B(-1, 1) and C(-2, 5). Find the coordinates of
its image after a translation whose vector is
2
6
Solution
OA1 =
3
4 +
2
6 =
5
2
OB1 =
1
1 +
2
6 =
3
5
OC1 =
5
2 +
2
6 =
7
4
Therefore the coordinates of the images are A1(2, 5), B1(5, 3) and C1(4, 7).
This can be illustrated on the Cartesian plane as shown in the following diagram.
Rotations

S.3 Mathematics Page 29
A rotation is a transformation of an object about a fixed point such that every point in the object turns through the same angle relative to the fixed point. A rotation is described by the angle and the centre of rotation. An anticlockwise rotation is positive while a clockwise rotation is negative. When an object undergoes a rotation: (a) a point and its image are equidistant from the centre of rotation. (b) each point of an object moves along an arc of a circle whose centre is the
centre of rotation. (c) only the centre of rotation remains fixed. (d) the perpendicular bisector of a line joining a point and its image passes
through the centre of rotation. (e) the object and its image are directly congruent.
Example 3.2
A triangle has A(2, 2), B(2, 5) and C(4, 5) as its vertices. Find the coordinates of its image when rotated through 900 anticlockwise about the origin. Solution
In order to find the coordinates of the image, join O to A to make line OA. From line OA measure an angle 900 and mark point A1 such that OA = OA1. Repeat this process with points B and C to get points B1 and C1. Join points A1, B1 and C1 to get the image of triangle ABC. The coordinates of the vertices of the image are A1(-2, 2), B1(-5, 2) and C1(-5, 4).
Reflections
Under a reflection:

S.3 Mathematics Page 30
(a) a point and its image are equidistant from the mirror line. (b) the mirror line is a perpendicular bisector of the line joining a point and its
image. (c) points on the mirror line are invariant. (d) an object and its image are indirectly congruent.
In the Cartesian plane, a reflection is described by stating the equation of the mirror line. Example 3.3
Triangle PQR is such that P(-2, 1), Q(-3, 3) and R(2, 2) are the vertices. Find the coordinates of its image under a reflection in the line x = 2. Solution
When the triangle is reflected on the line x = 2, the coordinates of the image are P1(6, 1), Q1(7, 5) and R1(2, 2). R lies on the mirror line and is invariant
Enlargements
Enlargement is described by stating the centre of enlargement and the scale factor. The enlargement scale factor can be negative or positive.
The ratio centrefromdistanceobject
centrefromdistanceimage is called the scale factor.
S.3 Mathematics Page 31
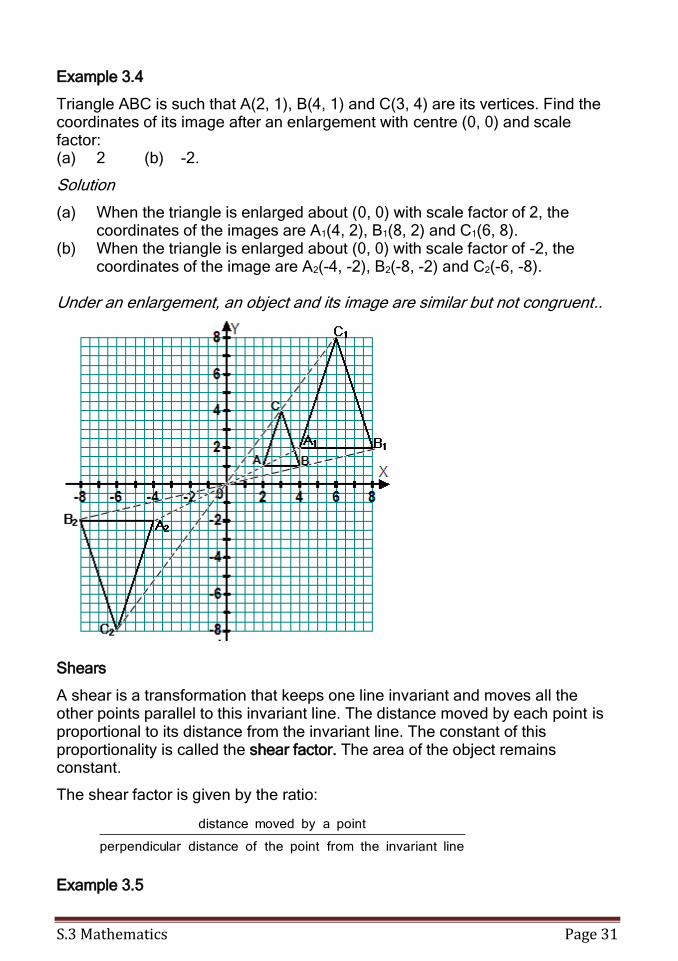
Example 3.4
Triangle ABC is such that A(2, 1), B(4, 1) and C(3, 4) are its vertices. Find the coordinates of its image after an enlargement with centre (0, 0) and scale factor: (a) 2 (b) -2.
Solution
(a) When the triangle is enlarged about (0, 0) with scale factor of 2, the coordinates of the images are A1(4, 2), B1(8, 2) and C1(6, 8).
(b) When the triangle is enlarged about (0, 0) with scale factor of -2, the coordinates of the image are A2(-4, -2), B2(-8, -2) and C2(-6, -8).
Under an enlargement, an object and its image are similar but not congruent..
Shears
A shear is a transformation that keeps one line invariant and moves all the other points parallel to this invariant line. The distance moved by each point is proportional to its distance from the invariant line. The constant of this proportionality is called the shear factor. The area of the object remains constant.
The shear factor is given by the ratio:
lineinvariantthefrompointtheofdistancelarperpendicu
pointabymoveddistance
Example 3.5
S.3 Mathematics Page 32
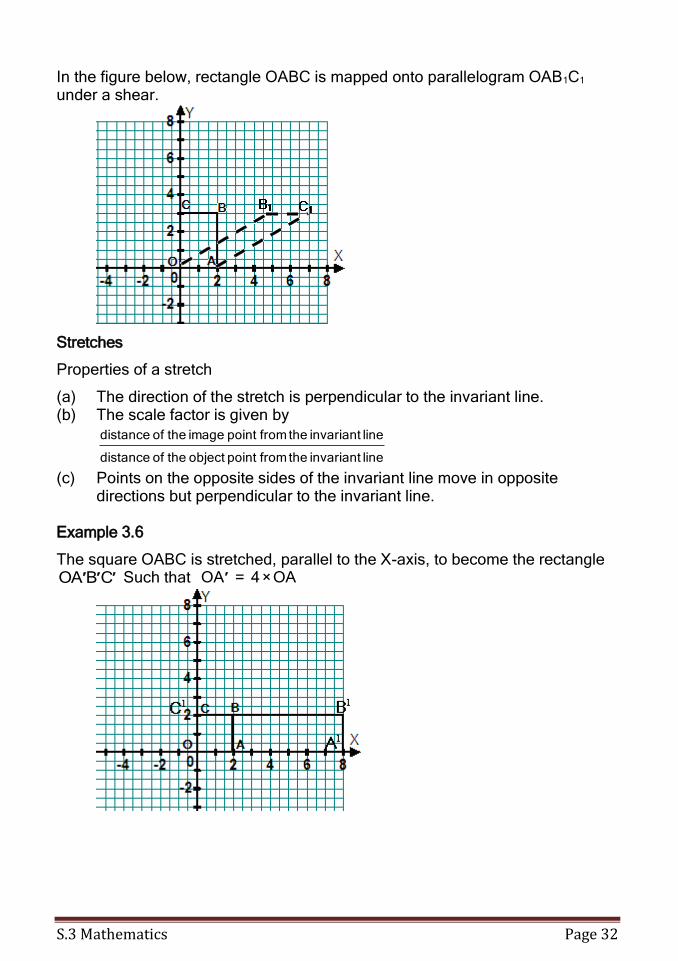
In the figure below, rectangle OABC is mapped onto parallelogram OAB1C1 under a shear.
Stretches
Properties of a stretch
(a) The direction of the stretch is perpendicular to the invariant line. (b) The scale factor is given by
line invariant the frompoint object the of distance
line invariant the frompoint image the of distance
(c) Points on the opposite sides of the invariant line move in opposite directions but perpendicular to the invariant line.
Example 3.6
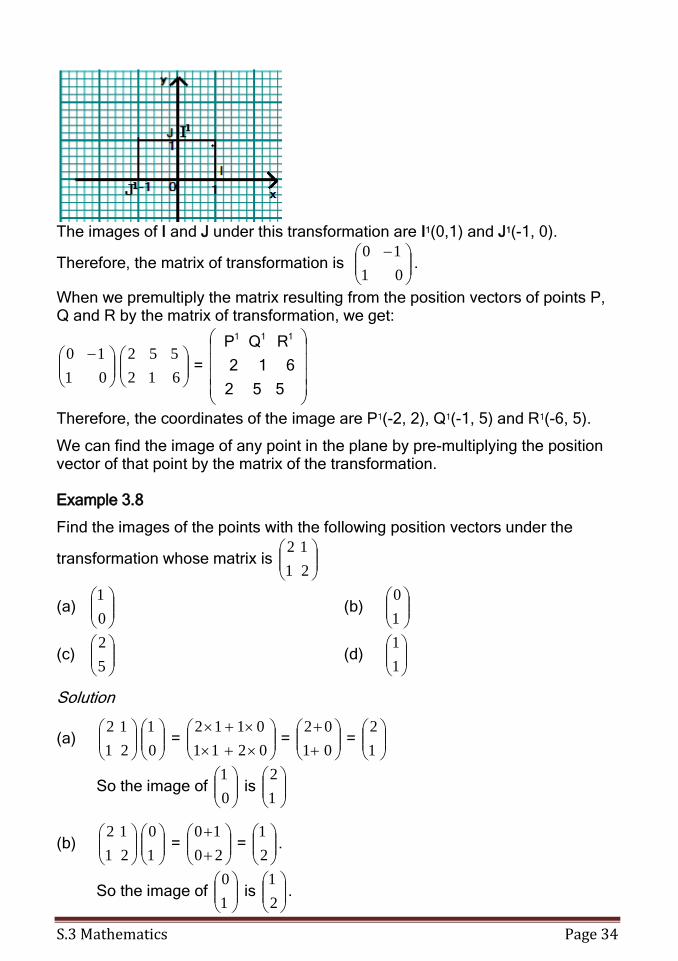
The square OABC is stretched, parallel to the X-axis, to become the rectangle CBAO ′′′ Such that OA×4=AO ′
S.3 Mathematics Page 33
Transformation matrices
Matrices can be used to represent transformations. In the x-y plane, we use 2×2 matrices to represent transformations. The matrices can be determined by the use of the identity matrix or calculations.
The identity matrix
Consider the unit square OIKJ with coordinates O(0, 0), I(1, 0), K(1, 1) and
J(0, 1). When the position vectors I =
0
1 and J =
1
0 are written in matrix
form,
they give the identity matrix I =
10
01 . In this matrix, the first column is the
position vector of I and the second column is the position vector of J.
Consider a reflection of the unit square in the x-axis. Point I(1, 0) is mapped Onto I1(1, 0). Point J(0, 1) is mapped onto J1(0, -1). Point O(0, 0) is mapped onto O1(0, 0) and point K(1, 1) is mapped onto K1(-1, -1).
The position vectors of I1 =
0
1 and J1 =
1
0 form the matrix
10
01
When the position vectors of the unit square are premultiplied by
10
01 we
get,
10
01
1100
1010 =
1100
1010
1111 KJIO
The result is the matrix formed by the position vectors of the images of the unit
square under reflection in the x-axis. This means that
10
01 represents a
reflection in the x-axis.
In order to determine a matrix of transformation, we need to know the kind of transformation it is, find the images of points I and J under that transformation, and then write their position vectors in matrix form. Example 3.7
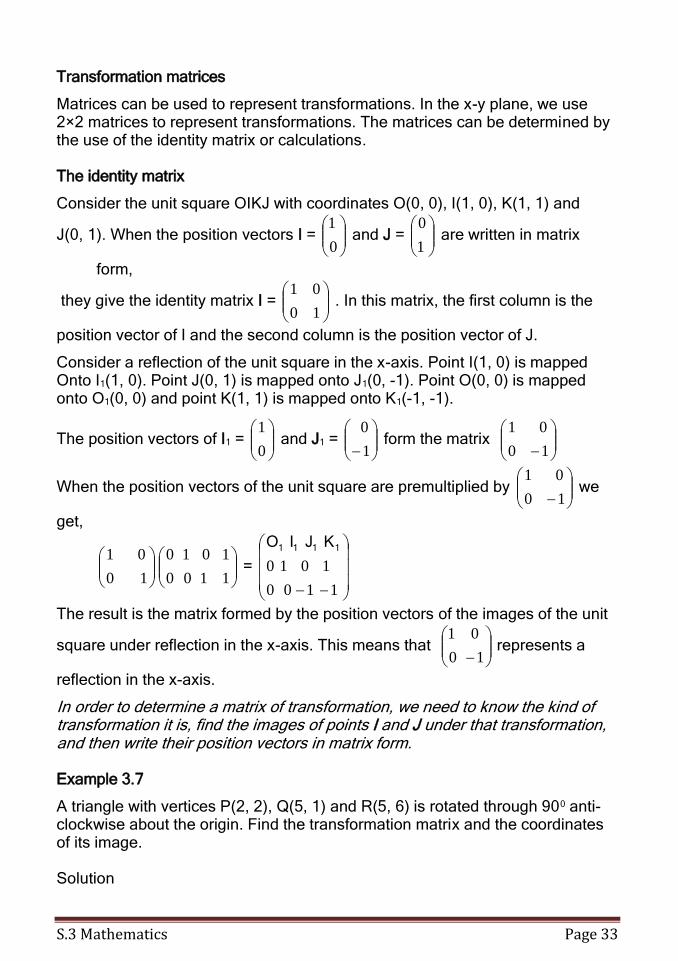
A triangle with vertices P(2, 2), Q(5, 1) and R(5, 6) is rotated through 900 anti-clockwise about the origin. Find the transformation matrix and the coordinates of its image. Solution
S.3 Mathematics Page 34
The images of I and J under this transformation are I1(0,1) and J1(-1, 0).
Therefore, the matrix of transformation is
01
10.
When we premultiply the matrix resulting from the position vectors of points P, Q and R by the matrix of transformation, we get:
01
10
612
552 =
552
612
RQP 111
Therefore, the coordinates of the image are P1(-2, 2), Q1(-1, 5) and R1(-6, 5).
We can find the image of any point in the plane by pre-multiplying the position vector of that point by the matrix of the transformation. Example 3.8
Find the images of the points with the following position vectors under the
transformation whose matrix is
21
12
(a)
0
1 (b)
1
0
(c)
5
2 (d)
1
1
Solution
(a)
21
12
0
1 =
0211
0112 =
01
02 =
1
2
So the image of
0
1 is
1
2
(b)
21
12
1
0 =
20
10 =
2
1.
So the image of
1
0 is
2
1.

S.3 Mathematics Page 35
(c)
21
12
5
2 =
102
54 =
12
9
So the image of
5
2 is
12
9.
(d)
21
12
1
1 =
21
12 =
3
3. So the image of
1
1 is
3
3.
Parts (a) and (b) above are especially interesting as the images of
0
1 and
1
0
are the columns of the transformation matrix. In general,
The matrix
dc
ba transforms the vectors
0
1 and
1
0 as follows
0
1→
c
a and
d
b
1
0
Example 3.9
A is a reflection in the line y = x. B is a reflection in the y-axis. Find the matrix which represents: (a) A (b) B
Solution
(a)
The images of I(1. 0) and J(0. 1) under this transformation (A) are I1(0, 1) and J1(1, 0).
Therefore, the matrix representing the transformation is
01
10
(b)
S.3 Mathematics Page 36
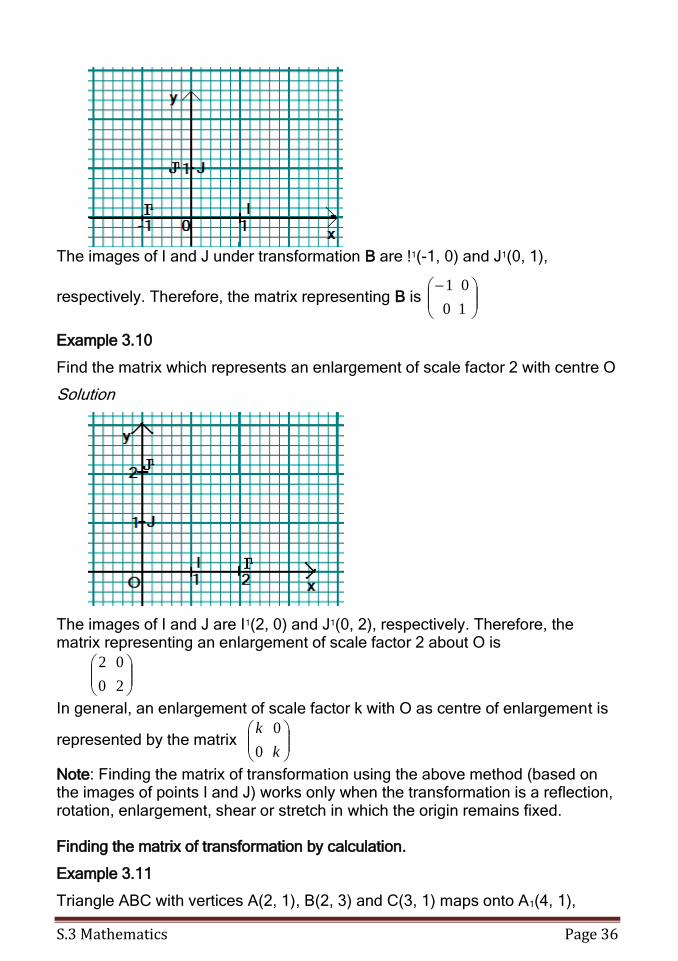
The images of I and J under transformation B are !1(-1, 0) and J1(0, 1),
respectively. Therefore, the matrix representing B is
10
01
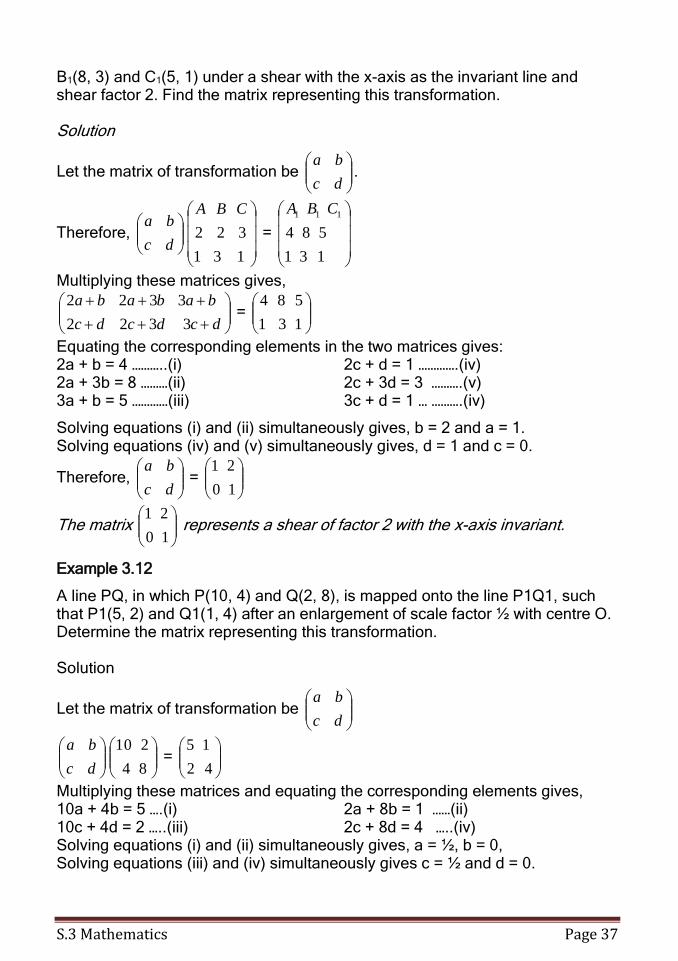
Example 3.10
Find the matrix which represents an enlargement of scale factor 2 with centre O
Solution
The images of I and J are I1(2, 0) and J1(0, 2), respectively. Therefore, the matrix representing an enlargement of scale factor 2 about O is
20
02
In general, an enlargement of scale factor k with O as centre of enlargement is
represented by the matrix
k
k
0
0
Note: Finding the matrix of transformation using the above method (based on the images of points I and J) works only when the transformation is a reflection, rotation, enlargement, shear or stretch in which the origin remains fixed. Finding the matrix of transformation by calculation.
Example 3.11
Triangle ABC with vertices A(2, 1), B(2, 3) and C(3, 1) maps onto A1(4, 1),
S.3 Mathematics Page 37
B1(8, 3) and C1(5, 1) under a shear with the x-axis as the invariant line and shear factor 2. Find the matrix representing this transformation. Solution
Let the matrix of transformation be
dc
ba.
Therefore,
dc
ba
131
322
CBA
=
131
584
111 CBA
Multiplying these matrices gives,
dcdcdc
bababa
3322
3322 =
131
584
Equating the corresponding elements in the two matrices gives: 2a + b = 4 ………..(i) 2c + d = 1 ………….(iv) 2a + 3b = 8 ………(ii) 2c + 3d = 3 ……….(v) 3a + b = 5 …………(iii) 3c + d = 1 … ……….(iv)
Solving equations (i) and (ii) simultaneously gives, b = 2 and a = 1. Solving equations (iv) and (v) simultaneously gives, d = 1 and c = 0.
Therefore,
dc
ba =
10
21
The matrix
10
21 represents a shear of factor 2 with the x-axis invariant.
Example 3.12
A line PQ, in which P(10, 4) and Q(2, 8), is mapped onto the line P1Q1, such that P1(5, 2) and Q1(1, 4) after an enlargement of scale factor ½ with centre O. Determine the matrix representing this transformation. Solution
Let the matrix of transformation be
dc
ba
dc
ba
84
210 =
42
15
Multiplying these matrices and equating the corresponding elements gives, 10a + 4b = 5 ….(i) 2a + 8b = 1 ……(ii) 10c + 4d = 2 …..(iii) 2c + 8d = 4 …..(iv) Solving equations (i) and (ii) simultaneously gives, a = ½, b = 0, Solving equations (iii) and (iv) simultaneously gives c = ½ and d = 0.
S.3 Mathematics Page 38
The matrix
dc
ba =
21
21
0
0
Therefore
21
21
0
0 represents an enlargement of scale factor ½ about the origin.
Describing a matrix using the points I(1, 0) and J(0, 1).
It is possible to describe a transformation in matrix form by considering the effect on the points I(1, 0) and J(0, 1).
We let I =
0
1 and J =
1
0.
The columns of a matrix give us the images of I and J after the transformation.
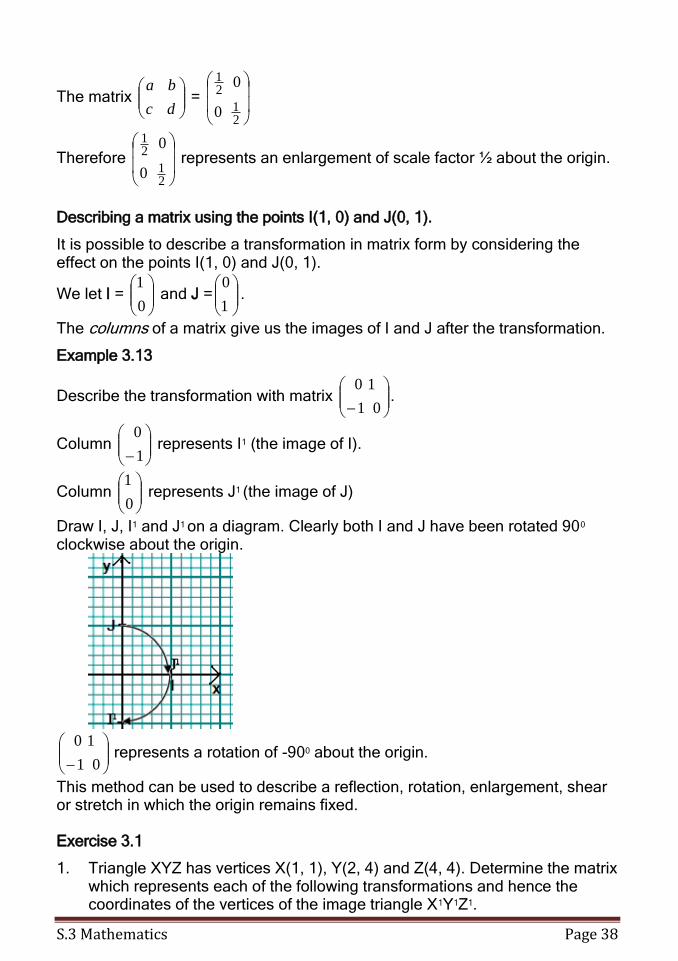
Example 3.13
Describe the transformation with matrix
01
10.
Column
1
0 represents I1 (the image of I).
Column
0
1 represents J1 (the image of J)
Draw I, J, I1 and J1 on a diagram. Clearly both I and J have been rotated 900
clockwise about the origin.
01
10 represents a rotation of -900 about the origin.
This method can be used to describe a reflection, rotation, enlargement, shear or stretch in which the origin remains fixed. Exercise 3.1
1. Triangle XYZ has vertices X(1, 1), Y(2, 4) and Z(4, 4). Determine the matrix which represents each of the following transformations and hence the coordinates of the vertices of the image triangle X1Y1Z1.
S.3 Mathematics Page 39
(a) Reflection in the x-axis
(b) Reflection in the y-axis.
(c) A rotation of -900 about the origin.
(d) A rotation of 900 about the origin.
(e) A half turn about the origin.
(f) An enlargement of scale factor -2 with centre O.
2. Determine the matrix that can transform each of the following pairs of points onto their respective images.
(a) A(1, 2) and B(3, 0) onto A1(4, 4) and B1(3, 9).
(b) A(-2, 1) and B(5, -3) onto A1(1, -2) and B1(1(-3, 5)
(c) M(4, 5) and N(-1, 6) onto M1(-4, 5) and N1(1, 6)
(d) P(8, 3) and Q(0, 5) onto P1(8, 3) and Q1(0,5)
3. Determine the matrix that can transform each of the following shapes onto their corresponding images.
(a) Triangle ABC with vertices A(2, 3), B(2, 6) and C(4, 3) onto triangle A1B1C1 with vertices at A1(6, 6), B1(6, 12) and C1(12, 6).
(b) Rectangle ABCD with vertices A(-3, -1), B(-3, -4), C(-1, -4), D(-1, -1) onto rectangle A1B1C1D1 with vertices A1(-3, 1), B1(-3, 4), C1(-1, 4) and D1(-1, 1).
(c) Triangle PQR with vertices P(1, 1), Q(2, 4) and R(4, 1) onto triangle P1Q1R1 with vertices P1(0, 0), Q1(-4, 2) and R1(4, -2).
4. Use the points I and J to describe the transformation represented by each Matrix.
(a)
01
10 (b)
20
02
(c)
01
10 (d)
20
02
5. Draw the triangle A(2, 2), B(6, 2), C(6, 4). Find its image under the transformation represented by the following matrices:
(a)
01
10 (b)
10
01
(c)
01
10 (d)
21
21
0
0
6. Plot the object and image for the following:
S.3 Mathematics Page 40
(a) Object: P(4, 2), Q(4, 4), R(0, 4); matrix:
20
02
(b) Object: A(-6, 8), B(-2, 8), C(-2, 6); matrix:
01
10
Describe each as a single transformation.
7. Find and draw the image of the square (0. 0), (1, 1), (0, 2), (-1, 1) under the transformation represented by the matrix
23
34.
Show that the transformation is a shear and find the equation of the invariant line.
8. Find and draw the image of the unit square O(0, 0), I(1, 0), K(1, 1) J(0, 1) under the transformation represented by the matrix
20
03. This transformation is called a two-way stretch.
Successive transformations
An object can undergo several transformations, one after the other. This is done such that the image of the preceding transformation becomes the object of the next transformation.
When a object, A, undergoes a transformation R followed by another transformation N, this is shown as N[R(A)] or NR(A).
The first transformation is always indicated to the right of the second transformation.
RR(A) means ‘perform transformation R on A and then perform R on the image’. It may be written R2(A).
Example 3.14
A is a triangle with vertices (2, 1), (2, 4) and (4, 1). R is a rotation of 900 clockwise about the origin and N is a reflection in the y-axis. Find the vertices of the image of A if it undergoes the following transformations: (a) NR(A) (b) RN(A)
Solution
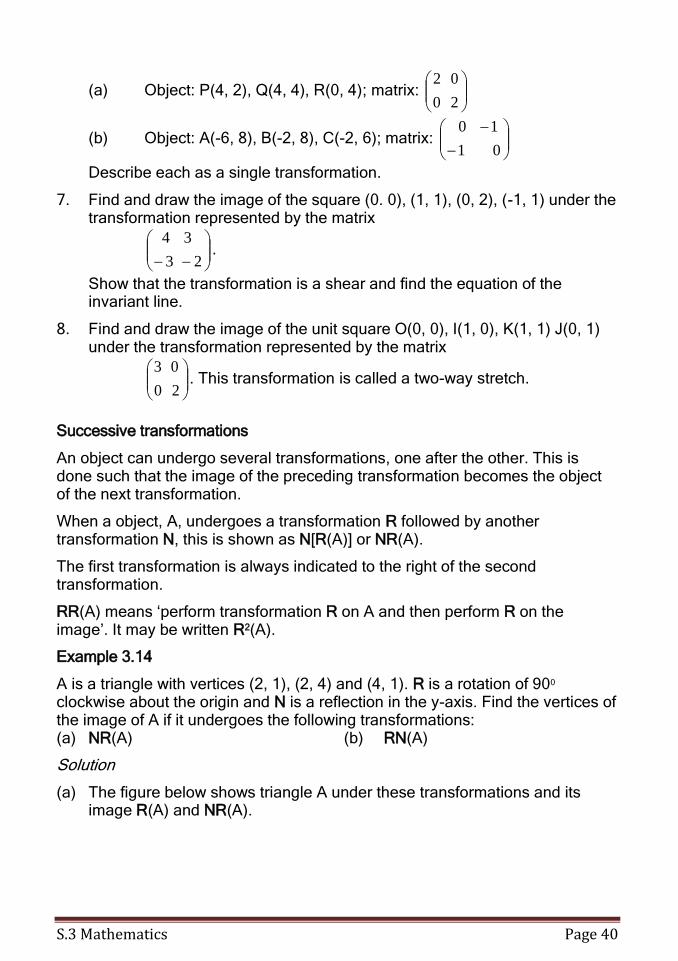
(a) The figure below shows triangle A under these transformations and its image R(A) and NR(A).
S.3 Mathematics Page 41
The final image of A has vertices (-1, -2), (-1, -4) and (-4, -2).
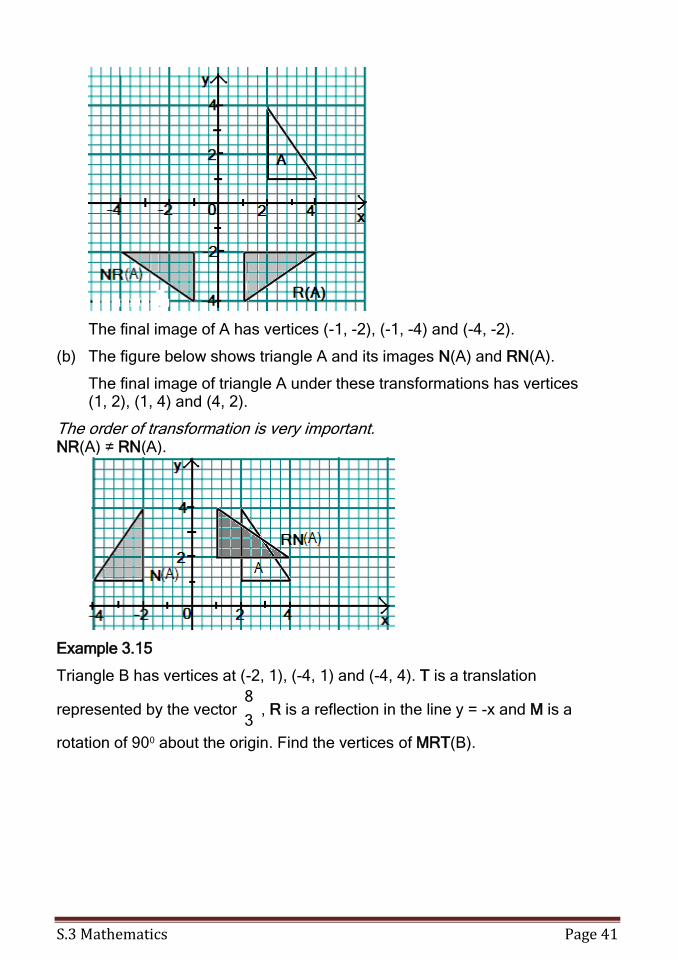
(b) The figure below shows triangle A and its images N(A) and RN(A).
The final image of triangle A under these transformations has vertices (1, 2), (1, 4) and (4, 2).
The order of transformation is very important. NR(A) ≠ RN(A).
Example 3.15
Triangle B has vertices at (-2, 1), (-4, 1) and (-4, 4). T is a translation
represented by the vector3
8, R is a reflection in the line y = -x and M is a
rotation of 900 about the origin. Find the vertices of MRT(B).
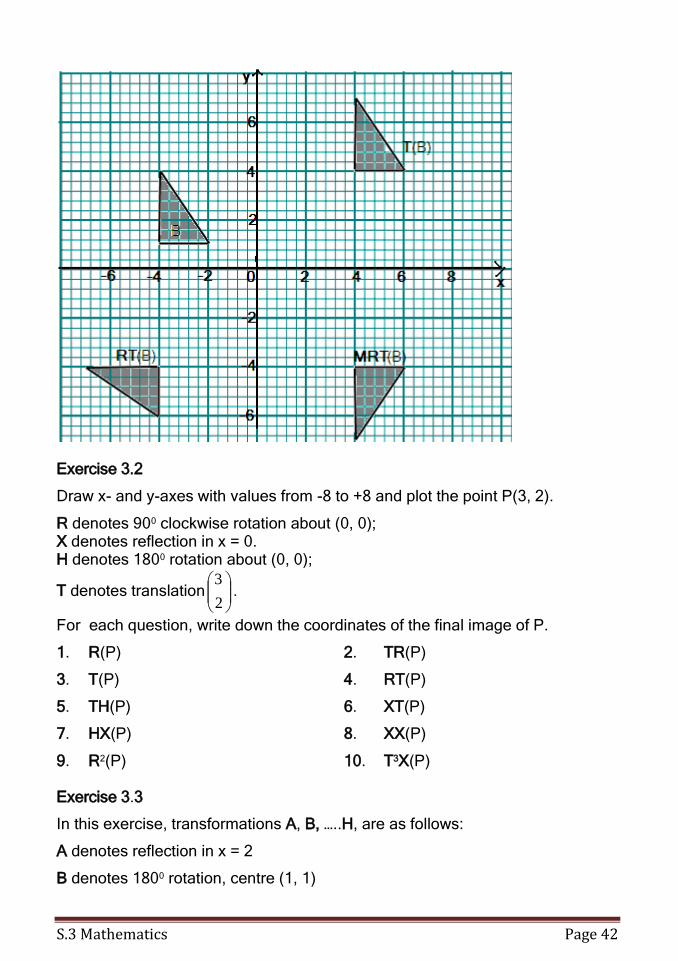
S.3 Mathematics Page 42
Exercise 3.2
Draw x- and y-axes with values from -8 to +8 and plot the point P(3, 2).
R denotes 900 clockwise rotation about (0, 0); X denotes reflection in x = 0. H denotes 1800 rotation about (0, 0);
T denotes translation
2
3.
For each question, write down the coordinates of the final image of P.
1. R(P) 2. TR(P)
3. T(P) 4. RT(P)
5. TH(P) 6. XT(P)
7. HX(P) 8. XX(P)
9. R2(P) 10. T3X(P)
Exercise 3.3
In this exercise, transformations A, B, …..H, are as follows:
A denotes reflection in x = 2
B denotes 1800 rotation, centre (1, 1)
S.3 Mathematics Page 43
C denotes translation
2
6
D denotes reflection in the line y = x. E denotes reflection in y = 0
F denotes translation
3
4
G denotes 900 rotation clockwise, centre (0, 0) H denotes enlargement, scale factor ½, centre (0, 0).
Draw the axes with values from -8 to +8.
1. Draw triangle LMN at L(2, 2), M(6, 2), N(6, 4). Find the image of LMN under the following combinations of transformations. Write down the coordinates of the image of point L in each case: (a) CA(LMN) (b) ED(LMN) (c) DB(LMN) (d) BE(LMN) (e) EB(LMN)
2. Draw triangle PQR at P(2, 2), Q(6, 2), R(6, 4). Find the image of PQR under the following combinations of transformations. Write down the coordinates of the image of point P in each case. (a) AF(PQR) (b) CG(PQR) (c) AG(PQR) (d) HE(PQR)
3. Draw triangle XYZ at X(-2, 4), Y(-2, 1), Y(-4, 1). Find the image of XYZ under the following combinations of transformations and in each case state the equivalent single transformation. (a) G2E(XYZ) (b) CB(XYZ) (c) DA(XYZ)
4. Draw triangle OPQ at O(0, 0), P(0, 2), Q(3, 2). Find the image of OPQ under the following combinations of transformations and state the equivalent single transformation in each case: (a) DE(OPQ) (b) FC(OPQ) (c) DEC(OPQ) (d) DFE(OPQ)
5. Draw triangle XYZ at X(1, 2), Y(1, 6), Z(3, 6). (a) Find the image of XYZ under each of the transformations BC and
CB. (b) Describe fully the single transformation equivalent to BC. (c) Describe fully the transformation M such that MCB = BC.
Matrices of successive transformations
If each of the successive transformations has a transformation matrix, then a single matrix that represents all the transformations can be obtained. Such a matrix maps the original object onto the final image.
S.3 Mathematics Page 44
Example 3.16
M and N are transformations represented by matrices M =
31
21 and
N =
12
01. P is a point with coordinates (-1, 2).
(a) Find: (i) M(P) (ii) N(P) (iii) MN(P). (b) If R is a transformation such that R = MN, find R(P). What can you deduce from the results of (a) and (b)?
Solutions
(a) (i) M(P) is
31
21
2
1 =
5
3.
P1(3, 5)
(ii) N(P) is
12
01
2
1 =
0
1
P2(-1, 0)
(iii) MN(P) = M[N(P)] = M
0
1 =
31
21
0
1
=
1
1
(b) R = MN=
31
21
12
01 =
37
25
R(P) =
37
25
2
1 =
1
1
From the results of (a) and (b), MN(P) = R(P).
Example 3.17
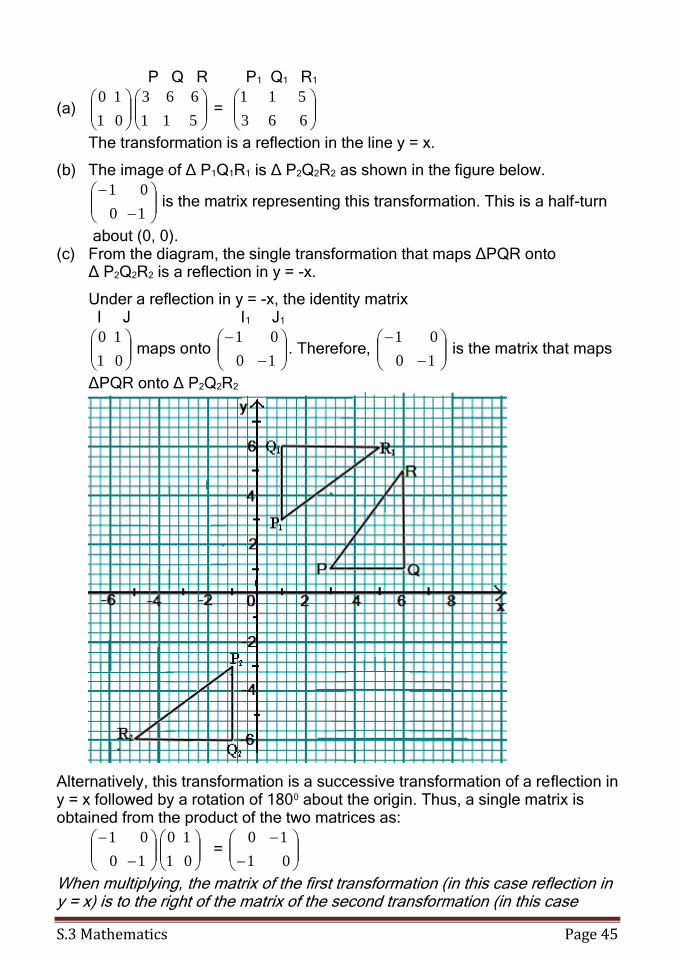
Draw ∆PQR with vertices P(3, 1), Q(6, 1) and R(6, 5). (a) Draw the image of ∆PQR under the transformation represented by the
matrix
01
10, label it P1Q1R1 and describe this transformation fully.
(b) Draw the image of ∆ P1Q1R1 under a rotation of 1800 about the origin and label it P2Q2R2. Find the matrix that represents this transformation.
(c) Describe fully the single transformation that maps ∆PQR onto ∆ P2Q2R2. Find the matrix that represents this transformation.
Solutions
S.3 Mathematics Page 45
P Q R P1 Q1 R1
(a)
01
10
511
663 =
663
511
The transformation is a reflection in the line y = x.
(b) The image of ∆ P1Q1R1 is ∆ P2Q2R2 as shown in the figure below.
10
01 is the matrix representing this transformation. This is a half-turn
about (0, 0). (c) From the diagram, the single transformation that maps ∆PQR onto ∆ P2Q2R2 is a reflection in y = -x.
Under a reflection in y = -x, the identity matrix I J I1 J1
01
10 maps onto
10
01. Therefore,
10
01 is the matrix that maps
∆PQR onto ∆ P2Q2R2
Alternatively, this transformation is a successive transformation of a reflection in y = x followed by a rotation of 1800 about the origin. Thus, a single matrix is obtained from the product of the two matrices as:
10
01
01
10=
01
10
When multiplying, the matrix of the first transformation (in this case reflection in y = x) is to the right of the matrix of the second transformation (in this case
S.3 Mathematics Page 46
rotation of 1800 about the origin)
Exercise 3.4
1. Find a single matrix that represents the following successive transformations.
(a) A reflection in the x-axis followed by a reflection in the y-axis. (b) A reflection in the line y = x followed by a reflection in the line y = -x. (c) A clockwise rotation of 900 about the origin followed by an
enlargement of scale factor 3 with the centre of enlargement as the origin.
(d) An enlargement of factor 2 with centre O followed by an anticlockwise rotation of 900 about O.
2. Draw the parallelogram formed by the points P(1, -3), Q(4, -3), R(6, 1) and S(3, -1). (a) Draw the image P1Q1R1S1 of the parallelogram after a reflection in
the line y = 0. (b) Reflect the image in the line y = x to obtain parallelogram
P2Q2R2S2. (c) Describe fully the single transformation that maps PQRS onto
P2Q2R2S2. (d) Find the matrix of transformation that maps PQRS onto P2Q2R2S2.
3. Draw triangle T whose vertices are (4, 3), (-3, -1) and (-1, 3). (a) Triangle R is the image of triangle T under the transformation
represented by the matrix N =
6.08.0
8.06.0
(i) Calculate the coordinates of the vertices of triangle R. (ii) Draw and label triangle R (b) Describe fully a single transformation that maps triangle T onto
triangle R. 4. Triangle XYZ is such that X(1, 4), Y(1, 7) and Z(3, 1) are its vertices. Triangle XYZ is mapped onto triangle X1Y1Z1 by the transformation
represented by the matrix M =
01
10.
(a) Draw and label triangle X1Y1Z1 and describe fully the transformation that maps triangle XYZ onto X1Y1Z1 in geometrical terms.
(b) Reflect ∆XYZ in the y-axis, and label the vertices of its image as X2, Y2, and Z2. Write down the elements of matrix N which represents this transformation.
(c) Triangle X1Y1Z1 can be mapped onto triangle X2Y2Z2 by a single transformation P.
S.3 Mathematics Page 47
(i) Describe this transformation fully. (ii) Write down the elements of matrix P which represents this
transformation. (iii) State the relationship between M, N and P.
The inverse of a transformation
The inverse of a transformation reverses the transformation, i.e. it is the transformation which takes the image back to the object. For example, the inverse of an anticlockwise rotation of 900 about O is a clockwise rotation of 900
about O.
If translation T has vector
2
3, the translation which has the opposite effect
has vector
2
3. This is written as T-1
If M is a transformation representing a transformation, then the matrix representing the inverse of the transformation is indicated as M-1. Example 3.18
Matrix N =
32
21describes a transformation on ∆PQR. The coordinates of
the image are P1(-3, 2), Q1(2, 1) and R1(0, 1). Find: (a) the matrix that maps ∆P1Q1R1 onto ∆PQR. (b) the coordinates of P, Q and R.
Solution
(a) The matrix that maps ∆P1Q1R1 onto ∆PQR is the inverse of N.
N-1 = 11
12
23 =
12
23
P1 Q1 R1 P Q R
(b)
12
23
112
023 =
154
285
Therefore, the coordinates of PQR are P(-5, 4), Q(8, -5), R(2, -1)
Example 3.19
A(2, 1), B(5, 1) and C(5, 3) are vertices of ∆ABC and M =
23
12.
(a) Find the image A1B1C1 of ABC under the transformation represented by matrix M. (b) Find M-1. (c) Find the image of A1B1C1 under the transformation represented by matrix

S.3 Mathematics Page 48
M-1. (d) Comment on your results in (c).
Solution A B C A1 B1 C1
(a)
23
12
311
552 =
21178
13115 Therefore, the coordinates of the
vertices of the image are: A1(5, 8), B1(11, 17) and C1(13, 21). Area and the determinant of a matrix.
Under some transformations, the size and shape of objects do not change, while under other transformations they change. When a matrix represents a transformation, the ratio of the area of the image to the area of the object is equal to the determinant of the matrix of transformation.
Example 3.20
A unit square with vertices O(0, 0), I(1, 0), K(1, 1) and J(0, 1) is given a
transformation represented by matrix N =
20
03.
(a) Draw the square and its image. (b) Find the determinant of N. (c) Find the area of the image OI1K1J1.
Solution
O I K J O I1 K1 J1
(a)
20
03
1100
0110 =
2200
0330. Therefore, the image has vertices at:
O(0, 0), I1(3, 0), K1(3, 2) and J1(0, 2).
(b) The determinant of N is (3 × 2) – (0 × 0) = 6.
(c) The area of OI1K1J1 = 3 × 2 = 6 square units.
S.3 Mathematics Page 49
The area of the unit square is 1 square unit. The area of the image is 6 square units. From this information we have
objecttheofareathe
imagetheofareathe is the same as the determinant of the transformation
matrix.
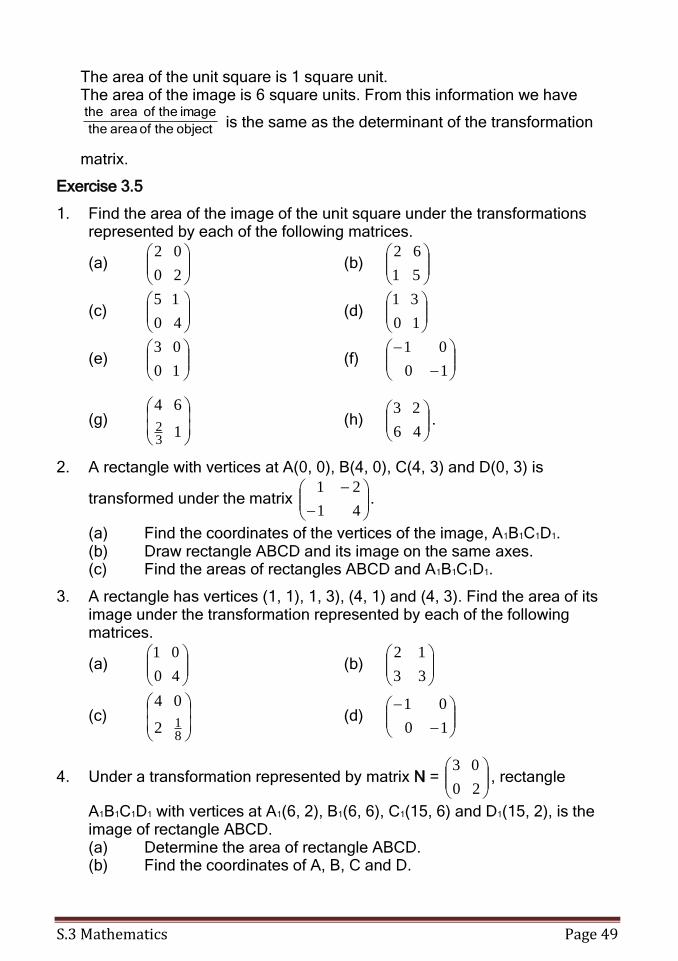
Exercise 3.5
1. Find the area of the image of the unit square under the transformations represented by each of the following matrices.
(a)
20
02 (b)
51
62
(c)
40
15 (d)
10
31
(e)
10
03 (f)
10
01
(g)
1
64
32
(h)
46
23.
2. A rectangle with vertices at A(0, 0), B(4, 0), C(4, 3) and D(0, 3) is
transformed under the matrix
41
21.
(a) Find the coordinates of the vertices of the image, A1B1C1D1. (b) Draw rectangle ABCD and its image on the same axes. (c) Find the areas of rectangles ABCD and A1B1C1D1.
3. A rectangle has vertices (1, 1), 1, 3), (4, 1) and (4, 3). Find the area of its image under the transformation represented by each of the following matrices.
(a)
40
01 (b)
33
12
(c)
812
04 (d)
10
01
4. Under a transformation represented by matrix N =
20
03, rectangle
A1B1C1D1 with vertices at A1(6, 2), B1(6, 6), C1(15, 6) and D1(15, 2), is the image of rectangle ABCD.
(a) Determine the area of rectangle ABCD. (b) Find the coordinates of A, B, C and D.
S.3 Mathematics Page 50
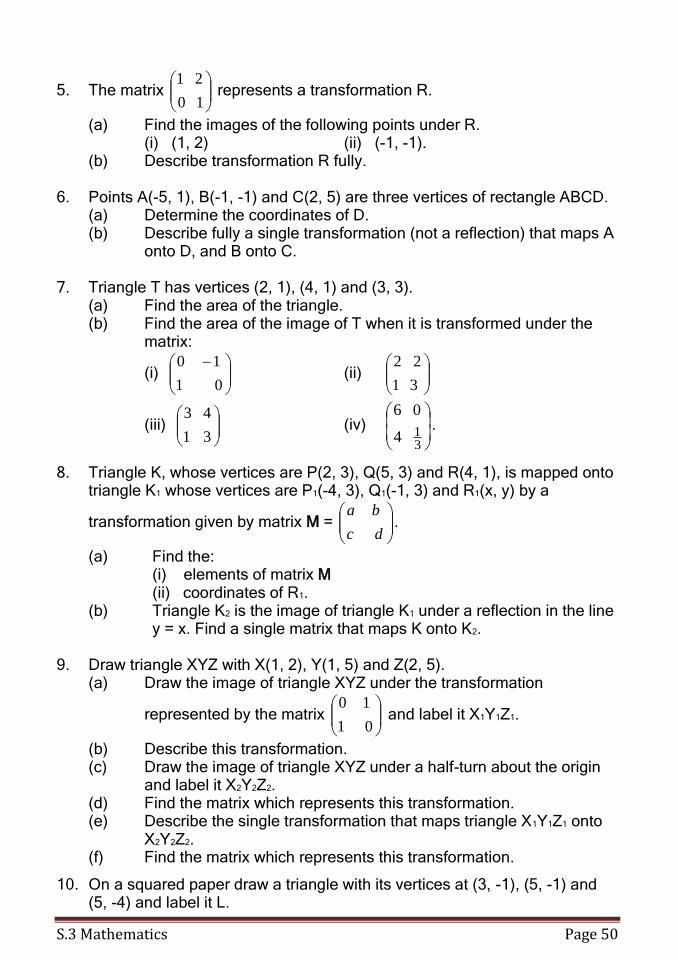
5. The matrix
10
21 represents a transformation R.
(a) Find the images of the following points under R. (i) (1, 2) (ii) (-1, -1). (b) Describe transformation R fully.
6. Points A(-5, 1), B(-1, -1) and C(2, 5) are three vertices of rectangle ABCD. (a) Determine the coordinates of D. (b) Describe fully a single transformation (not a reflection) that maps A
onto D, and B onto C. 7. Triangle T has vertices (2, 1), (4, 1) and (3, 3). (a) Find the area of the triangle. (b) Find the area of the image of T when it is transformed under the
matrix:
(i)
01
10 (ii)
31
22
(iii)
31
43 (iv)
314
06.
8. Triangle K, whose vertices are P(2, 3), Q(5, 3) and R(4, 1), is mapped onto triangle K1 whose vertices are P1(-4, 3), Q1(-1, 3) and R1(x, y) by a
transformation given by matrix M =
dc
ba.
(a) Find the: (i) elements of matrix M (ii) coordinates of R1. (b) Triangle K2 is the image of triangle K1 under a reflection in the line
y = x. Find a single matrix that maps K onto K2. 9. Draw triangle XYZ with X(1, 2), Y(1, 5) and Z(2, 5). (a) Draw the image of triangle XYZ under the transformation
represented by the matrix
01
10 and label it X1Y1Z1.
(b) Describe this transformation. (c) Draw the image of triangle XYZ under a half-turn about the origin
and label it X2Y2Z2. (d) Find the matrix which represents this transformation. (e) Describe the single transformation that maps triangle X1Y1Z1 onto
X2Y2Z2. (f) Find the matrix which represents this transformation.
10. On a squared paper draw a triangle with its vertices at (3, -1), (5, -1) and (5, -4) and label it L.
S.3 Mathematics Page 51
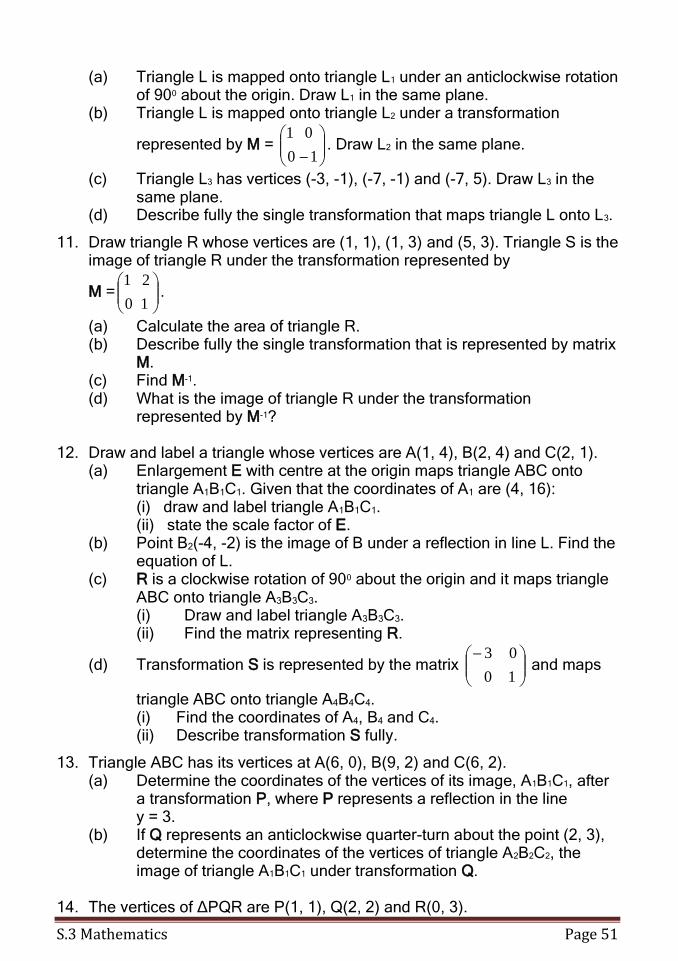
(a) Triangle L is mapped onto triangle L1 under an anticlockwise rotation of 900 about the origin. Draw L1 in the same plane.
(b) Triangle L is mapped onto triangle L2 under a transformation
represented by M =
10
01. Draw L2 in the same plane.
(c) Triangle L3 has vertices (-3, -1), (-7, -1) and (-7, 5). Draw L3 in the same plane.
(d) Describe fully the single transformation that maps triangle L onto L3.
11. Draw triangle R whose vertices are (1, 1), (1, 3) and (5, 3). Triangle S is the image of triangle R under the transformation represented by
M =
10
21.
(a) Calculate the area of triangle R. (b) Describe fully the single transformation that is represented by matrix
M. (c) Find M-1. (d) What is the image of triangle R under the transformation
represented by M-1? 12. Draw and label a triangle whose vertices are A(1, 4), B(2, 4) and C(2, 1). (a) Enlargement E with centre at the origin maps triangle ABC onto
triangle A1B1C1. Given that the coordinates of A1 are (4, 16): (i) draw and label triangle A1B1C1. (ii) state the scale factor of E.
(b) Point B2(-4, -2) is the image of B under a reflection in line L. Find the equation of L.
(c) R is a clockwise rotation of 900 about the origin and it maps triangle ABC onto triangle A3B3C3. (i) Draw and label triangle A3B3C3. (ii) Find the matrix representing R.
(d) Transformation S is represented by the matrix
10
03 and maps
triangle ABC onto triangle A4B4C4. (i) Find the coordinates of A4, B4 and C4. (ii) Describe transformation S fully.
13. Triangle ABC has its vertices at A(6, 0), B(9, 2) and C(6, 2). (a) Determine the coordinates of the vertices of its image, A1B1C1, after
a transformation P, where P represents a reflection in the line y = 3. (b) If Q represents an anticlockwise quarter-turn about the point (2, 3),
determine the coordinates of the vertices of triangle A2B2C2, the image of triangle A1B1C1 under transformation Q.
14. The vertices of ∆PQR are P(1, 1), Q(2, 2) and R(0, 3).
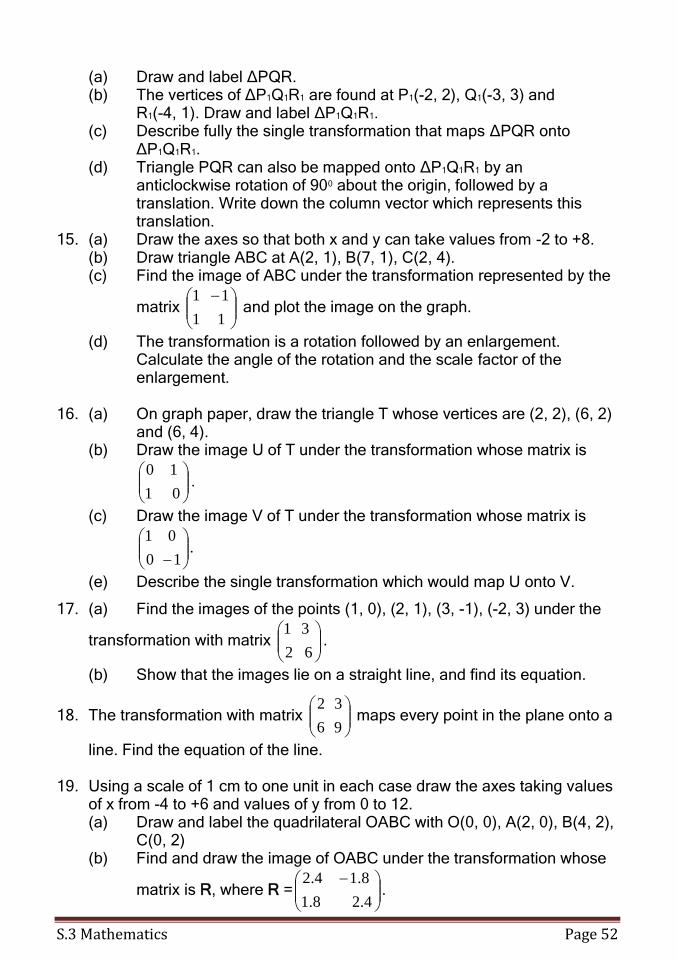
S.3 Mathematics Page 52
(a) Draw and label ∆PQR. (b) The vertices of ∆P1Q1R1 are found at P1(-2, 2), Q1(-3, 3) and R1(-4, 1). Draw and label ∆P1Q1R1. (c) Describe fully the single transformation that maps ∆PQR onto
∆P1Q1R1. (d) Triangle PQR can also be mapped onto ∆P1Q1R1 by an
anticlockwise rotation of 900 about the origin, followed by a translation. Write down the column vector which represents this translation.
15. (a) Draw the axes so that both x and y can take values from -2 to +8. (b) Draw triangle ABC at A(2, 1), B(7, 1), C(2, 4). (c) Find the image of ABC under the transformation represented by the
matrix
11
11 and plot the image on the graph.
(d) The transformation is a rotation followed by an enlargement. Calculate the angle of the rotation and the scale factor of the enlargement.
16. (a) On graph paper, draw the triangle T whose vertices are (2, 2), (6, 2)
and (6, 4). (b) Draw the image U of T under the transformation whose matrix is
01
10.
(c) Draw the image V of T under the transformation whose matrix is
10
01.
(e) Describe the single transformation which would map U onto V.
17. (a) Find the images of the points (1, 0), (2, 1), (3, -1), (-2, 3) under the
transformation with matrix
62
31.
(b) Show that the images lie on a straight line, and find its equation.
18. The transformation with matrix
96
32 maps every point in the plane onto a
line. Find the equation of the line. 19. Using a scale of 1 cm to one unit in each case draw the axes taking values
of x from -4 to +6 and values of y from 0 to 12. (a) Draw and label the quadrilateral OABC with O(0, 0), A(2, 0), B(4, 2),
C(0, 2) (b) Find and draw the image of OABC under the transformation whose
matrix is R, where R =
4.28.1
8.14.2.

S.3 Mathematics Page 53
(c) Calculate, in surd form, the lengths OB and BO ′′ (d) Calculate the angle AAO ′ . (e) Given that the transformation R consists of a rotation about O
followed by an enlargement, state the angle of the rotation and the scale factor of the enlargement.
20. The matrix R =
cossin
sincos represents a positive rotation of θ0 about
the origin. Find the matrix which represents a rotation of: (a) 900 (b) 1800 (c) 300 (d) -900 (e) 600 (f) 1500 (g) 450 (h) 53.10 Confirm your results for parts (a), (e), (h) by applying the matrix to the
quadrilateral O90, 0), A(0, 2), B(4, 2), C(4, 0).
21. The image ( )yx ′,′ of a point (x, y) under a transformation is given by
y
x =
21
03
y
x +
5
2
(a) Find the coordinates of the image of the point (4, 3). (b) The image of the point (m, n) is the point (11, 7). Write down two
equations involving m and n and hence find the values of m and n. (c) The image of the point (h, k) is the point (5, 10). Find the values of h
and k. 22. Draw A(0, 2), B(2, 2), C(0, 4) and its image under an enlargement, A′ (2, 2), B′ (6, 2), C′ (2, 6).
(a) What is the centre of enlargement? (b) Find the image of ABC under a reflection in the line x = 0 (c) Find the translation which maps this image onto A′ B′ C′ . (d) What is the matrix X and vector v which represents a reflection in
the line x = 2?
23. A =
21
02; h and k are numbers so that A2 = hA + kI, where I =
10
01.
Find the values of h and k.
24. M =
a
a
1
1. Find the values of a if: (a) M2 = 17
10
01 (b) M = -10.
25. (a) Draw the x and y axes from -5 to 5 using a scale of 1 cm to represent I unit on each axis. Draw triangle ABC with A(1, 1), B(4, 1) and C(4, 2).
(b) (i) Draw the image of triangle ABC when it is rotated 900 anticlockwise about the origin. Label this image A1B1C1.
S.3 Mathematics Page 54
(ii) Triangle A1B1C1 is translated by the vector
1
3. Draw and label
this image A2B2C2. (iii) Describe fully a single transformation which maps triangle
ABC onto A2B2C2. (c) (i) Draw the image of triangle ABC under the transformation
represented by the matrix
20
01. Label this image A3B3C3.
(ii) Describe fully the single transformation which maps triangle ABC onto triangle A3B3C3.
4. Statistics
(a) Statistics is that branch of mathematics which is concerned with the collection, organization, interpretation, presentation and analysis of numerical data. To a statistician, any information collected is called data. When data has not been ordered in any specific way after collection, it is called raw data.
(b) Discrete data. This is a type of data which can take only exact or integral
values. For example, the number of cars passing a check point in 30 minutes; the number of students served in the dinning hall in five minutes, etc.
S.3 Mathematics Page 55
(c) Continuous data. This is data which cannot take exact or integral values,
but can be given only within a certain range or measured to a certain degree of accuracy. For example, the heights of students in a school; the time taken by each of a class of students to perform a task, etc.
Methods of presentation of data
Pie Chart.
In a pie chart, each number is represented by the area of a sector of a circle. The frequency is proportional to the angle of the sector.
Example 4.1
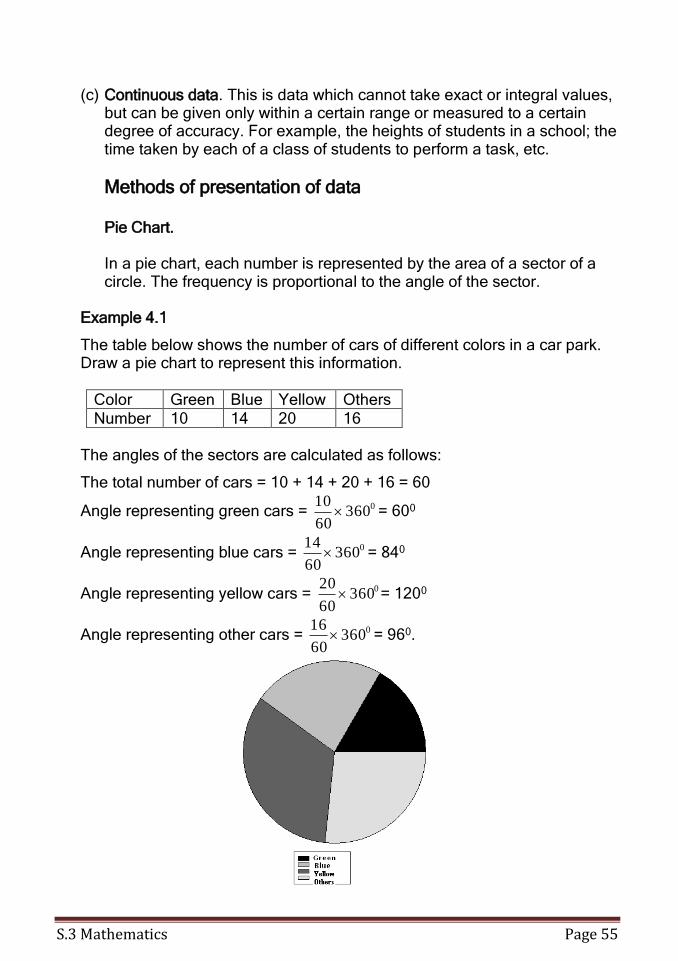
The table below shows the number of cars of different colors in a car park. Draw a pie chart to represent this information.
Color Green Blue Yellow Others
Number 10 14 20 16 The angles of the sectors are calculated as follows:
The total number of cars = 10 + 14 + 20 + 16 = 60
Angle representing green cars = 036060
10 = 600
Angle representing blue cars = 036060
14 = 840
Angle representing yellow cars = 036060
20 = 1200
Angle representing other cars = 036060
16 = 960.
S.3 Mathematics Page 56
Frequency Distributions
(a) Discrete data:
To illustrate data more concisely we count the number of times each value occurs and form a frequency distribution. For example, the following data gives the number of blind students in 10 randomly chosen classes in certain school. 0, 2, 1, 4, 2, 3, 2, 1, 4, 5. this information can be presented as follows:
Number of students Frequency
0 1 1 2 2 3 3 1 4 2 5 1
Total 10 (b) Continuous data:
In connection with large sets of data, a good overall picture and sufficient information can often be conveyed by grouping the data into a number of classes (intervals).
General rules for grouping data:
(i) Determine the largest and smallest numbers in the raw data and find the difference between them.
(ii) Divide this difference into appropriate number of class intervals having the same size – the number of intervals usually taken is between 5 and 20 depending on the size of the data (but preferably 7 to 10 for medium data). If this is not feasible use class intervals of different sizes or open class intervals.
(iii) Determine the number of observations falling into each class interval i.e. find the class frequencies. This is best done by using tallies.
(iv) Display the results in the form of a table.
Example 4.2
Construct a distribution of the following data on the length of time (in minutes) it took 80 persons to complete a certain task.
23 24 18 14 20 24 24 26 23 21
S.3 Mathematics Page 57
16 15 19 20 22 14 13 20 19 27 29 22 38 28 34 32 23 19 21 31 16 28 19 18 12 27 15 21 25 16 30 17 22 29 29 18 25 20 16 11 17 12 15 24 25 21 22 17 18 15 21 20 23 18 17 15 16 26 23 22 11 16 18 20 23 19 17 15 20 10
Solution
Since the smallest value is 10 and the highest is 38, we might choose the three classes 10-19, 20-29, and 30-39; we might choose the six classes: 10-14, 15-19, 20-24, 25-29, 30-34, and 35-39; to mention a few possibilities. Note that in each case the class intervals accommodate all of the data, they do not overlap, and they are all of the same class size. Taking the second classification, we now tally the 80 observations and get the results shown in the following table.
Minute Tally Frequency 10 – 14 8
15 – 19 28
20 – 24 27
25 – 29 12
30 - 34 4
35 - 39 1
total 80 The numbers given in the right hand column of this table, which show how many items fall into each class, are called class frequencies. The smallest and largest values that can go into any given class are referred to as its class limits, and in our example they are: 10, 14, 15, 19, 20,…., 34, 35, and 39. More specifically, 10, 15, 20, … and 35 are called the lower class limits, and 14, 19, 24, 29, 34 and 39 are called the upper class limits. The lengths of time which we grouped in our example were all given to the nearest minute, so that the first class actually covers the interval from 9.5 minutes to 14.5 minutes, the second class covers the interval from 14.5 to 19.5, and so forth. These numbers are referred t as class boundaries or the “real” class limits. Class marks are simply the midpoints of the classes, and they are obtained by the formula:
Class mark = 2
limlim classupperclasslower
Or 2
boundaryclasslowerboundaryclassupper
S.3 Mathematics Page 58
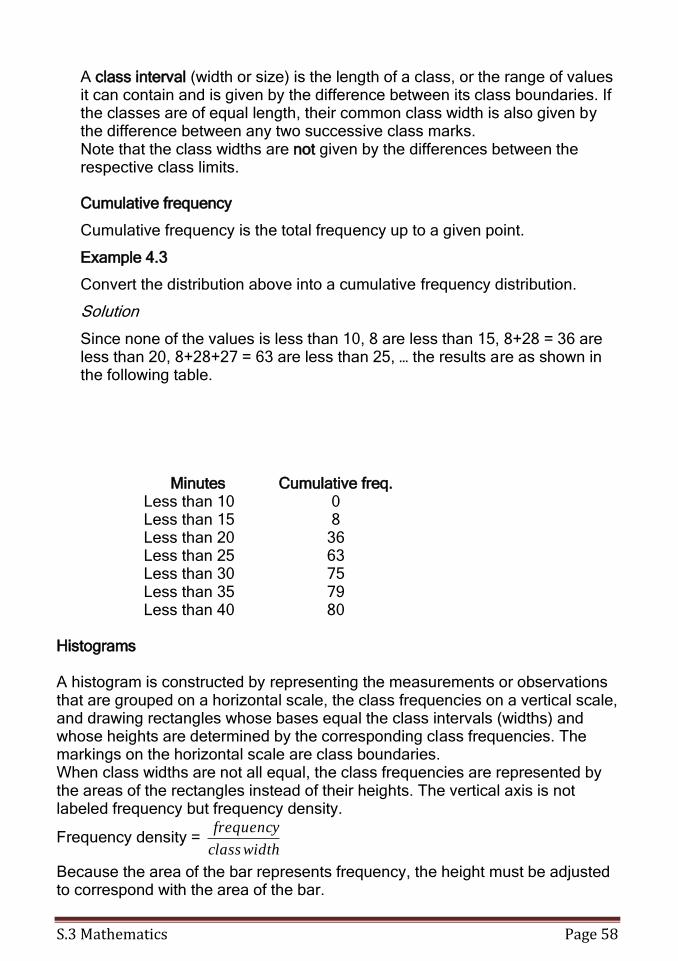
A class interval (width or size) is the length of a class, or the range of values it can contain and is given by the difference between its class boundaries. If the classes are of equal length, their common class width is also given by the difference between any two successive class marks. Note that the class widths are not given by the differences between the respective class limits. Cumulative frequency
Cumulative frequency is the total frequency up to a given point.
Example 4.3
Convert the distribution above into a cumulative frequency distribution.
Solution
Since none of the values is less than 10, 8 are less than 15, 8+28 = 36 are less than 20, 8+28+27 = 63 are less than 25, … the results are as shown in the following table.
Minutes Cumulative freq. Less than 10 0 Less than 15 8 Less than 20 36 Less than 25 63 Less than 30 75 Less than 35 79 Less than 40 80
Histograms
A histogram is constructed by representing the measurements or observations that are grouped on a horizontal scale, the class frequencies on a vertical scale, and drawing rectangles whose bases equal the class intervals (widths) and whose heights are determined by the corresponding class frequencies. The markings on the horizontal scale are class boundaries. When class widths are not all equal, the class frequencies are represented by the areas of the rectangles instead of their heights. The vertical axis is not labeled frequency but frequency density.
Frequency density = widthclass
frequency
Because the area of the bar represents frequency, the height must be adjusted to correspond with the area of the bar.
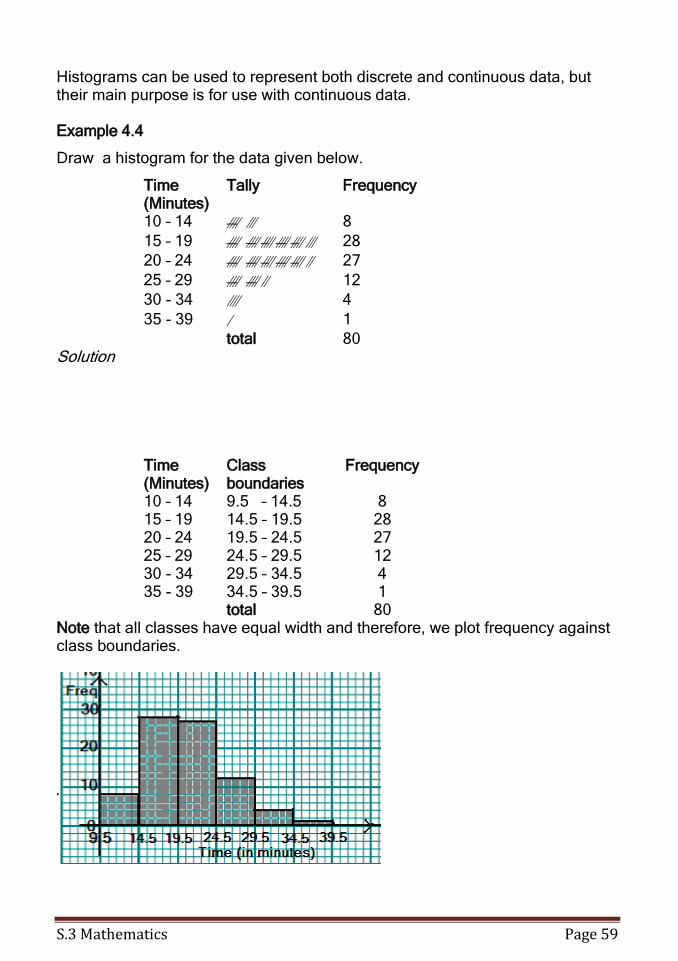
S.3 Mathematics Page 59
Histograms can be used to represent both discrete and continuous data, but their main purpose is for use with continuous data. Example 4.4
Draw a histogram for the data given below.
Time (Minutes)
Tally Frequency
10 – 14 8
15 – 19 28
20 – 24 27
25 – 29 12
30 - 34 4
35 - 39 1
total 80 Solution
Time (Minutes)
Class boundaries
Frequency
10 – 14 9.5 – 14.5 8 15 – 19 14.5 – 19.5 28 20 – 24 19.5 – 24.5 27 25 – 29 24.5 – 29.5 12 30 - 34 29.5 – 34.5 4 35 - 39 34.5 – 39.5 1 total 80
Note that all classes have equal width and therefore, we plot frequency against class boundaries.
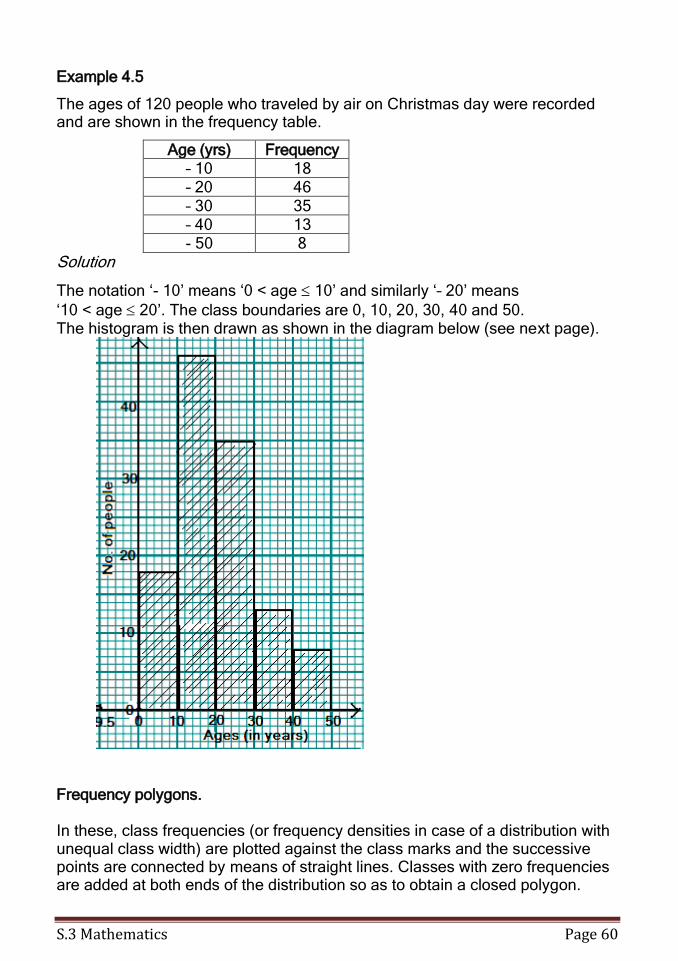
S.3 Mathematics Page 60
Example 4.5
The ages of 120 people who traveled by air on Christmas day were recorded and are shown in the frequency table.
Age (yrs) Frequency – 10 18 – 20 46
– 30 35 – 40 13 - 50 8
Solution
The notation ‘- 10’ means ‘0 < age 10’ and similarly ‘– 20’ means
‘10 < age 20’. The class boundaries are 0, 10, 20, 30, 40 and 50. The histogram is then drawn as shown in the diagram below (see next page).
Frequency polygons.
In these, class frequencies (or frequency densities in case of a distribution with unequal class width) are plotted against the class marks and the successive points are connected by means of straight lines. Classes with zero frequencies are added at both ends of the distribution so as to obtain a closed polygon.
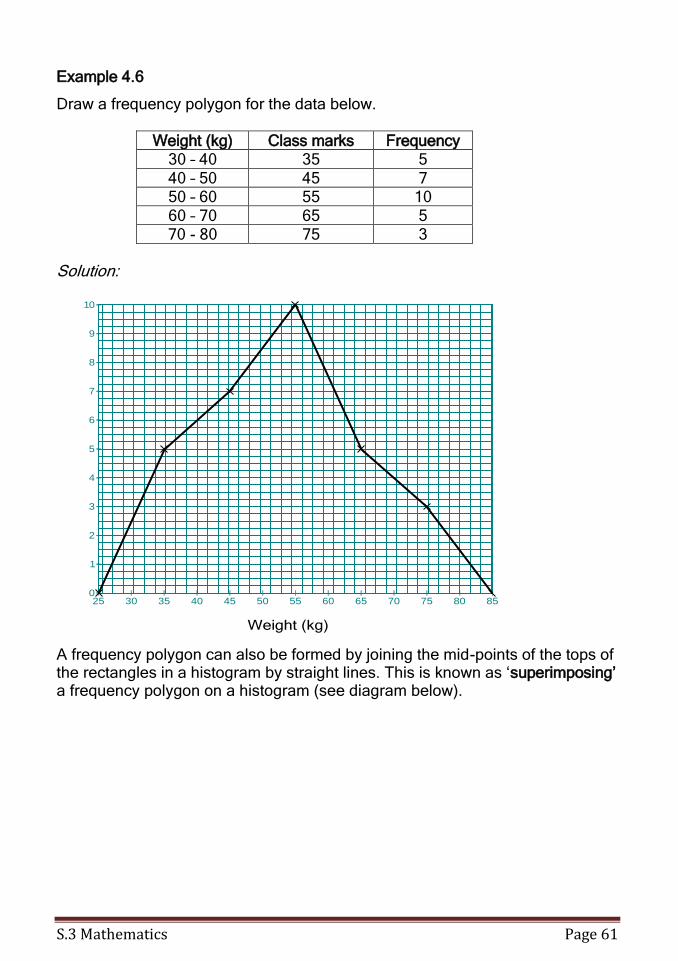
S.3 Mathematics Page 61
Example 4.6
Draw a frequency polygon for the data below.
Weight (kg) Class marks Frequency 30 – 40 35 5
40 – 50 45 7 50 – 60 55 10
60 – 70 65 5 70 - 80 75 3
Solution:
25 30 35 40 45 50 55 60 65 70 75 80 850
1
2
3
4
5
6
7
8
9
10
Fre
qu
en
cy
Weight (kg)
A frequency polygon can also be formed by joining the mid-points of the tops of the rectangles in a histogram by straight lines. This is known as ‘superimposing’ a frequency polygon on a histogram (see diagram below).
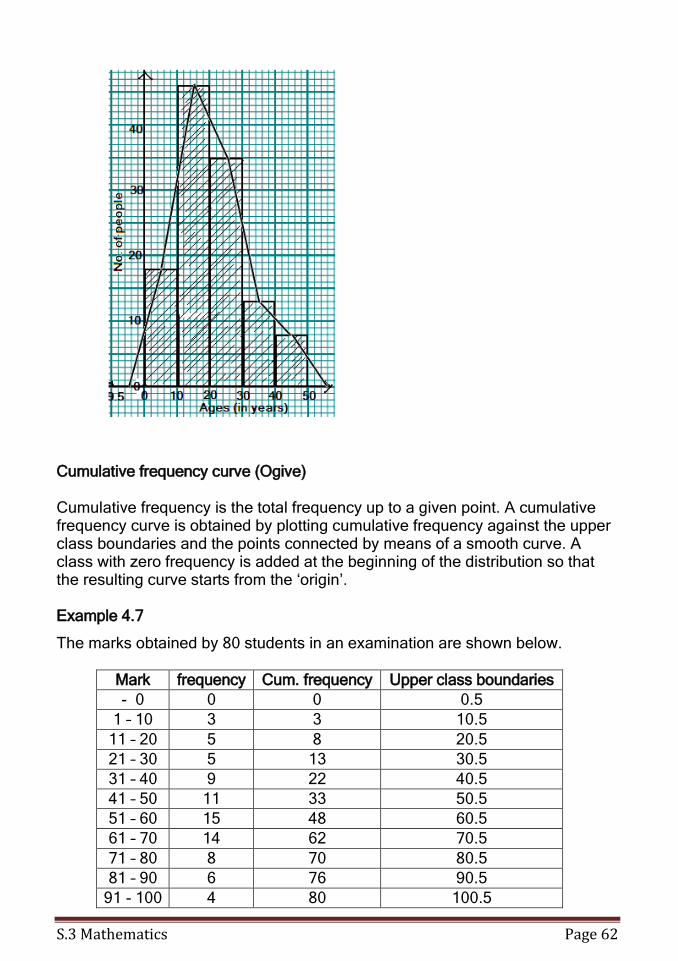
S.3 Mathematics Page 62
Cumulative frequency curve (Ogive)
Cumulative frequency is the total frequency up to a given point. A cumulative frequency curve is obtained by plotting cumulative frequency against the upper class boundaries and the points connected by means of a smooth curve. A class with zero frequency is added at the beginning of the distribution so that the resulting curve starts from the ‘origin’. Example 4.7
The marks obtained by 80 students in an examination are shown below.
Mark frequency Cum. frequency Upper class boundaries
- 0 0 0 0.5
1 – 10 3 3 10.5
11 – 20 5 8 20.5
21 – 30 5 13 30.5
31 – 40 9 22 40.5
41 – 50 11 33 50.5
51 – 60 15 48 60.5
61 – 70 14 62 70.5
71 – 80 8 70 80.5
81 – 90 6 76 90.5
91 - 100 4 80 100.5
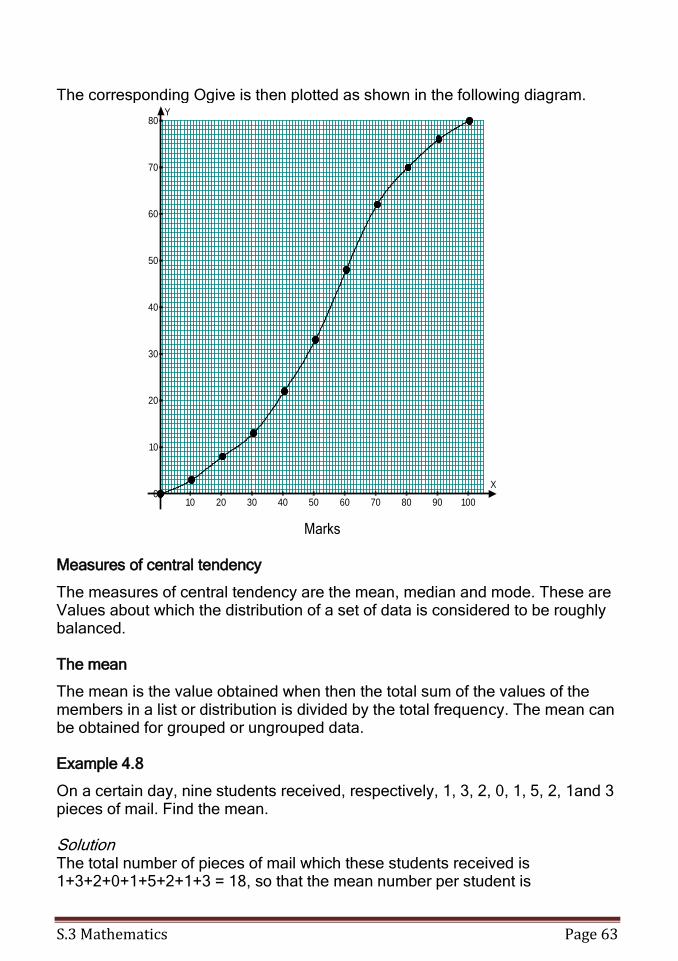
S.3 Mathematics Page 63
The corresponding Ogive is then plotted as shown in the following diagram.
X
Y
10 20 30 40 50 60 70 80 90 1000
10
20
30
40
50
60
70
80
Cu
mu
lative
fre
qu
en
cy
Marks
Measures of central tendency
The measures of central tendency are the mean, median and mode. These are Values about which the distribution of a set of data is considered to be roughly balanced.
The mean
The mean is the value obtained when then the total sum of the values of the members in a list or distribution is divided by the total frequency. The mean can be obtained for grouped or ungrouped data. Example 4.8
On a certain day, nine students received, respectively, 1, 3, 2, 0, 1, 5, 2, 1and 3 pieces of mail. Find the mean. Solution The total number of pieces of mail which these students received is 1+3+2+0+1+5+2+1+3 = 18, so that the mean number per student is
S.3 Mathematics Page 64
Mean = 29
18
Suppose xi represents the number whose mean is to be calculated (x1, x2, x3, x4, …, xn). In this set there are n values. So
Mean = n
xxx n ...21 orn
xx
, where x = x1+x2+x3+…+xn.
is capital sigma, the Greek letter for S. The notation x stands for “the sum of the x’s”. If data is in the form of a frequency distribution, the mean is calculated using the formula:
Mean =
f
fx., where x.f means ‘the sum of the products’
i.e. (number frequency) and f means ‘the sum of the frequencies’.
Example 4.9
The marks obtained by 100 students in a test were as follows:
Mark (x) 0 1 2 3 4 Frequency (f) 4 19 25 29 23
Find the mean mark.
Solution
Mark (x) Freq. (f) x.f 0 4 0 1 19 19
2 25 50 3 29 87 4 23 92
total 100 248
Mean = 100
248 = 2.48.
For grouped data, each class can be represented approximately by its mid-point (class mark) Example 4.10
The results of 24 students in a Mathematics test are given in the table.
Mark Freq. Mid-point(x) x.f 85 – 99 4 92 368
S.3 Mathematics Page 65
70 – 84 7 77 539 55 – 69 8 62 496
40 - 54 5 47 235 f=24 x.f= 1,638
Mean = 24
638,1 = 68.25.
Example 4.11.
The number of letters delivered to the 26 houses in a street was as follows:
Number of letters Number of houses (i.e. freq.) 0 – 2 10 3 – 4 8 5 – 7 5
8 - 12 3 Calculate an estimate of the mean number of letters delivered per house.
Using an assumed mean
When the number of members in a list is large, the above method of finding the mean is quite ardous. From the data we can guess the expected value of the mean. This expected value is called the assumed or working mean. The assumed mean is approximately in the middle of the data. In a frequency distribution table, the modal value provides the best assumed value. The assumed mean does not need to be one of the values given. Example 4.12
The table below shows the profit made by a trader in 100 days.
Profit in ‘000 Ush. 115 125 135 145 155 165 No. of days 8 18 30 26 12 6
Calculate the mean profit
Solution
To calculate the mean of the above data using an assumed mean, the following steps should be followed. Step 1: Choose an appropriate assumed mean (A) for the range of the values
given. Step 2: Find by how much each of the values (x) differs from this assumed
mean (A). These differences obtained are called deviations (d). Thus, d = x – A.
Step 3: Multiply each frequency (f) by its corresponding value of deviation (d) to obtain the product (fd).
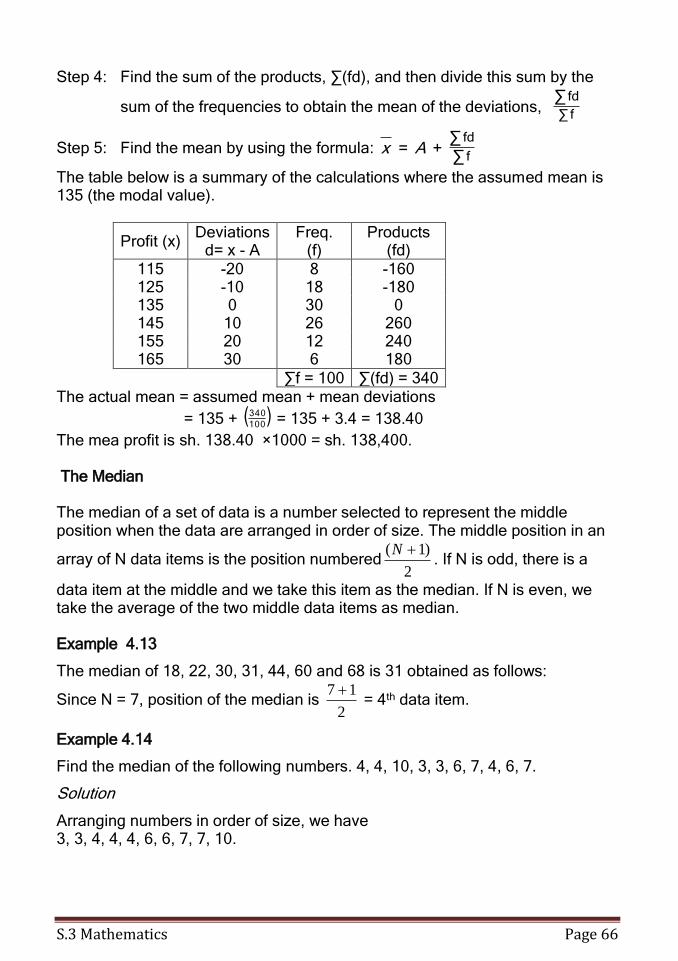
S.3 Mathematics Page 66
Step 4: Find the sum of the products, ∑(fd), and then divide this sum by the
sum of the frequencies to obtain the mean of the deviations, ∑∑ f
fd
Step 5: Find the mean by using the formula: ∑
∑+=
f
fdAx
The table below is a summary of the calculations where the assumed mean is 135 (the modal value).
Profit (x) Deviations
d= x - A Freq.
(f) Products
(fd)
115 -20 8 -160 125 -10 18 -180 135 0 30 0 145 10 26 260 155 20 12 240 165 30 6 180
∑f = 100 ∑(fd) = 340 The actual mean = assumed mean + mean deviations
= 135 + ( )100
340 = 135 + 3.4 = 138.40
The mea profit is sh. 138.40 ×1000 = sh. 138,400.
The Median
The median of a set of data is a number selected to represent the middle position when the data are arranged in order of size. The middle position in an
array of N data items is the position numbered2
)1( N. If N is odd, there is a
data item at the middle and we take this item as the median. If N is even, we take the average of the two middle data items as median. Example 4.13
The median of 18, 22, 30, 31, 44, 60 and 68 is 31 obtained as follows:
Since N = 7, position of the median is 2
17 = 4th data item.
Example 4.14
Find the median of the following numbers. 4, 4, 10, 3, 3, 6, 7, 4, 6, 7.
Solution
Arranging numbers in order of size, we have 3, 3, 4, 4, 4, 6, 6, 7, 7, 10.
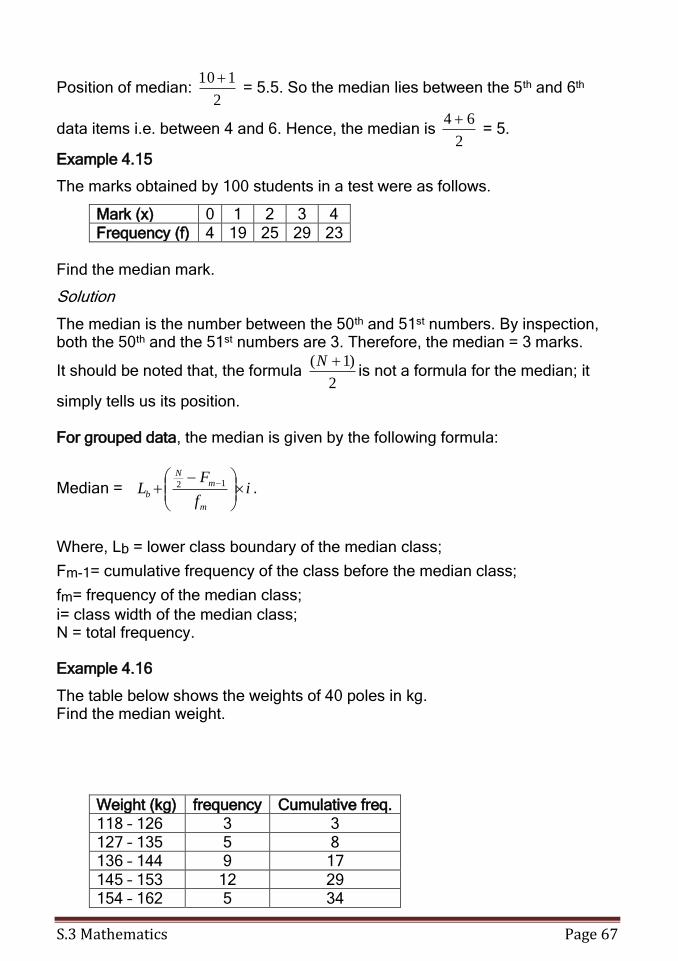
S.3 Mathematics Page 67
Position of median: 2
110 = 5.5. So the median lies between the 5th and 6th
data items i.e. between 4 and 6. Hence, the median is 2
64 = 5.
Example 4.15
The marks obtained by 100 students in a test were as follows.
Mark (x) 0 1 2 3 4
Frequency (f) 4 19 25 29 23 Find the median mark.
Solution
The median is the number between the 50th and 51st numbers. By inspection, both the 50th and the 51st numbers are 3. Therefore, the median = 3 marks.
It should be noted that, the formula 2
)1( Nis not a formula for the median; it
simply tells us its position. For grouped data, the median is given by the following formula:
Median = if
FL
m
mN
b
12 .
Where, Lb = lower class boundary of the median class;
Fm-1= cumulative frequency of the class before the median class;
fm= frequency of the median class;
i= class width of the median class; N = total frequency.
Example 4.16
The table below shows the weights of 40 poles in kg. Find the median weight.
Weight (kg) frequency Cumulative freq.
118 – 126 3 3 127 – 135 5 8 136 – 144 9 17
145 – 153 12 29 154 – 162 5 34
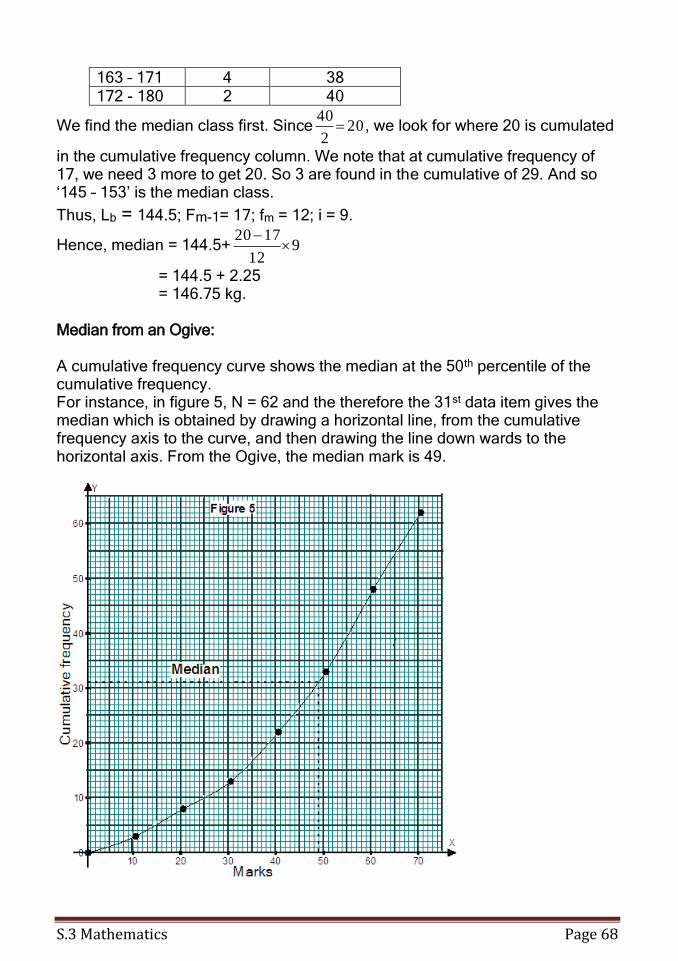
S.3 Mathematics Page 68
163 – 171 4 38 172 - 180 2 40
We find the median class first. Since 202
40 , we look for where 20 is cumulated
in the cumulative frequency column. We note that at cumulative frequency of 17, we need 3 more to get 20. So 3 are found in the cumulative of 29. And so ‘145 – 153’ is the median class.
Thus, Lb = 144.5; Fm-1= 17; fm = 12; i = 9.
Hence, median = 144.5+ 912
1720
= 144.5 + 2.25 = 146.75 kg.
Median from an Ogive:
A cumulative frequency curve shows the median at the 50th percentile of the cumulative frequency. For instance, in figure 5, N = 62 and the therefore the 31st data item gives the median which is obtained by drawing a horizontal line, from the cumulative frequency axis to the curve, and then drawing the line down wards to the horizontal axis. From the Ogive, the median mark is 49.
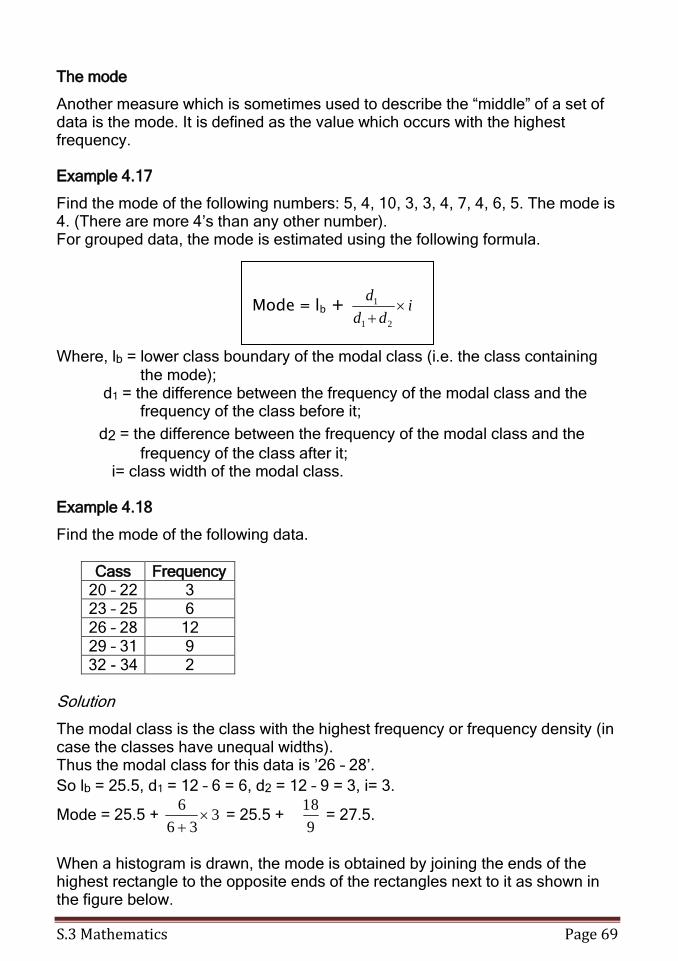
S.3 Mathematics Page 69
Mode = lb + idd
d
21
1
The mode
Another measure which is sometimes used to describe the “middle” of a set of data is the mode. It is defined as the value which occurs with the highest frequency. Example 4.17
Find the mode of the following numbers: 5, 4, 10, 3, 3, 4, 7, 4, 6, 5. The mode is 4. (There are more 4’s than any other number). For grouped data, the mode is estimated using the following formula.
Where, lb = lower class boundary of the modal class (i.e. the class containing the mode);
d1 = the difference between the frequency of the modal class and the frequency of the class before it;
d2 = the difference between the frequency of the modal class and the
frequency of the class after it; i= class width of the modal class.
Example 4.18
Find the mode of the following data.
Cass Frequency 20 – 22 3 23 – 25 6
26 – 28 12 29 – 31 9 32 - 34 2
Solution
The modal class is the class with the highest frequency or frequency density (in case the classes have unequal widths). Thus the modal class for this data is ’26 – 28’.
So lb = 25.5, d1 = 12 – 6 = 6, d2 = 12 – 9 = 3, i= 3.
Mode = 25.5 + 336
6
= 25.5 +
9
18 = 27.5.
When a histogram is drawn, the mode is obtained by joining the ends of the highest rectangle to the opposite ends of the rectangles next to it as shown in the figure below.
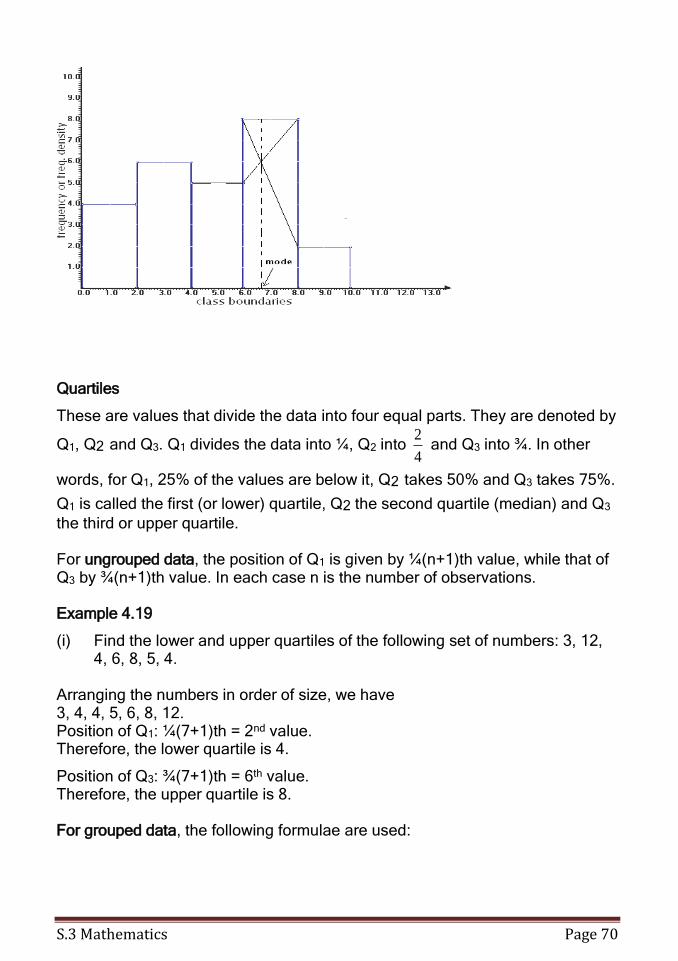
S.3 Mathematics Page 70
Quartiles
These are values that divide the data into four equal parts. They are denoted by
Q1, Q2 and Q3. Q1 divides the data into ¼, Q2 into 4
2 and Q3 into ¾. In other
words, for Q1, 25% of the values are below it, Q2 takes 50% and Q3 takes 75%.
Q1 is called the first (or lower) quartile, Q2 the second quartile (median) and Q3
the third or upper quartile. For ungrouped data, the position of Q1 is given by ¼(n+1)th value, while that of Q3 by ¾(n+1)th value. In each case n is the number of observations. Example 4.19
(i) Find the lower and upper quartiles of the following set of numbers: 3, 12, 4, 6, 8, 5, 4.
Arranging the numbers in order of size, we have 3, 4, 4, 5, 6, 8, 12. Position of Q1: ¼(7+1)th = 2nd value. Therefore, the lower quartile is 4.
Position of Q3: ¾(7+1)th = 6th value. Therefore, the upper quartile is 8.
For grouped data, the following formulae are used:
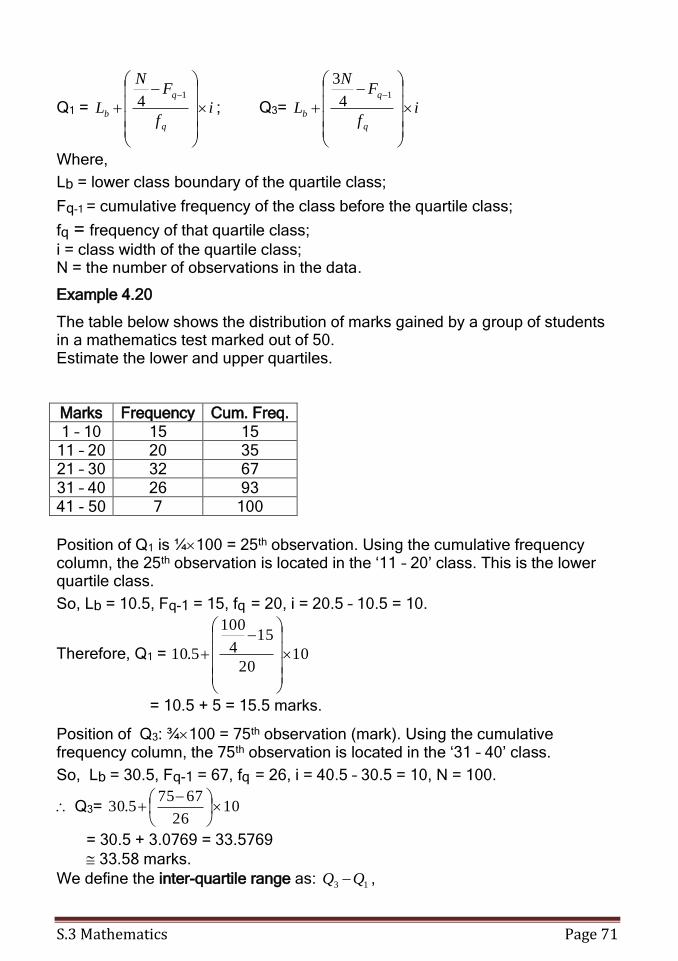
S.3 Mathematics Page 71
Q1 = if
FN
Lq
q
b
1
4 ; Q3= if
FN
Lq
q
b
1
4
3
Where,
Lb = lower class boundary of the quartile class;
Fq-1 = cumulative frequency of the class before the quartile class;
fq = frequency of that quartile class;
i = class width of the quartile class; N = the number of observations in the data.
Example 4.20
The table below shows the distribution of marks gained by a group of students in a mathematics test marked out of 50. Estimate the lower and upper quartiles. Marks Frequency Cum. Freq.
1 – 10 15 15 11 – 20 20 35 21 – 30 32 67
31 – 40 26 93 41 - 50 7 100
Position of Q1 is ¼100 = 25th observation. Using the cumulative frequency column, the 25th observation is located in the ‘11 – 20’ class. This is the lower quartile class.
So, Lb = 10.5, Fq-1 = 15, fq = 20, i = 20.5 – 10.5 = 10.
Therefore, Q1 = 1020
154
100
5.10
= 10.5 + 5 = 15.5 marks.
Position of Q3: ¾100 = 75th observation (mark). Using the cumulative frequency column, the 75th observation is located in the ‘31 – 40’ class.
So, Lb = 30.5, Fq-1 = 67, fq = 26, i = 40.5 – 30.5 = 10, N = 100.
Q3= 1026
67755.30
= 30.5 + 3.0769 = 33.5769
33.58 marks.
We define the inter-quartile range as: 13 QQ ,
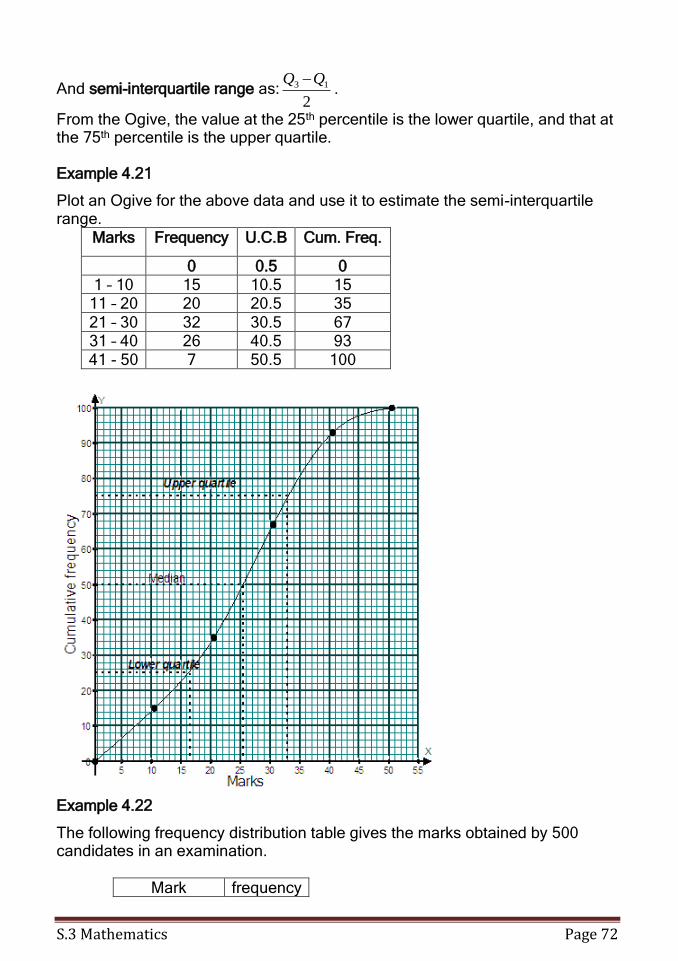
S.3 Mathematics Page 72
And semi-interquartile range as:2
13 QQ .
From the Ogive, the value at the 25th percentile is the lower quartile, and that at the 75th percentile is the upper quartile. Example 4.21
Plot an Ogive for the above data and use it to estimate the semi-interquartile range.
Marks Frequency U.C.B Cum. Freq.
0 0.5 0 1 – 10 15 10.5 15
11 – 20 20 20.5 35
21 – 30 32 30.5 67 31 – 40 26 40.5 93 41 - 50 7 50.5 100
Example 4.22
The following frequency distribution table gives the marks obtained by 500 candidates in an examination.
Mark frequency
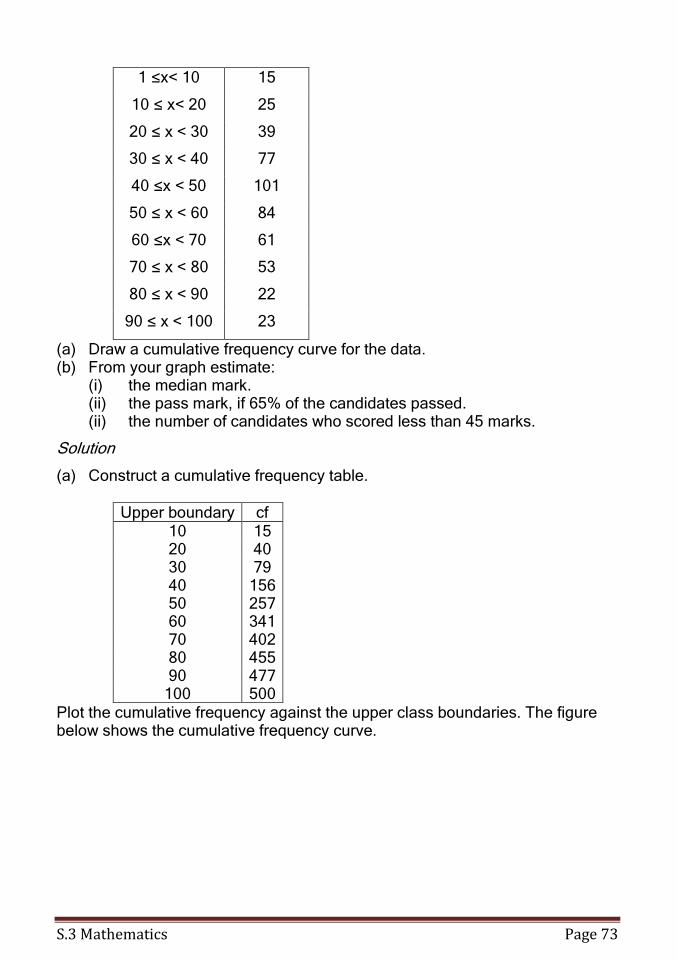
S.3 Mathematics Page 73
1 ≤x< 10 15
10 ≤ x< 20 25
20 ≤ x < 30 39
30 ≤ x < 40 77
40 ≤x < 50 101
50 ≤ x < 60 84
60 ≤x < 70 61
70 ≤ x < 80 53
80 ≤ x < 90 22
90 ≤ x < 100 23
(a) Draw a cumulative frequency curve for the data. (b) From your graph estimate: (i) the median mark. (ii) the pass mark, if 65% of the candidates passed.
(ii) the number of candidates who scored less than 45 marks.
Solution
(a) Construct a cumulative frequency table.
Upper boundary cf 10 15 20 40 30 79 40 156 50 257 60 341 70 402 80 455 90 477
100 500 Plot the cumulative frequency against the upper class boundaries. The figure below shows the cumulative frequency curve.

S.3 Mathematics Page 74
(b) (i) The median mark is located ½ (500) th along the cumulative frequency axis and the corresponding mark is 49.
(ii) If 65% passed, then 35% failed. From the graph, the pass mark is 42 (see the dotted line). (iii) The number of candidates who scored less than 45 marks is 205.
Exercise 4.1
1. In an experiment, 50 people were asked to guess the weight of a mobile phone in grams. The guesses were as follows:
47 39 21 30 42 35 44 36 19 52 23 32 66 29 5 40 33 11 44 22 27 58 38 37 48 63 23 40 53 24 47 22 44 33 13 59 33 49 57 30 17 45 38 33 25 40 51 56 28 64
Construct a frequency table using intervals 0 – 9, 10 – 19, 20 – 29, etc. Hence draw a cumulative frequency curve and estimate: (a) the median weight, (b) the inter-quartile range,
2. In a competition, 30 children had to pick up as many paper clips as possible in one minute using a pair of tweezers. The results were as follows:
3 17 8 11 26 23 18 28 33 38 12 38 22 50 5 35 39 30 31 43 27 34 9 25 39 14 27 16 33 49
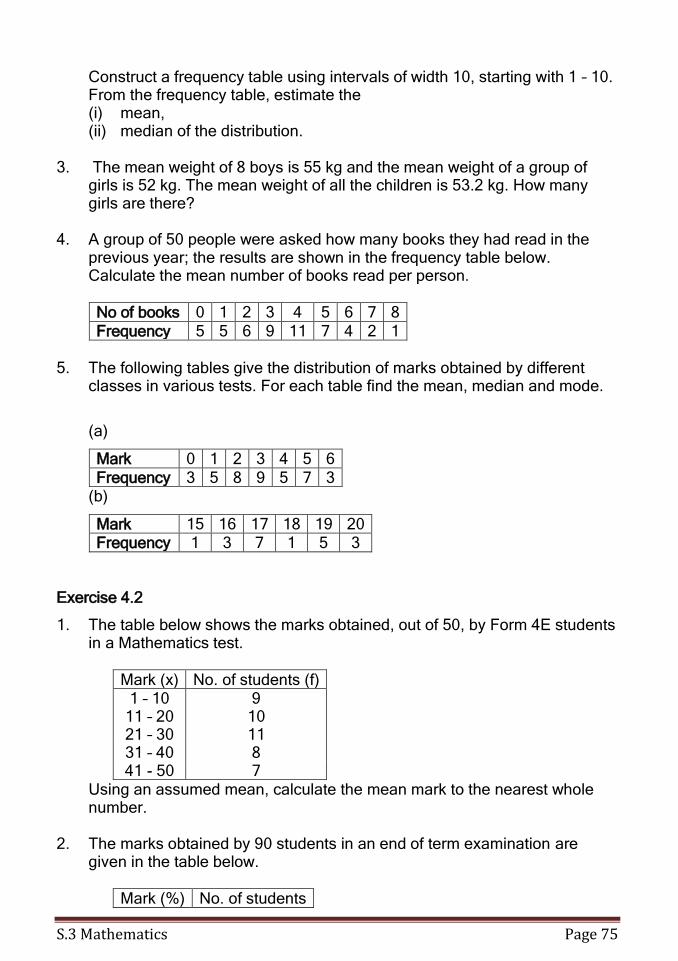
S.3 Mathematics Page 75
Construct a frequency table using intervals of width 10, starting with 1 – 10. From the frequency table, estimate the
(i) mean, (ii) median of the distribution.
3. The mean weight of 8 boys is 55 kg and the mean weight of a group of girls is 52 kg. The mean weight of all the children is 53.2 kg. How many girls are there?
4. A group of 50 people were asked how many books they had read in the
previous year; the results are shown in the frequency table below. Calculate the mean number of books read per person.
No of books 0 1 2 3 4 5 6 7 8
Frequency 5 5 6 9 11 7 4 2 1 5. The following tables give the distribution of marks obtained by different
classes in various tests. For each table find the mean, median and mode.
(a)
Mark 0 1 2 3 4 5 6
Frequency 3 5 8 9 5 7 3 (b)
Mark 15 16 17 18 19 20 Frequency 1 3 7 1 5 3
Exercise 4.2
1. The table below shows the marks obtained, out of 50, by Form 4E students in a Mathematics test.
Mark (x) No. of students (f) 1 – 10 9
11 – 20 10 21 – 30 11 31 – 40 8 41 - 50 7
Using an assumed mean, calculate the mean mark to the nearest whole number.
2. The marks obtained by 90 students in an end of term examination are
given in the table below.
Mark (%) No. of students
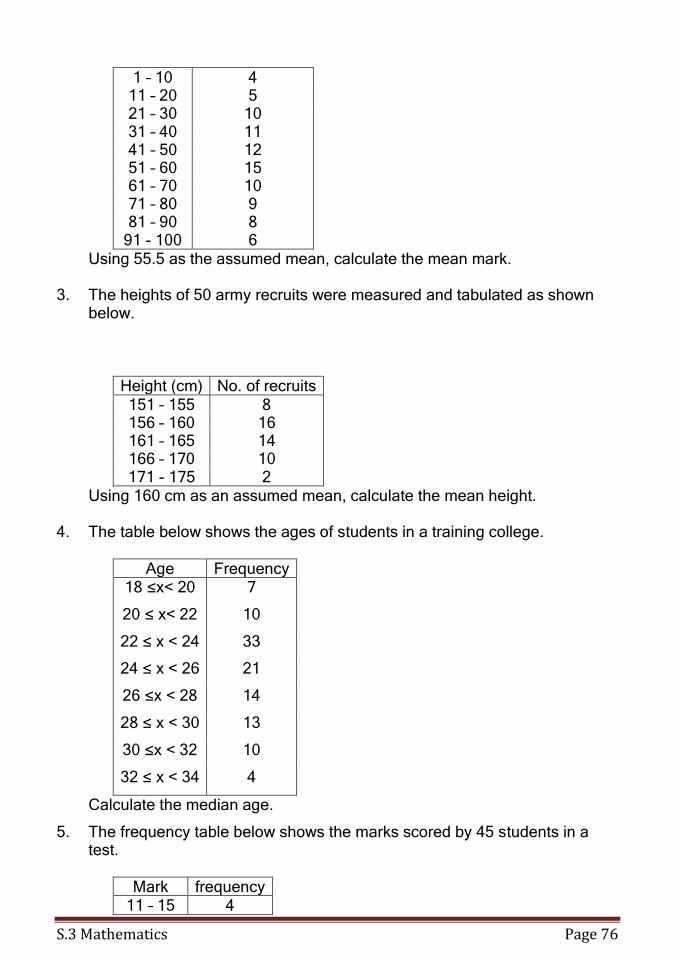
S.3 Mathematics Page 76
1 – 10 4 11 – 20 5 21 – 30 10 31 – 40 11 41 – 50 12 51 – 60 15 61 – 70 10 71 – 80 9 81 – 90 8
91 - 100 6 Using 55.5 as the assumed mean, calculate the mean mark.
3. The heights of 50 army recruits were measured and tabulated as shown below.
Height (cm) No. of recruits
151 – 155 8 156 – 160 16 161 – 165 14 166 – 170 10 171 - 175 2
Using 160 cm as an assumed mean, calculate the mean height.
4. The table below shows the ages of students in a training college.
Age Frequency 18 ≤x< 20 7
20 ≤ x< 22 10
22 ≤ x < 24 33
24 ≤ x < 26 21
26 ≤x < 28 14
28 ≤ x < 30 13
30 ≤x < 32 10
32 ≤ x < 34 4
Calculate the median age.
5. The frequency table below shows the marks scored by 45 students in a test.
Mark frequency
11 – 15 4
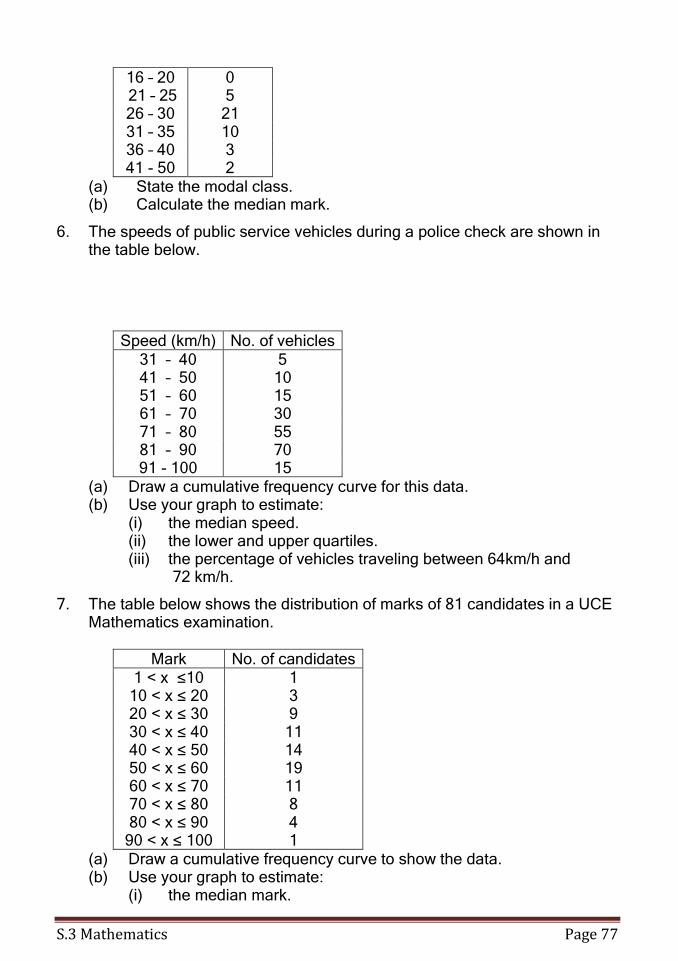
S.3 Mathematics Page 77
16 – 20 0 21 – 25 5 26 – 30 21 31 – 35 10 36 – 40 3 41 - 50 2
(a) State the modal class. (b) Calculate the median mark.
6. The speeds of public service vehicles during a police check are shown in the table below.
Speed (km/h) No. of vehicles
31 – 40 5 41 – 50 10 51 – 60 15 61 – 70 30 71 – 80 55 81 – 90 70 91 - 100 15
(a) Draw a cumulative frequency curve for this data. (b) Use your graph to estimate: (i) the median speed. (ii) the lower and upper quartiles. (iii) the percentage of vehicles traveling between 64km/h and 72 km/h.
7. The table below shows the distribution of marks of 81 candidates in a UCE Mathematics examination.
Mark No. of candidates 1 < x ≤10 1
10 < x ≤ 20 3 20 < x ≤ 30 9 30 < x ≤ 40 11 40 < x ≤ 50 14 50 < x ≤ 60 19 60 < x ≤ 70 11 70 < x ≤ 80 8 80 < x ≤ 90 4
90 < x ≤ 100 1 (a) Draw a cumulative frequency curve to show the data. (b) Use your graph to estimate: (i) the median mark.
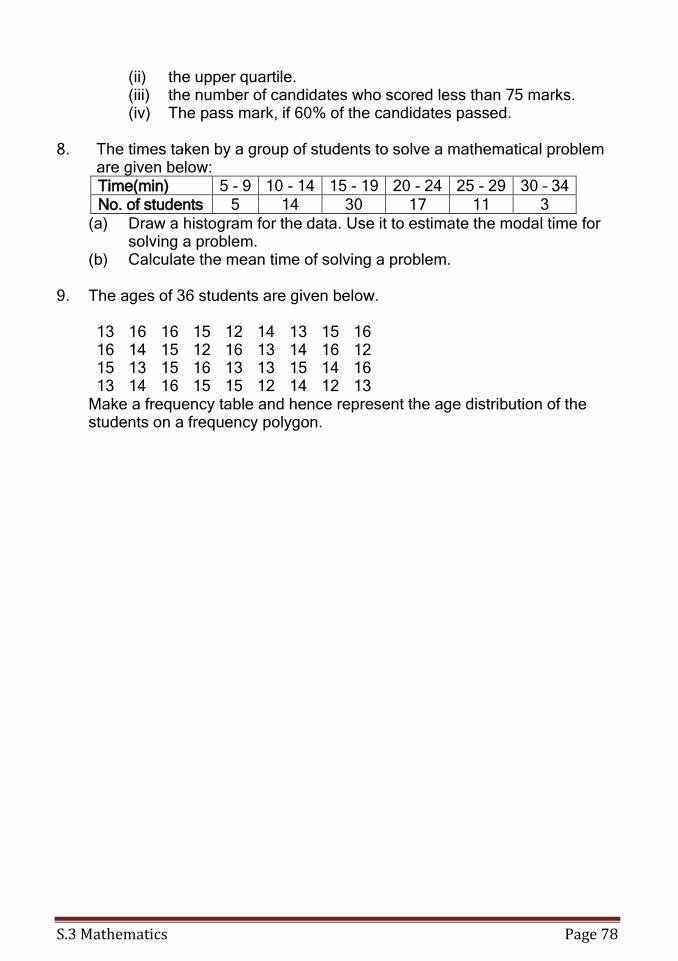
S.3 Mathematics Page 78
(ii) the upper quartile. (iii) the number of candidates who scored less than 75 marks. (iv) The pass mark, if 60% of the candidates passed.
8. The times taken by a group of students to solve a mathematical problem are given below: Time(min) 5 - 9 10 - 14 15 - 19 20 - 24 25 - 29 30 – 34 No. of students 5 14 30 17 11 3
(a) Draw a histogram for the data. Use it to estimate the modal time for solving a problem.
(b) Calculate the mean time of solving a problem.
9. The ages of 36 students are given below.
13 16 16 15 12 14 13 15 16 16 14 15 12 16 13 14 16 12 15 13 15 16 13 13 15 14 16 13 14 16 15 15 12 14 12 13
Make a frequency table and hence represent the age distribution of the students on a frequency polygon.
S.3 Mathematics Page 79
5. Probability
Probability is a numerical value given to the chance that a certain event will occur.
Probability that an event occurs = outcomes ofnumber total
outcomes e favourablofnumber
5.1 Definitions
(i) An experiment is any process by which data is obtained. (ii) The results of an experiment are called outcomes. (iii) A set of all possible outcomes that may occur in a particular experiment
is called a sample space, usually denoted by S. For example, (a) when a coin is tossed: S = {H, T} (b) when two coins are tossed: S = {HT, TH, HH, TT}. (c) When three coins are tossed:
S = {HHH, HHT, HTH, THH, TTH, THT, HTT, TTT} (d) when a die is thrown: S = {1, 2, 3, 4, 5, 6}, e.t.c.
(i) An event is a set consisting of possible outcomes of an experiment with desired qualities. It is a subset of a sample space.
5.2 Review of terms used in set theory.
1. Intersection of events.
Consider two events A and B of the sample space S, the intersection of
these two events is a set given by E = AB, i.e. containing sample points common to both A and B.
2. Union of events, denoted by AB, is the set of all sample points in either A or B or both.
3. Compliment of an event.
If A is an event of a sample space S, the compliment of A, denoted by
A, is given by the set containing all sample points in S that are not in A.

S.3 Mathematics Page 80
4. Mutually exclusive events
If two events A and B are mutually exclusive, then they cannot occur at the
same time. In other words AB =. For example, selecting ‘an even number’ or selecting a ‘one’ from a set of numbers; In tossing a coin, the events ‘Head’ and ‘Tails’ are mutually exclusive. If you get a ‘Head’, you cannot get a ‘Tail’ in the same toss. If a trial (experiment) has a set of equally likely possible outcomes S, then the probability of the event E occurring is given by
P (E) = )(
)(
S
E
5.3 Independent events
Two events are independent if the occurrence of one event is unaffected by the occurrence of the other. E.g. Obtaining a ‘head’ on one coin, and a ‘tail’ on the other coin when the coins are tossed at the same time.
5.4 Venn diagrams
Probabilities can be illustrated on a Venn diagram. The rectangle represents the entire sample space, and the circle represents the event A, as shown below.
When dealing with events, the words and and or are sometimes replaced by the
symbols and respectively. The event of A not happening is sometimes written as A . Combinations of probabilities can be shown on a Venn diagram, as follows.
A and B, i.e. AB. This is the overlap of the regions corresponding to A and B as shown in the figure below.
A
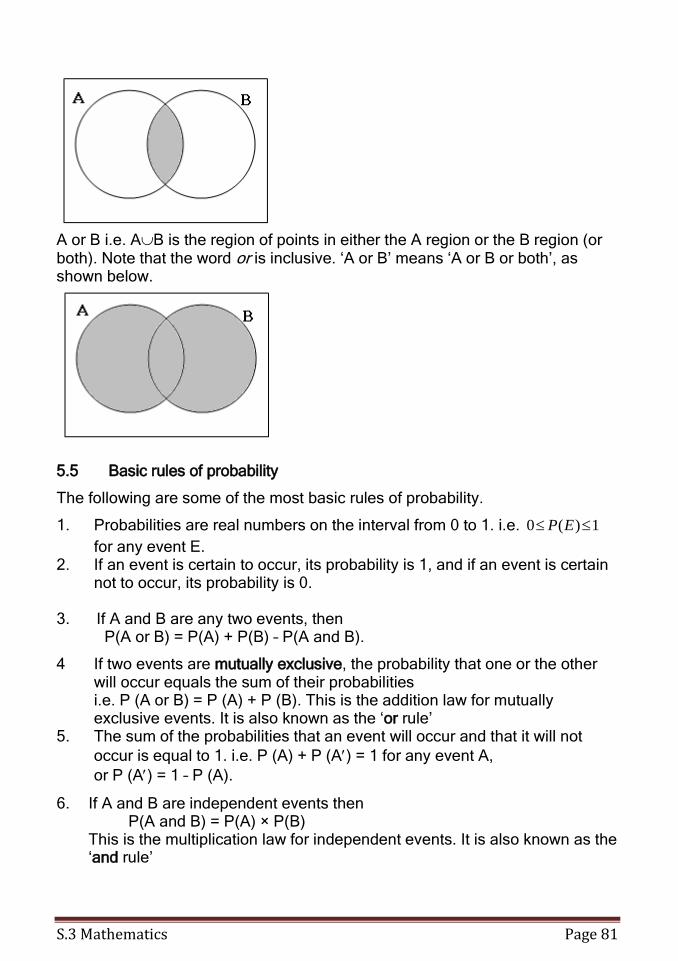
S.3 Mathematics Page 81
A or B i.e. AB is the region of points in either the A region or the B region (or both). Note that the word or is inclusive. ‘A or B’ means ‘A or B or both’, as shown below.
5.5 Basic rules of probability
The following are some of the most basic rules of probability.
1. Probabilities are real numbers on the interval from 0 to 1. i.e. 1)(0 EP
for any event E. 2. If an event is certain to occur, its probability is 1, and if an event is certain
not to occur, its probability is 0. 3. If A and B are any two events, then P(A or B) = P(A) + P(B) – P(A and B).
4 If two events are mutually exclusive, the probability that one or the other will occur equals the sum of their probabilities i.e. P (A or B) = P (A) + P (B). This is the addition law for mutually exclusive events. It is also known as the ‘or rule’
5. The sum of the probabilities that an event will occur and that it will not
occur is equal to 1. i.e. P (A) + P (A) = 1 for any event A,
or P (A) = 1 – P (A).
6. If A and B are independent events then P(A and B) = P(A) × P(B) This is the multiplication law for independent events. It is also known as the ‘and rule’
S.3 Mathematics Page 82
In questions on probability, when the following terms are used, great care must be taken. To understand the terms we take, for example a family of 4 children, where B represents a boy and G represents a girl. (i) at least ‘at least two are boys, B ≥ 2. Therefore, B can take values 2, 3 or 4.
(ii) ‘at most’ ‘at most two are boys’, i.e. B 2. Therefore, B can take values 2, 1 or 0.
(iii) Not more than ‘Not more than two boys’ and ‘at most two boys’ mean the same.
(iv) Not less than ‘not less than two boys ‘ and ‘at least two boys’ mean the same.
(v) More than ‘more than two boys’, i.e. B > 2. Therefore B can take values 3 or 4.
(vi) Less than ‘less than two boys’, i.e. B < 2. Therefore, B can take values 0 or 1.
Example 5.1
The numbers 1 to 20 are each written on a card. The 20 cards are mixed together. One card is chosen at random from the pack. Find the probability that the number on the card is: (a) even (b) a factor of 24 (c) prime.
Solution
We will use ‘P(x)’ to mean ‘the probability of x’. Let S be the sample space such that S = {1, 2, 3, 4, 5, 6, 7, 8, ……, 20}
(a) P(even) = packthe in numbers
numbers even
ofnumber total
ofnumber =
20
10 =
2
1
(b) P(a factor of 24) = packthe in numbers
f
ofnumber total
24 of actors ofnumber
The factors of 24 are: F24 = {1, 2, 3, 4, 6, 8 12, 24}.
( )24∩F = 8
Therefore, P(a factor of 24) = 20
8 =
5
2
(c) Prime numbers in the pack = {2, 3, 5, 7, 11, 13, 17, 19 }
P(prime) = packthe in numbers
p
ofnumber total
pack the in numbers rime ofnumber =
20
8 =
5
2.
Example 5.2
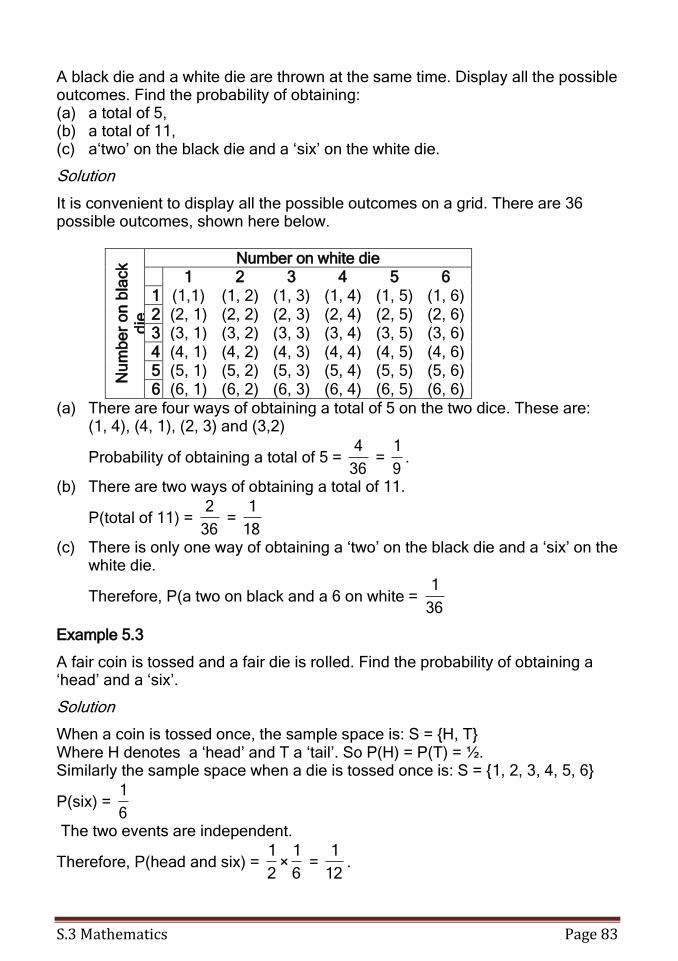
S.3 Mathematics Page 83
A black die and a white die are thrown at the same time. Display all the possible outcomes. Find the probability of obtaining: (a) a total of 5, (b) a total of 11, (c) a‘two’ on the black die and a ‘six’ on the white die.
Solution
It is convenient to display all the possible outcomes on a grid. There are 36 possible outcomes, shown here below.
Nu
mb
er
on
bla
ck
die
Number on white die 1 2 3 4 5 6
1 (1,1) (1, 2) (1, 3) (1, 4) (1, 5) (1, 6) 2 (2, 1) (2, 2) (2, 3) (2, 4) (2, 5) (2, 6) 3 (3, 1) (3, 2) (3, 3) (3, 4) (3, 5) (3, 6)
4 (4, 1) (4, 2) (4, 3) (4, 4) (4, 5) (4, 6) 5 (5, 1) (5, 2) (5, 3) (5, 4) (5, 5) (5, 6) 6 (6, 1) (6, 2) (6, 3) (6, 4) (6, 5) (6, 6)
(a) There are four ways of obtaining a total of 5 on the two dice. These are: (1, 4), (4, 1), (2, 3) and (3,2)
Probability of obtaining a total of 5 = 36
4 =
9
1.
(b) There are two ways of obtaining a total of 11.
P(total of 11) = 36
2 =
18
1
(c) There is only one way of obtaining a ‘two’ on the black die and a ‘six’ on the white die.
Therefore, P(a two on black and a 6 on white = 36
1
Example 5.3
A fair coin is tossed and a fair die is rolled. Find the probability of obtaining a ‘head’ and a ‘six’.
Solution
When a coin is tossed once, the sample space is: S = {H, T} Where H denotes a ‘head’ and T a ‘tail’. So P(H) = P(T) = ½. Similarly the sample space when a die is tossed once is: S = {1, 2, 3, 4, 5, 6}
P(six) = 6
1
The two events are independent.
Therefore, P(head and six) = 6
1×
2
1 =
12
1.
S.3 Mathematics Page 84
Exercise 5.1
In this exercise, all dice are normal cubic dice with faces numbered 1 to 6.
1. A fair die is thrown once. Find the probability of obtaining: (a) a six, (b) an even number, (c) a number greater than 3, (d) a three or a five.
2. The two sides of a coin are known as ‘head’ and ‘tail’. Two coins are tossed at the same time. List all the possible outcomes. Find the probability of obtaining
(a) two heads, (b) a head and a tail.
3. A bag contains 6 red balls and 4 green balls. (a) Find the probability of selecting at random: (i) a red ball (ii) a green ball. (b) One red ball is removed from the bag. Find the new probability of
selecting at random: (i) a red ball (ii) a green ball.
4. One letter is selected at random from the word ‘UNNECESSARY’. Find the probability of selecting:
(a) an R (b) an E (c) an O 5. Three coins are tossed at the same time. List all the possible outcomes.
Find the probability of obtaining: (a) three heads, (b) two heads and one tail, (c) no heads, (d) at least one head.
6. A bag contains 10 red balls, 5 blue balls and 7 green balls. Find the probability of selecting at random:
(a) a red ball, (b) a green ball, (c) a blue or a red ball, (d) a red or a green ball.
7. A red die and a blue die are thrown at the same time. List all the possible outcomes in a systematic way. Find the probability of obtaining:
(a) a total of 10. (b) a total of 12. (c) a total less than 6. (d) the same number on both dice. (e) a total more than 9.
8. A die is thrown; when the result has been recorded, the die is thrown a second time. Display all the possible outcomes of the two throws. Find the probability of obtaining:
(a) a total of 4 from the two throws.
S.3 Mathematics Page 85
(b) a total of 8 from the two throws, (c) a total between 5 and 9 inclusive from the two throws, (d) a number on the second throw which is four times the number on the
first throw.
9. One ball is selected at random from a bag containing 12 balls of which x are white. (a) What is the probability of selecting a white ball? When a further 6 white balls are added the probability of selecting a white ball is doubled.
(c) Find x.
10. A coin is tossed and a die is thrown. Write down the probability of obtaining:
(a) a head on the coin, (b) an odd number on the die, (c) a ‘head’ on the coin and an odd number on the die.
11. A ball is selected from a bag containing 3 red balls, 4 black balls and 5 green balls. The first ball is replaced and a second is selected. Find the probability of obtaining
(a) two red balls, (b) two green balls.
12. The letters of the word ‘INDEPENDENT’ are written on individual cards and the cards are put into a box. A card is selected at random and then replaced and then a second card is selected. Find the probability of obtaining: (a) the letter ‘P’ twice, (b) the letter ‘E’ twice.
13. The table below shows the number of children in 40 randomly chosen families.
No. of children (x) 0 1 2 3 4 5 Over 5 Total No. of families (f) 6 8 12 5 3 6 0 40
State the probability that a family chosen at random has: (a) more than 2 children, (b) an odd number of children, (c) P(2 ≤ x < 4).
14 Two tetrahedral dice (4 sided), each with faces labeled 1, 2, 3 and 4 are thrown. The score is the sum of the two numbers on which the dice land. Find the possibility space and the probability of each element of the space.
15. Two dice (6 sided), each with faces labeled 1, 2, 3, 4, 5, 6 are thrown. The
score is the difference of the numbers showing on the top faces on two dice. For example, (5, 2) would score 3, as would (2, 5). Find the possibility space and the probability of each score.
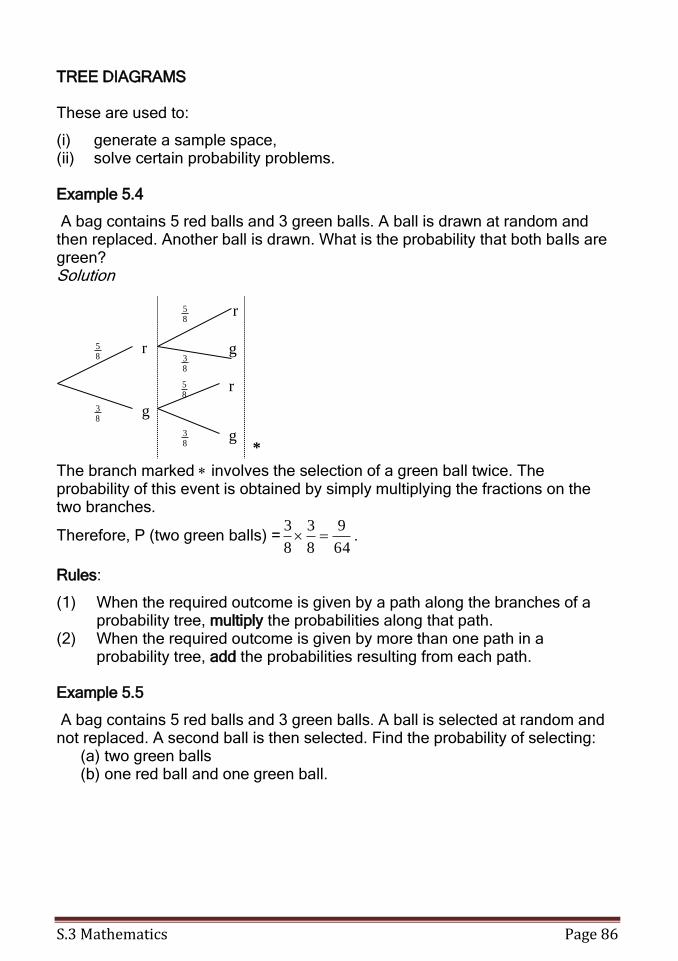
S.3 Mathematics Page 86
TREE DIAGRAMS
These are used to:
(i) generate a sample space, (ii) solve certain probability problems.
Example 5.4
A bag contains 5 red balls and 3 green balls. A ball is drawn at random and then replaced. Another ball is drawn. What is the probability that both balls are green? Solution
The branch marked involves the selection of a green ball twice. The probability of this event is obtained by simply multiplying the fractions on the two branches.
Therefore, P (two green balls) =64
9
8
3
8
3 .
Rules:
(1) When the required outcome is given by a path along the branches of a probability tree, multiply the probabilities along that path.
(2) When the required outcome is given by more than one path in a probability tree, add the probabilities resulting from each path.
Example 5.5
A bag contains 5 red balls and 3 green balls. A ball is selected at random and not replaced. A second ball is then selected. Find the probability of selecting:
(a) two green balls (b) one red ball and one green ball.
85 r
g
r
g
r
g
83
83
85
85
83
*
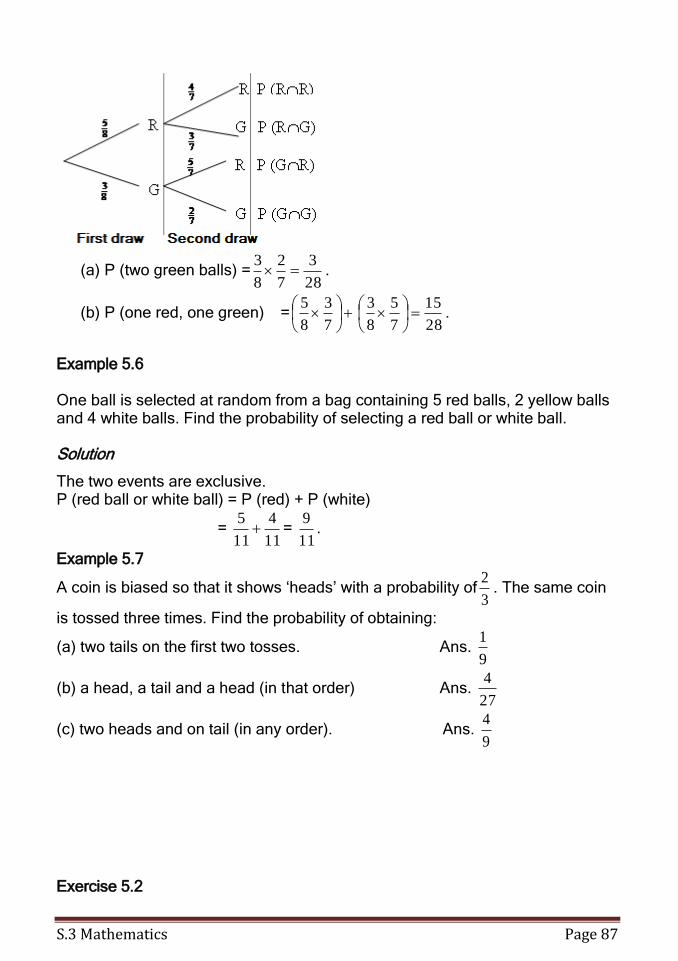
S.3 Mathematics Page 87
(a) P (two green balls) =28
3
7
2
8
3 .
(b) P (one red, one green) =
7
3
8
5
28
15
7
5
8
3
.
Example 5.6
One ball is selected at random from a bag containing 5 red balls, 2 yellow balls and 4 white balls. Find the probability of selecting a red ball or white ball. Solution
The two events are exclusive. P (red ball or white ball) = P (red) + P (white)
= 11
4
11
5 =
11
9.
Example 5.7
A coin is biased so that it shows ‘heads’ with a probability of3
2. The same coin
is tossed three times. Find the probability of obtaining:
(a) two tails on the first two tosses. Ans. 9
1
(b) a head, a tail and a head (in that order) Ans. 27
4
(c) two heads and on tail (in any order). Ans. 9
4
Exercise 5.2
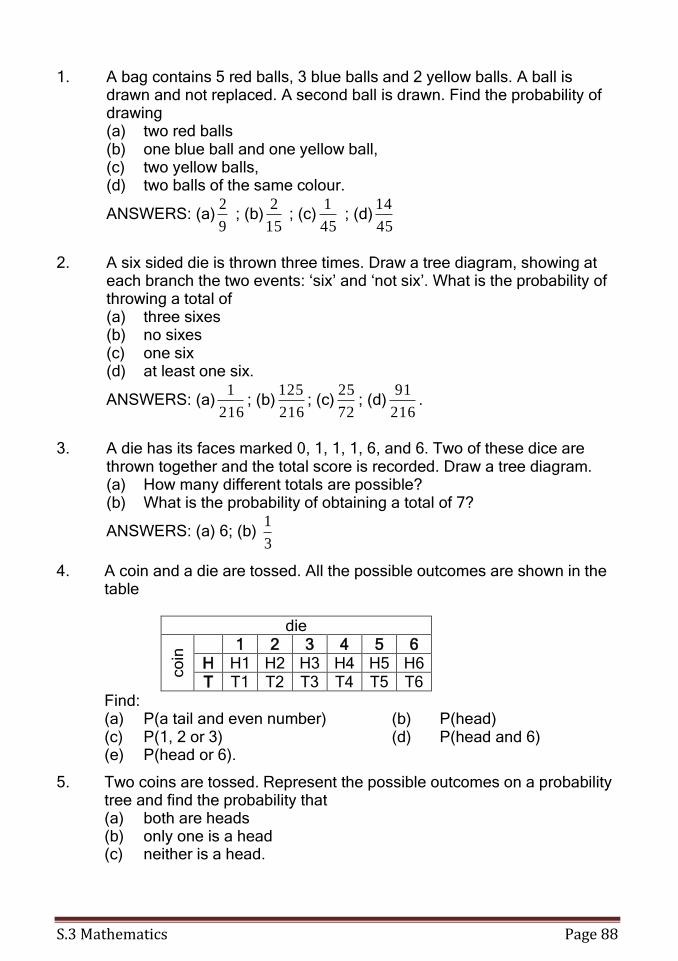
S.3 Mathematics Page 88
1. A bag contains 5 red balls, 3 blue balls and 2 yellow balls. A ball is drawn and not replaced. A second ball is drawn. Find the probability of drawing (a) two red balls (b) one blue ball and one yellow ball, (c) two yellow balls, (d) two balls of the same colour.
ANSWERS: (a)9
2 ; (b)
15
2 ; (c)
45
1 ; (d)
45
14
2. A six sided die is thrown three times. Draw a tree diagram, showing at
each branch the two events: ‘six’ and ‘not six’. What is the probability of throwing a total of (a) three sixes (b) no sixes (c) one six (d) at least one six.
ANSWERS: (a)216
1; (b)
216
125; (c)
72
25; (d)
216
91.
3. A die has its faces marked 0, 1, 1, 1, 6, and 6. Two of these dice are
thrown together and the total score is recorded. Draw a tree diagram. (a) How many different totals are possible? (b) What is the probability of obtaining a total of 7?
ANSWERS: (a) 6; (b) 3
1
4. A coin and a die are tossed. All the possible outcomes are shown in the table
die
co
in 1 2 3 4 5 6
H H1 H2 H3 H4 H5 H6 T T1 T2 T3 T4 T5 T6
Find: (a) P(a tail and even number) (b) P(head) (c) P(1, 2 or 3) (d) P(head and 6) (e) P(head or 6).
5. Two coins are tossed. Represent the possible outcomes on a probability tree and find the probability that
(a) both are heads (b) only one is a head (c) neither is a head.
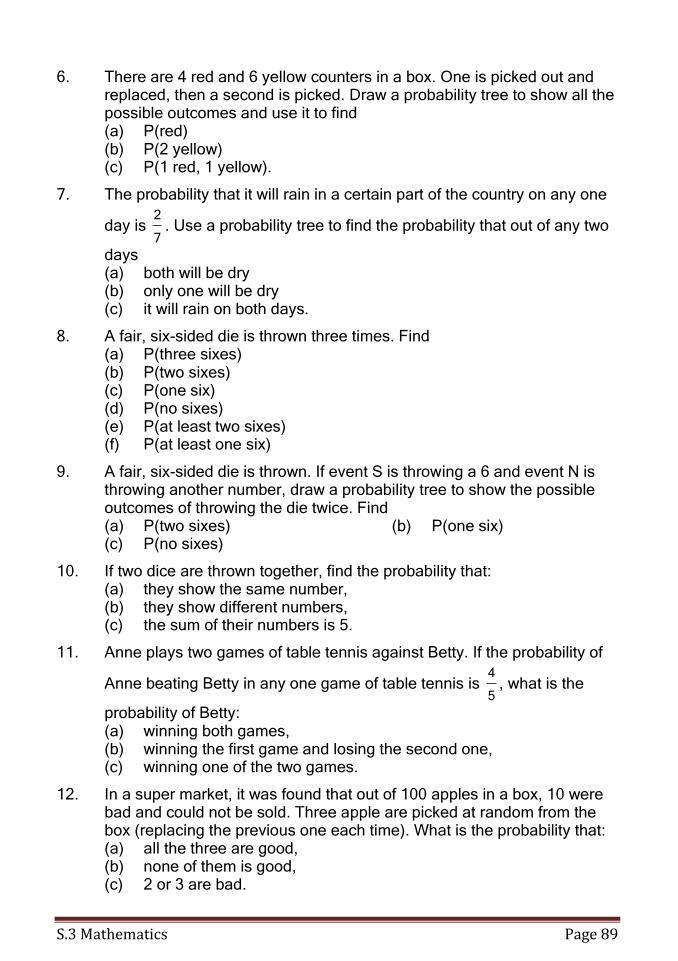
S.3 Mathematics Page 89
6. There are 4 red and 6 yellow counters in a box. One is picked out and replaced, then a second is picked. Draw a probability tree to show all the possible outcomes and use it to find
(a) P(red) (b) P(2 yellow) (c) P(1 red, 1 yellow).
7. The probability that it will rain in a certain part of the country on any one
day is 7
2. Use a probability tree to find the probability that out of any two
days (a) both will be dry (b) only one will be dry (c) it will rain on both days.
8. A fair, six-sided die is thrown three times. Find (a) P(three sixes) (b) P(two sixes) (c) P(one six) (d) P(no sixes) (e) P(at least two sixes) (f) P(at least one six)
9. A fair, six-sided die is thrown. If event S is throwing a 6 and event N is throwing another number, draw a probability tree to show the possible outcomes of throwing the die twice. Find
(a) P(two sixes) (b) P(one six) (c) P(no sixes)
10. If two dice are thrown together, find the probability that: (a) they show the same number, (b) they show different numbers, (c) the sum of their numbers is 5.
11. Anne plays two games of table tennis against Betty. If the probability of
Anne beating Betty in any one game of table tennis is 5
4, what is the
probability of Betty: (a) winning both games, (b) winning the first game and losing the second one, (c) winning one of the two games.
12. In a super market, it was found that out of 100 apples in a box, 10 were bad and could not be sold. Three apple are picked at random from the box (replacing the previous one each time). What is the probability that:
(a) all the three are good, (b) none of them is good, (c) 2 or 3 are bad.
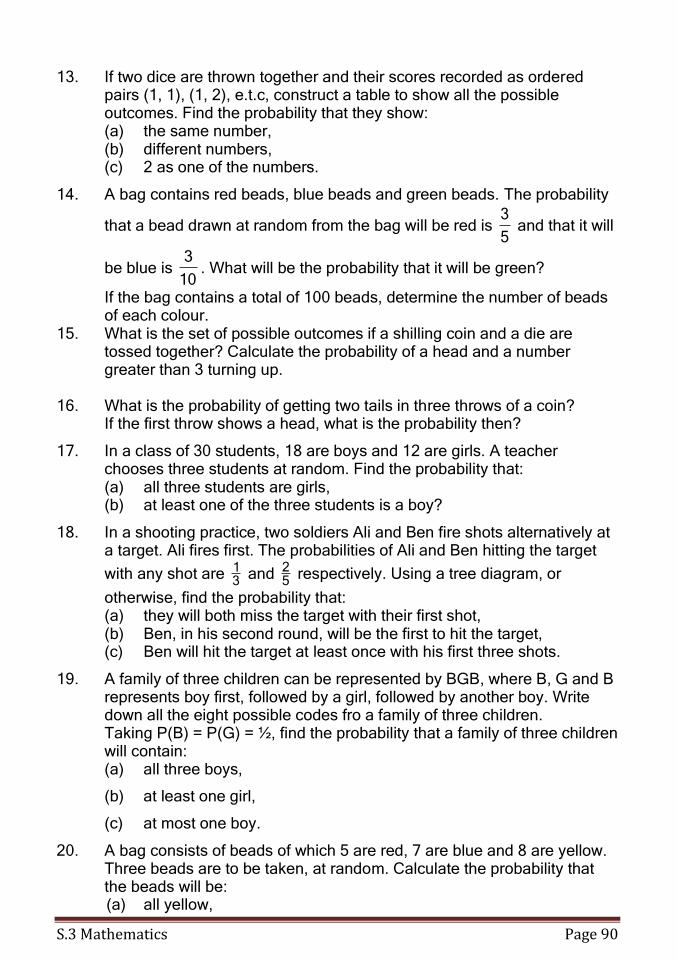
S.3 Mathematics Page 90
13. If two dice are thrown together and their scores recorded as ordered pairs (1, 1), (1, 2), e.t.c, construct a table to show all the possible outcomes. Find the probability that they show:
(a) the same number, (b) different numbers, (c) 2 as one of the numbers.
14. A bag contains red beads, blue beads and green beads. The probability
that a bead drawn at random from the bag will be red is 5
3 and that it will
be blue is 10
3. What will be the probability that it will be green?
If the bag contains a total of 100 beads, determine the number of beads of each colour.
15. What is the set of possible outcomes if a shilling coin and a die are tossed together? Calculate the probability of a head and a number greater than 3 turning up.
16. What is the probability of getting two tails in three throws of a coin? If the first throw shows a head, what is the probability then?
17. In a class of 30 students, 18 are boys and 12 are girls. A teacher chooses three students at random. Find the probability that:
(a) all three students are girls, (b) at least one of the three students is a boy?
18. In a shooting practice, two soldiers Ali and Ben fire shots alternatively at a target. Ali fires first. The probabilities of Ali and Ben hitting the target
with any shot are 31 and 5
2 respectively. Using a tree diagram, or
otherwise, find the probability that: (a) they will both miss the target with their first shot, (b) Ben, in his second round, will be the first to hit the target, (c) Ben will hit the target at least once with his first three shots.
19. A family of three children can be represented by BGB, where B, G and B represents boy first, followed by a girl, followed by another boy. Write down all the eight possible codes fro a family of three children.
Taking P(B) = P(G) = ½, find the probability that a family of three children will contain: (a) all three boys,
(b) at least one girl,
(c) at most one boy.
20. A bag consists of beads of which 5 are red, 7 are blue and 8 are yellow. Three beads are to be taken, at random. Calculate the probability that the beads will be:
(a) all yellow,
S.3 Mathematics Page 91
(b) all three of the same colour
(c) all three of different colour,
(d) all three are not of the same colour.
6. Sets
In Book One, we discussed sets. We said that a set was a collection of objects with something in common. These objects are called elements of the set. 6.1 Symbols:
Below are some of the symbols used in sets:
(a) Curly brackets: this means ‘the set of’
E.g. people in this room means ‘the set of people in this room’
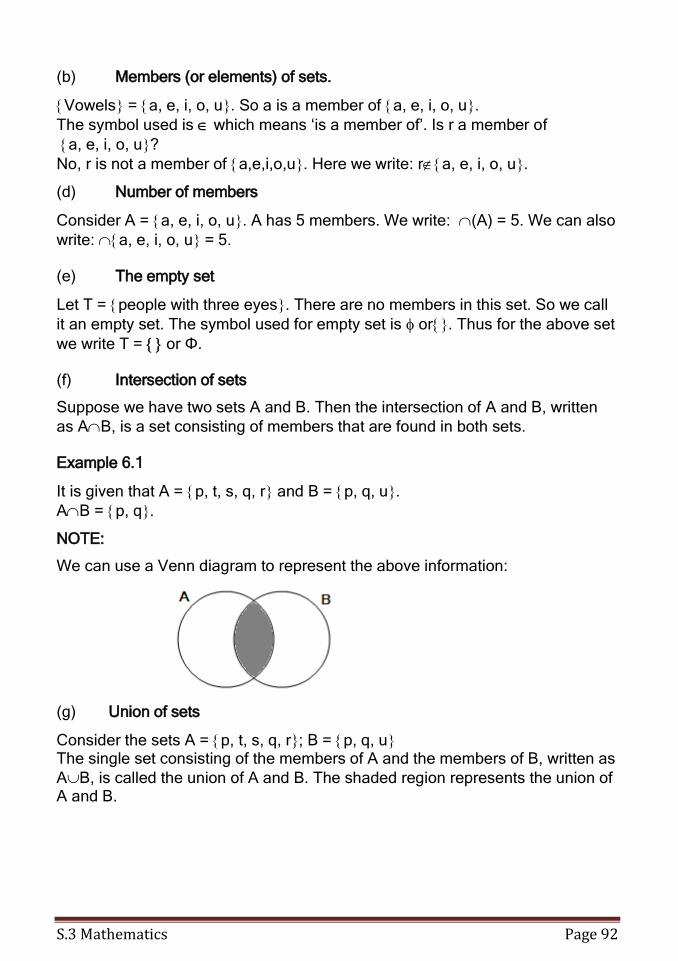
S.3 Mathematics Page 92
(b) Members (or elements) of sets.
Vowels = a, e, i, o, u. So a is a member of a, e, i, o, u.
The symbol used is which means ‘is a member of’. Is r a member of
a, e, i, o, u?
No, r is not a member of a,e,i,o,u. Here we write: ra, e, i, o, u.
(d) Number of members
Consider A = a, e, i, o, u. A has 5 members. We write: (A) = 5. We can also
write: a, e, i, o, u = 5. (e) The empty set
Let T = people with three eyes. There are no members in this set. So we call
it an empty set. The symbol used for empty set is or. Thus for the above set
we write T = or Φ. (f) Intersection of sets
Suppose we have two sets A and B. Then the intersection of A and B, written
as AB, is a set consisting of members that are found in both sets. Example 6.1
It is given that A = p, t, s, q, r and B = p, q, u.
AB = p, q.
NOTE:
We can use a Venn diagram to represent the above information:
(g) Union of sets
Consider the sets A = p, t, s, q, r; B = p, q, u The single set consisting of the members of A and the members of B, written as
AB, is called the union of A and B. The shaded region represents the union of A and B.
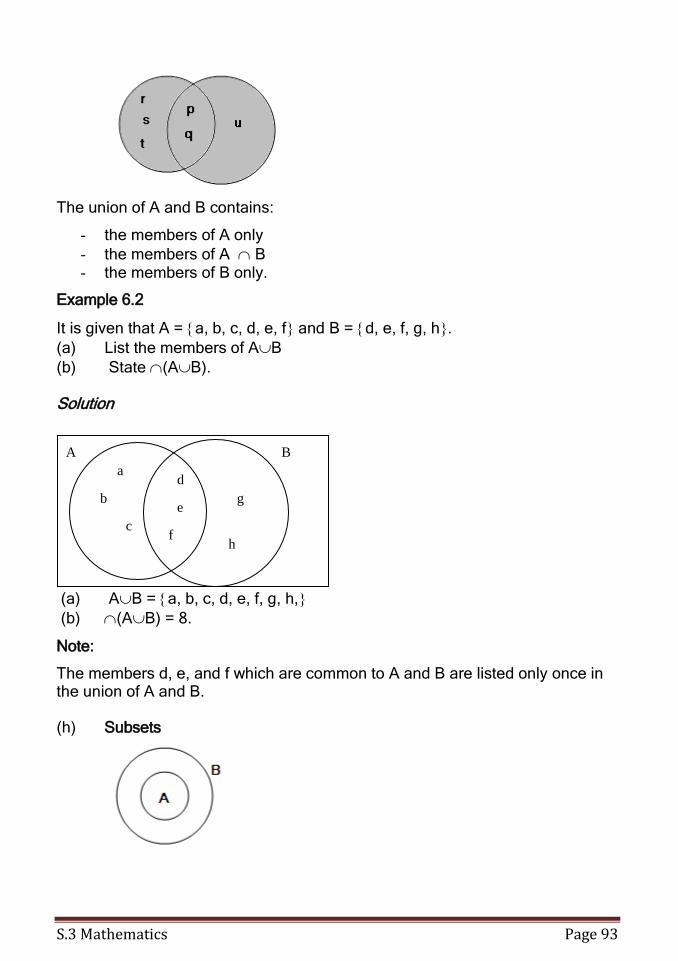
S.3 Mathematics Page 93
The union of A and B contains:
- the members of A only
- the members of A B - the members of B only.
Example 6.2
It is given that A = a, b, c, d, e, f and B = d, e, f, g, h.
(a) List the members of AB
(b) State (AB). Solution
(a) AB = a, b, c, d, e, f, g, h,
(b) (AB) = 8.
Note:
The members d, e, and f which are common to A and B are listed only once in the union of A and B. (h) Subsets
d
e g
a
b
c
A B
f h
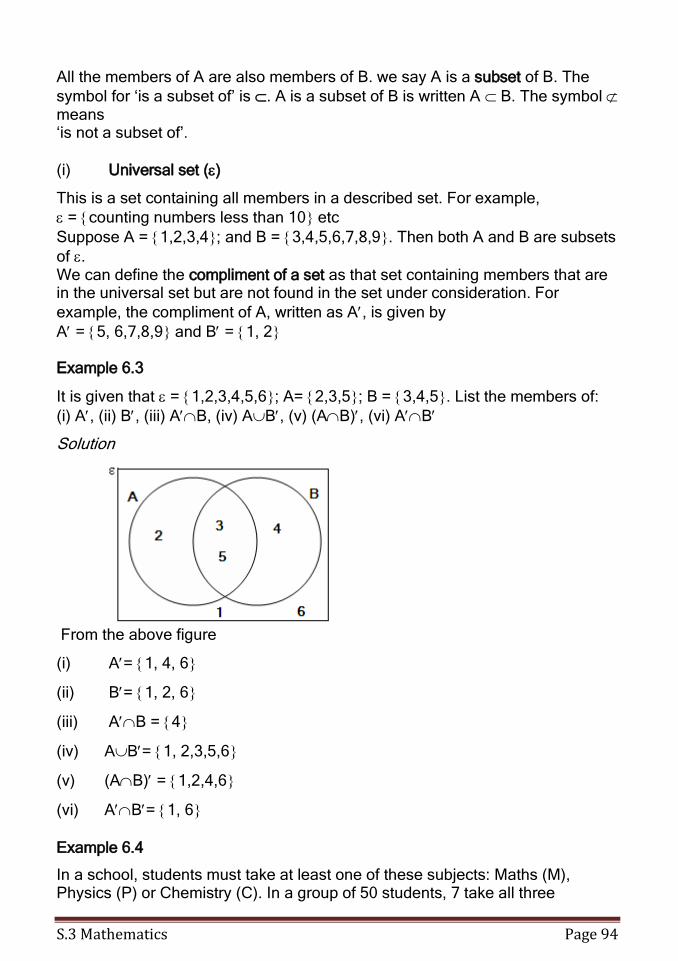
S.3 Mathematics Page 94
All the members of A are also members of B. we say A is a subset of B. The
symbol for ‘is a subset of’ is . A is a subset of B is written A B. The symbol means ‘is not a subset of’.
(i) Universal set ()
This is a set containing all members in a described set. For example,
= counting numbers less than 10 etc
Suppose A = 1,2,3,4; and B = 3,4,5,6,7,8,9. Then both A and B are subsets
of . We can define the compliment of a set as that set containing members that are in the universal set but are not found in the set under consideration. For
example, the compliment of A, written as A, is given by
A = 5, 6,7,8,9 and B = 1, 2 Example 6.3
It is given that = 1,2,3,4,5,6; A= 2,3,5; B = 3,4,5. List the members of:
(i) A, (ii) B, (iii) AB, (iv) AB, (v) (AB), (vi) AB
Solution
From the above figure
(i) A= 1, 4, 6
(ii) B= 1, 2, 6
(iii) AB = 4
(iv) AB= 1, 2,3,5,6
(v) (AB) = 1,2,4,6
(vi) AB= 1, 6
Example 6.4
In a school, students must take at least one of these subjects: Maths (M), Physics (P) or Chemistry (C). In a group of 50 students, 7 take all three
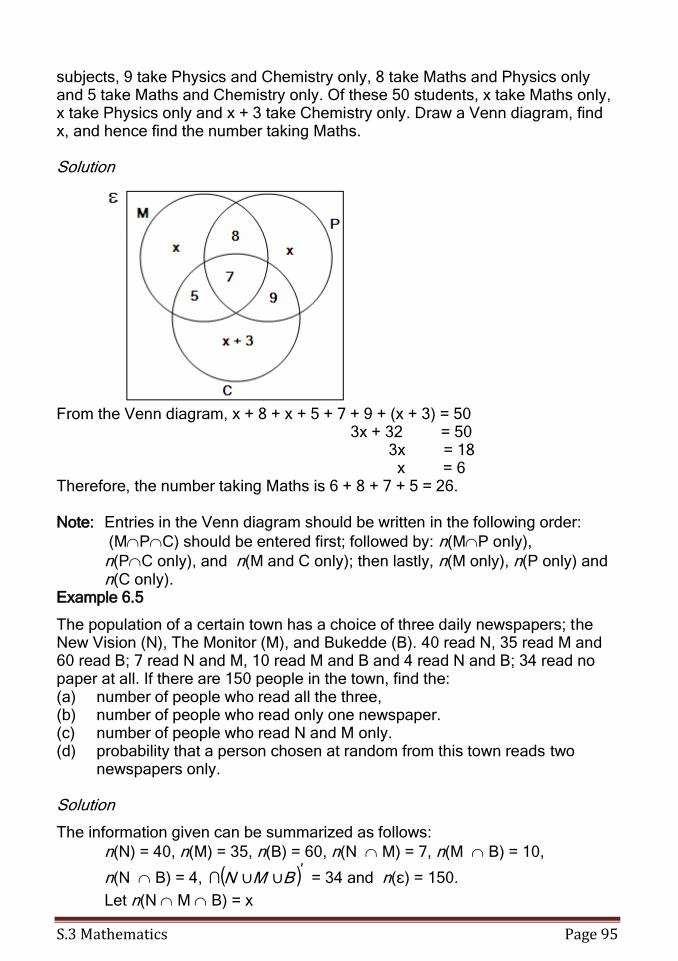
S.3 Mathematics Page 95
subjects, 9 take Physics and Chemistry only, 8 take Maths and Physics only and 5 take Maths and Chemistry only. Of these 50 students, x take Maths only, x take Physics only and x + 3 take Chemistry only. Draw a Venn diagram, find x, and hence find the number taking Maths. Solution
From the Venn diagram, x + 8 + x + 5 + 7 + 9 + (x + 3) = 50 3x + 32 = 50 3x = 18 x = 6 Therefore, the number taking Maths is 6 + 8 + 7 + 5 = 26.
Note: Entries in the Venn diagram should be written in the following order:
(MPC) should be entered first; followed by: n(MP only),
n(PC only), and n(M and C only); then lastly, n(M only), n(P only) and n(C only).
Example 6.5
The population of a certain town has a choice of three daily newspapers; the New Vision (N), The Monitor (M), and Bukedde (B). 40 read N, 35 read M and 60 read B; 7 read N and M, 10 read M and B and 4 read N and B; 34 read no paper at all. If there are 150 people in the town, find the: (a) number of people who read all the three, (b) number of people who read only one newspaper. (c) number of people who read N and M only. (d) probability that a person chosen at random from this town reads two
newspapers only. Solution
The information given can be summarized as follows:
n(N) = 40, n(M) = 35, n(B) = 60, n(N M) = 7, n(M B) = 10,
n(N B) = 4, ( )′∪∪∩ BMN = 34 and n(ε) = 150.
Let n(N M B) = x
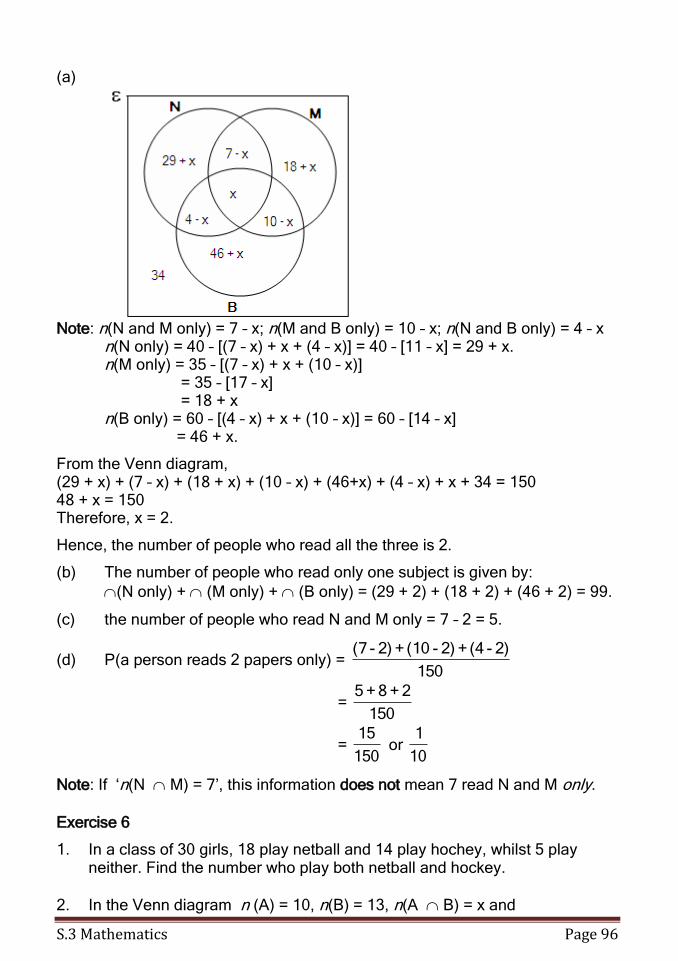
S.3 Mathematics Page 96
(a)
Note: n(N and M only) = 7 – x; n(M and B only) = 10 – x; n(N and B only) = 4 – x n(N only) = 40 – [(7 – x) + x + (4 – x)] = 40 – [11 – x] = 29 + x. n(M only) = 35 – [(7 – x) + x + (10 – x)] = 35 – [17 – x] = 18 + x n(B only) = 60 – [(4 – x) + x + (10 – x)] = 60 – [14 – x] = 46 + x.
From the Venn diagram, (29 + x) + (7 – x) + (18 + x) + (10 – x) + (46+x) + (4 – x) + x + 34 = 150 48 + x = 150 Therefore, x = 2.
Hence, the number of people who read all the three is 2.
(b) The number of people who read only one subject is given by:
(N only) + (M only) + (B only) = (29 + 2) + (18 + 2) + (46 + 2) = 99.
(c) the number of people who read N and M only = 7 – 2 = 5.
(d) P(a person reads 2 papers only) = 150
2) - (4 + 2) - (10 + 2) - (7
= 150
2 + 8 + 5
= 150
15 or
10
1
Note: If ‘n(N M) = 7’, this information does not mean 7 read N and M only.
Exercise 6
1. In a class of 30 girls, 18 play netball and 14 play hochey, whilst 5 play neither. Find the number who play both netball and hockey.
2. In the Venn diagram n (A) = 10, n(B) = 13, n(A B) = x and
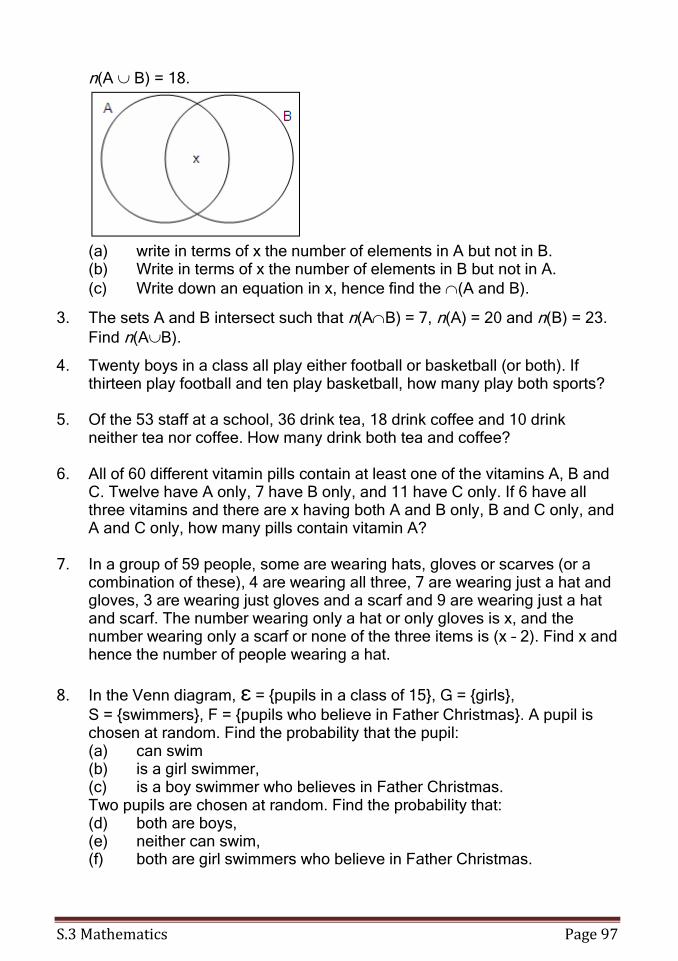
S.3 Mathematics Page 97
n(A B) = 18.
(a) write in terms of x the number of elements in A but not in B. (b) Write in terms of x the number of elements in B but not in A.
(c) Write down an equation in x, hence find the (A and B).
3. The sets A and B intersect such that n(AB) = 7, n(A) = 20 and n(B) = 23.
Find n(AB).
4. Twenty boys in a class all play either football or basketball (or both). If thirteen play football and ten play basketball, how many play both sports?
5. Of the 53 staff at a school, 36 drink tea, 18 drink coffee and 10 drink
neither tea nor coffee. How many drink both tea and coffee? 6. All of 60 different vitamin pills contain at least one of the vitamins A, B and
C. Twelve have A only, 7 have B only, and 11 have C only. If 6 have all three vitamins and there are x having both A and B only, B and C only, and A and C only, how many pills contain vitamin A?
7. In a group of 59 people, some are wearing hats, gloves or scarves (or a
combination of these), 4 are wearing all three, 7 are wearing just a hat and gloves, 3 are wearing just gloves and a scarf and 9 are wearing just a hat and scarf. The number wearing only a hat or only gloves is x, and the number wearing only a scarf or none of the three items is (x – 2). Find x and hence the number of people wearing a hat.
8. In the Venn diagram, ε = {pupils in a class of 15}, G = {girls},
S = {swimmers}, F = {pupils who believe in Father Christmas}. A pupil is chosen at random. Find the probability that the pupil: (a) can swim (b) is a girl swimmer, (c) is a boy swimmer who believes in Father Christmas. Two pupils are chosen at random. Find the probability that: (d) both are boys, (e) neither can swim, (f) both are girl swimmers who believe in Father Christmas.
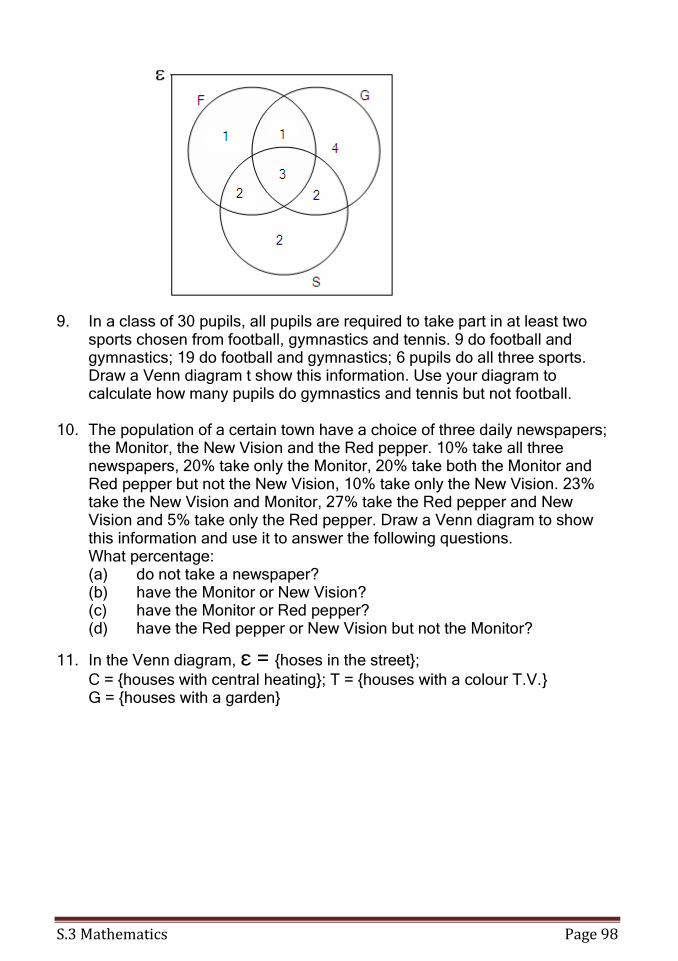
S.3 Mathematics Page 98
9. In a class of 30 pupils, all pupils are required to take part in at least two sports chosen from football, gymnastics and tennis. 9 do football and gymnastics; 19 do football and gymnastics; 6 pupils do all three sports. Draw a Venn diagram t show this information. Use your diagram to calculate how many pupils do gymnastics and tennis but not football.
10. The population of a certain town have a choice of three daily newspapers;
the Monitor, the New Vision and the Red pepper. 10% take all three newspapers, 20% take only the Monitor, 20% take both the Monitor and Red pepper but not the New Vision, 10% take only the New Vision. 23% take the New Vision and Monitor, 27% take the Red pepper and New Vision and 5% take only the Red pepper. Draw a Venn diagram to show this information and use it to answer the following questions.
What percentage: (a) do not take a newspaper? (b) have the Monitor or New Vision? (c) have the Monitor or Red pepper? (d) have the Red pepper or New Vision but not the Monitor?
11. In the Venn diagram, ε = {hoses in the street};
C = {houses with central heating}; T = {houses with a colour T.V.} G = {houses with a garden}
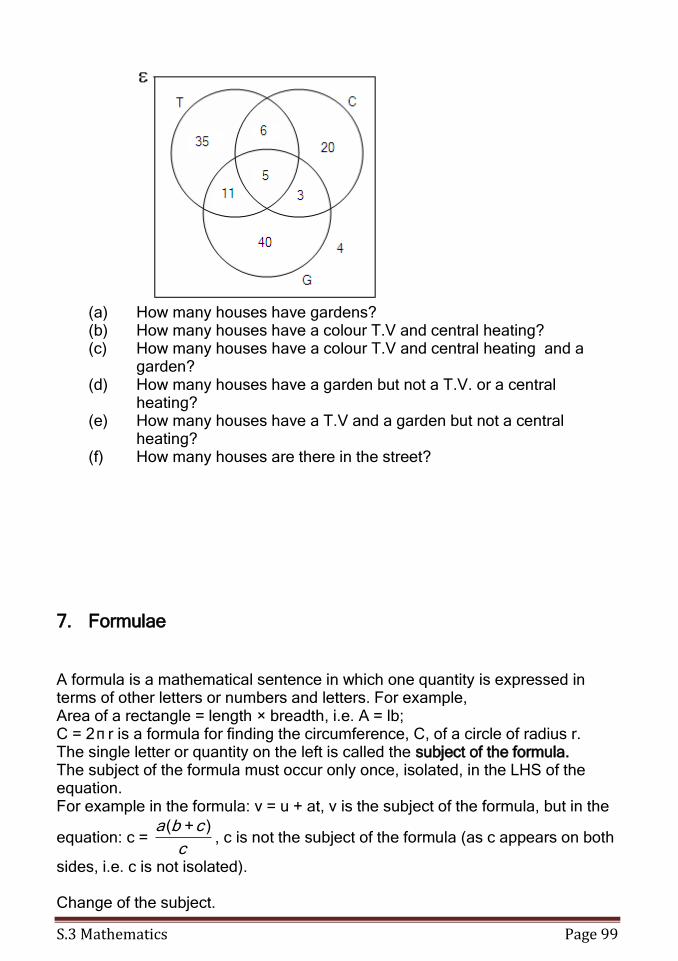
S.3 Mathematics Page 99
(a) How many houses have gardens? (b) How many houses have a colour T.V and central heating? (c) How many houses have a colour T.V and central heating and a
garden? (d) How many houses have a garden but not a T.V. or a central
heating? (e) How many houses have a T.V and a garden but not a central
heating? (f) How many houses are there in the street?
7. Formulae
A formula is a mathematical sentence in which one quantity is expressed in terms of other letters or numbers and letters. For example, Area of a rectangle = length × breadth, i.e. A = lb; C = 2π r is a formula for finding the circumference, C, of a circle of radius r. The single letter or quantity on the left is called the subject of the formula. The subject of the formula must occur only once, isolated, in the LHS of the equation. For example in the formula: v = u + at, v is the subject of the formula, but in the
equation: c = c
cba )+(, c is not the subject of the formula (as c appears on both
sides, i.e. c is not isolated). Change of the subject.
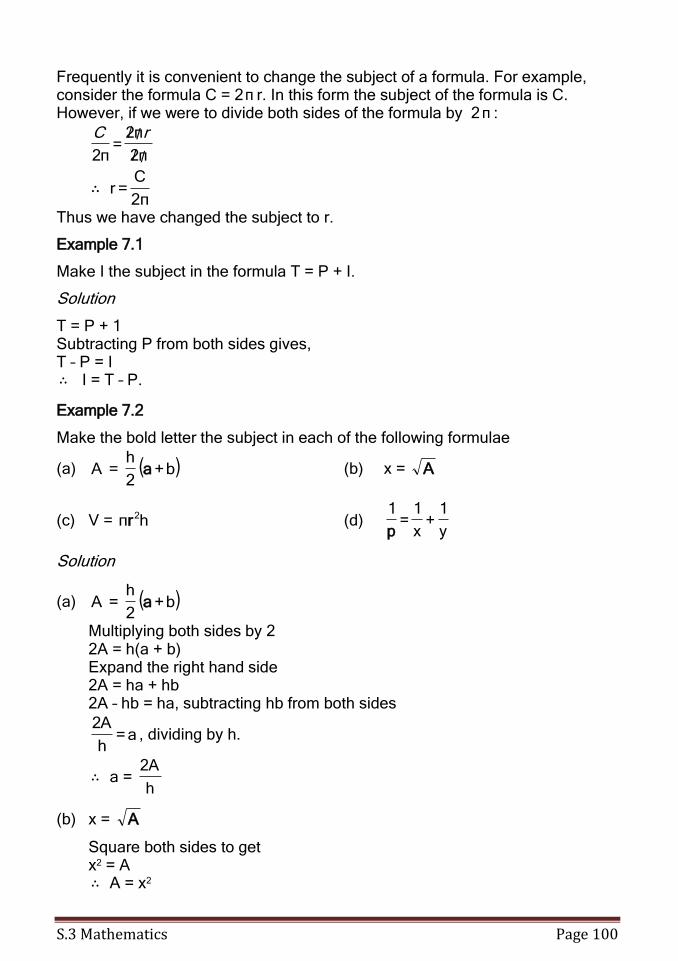
S.3 Mathematics Page 100
Frequently it is convenient to change the subject of a formula. For example, consider the formula C = 2π r. In this form the subject of the formula is C. However, if we were to divide both sides of the formula by 2π :
π/2/
π/2/=
π2
rC
2π
C=r∴
Thus we have changed the subject to r.
Example 7.1
Make I the subject in the formula T = P + I.
Solution
T = P + 1 Subtracting P from both sides gives, T – P = I ∴ I = T – P.
Example 7.2
Make the bold letter the subject in each of the following formulae
(a) ( )b+2
h=A a (b) x = A
(c) V = hπ 2r (d) y
1+
x
1=
1
p
Solution
(a) ( )b+2
h=A a
Multiplying both sides by 2 2A = h(a + b) Expand the right hand side 2A = ha + hb 2A – hb = ha, subtracting hb from both sides
a=h
2A, dividing by h.
∴ a = h
2A
(b) x = A
Square both sides to get x2 = A ∴ A = x2
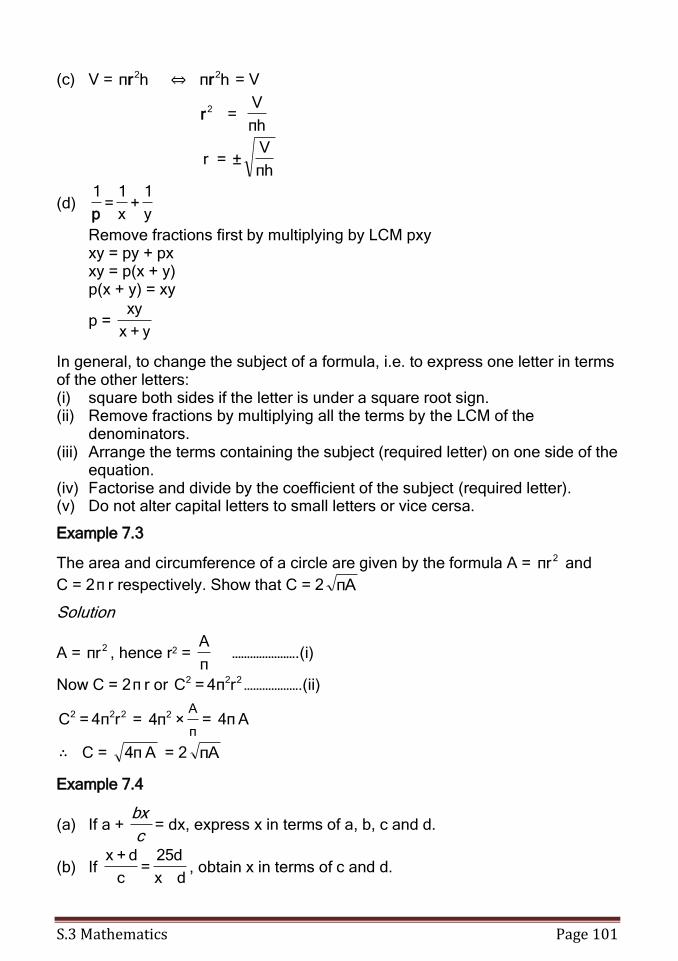
S.3 Mathematics Page 101
(c) V = hπ 2r ⇔ hπ 2r = V
2r = πh
V
r = πh
V±
(d) y
1+
x
1=
1
p
Remove fractions first by multiplying by LCM pxy xy = py + px xy = p(x + y) p(x + y) = xy
p = y+x
xy
In general, to change the subject of a formula, i.e. to express one letter in terms of the other letters: (i) square both sides if the letter is under a square root sign. (ii) Remove fractions by multiplying all the terms by the LCM of the
denominators. (iii) Arrange the terms containing the subject (required letter) on one side of the
equation. (iv) Factorise and divide by the coefficient of the subject (required letter). (v) Do not alter capital letters to small letters or vice cersa.
Example 7.3
The area and circumference of a circle are given by the formula A = 2πr and
C = 2π r respectively. Show that C = 2 πA
Solution
A = 2πr , hence r2 = π
A ………………….(i)
Now C = 2π r or 222 r4π=C ……………….(ii)
222 r4π=C = π
A×π4 2 = π4 A
∴ C = Aπ4 = 2 πA
Example 7.4
(a) If a + c
bx= dx, express x in terms of a, b, c and d.
(b) If dx
25d=
c
d+x, obtain x in terms of c and d.
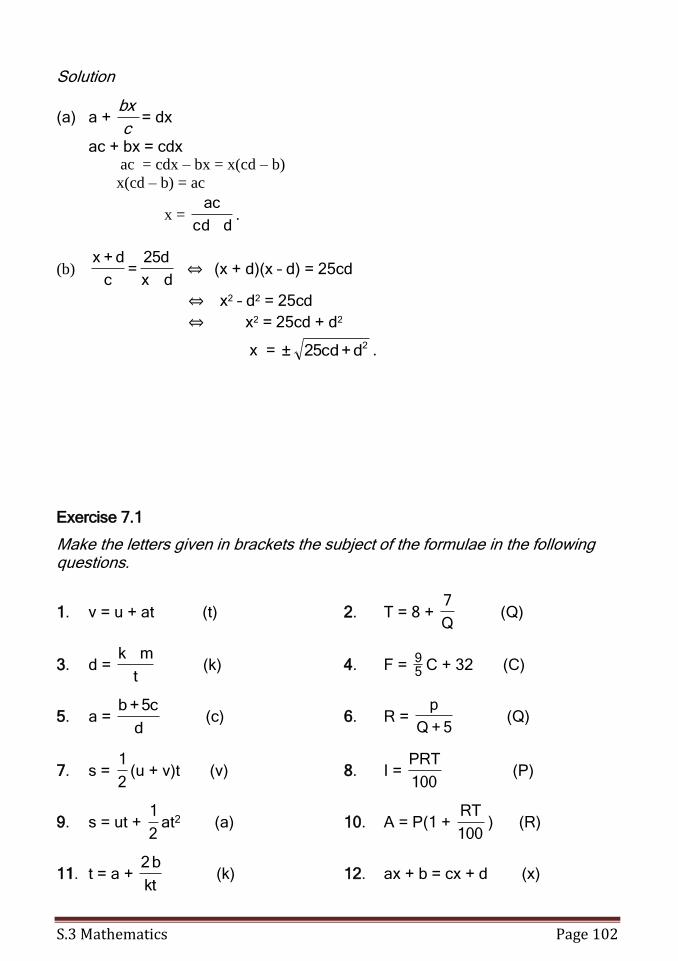
S.3 Mathematics Page 102
Solution
(a) a + c
bx= dx
ac + bx = cdx ac = cdx – bx = x(cd – b)
x(cd – b) = ac
x = dcd
ac.
(b) dx
25d=
c
d+x ⇔ (x + d)(x – d) = 25cd
⇔ x2 – d2 = 25cd
⇔ x2 = 25cd + d2
x = 2d+25cd± .
Exercise 7.1
Make the letters given in brackets the subject of the formulae in the following questions.
1. v = u + at (t) 2. T = 8 + Q
7 (Q)
3. d = t
mk (k) 4. F = 5
9C + 32 (C)
5. a = d
5c+b (c) 6. R =
5+Q
p (Q)
7. s = 2
1(u + v)t (v) 8. I =
100
PRT (P)
9. s = ut + 2
1at2 (a) 10. A = P(1 +
100
RT) (R)
11. t = a + kt
b2 (k) 12. ax + b = cx + d (x)
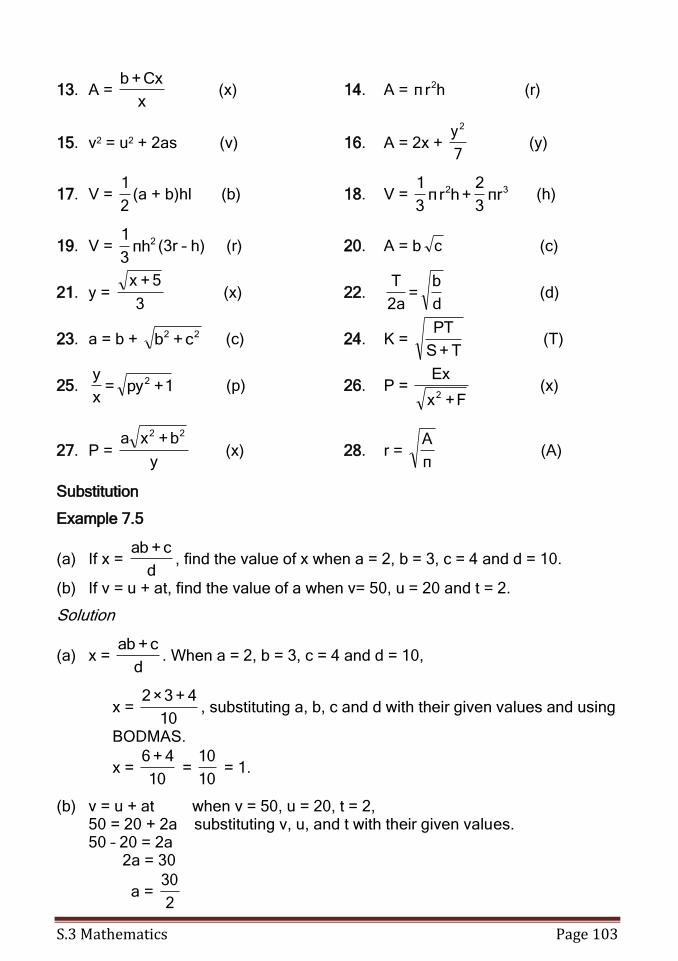
S.3 Mathematics Page 103
13. A = x
Cx+b (x) 14. A = hrπ 2 (r)
15. v2 = u2 + 2as (v) 16. A = 2x + 7
y2
(y)
17. V = 2
1(a + b)hl (b) 18. V = 32 rπ
3
2+hrπ
3
1 (h)
19. V = 2hπ3
1(3r – h) (r) 20. A = b c (c)
21. y = 3
5+x (x) 22.
d
b=
a2
T (d)
23. a = b + 22 c+b (c) 24. K = T+S
PT (T)
25. 1+py=x
y2 (p) 26. P =
F+x
Ex
2 (x)
27. P = y
b+xa 22
(x) 28. r = π
A (A)
Substitution
Example 7.5
(a) If x = d
c+ab, find the value of x when a = 2, b = 3, c = 4 and d = 10.
(b) If v = u + at, find the value of a when v= 50, u = 20 and t = 2.
Solution
(a) x = d
c+ab. When a = 2, b = 3, c = 4 and d = 10,
x = 10
4+3×2, substituting a, b, c and d with their given values and using
BODMAS.
x = 10
4+6 =
10
10 = 1.
(b) v = u + at when v = 50, u = 20, t = 2, 50 = 20 + 2a substituting v, u, and t with their given values. 50 – 20 = 2a 2a = 30
a = 2
30
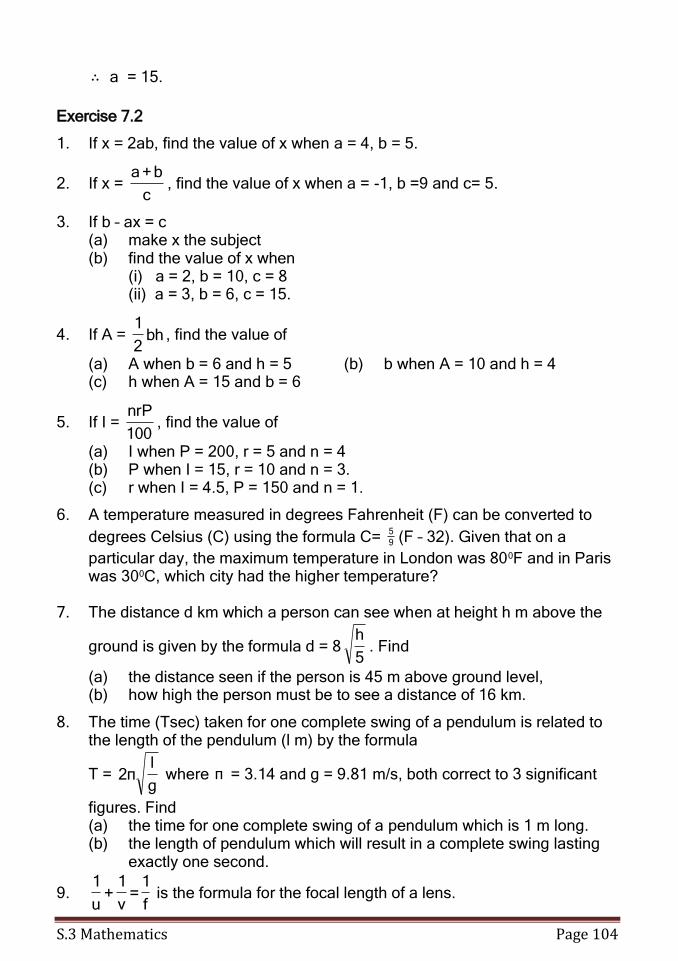
S.3 Mathematics Page 104
∴ a = 15.
Exercise 7.2
1. If x = 2ab, find the value of x when a = 4, b = 5.
2. If x = c
b+a, find the value of x when a = -1, b =9 and c= 5.
3. If b – ax = c (a) make x the subject (b) find the value of x when (i) a = 2, b = 10, c = 8 (ii) a = 3, b = 6, c = 15.
4. If A = bh2
1, find the value of
(a) A when b = 6 and h = 5 (b) b when A = 10 and h = 4 (c) h when A = 15 and b = 6
5. If I = 100
nrP, find the value of
(a) I when P = 200, r = 5 and n = 4 (b) P when I = 15, r = 10 and n = 3. (c) r when I = 4.5, P = 150 and n = 1.
6. A temperature measured in degrees Fahrenheit (F) can be converted to
degrees Celsius (C) using the formula C= 9
5(F – 32). Given that on a
particular day, the maximum temperature in London was 800F and in Paris was 300C, which city had the higher temperature?
7. The distance d km which a person can see when at height h m above the
ground is given by the formula d = 85
h. Find
(a) the distance seen if the person is 45 m above ground level, (b) how high the person must be to see a distance of 16 km.
8. The time (Tsec) taken for one complete swing of a pendulum is related to the length of the pendulum (l m) by the formula
T = g
lπ2 where π = 3.14 and g = 9.81 m/s, both correct to 3 significant
figures. Find (a) the time for one complete swing of a pendulum which is 1 m long. (b) the length of pendulum which will result in a complete swing lasting
exactly one second.
9. f
1=
v
1+
u
1 is the formula for the focal length of a lens.
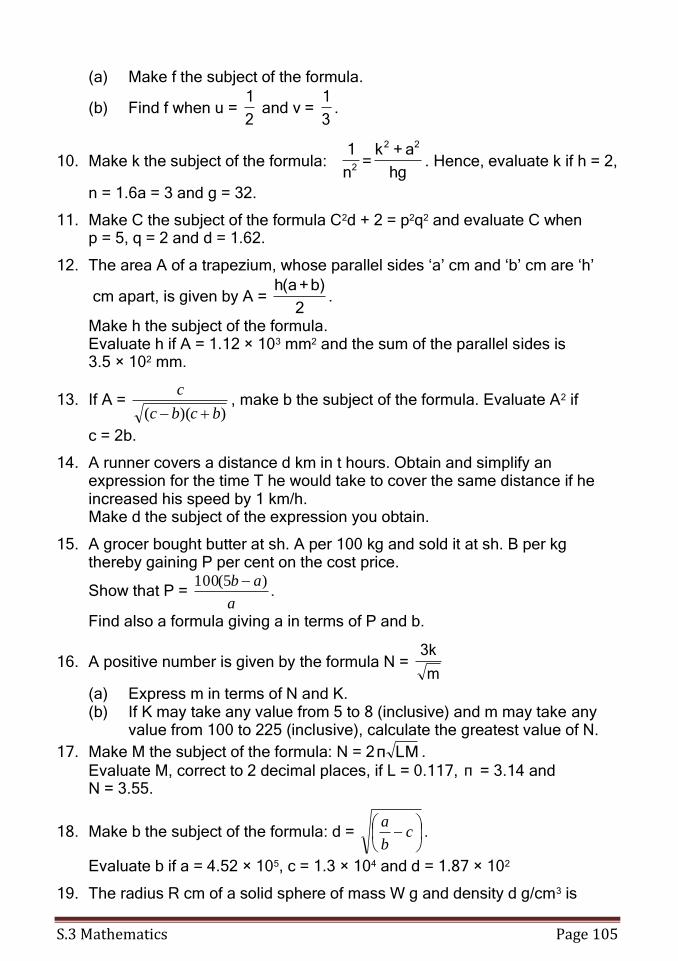
S.3 Mathematics Page 105
(a) Make f the subject of the formula.
(b) Find f when u = 2
1 and v =
3
1.
10. Make k the subject of the formula: hg
a+k=
n
1 22
2 . Hence, evaluate k if h = 2,
n = 1.6a = 3 and g = 32.
11. Make C the subject of the formula C2d + 2 = p2q2 and evaluate C when p = 5, q = 2 and d = 1.62.
12. The area A of a trapezium, whose parallel sides ‘a’ cm and ‘b’ cm are ‘h’
cm apart, is given by A = 2
)b+a(h.
Make h the subject of the formula. Evaluate h if A = 1.12 × 103 mm2 and the sum of the parallel sides is 3.5 × 102 mm.
13. If A = ))(( bcbc
c
, make b the subject of the formula. Evaluate A2 if
c = 2b.
14. A runner covers a distance d km in t hours. Obtain and simplify an expression for the time T he would take to cover the same distance if he increased his speed by 1 km/h. Make d the subject of the expression you obtain.
15. A grocer bought butter at sh. A per 100 kg and sold it at sh. B per kg thereby gaining P per cent on the cost price.
Show that P = a
ab )5(100 .
Find also a formula giving a in terms of P and b.
16. A positive number is given by the formula N = m
k3
(a) Express m in terms of N and K. (b) If K may take any value from 5 to 8 (inclusive) and m may take any
value from 100 to 225 (inclusive), calculate the greatest value of N.
17. Make M the subject of the formula: N = 2 LMπ .
Evaluate M, correct to 2 decimal places, if L = 0.117, π = 3.14 and N = 3.55.
18. Make b the subject of the formula: d =
c
b
a.
Evaluate b if a = 4.52 × 10⁵, c = 1.3 × 10⁴ and d = 1.87 × 10²
19. The radius R cm of a solid sphere of mass W g and density d g/cm3 is
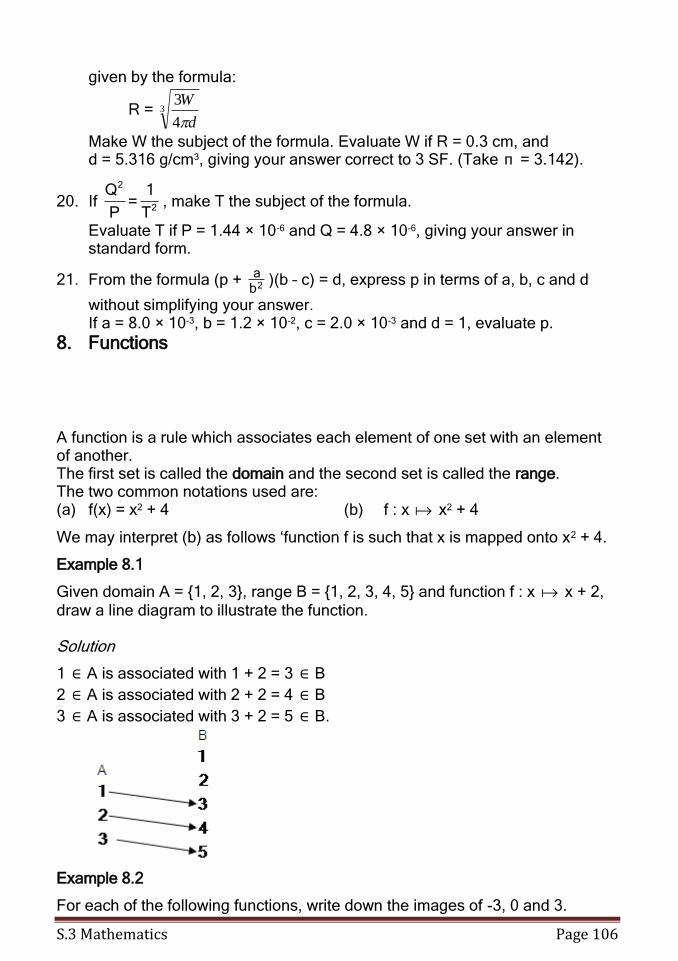
S.3 Mathematics Page 106
given by the formula:
R = 3
4
3
d
W
Make W the subject of the formula. Evaluate W if R = 0.3 cm, and d = 5.316 g/cm3, giving your answer correct to 3 SF. (Take π = 3.142).
20. If 2
2
T
1=
P
Q, make T the subject of the formula.
Evaluate T if P = 1.44 × 10⁻⁶ and Q = 4.8 × 10⁻⁶, giving your answer in standard form.
21. From the formula (p + 2ba )(b – c) = d, express p in terms of a, b, c and d
without simplifying your answer. If a = 8.0 × 10⁻³, b = 1.2 × 10⁻², c = 2.0 × 10⁻³ and d = 1, evaluate p.
8. Functions
A function is a rule which associates each element of one set with an element of another. The first set is called the domain and the second set is called the range. The two common notations used are: (a) f(x) = x2 + 4 (b) f : x x2 + 4
We may interpret (b) as follows ‘function f is such that x is mapped onto x2 + 4.
Example 8.1
Given domain A = {1, 2, 3}, range B = {1, 2, 3, 4, 5} and function f : x x + 2, draw a line diagram to illustrate the function. Solution
1 ∈ A is associated with 1 + 2 = 3 ∈ B
2 ∈ A is associated with 2 + 2 = 4 ∈ B
3 ∈ A is associated with 3 + 2 = 5 ∈ B.
Example 8.2
For each of the following functions, write down the images of -3, 0 and 3.
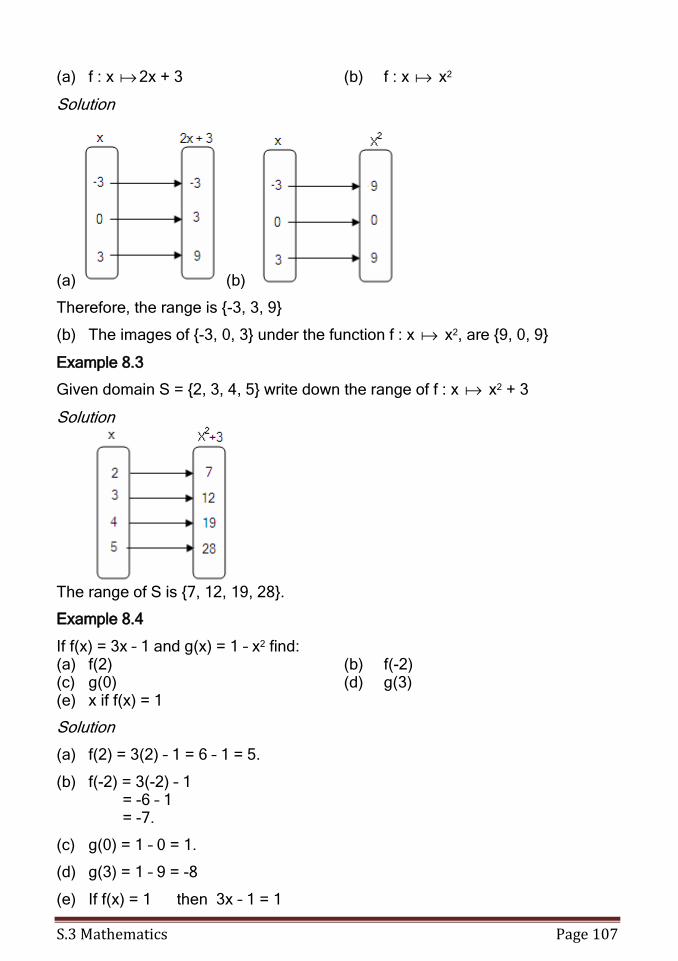
S.3 Mathematics Page 107
(a) f : x 2x + 3 (b) f : x x2
Solution
(a) (b)
Therefore, the range is {-3, 3, 9}
(b) The images of {-3, 0, 3} under the function f : x x2, are {9, 0, 9}
Example 8.3
Given domain S = {2, 3, 4, 5} write down the range of f : x x2 + 3
Solution
The range of S is {7, 12, 19, 28}.
Example 8.4
If f(x) = 3x – 1 and g(x) = 1 – x2 find: (a) f(2) (b) f(-2) (c) g(0) (d) g(3) (e) x if f(x) = 1
Solution
(a) f(2) = 3(2) – 1 = 6 – 1 = 5.
(b) f(-2) = 3(-2) – 1 = -6 – 1 = -7.
(c) g(0) = 1 – 0 = 1.
(d) g(3) = 1 – 9 = -8
(e) If f(x) = 1 then 3x – 1 = 1
S.3 Mathematics Page 108
3x = 2
x = 3
2.
Example 8.5
The function f is defined as f(x) = ax + b where a and b are constants. If f(1) = 8 and f(4) = 17, find the values of a and b.
Solutions
f(x) = ax + b If f(1) = 8, ⇒ a(1) + b = 8
a + b = 8 …………………(i) f(4) = 17 ⇒ 17a + b = 17……………….(ii)
equation (ii) – equation (i), gives 16a = 9
⇒ a = 16
9
Substituting for a into equation (i) gives
16
9 + b = 8
b = 8 - 16
9 =
16
9128 =
16
119.
Therefore, a = 16
9 and b =
16
119.
Exercise 8.1
1. Given the functions h : x x2 + 1 and g : x 10x + 1. Find: (a) h(2), h(-3), h(0) (b) g(2), g(10), g(-3).
In questions 2, 3 and 4, the functions f, g and h are defined as follows:
f : x 1 – 2x; g : x 10
x3
; h : x x
12
2. Find:
(a) f(5), f(-5), f( 41 )
(b) g(2), g(-3), g( 21
)
(c) h(3), h(10), h( 31
)
3. Find: (a) x if f(x) = 1 (b) x if fx) = -11 (c) x if h(x) = 1
4. Find: (a) y if g(y) = 100 (b) z if h(z) = 24
S.3 Mathematics Page 109
For questions 5 and 6, the functions k, l and m are defined as follows:
k (x) = 3
x2 2
, l(x) = [(y – 1)(y – 2)], m(x) = 10 – x2
5. (a) k(3), k(6), k(-3) (b) l(2), l(0), l(4)
(c) m(4), m(-2), m( 21 )
6. Find: (a) x if k(x) = 6 (b) x if m(x) = 1
7. If g(x) = 2x + 1, find: (a) g(2) (b) g(4) (c) g(-1) (d) the value of x if g(x) = 9
8. The function g is defined g(x) = ax2 + b where a and b are constants. If g(2) = 3 and g(-3) = 13, find the values of a and b.
9. Functions h and k are defined as follows: h(x) = x2 + 1, k(x) = ax + b, where a and b are constants. If h(0) = k(0) and k(2) = 15, find the values of a and b.
10. Given domain P = {-3, -2, -1} write down the range of f (x) = x2 + 2x + 1
Inverse of a function
The inverse of a function ‘undoes’ the function. For example, if f(x) = x + 1, the inverse of f, written as f-1, is given by f-1(x) = x – 1 In other words, if a function f maps a number n onto m, then the inverse function f-1 maps m onto n. Example 8.6
Find the inverse of f(x) = 3x – 4
Solution
f(x) = 3x – 4 means that the image of x is 3x - 4. We find a function which maps 3x – 4 back onto x. We let 3x – 4 = y, then express x in terms of y: 3x = y + 4 (add 4 on both sides)
x = 3
4+y (divide by 3)
Replacing y with x in the function 3
4+y gives
3
4+x.
Therefore, the inverse of f is
f-1(x) =3
4+x.
We can use a flow chart to help find the inverse of a function. (see diagrams below)
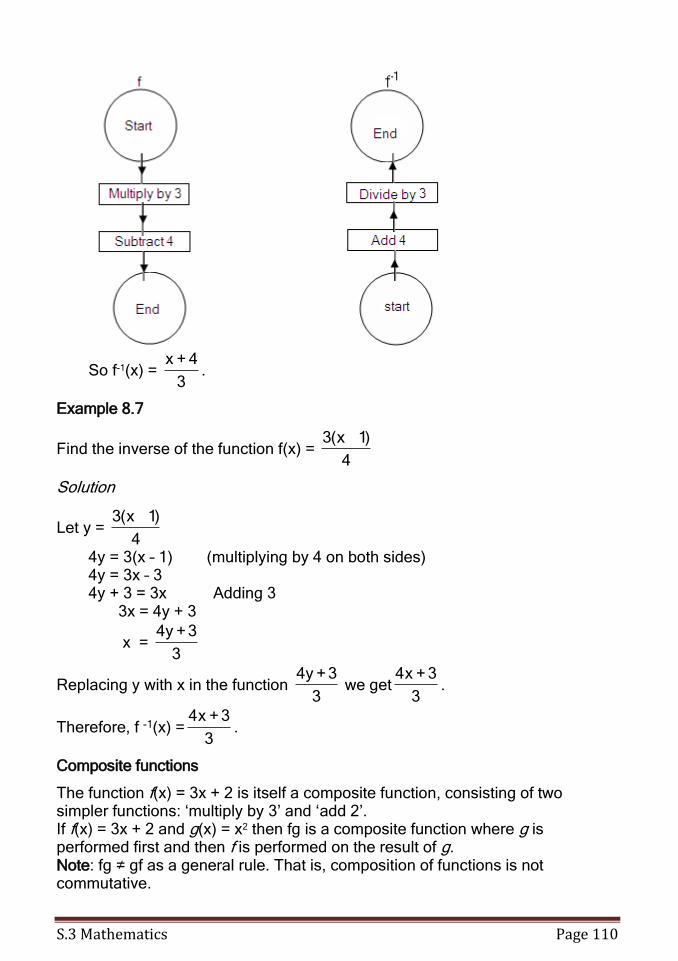
S.3 Mathematics Page 110
So f-1(x) = 3
4+x.
Example 8.7
Find the inverse of the function f(x) = 4
)1x(3
Solution
Let y = 4
)1x(3
4y = 3(x – 1) (multiplying by 4 on both sides) 4y = 3x – 3 4y + 3 = 3x Adding 3 3x = 4y + 3
x = 3
3+y4
Replacing y with x in the function 3
3+y4 we get
3
3+x4.
Therefore, f -1(x) =3
3+x4.
Composite functions
The function f(x) = 3x + 2 is itself a composite function, consisting of two simpler functions: ‘multiply by 3’ and ‘add 2’. If f(x) = 3x + 2 and g(x) = x2 then fg is a composite function where g is performed first and then f is performed on the result of g. Note: fg ≠ gf as a general rule. That is, composition of functions is not commutative.
S.3 Mathematics Page 111
Example 8.8
Given that: f(x) = 3x + 2 and g(x) = x2. Find (a) fg(x) (b) gf(x) (c) f-1 (d) g-1 (e) (gf)-1 (f) g-1f-1
Solution
(a) fg(x) = f[g(x)] = f[x2] = 3(x2) + 2 = 3x2 + 2
(b) gf(x) = g[f(x)] = g[3x + 2] = (3x + 2)2
(c) f(x) = 3x + 2 Let y = 3x + 2 y – 2 = 3x or 3x = y – 2
∴ x = 3
2y
∴ f -1(x) = 3
2x.
(d) g(x) = x2 ⇒ g -1(x) = x .
(e) gf (x) = (3x + 2)2 Let y = (3x + 2)2
y = 3x + 2 ⇒ 3x + 2 = y
3x = y - 2
⇒ x = ( y - 2)/3
Hence, (gf)-1 = 3
2x
(f) g-1f-1 = g -1[f -1(x)] = g -1[3
2x]
But g -1(x) = x ⇒ g -1[3
2x] =
3
2x
Therefore, g-1f-1 =3
2x.
Rational functions
If h(x) = )x(g
)x(f, then h(x) is called a rational function.
S.3 Mathematics Page 112
The function )x(g
)x(f becomes equal to zero when the numerator is equal to zero,
i.e. when f(x) = 0.
The function )x(g
)x(f is undefined or meaningless when the denominator is equal
to zero, i.e. when g(x) = 0 Example 8.9
Given that 2+x3+x
7+x=)x(h 2 . Find the value(s) of x for which
(a) h(x) = 0 (b) h(x) if undefined.
Solution
(a) h(x) = 0 ⇒ 2+x3+x
7+x2 = 0
⇒ x + 7 = 0
⇒ x = -7
(b) h(x) is undefined when x2 + 3x + 2 = 0 (x + 2)(x + 1) = 0 x + 2 = 0 ⇒ x = -2
Or x + 1 = 0 ⇒ x = -1
Therefore, x = -2 or x = -1.
Exercise 8.2
Find the inverse of each the following functions.
1. f(x) = x + 3 2. f(x) = 2x
3. f(x) = 3x – 1 4. 2x + 3
5. f(x) = 7x – 3 6. h(x) = 2
1x + 6
7. g(x) = x3 8. f(x) = x3 + 7
9. f : x 5
3+x2→ 10. f : x
1+x
1→
Exercise 8.3
For questions 1 and 2, the functions f, g and h are as follows: f(x) = 4x , g(x) = x + 5, h(x) = x2
1. Find the following (a) fg(x) (b) gf(x)
S.3 Mathematics Page 113
(c) hf(x) (d) fh(x)
(e) gh(x) (f) fgh(x)
(g) hfg(x)
2. Find: (a) x if hg(x) = h(x) (b) x if fh(x) = gh(x)
For questions 3, 4 and 5, the functions f, g and h are as follows: f(x) = 2x, g(x) = x – 3, h(x) = x2
3. Find the following composite functions (a) fg (b) gf
(c) gh (d) hf
(e) ghf (f) hgf
4. Evaluate: (a) fg(4) (b) gf(7)
(c) gh(-3) (d) fgf(2)
(e) ggg(10) (f) hfh(-2)
5. Find: (a) x if f(x) = g(x) (b) x if hg(x) = gh(x)
(c) x if gf(x) = 0 (d) x if fg(x) = 4
(e) h-1g-1(x) (f) (fgh)-1
Find the value(s) of x for which each of the following functions is: (a) equal to 0, (b) meaningless.
6. f(x) = 12+x7+x
2+x2 7. f(x) =
1572
12
2
xx
x
8. g(x) = 145
192
2
xx
x 9. h(x) =
1+x2
)5+x(x
10. 2+x3
1+x=)x(f 11. f(x) =
)2+x(8
x4+1
9. Trigonometry (2)
Triangle PQR in the figure below is right-angled and ∠ PQR = θ.
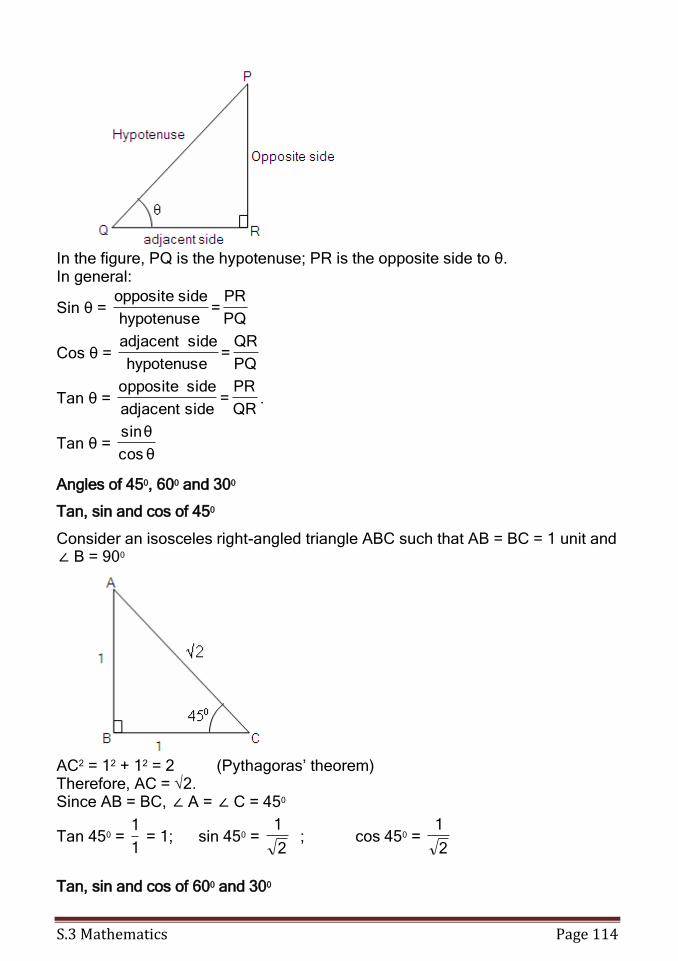
S.3 Mathematics Page 114
In the figure, PQ is the hypotenuse; PR is the opposite side to θ. In general:
Sin θ = PQ
PR=
hypotenuse
side opposite
Cos θ = PQ
QR=
hypotenuse
side adjacent
Tan θ = QR
PR=
sideadjacent
side ppositeo.
Tan θ = θcos
θsin
Angles of 450, 600 and 300
Tan, sin and cos of 450
Consider an isosceles right-angled triangle ABC such that AB = BC = 1 unit and ∠ B = 900
AC2 = 12 + 12 = 2 (Pythagoras’ theorem) Therefore, AC = √2. Since AB = BC, ∠ A = ∠ C = 450
Tan 450 = 1
1 = 1; sin 450 =
2
1 ; cos 450 =
2
1
Tan, sin and cos of 600 and 300
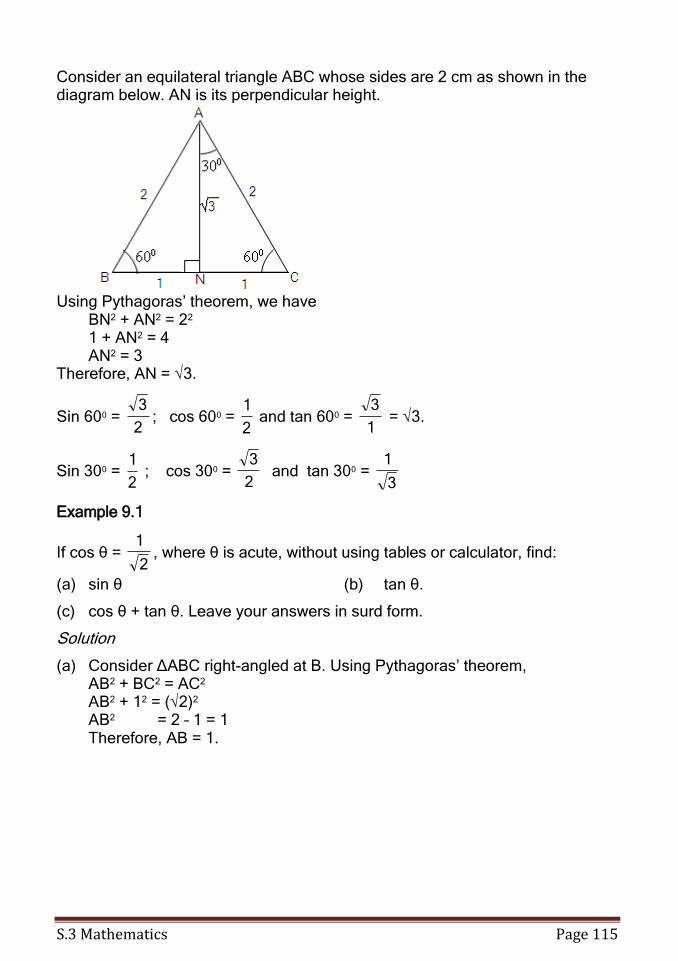
S.3 Mathematics Page 115
Consider an equilateral triangle ABC whose sides are 2 cm as shown in the diagram below. AN is its perpendicular height.
Using Pythagoras’ theorem, we have BN2 + AN2 = 22 1 + AN2 = 4 AN2 = 3 Therefore, AN = √3.
Sin 600 = 2
3; cos 600 =
2
1 and tan 600 =
1
3 = √3.
Sin 300 = 2
1 ; cos 300 =
2
3 and tan 300 =
3
1
Example 9.1
If cos θ = 2
1, where θ is acute, without using tables or calculator, find:
(a) sin θ (b) tan θ.
(c) cos θ + tan θ. Leave your answers in surd form.
Solution
(a) Consider ∆ABC right-angled at B. Using Pythagoras’ theorem, AB2 + BC2 = AC2 AB2 + 12 = (√2)2 AB2 = 2 – 1 = 1 Therefore, AB = 1.

S.3 Mathematics Page 116
(a) Sin θ = 2
1 and
(b) Tan θ = 1
1 = 1.
(c) cos θ + tan θ = 2
1 + 1
= 2
2+1 =
2
)2+1(2 or
2
2+2
The graph of y = sin x (Sine Curve)
To draw the graph of y = sin x, first, prepare a table of values of x and y. Choose suitable values of x in the interval 0 ≤ x ≤ 7200 and then find the corresponding values of y. The table below shows the values of y = sin x in the interval 0 ≤ x ≤ 7200.
x 0 90 180 270 360 450 540 630 720
y = sin x 0 1 0 -1 0 1 0 -1 0 Plot the ordered pairs (x, y) on a graph paper and join the points with a smooth curve. The diagram below shows the graph of y = sin x, in the interval 0 ≤ x ≤ 7200
The graph of sine curve, y = sin x, shown above illustrates that:
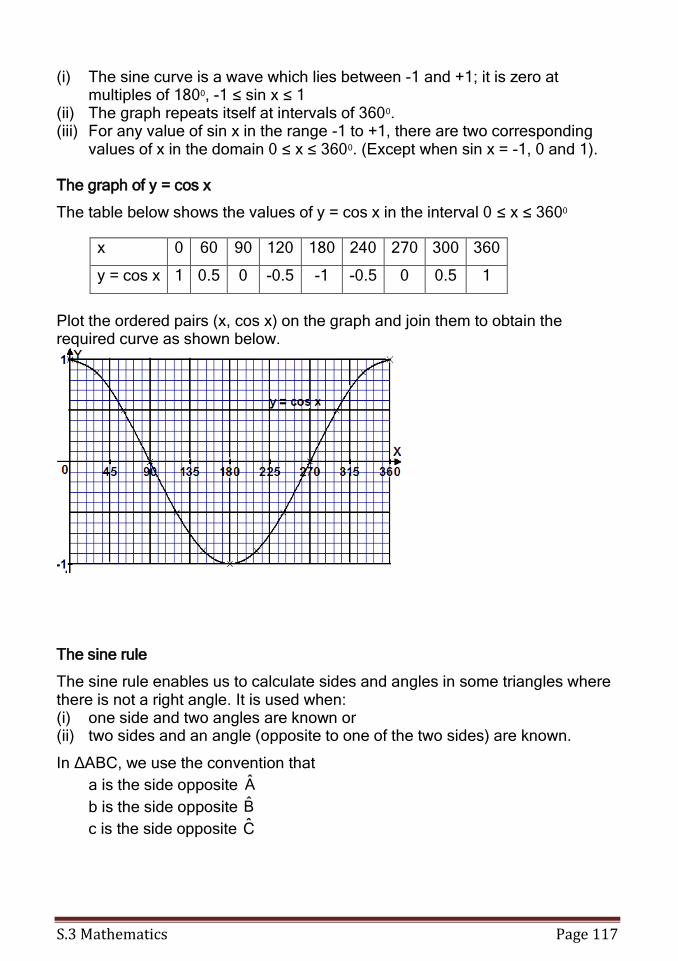
S.3 Mathematics Page 117
(i) The sine curve is a wave which lies between -1 and +1; it is zero at multiples of 1800, -1 ≤ sin x ≤ 1
(ii) The graph repeats itself at intervals of 3600. (iii) For any value of sin x in the range -1 to +1, there are two corresponding
values of x in the domain 0 ≤ x ≤ 3600. (Except when sin x = -1, 0 and 1). The graph of y = cos x
The table below shows the values of y = cos x in the interval 0 ≤ x ≤ 3600
Plot the ordered pairs (x, cos x) on the graph and join them to obtain the required curve as shown below.
The sine rule
The sine rule enables us to calculate sides and angles in some triangles where there is not a right angle. It is used when: (i) one side and two angles are known or (ii) two sides and an angle (opposite to one of the two sides) are known.
In ∆ABC, we use the convention that
a is the side opposite A
b is the side opposite B
c is the side opposite C
x 0 60 90 120 180 240 270 300 360
y = cos x 1 0.5 0 -0.5 -1 -0.5 0 0.5 1
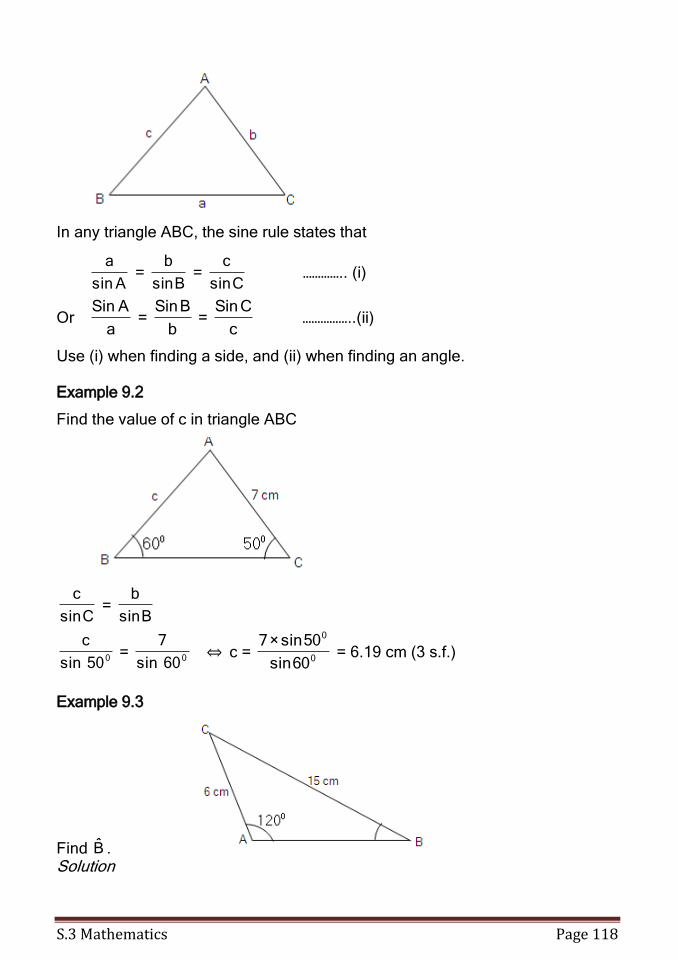
S.3 Mathematics Page 118
In any triangle ABC, the sine rule states that
Asin
a =
Bsin
b =
Csin
c ………….. (i)
Or a
ASin =
b
BSin =
c
CSin ……………..(ii)
Use (i) when finding a side, and (ii) when finding an angle.
Example 9.2
Find the value of c in triangle ABC
Csin
c =
Bsin
b
050sin
c = 060sin
7 ⇔ c = 0
0
60sin
50sin×7 = 6.19 cm (3 s.f.)
Example 9.3
Find B . Solution
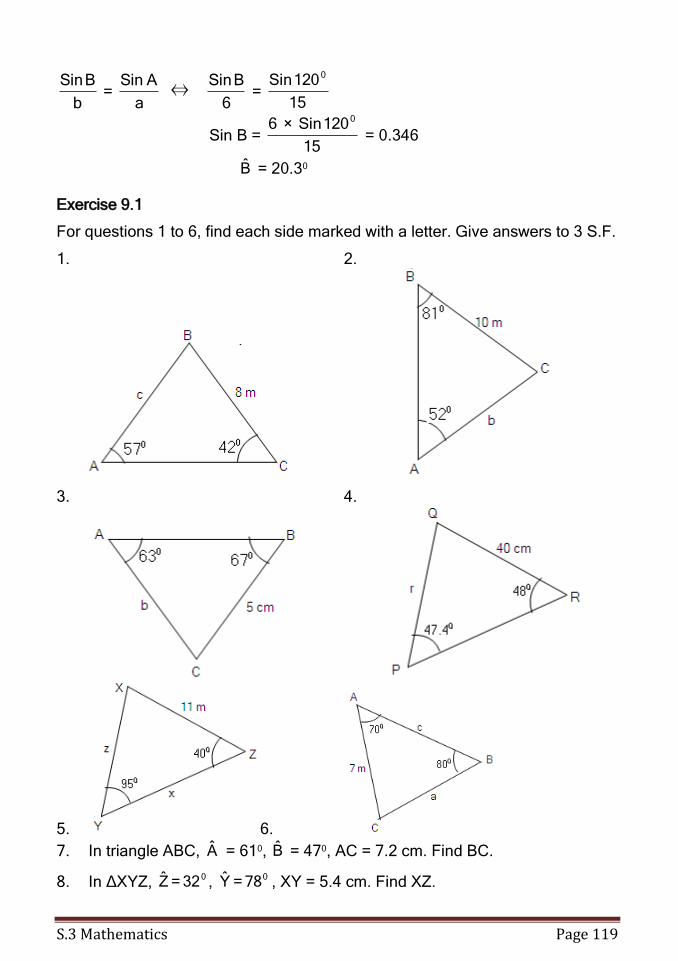
S.3 Mathematics Page 119
b
BSin =
a
ASin ⇔
6
BSin =
15
120Sin 0
Sin B = 15
120Sin×6 0
= 0.346
B = 20.30
Exercise 9.1
For questions 1 to 6, find each side marked with a letter. Give answers to 3 S.F.
1. 2.
3. 4.
5. 6.
7. In triangle ABC, A = 610, B = 470, AC = 7.2 cm. Find BC.
8. In ∆XYZ, 032=Z , 078=Y , XY = 5.4 cm. Find XZ.
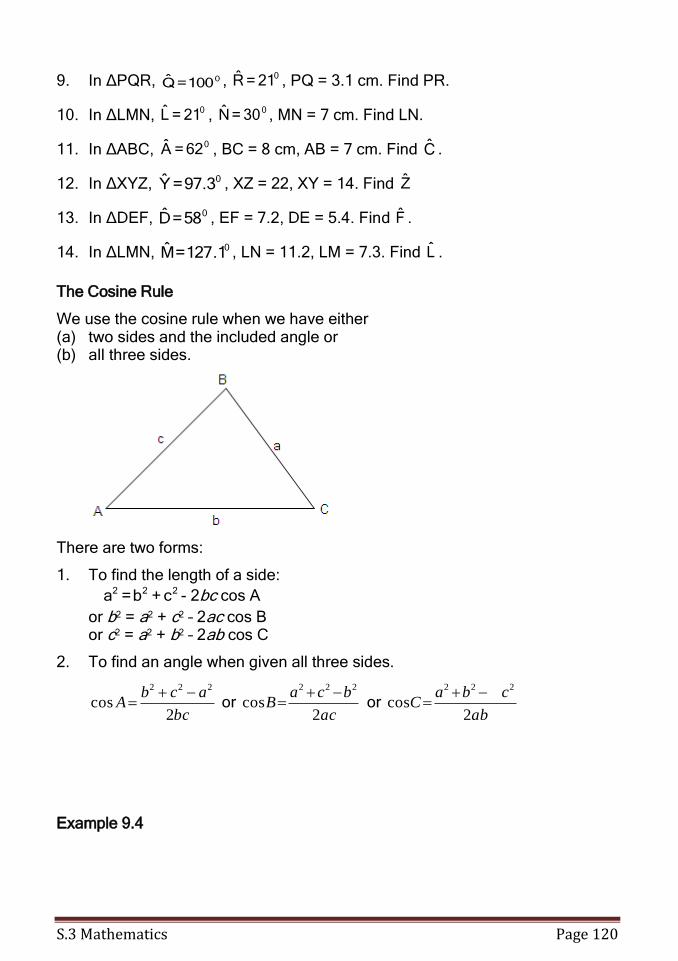
S.3 Mathematics Page 120
9. In ∆PQR, 0100=Q , 021=R , PQ = 3.1 cm. Find PR.
10. In ∆LMN, 021=L , 030=N , MN = 7 cm. Find LN.
11. In ∆ABC, 062=A , BC = 8 cm, AB = 7 cm. Find C .
12. In ∆XYZ, 03.97=Y , XZ = 22, XY = 14. Find Z
13. In ∆DEF, 058=D , EF = 7.2, DE = 5.4. Find F .
14. In ∆LMN, 01.127=M , LN = 11.2, LM = 7.3. Find L .
The Cosine Rule
We use the cosine rule when we have either (a) two sides and the included angle or (b) all three sides.
There are two forms:
1. To find the length of a side:
222 c+b=a - 2bc cos A
or b2 = a2 + c2 – 2ac cos B or c2 = a2 + b2 – 2ab cos C
2. To find an angle when given all three sides.
bc
acbA
2cos
222 or
ac
bcaB
2cos
222 or
ab
cbaC
2cos
222
Example 9.4
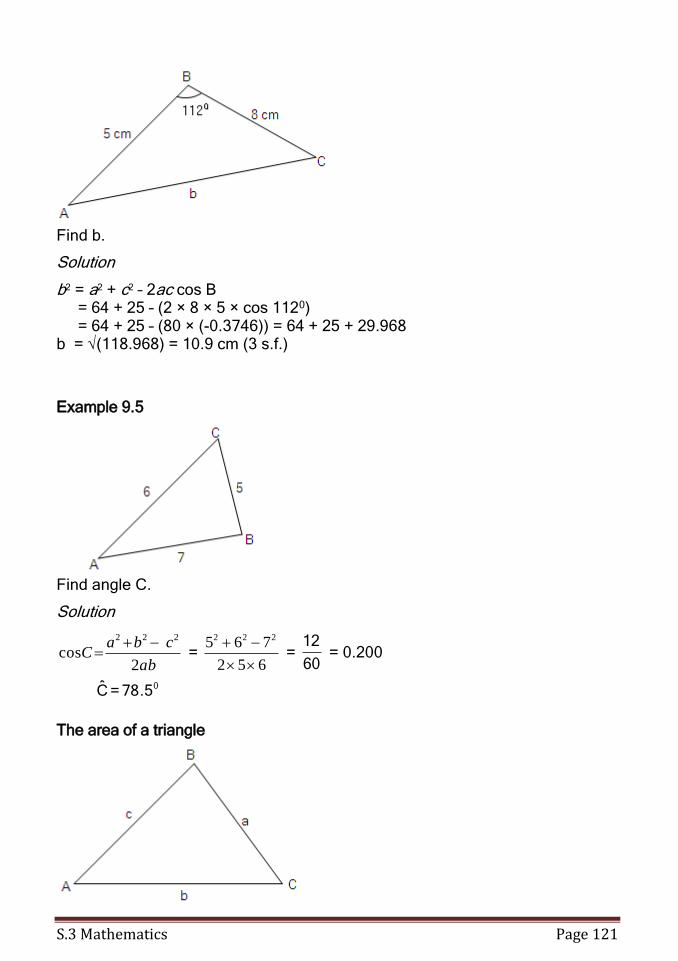
S.3 Mathematics Page 121
Find b.
Solution
b2 = a2 + c2 – 2ac cos B = 64 + 25 – (2 × 8 × 5 × cos 1120) = 64 + 25 – (80 × (-0.3746)) = 64 + 25 + 29.968 b = √(118.968) = 10.9 cm (3 s.f.)
Example 9.5
Find angle C.
Solution
ab
cbaC
2cos
222 =
652
765 222
=
60
12 = 0.200
05.78=C
The area of a triangle
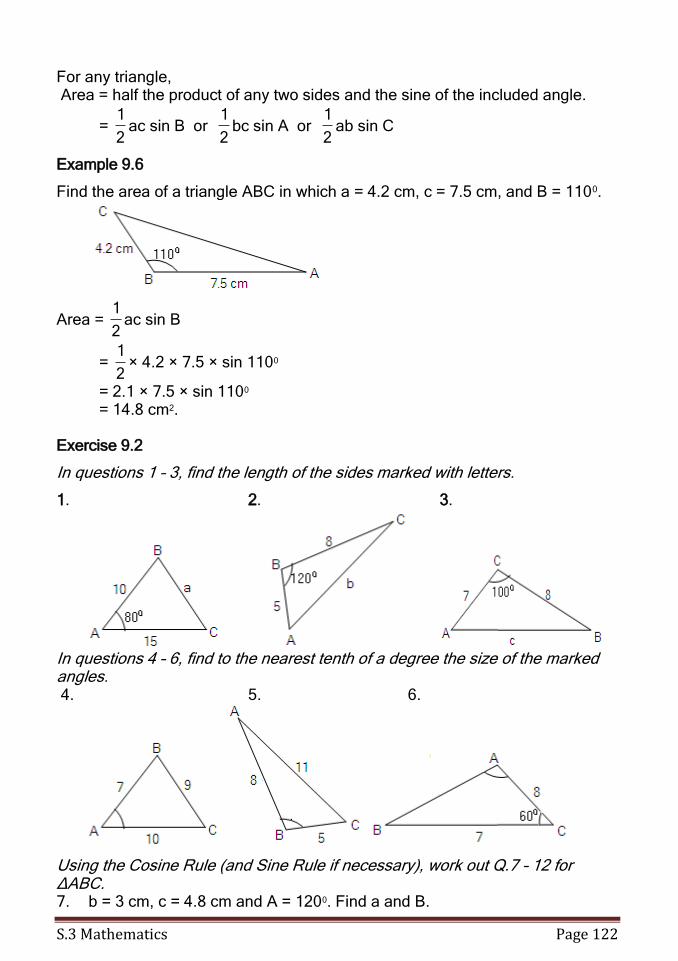
S.3 Mathematics Page 122
For any triangle, Area = half the product of any two sides and the sine of the included angle.
= 2
1ac sin B or
2
1bc sin A or
2
1ab sin C
Example 9.6
Find the area of a triangle ABC in which a = 4.2 cm, c = 7.5 cm, and B = 1100.
Area = 2
1ac sin B
= 2
1× 4.2 × 7.5 × sin 1100
= 2.1 × 7.5 × sin 1100 = 14.8 cm2.
Exercise 9.2
In questions 1 – 3, find the length of the sides marked with letters.
1. 2. 3.
In questions 4 – 6, find to the nearest tenth of a degree the size of the marked angles. 4. 5. 6.
Using the Cosine Rule (and Sine Rule if necessary), work out Q.7 – 12 for ∆ABC. 7. b = 3 cm, c = 4.8 cm and A = 1200. Find a and B.
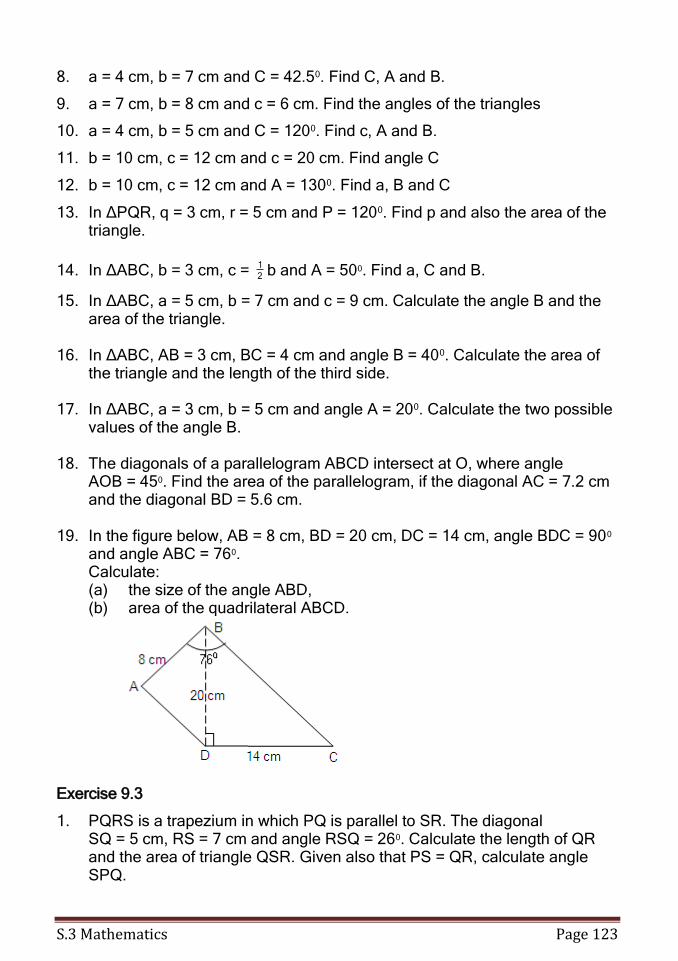
S.3 Mathematics Page 123
8. a = 4 cm, b = 7 cm and C = 42.50. Find C, A and B.
9. a = 7 cm, b = 8 cm and c = 6 cm. Find the angles of the triangles
10. a = 4 cm, b = 5 cm and C = 1200. Find c, A and B.
11. b = 10 cm, c = 12 cm and c = 20 cm. Find angle C
12. b = 10 cm, c = 12 cm and A = 1300. Find a, B and C
13. In ∆PQR, q = 3 cm, r = 5 cm and P = 1200. Find p and also the area of the triangle.
14. In ∆ABC, b = 3 cm, c = 2
1b and A = 500. Find a, C and B.
15. In ∆ABC, a = 5 cm, b = 7 cm and c = 9 cm. Calculate the angle B and the area of the triangle.
16. In ∆ABC, AB = 3 cm, BC = 4 cm and angle B = 400. Calculate the area of
the triangle and the length of the third side. 17. In ∆ABC, a = 3 cm, b = 5 cm and angle A = 200. Calculate the two possible
values of the angle B. 18. The diagonals of a parallelogram ABCD intersect at O, where angle AOB = 450. Find the area of the parallelogram, if the diagonal AC = 7.2 cm
and the diagonal BD = 5.6 cm. 19. In the figure below, AB = 8 cm, BD = 20 cm, DC = 14 cm, angle BDC = 900
and angle ABC = 760. Calculate:
(a) the size of the angle ABD, (b) area of the quadrilateral ABCD.
Exercise 9.3
1. PQRS is a trapezium in which PQ is parallel to SR. The diagonal SQ = 5 cm, RS = 7 cm and angle RSQ = 260. Calculate the length of QR and the area of triangle QSR. Given also that PS = QR, calculate angle SPQ.
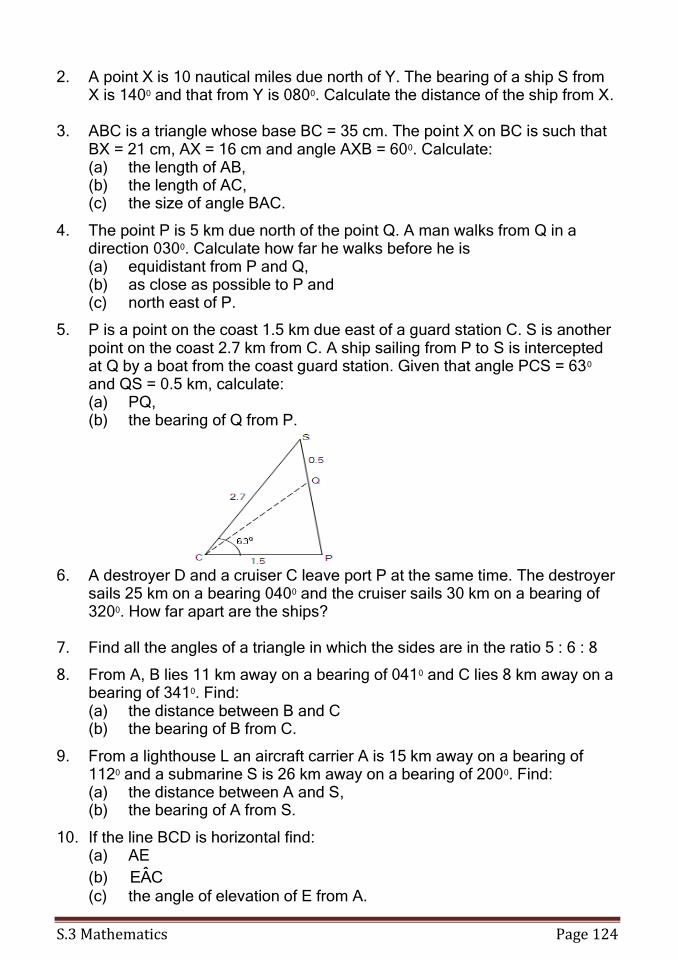
S.3 Mathematics Page 124
2. A point X is 10 nautical miles due north of Y. The bearing of a ship S from X is 1400 and that from Y is 0800. Calculate the distance of the ship from X.
3. ABC is a triangle whose base BC = 35 cm. The point X on BC is such that
BX = 21 cm, AX = 16 cm and angle AXB = 600. Calculate: (a) the length of AB, (b) the length of AC, (c) the size of angle BAC.
4. The point P is 5 km due north of the point Q. A man walks from Q in a direction 0300. Calculate how far he walks before he is
(a) equidistant from P and Q, (b) as close as possible to P and (c) north east of P.
5. P is a point on the coast 1.5 km due east of a guard station C. S is another point on the coast 2.7 km from C. A ship sailing from P to S is intercepted at Q by a boat from the coast guard station. Given that angle PCS = 630 and QS = 0.5 km, calculate:
(a) PQ, (b) the bearing of Q from P.
6. A destroyer D and a cruiser C leave port P at the same time. The destroyer
sails 25 km on a bearing 0400 and the cruiser sails 30 km on a bearing of 3200. How far apart are the ships?
7. Find all the angles of a triangle in which the sides are in the ratio 5 : 6 : 8
8. From A, B lies 11 km away on a bearing of 0410 and C lies 8 km away on a bearing of 3410. Find:
(a) the distance between B and C (b) the bearing of B from C.
9. From a lighthouse L an aircraft carrier A is 15 km away on a bearing of 1120 and a submarine S is 26 km away on a bearing of 2000. Find:
(a) the distance between A and S, (b) the bearing of A from S.
10. If the line BCD is horizontal find: (a) AE
(b) CAE
(c) the angle of elevation of E from A.
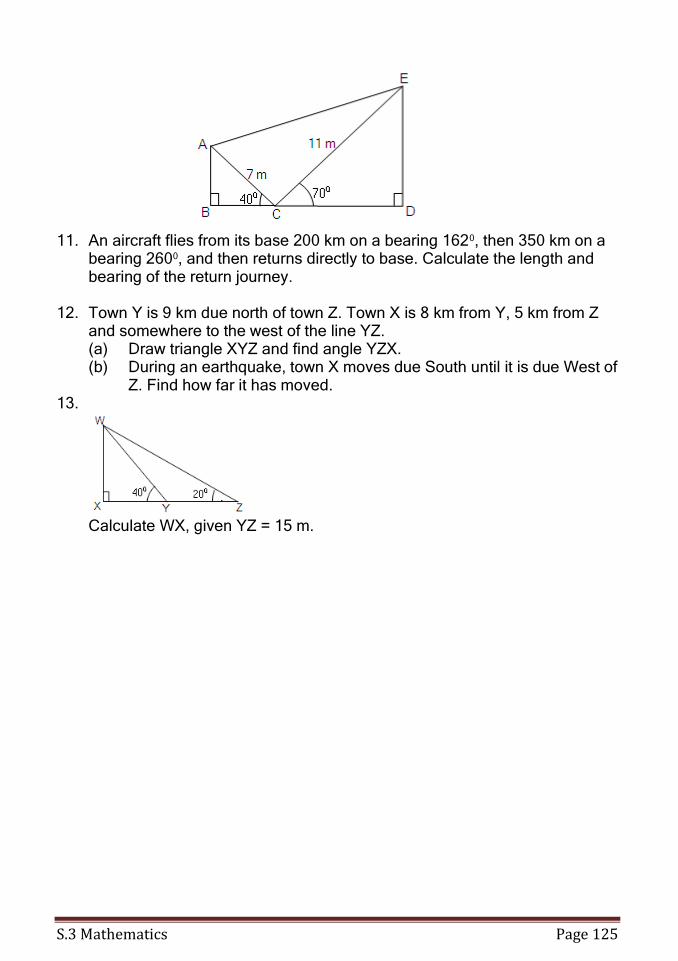
S.3 Mathematics Page 125
11. An aircraft flies from its base 200 km on a bearing 1620, then 350 km on a bearing 2600, and then returns directly to base. Calculate the length and bearing of the return journey.
12. Town Y is 9 km due north of town Z. Town X is 8 km from Y, 5 km from Z
and somewhere to the west of the line YZ. (a) Draw triangle XYZ and find angle YZX. (b) During an earthquake, town X moves due South until it is due West of
Z. Find how far it has moved. 13.
Calculate WX, given YZ = 15 m.
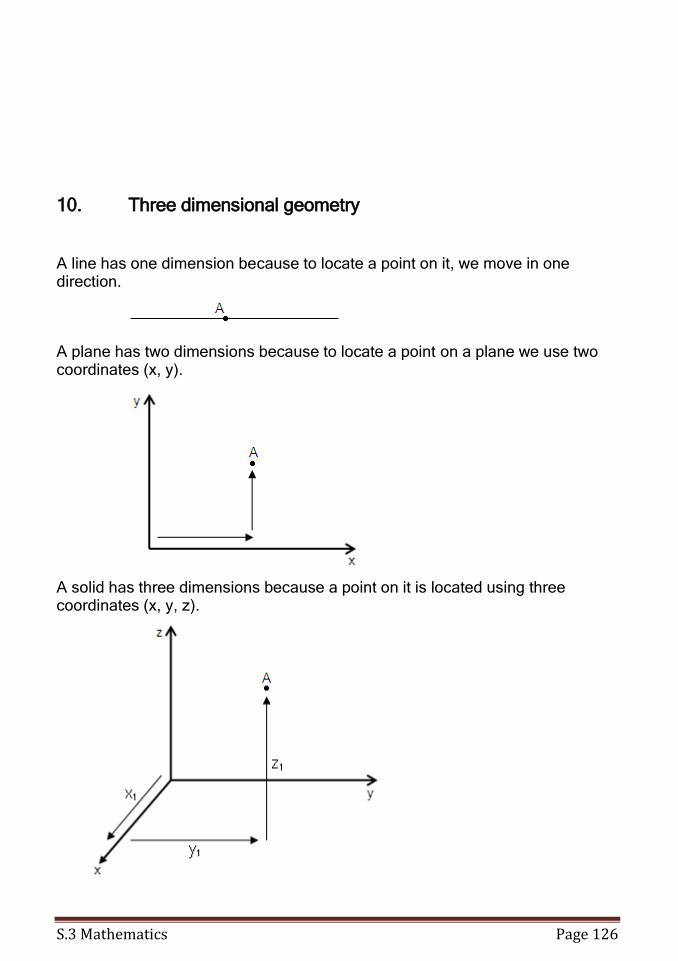
S.3 Mathematics Page 126
10. Three dimensional geometry
A line has one dimension because to locate a point on it, we move in one direction.
A plane has two dimensions because to locate a point on a plane we use two coordinates (x, y).
A solid has three dimensions because a point on it is located using three coordinates (x, y, z).
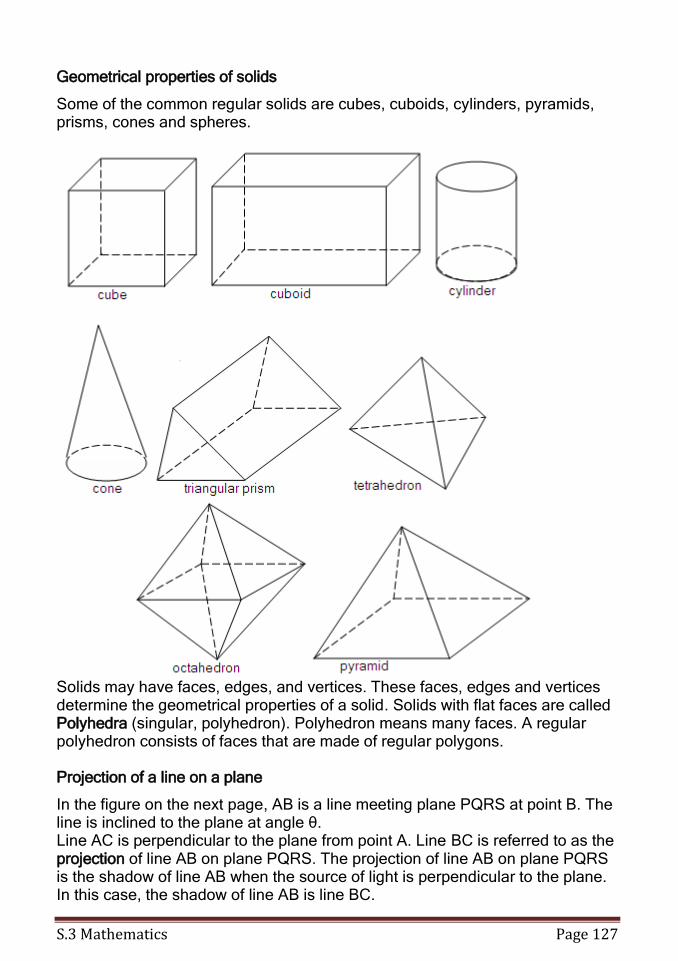
S.3 Mathematics Page 127
Geometrical properties of solids
Some of the common regular solids are cubes, cuboids, cylinders, pyramids, prisms, cones and spheres.
Solids may have faces, edges, and vertices. These faces, edges and vertices determine the geometrical properties of a solid. Solids with flat faces are called Polyhedra (singular, polyhedron). Polyhedron means many faces. A regular polyhedron consists of faces that are made of regular polygons.
Projection of a line on a plane
In the figure on the next page, AB is a line meeting plane PQRS at point B. The line is inclined to the plane at angle θ. Line AC is perpendicular to the plane from point A. Line BC is referred to as the projection of line AB on plane PQRS. The projection of line AB on plane PQRS is the shadow of line AB when the source of light is perpendicular to the plane. In this case, the shadow of line AB is line BC.
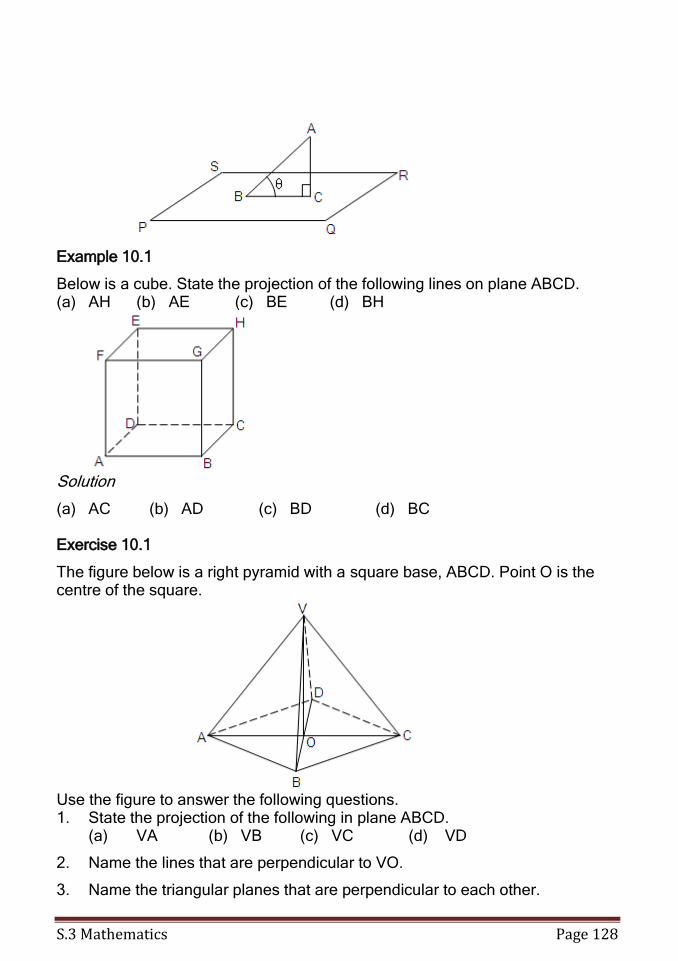
S.3 Mathematics Page 128
Example 10.1
Below is a cube. State the projection of the following lines on plane ABCD. (a) AH (b) AE (c) BE (d) BH
Solution
(a) AC (b) AD (c) BD (d) BC
Exercise 10.1
The figure below is a right pyramid with a square base, ABCD. Point O is the centre of the square.
Use the figure to answer the following questions. 1. State the projection of the following in plane ABCD. (a) VA (b) VB (c) VC (d) VD
2. Name the lines that are perpendicular to VO.
3. Name the triangular planes that are perpendicular to each other.
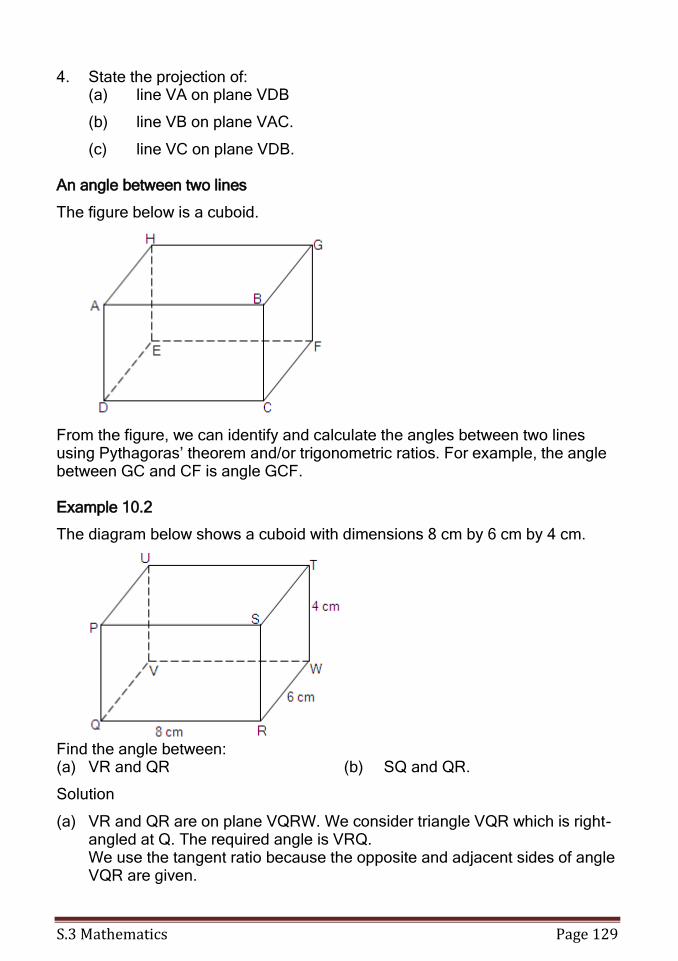
S.3 Mathematics Page 129
4. State the projection of: (a) line VA on plane VDB
(b) line VB on plane VAC.
(c) line VC on plane VDB.
An angle between two lines
The figure below is a cuboid.
From the figure, we can identify and calculate the angles between two lines using Pythagoras’ theorem and/or trigonometric ratios. For example, the angle between GC and CF is angle GCF. Example 10.2
The diagram below shows a cuboid with dimensions 8 cm by 6 cm by 4 cm.
Find the angle between: (a) VR and QR (b) SQ and QR.
Solution
(a) VR and QR are on plane VQRW. We consider triangle VQR which is right-angled at Q. The required angle is VRQ.
We use the tangent ratio because the opposite and adjacent sides of angle VQR are given.
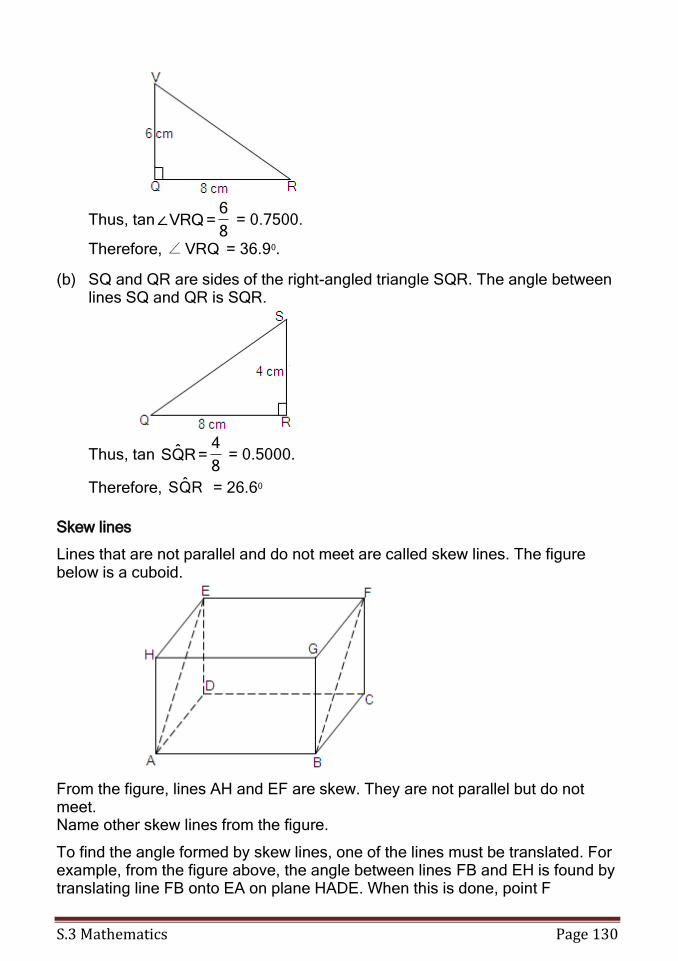
S.3 Mathematics Page 130
Thus, tan8
6=VRQ∠ = 0.7500.
Therefore, VRQ∠ = 36.90.
(b) SQ and QR are sides of the right-angled triangle SQR. The angle between lines SQ and QR is SQR.
Thus, tan 8
4=RQS = 0.5000.
Therefore, RQS = 26.60
Skew lines
Lines that are not parallel and do not meet are called skew lines. The figure below is a cuboid.
From the figure, lines AH and EF are skew. They are not parallel but do not meet. Name other skew lines from the figure.
To find the angle formed by skew lines, one of the lines must be translated. For example, from the figure above, the angle between lines FB and EH is found by translating line FB onto EA on plane HADE. When this is done, point F

S.3 Mathematics Page 131
coincides with point E and point B with A. Thus, the angle between the two lines
is AEH . Example 10.3
The figure below is a cuboid. The dimensions of the cuboid are 10 cm by 5 cm by 3 cm.
Find the angle between: (a) lines CG and DE. (b) Lines FG and DB.
Solutions
(a) CG and DE are skew lines. To find the angle between them we translate DE onto CH on plane BGHC. We consider triangle GCH which is right-
angled at H. The required angle is HCG
Thus, 5
3=HCGtan = 0.6000
Therefore, HCG = 310
(b) Lines FG and DB are skew lines. To find the angle between them, we translate DB onto plane EFGH. Point D coincides with point E and point B coincides with point G.
The angle between the lines FG and DB is formed at G, that is, EGF . Considering the right-angled triangle EFH, EF = 3 cm and FG = 10 cm.
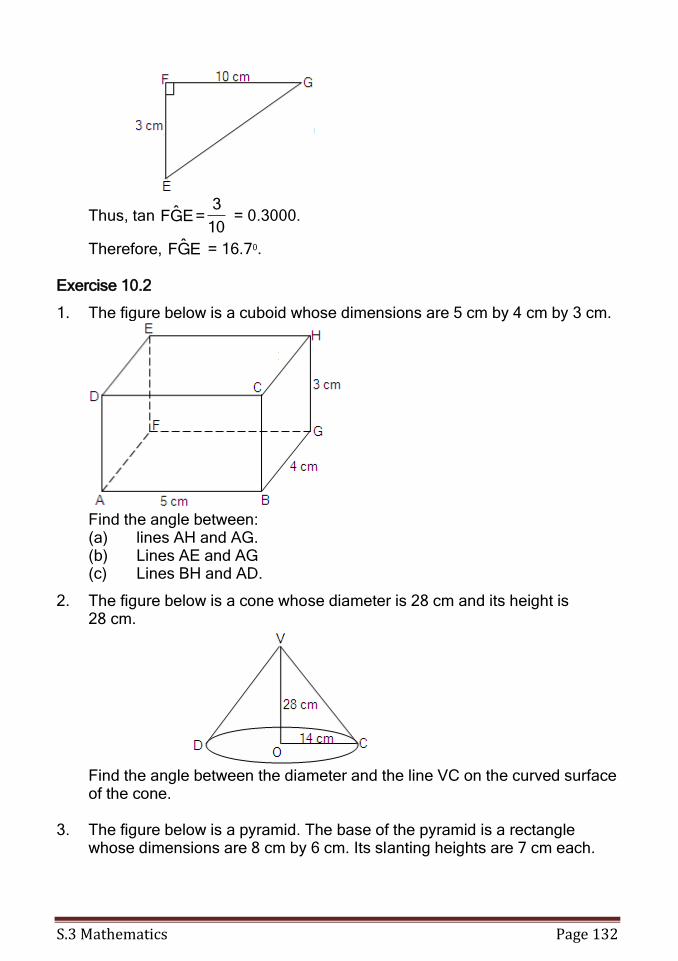
S.3 Mathematics Page 132
Thus, tan 10
3=EGF = 0.3000.
Therefore, EGF = 16.70.
Exercise 10.2
1. The figure below is a cuboid whose dimensions are 5 cm by 4 cm by 3 cm.
Find the angle between:
(a) lines AH and AG. (b) Lines AE and AG (c) Lines BH and AD.
2. The figure below is a cone whose diameter is 28 cm and its height is 28 cm.
Find the angle between the diameter and the line VC on the curved surface
of the cone. 3. The figure below is a pyramid. The base of the pyramid is a rectangle
whose dimensions are 8 cm by 6 cm. Its slanting heights are 7 cm each.
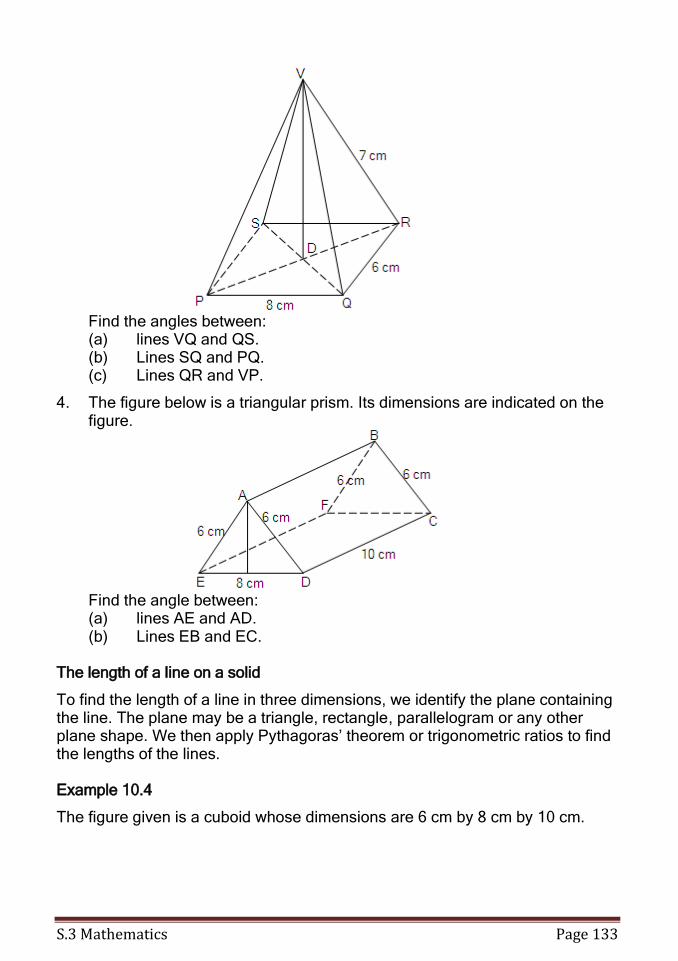
S.3 Mathematics Page 133
Find the angles between:
(a) lines VQ and QS. (b) Lines SQ and PQ. (c) Lines QR and VP.
4. The figure below is a triangular prism. Its dimensions are indicated on the figure.
Find the angle between:
(a) lines AE and AD. (b) Lines EB and EC.
The length of a line on a solid
To find the length of a line in three dimensions, we identify the plane containing the line. The plane may be a triangle, rectangle, parallelogram or any other plane shape. We then apply Pythagoras’ theorem or trigonometric ratios to find the lengths of the lines. Example 10.4
The figure given is a cuboid whose dimensions are 6 cm by 8 cm by 10 cm.
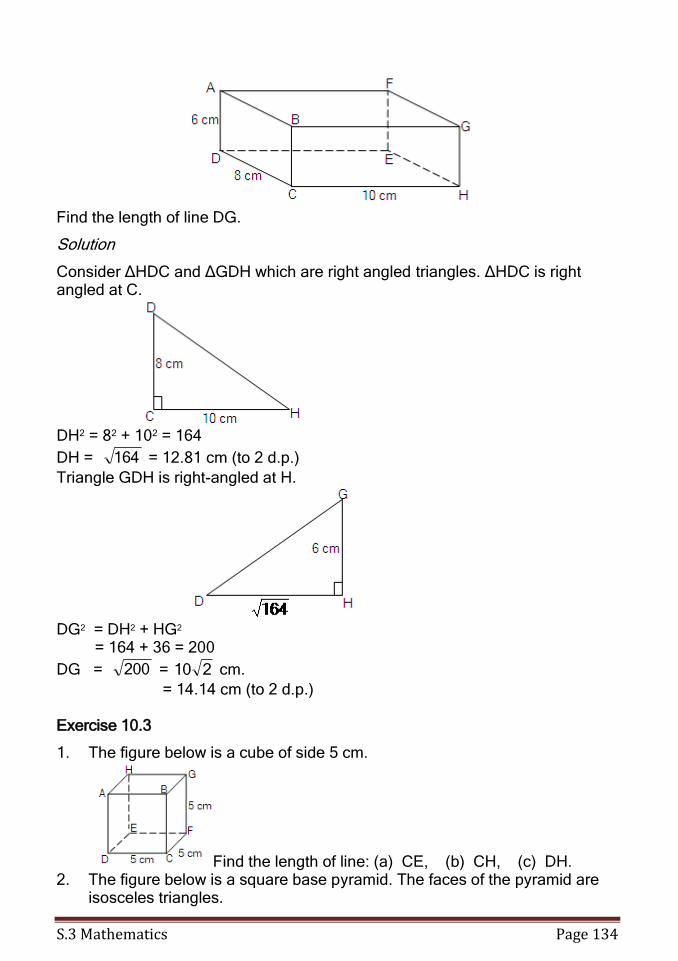
S.3 Mathematics Page 134
Find the length of line DG.
Solution
Consider ∆HDC and ∆GDH which are right angled triangles. ∆HDC is right angled at C.
DH2 = 82 + 102 = 164
DH = 164 = 12.81 cm (to 2 d.p.)
Triangle GDH is right-angled at H.
DG2 = DH2 + HG2 = 164 + 36 = 200
DG = 200 = 210 cm.
= 14.14 cm (to 2 d.p.)
Exercise 10.3
1. The figure below is a cube of side 5 cm.
Find the length of line: (a) CE, (b) CH, (c) DH. 2. The figure below is a square base pyramid. The faces of the pyramid are
isosceles triangles.
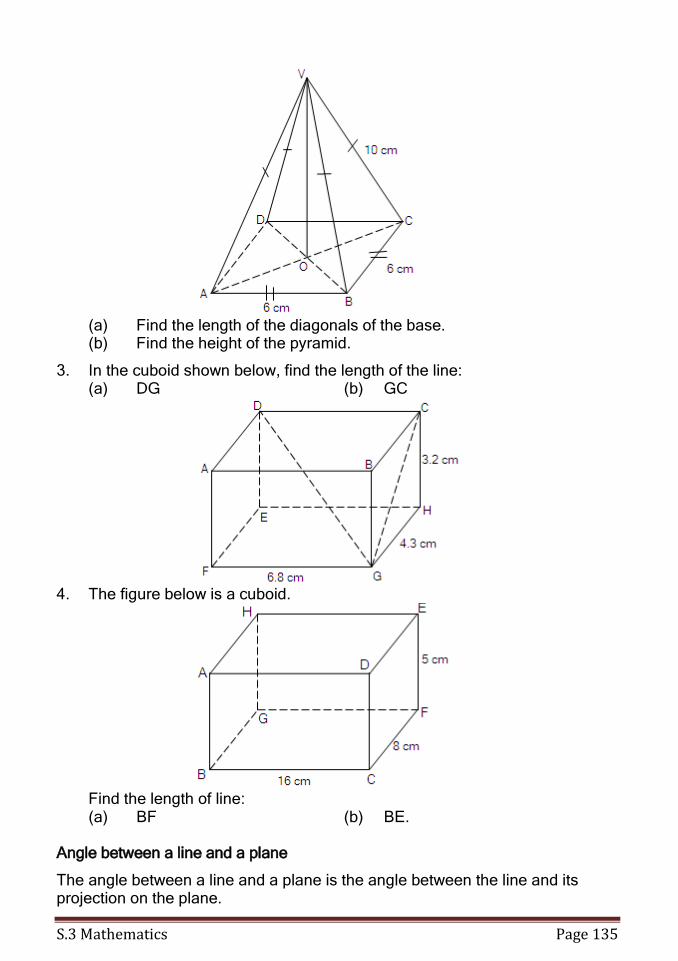
S.3 Mathematics Page 135
(a) Find the length of the diagonals of the base. (b) Find the height of the pyramid.
3. In the cuboid shown below, find the length of the line: (a) DG (b) GC
4. The figure below is a cuboid.
Find the length of line: (a) BF (b) BE.
Angle between a line and a plane
The angle between a line and a plane is the angle between the line and its projection on the plane.
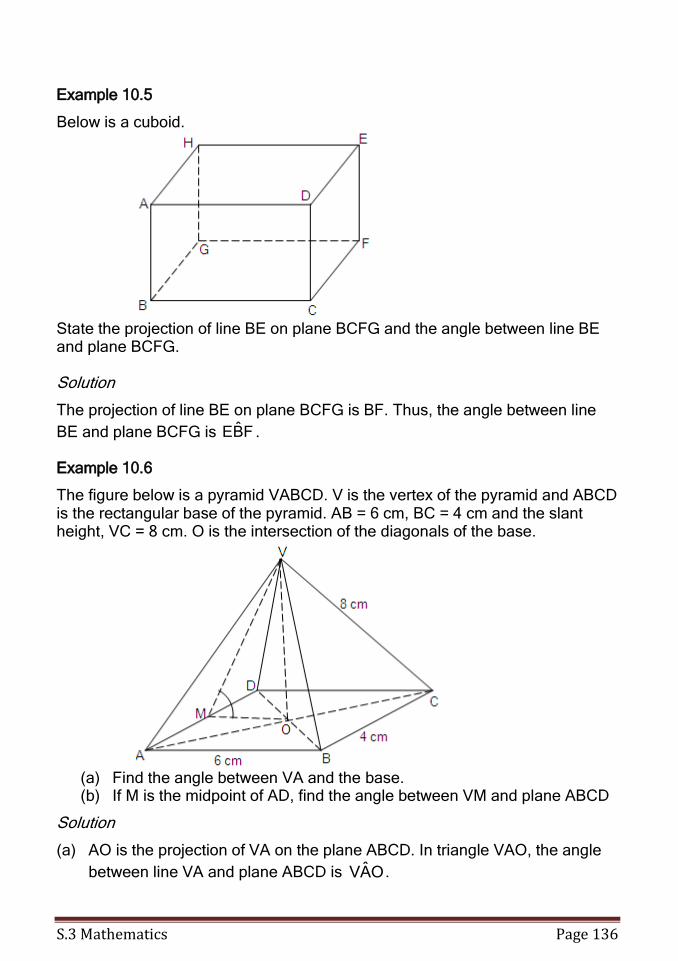
S.3 Mathematics Page 136
Example 10.5
Below is a cuboid.
State the projection of line BE on plane BCFG and the angle between line BE and plane BCFG. Solution
The projection of line BE on plane BCFG is BF. Thus, the angle between line
BE and plane BCFG is FBE . Example 10.6
The figure below is a pyramid VABCD. V is the vertex of the pyramid and ABCD is the rectangular base of the pyramid. AB = 6 cm, BC = 4 cm and the slant height, VC = 8 cm. O is the intersection of the diagonals of the base.
(a) Find the angle between VA and the base. (b) If M is the midpoint of AD, find the angle between VM and plane ABCD
Solution
(a) AO is the projection of VA on the plane ABCD. In triangle VAO, the angle
between line VA and plane ABCD is OAV .
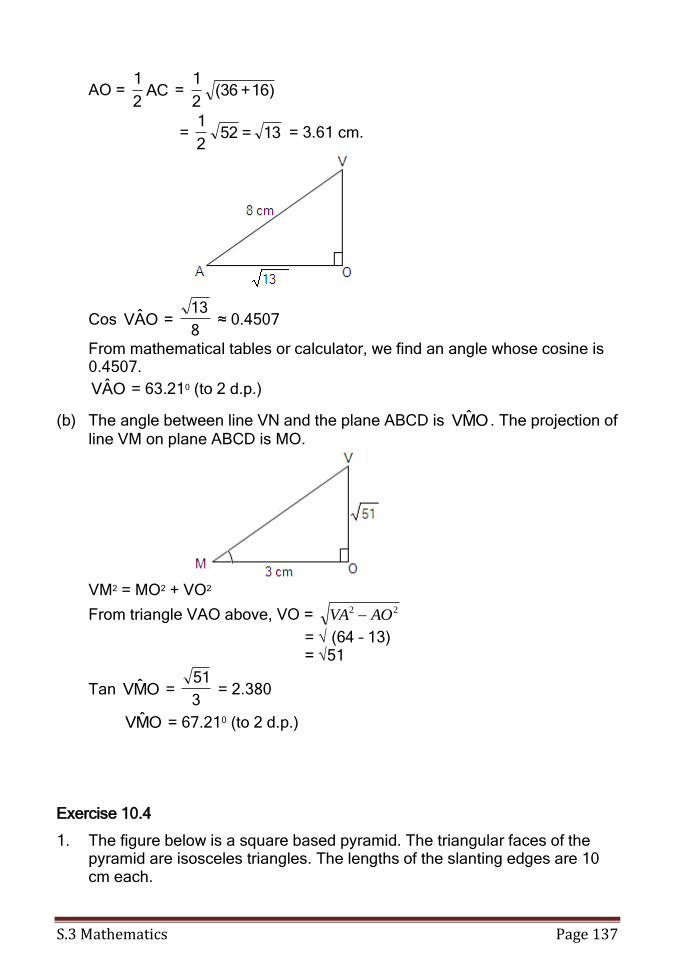
S.3 Mathematics Page 137
AO = AC2
1 = )16+36(
2
1
= 13=522
1 = 3.61 cm.
Cos OAV = 8
13 ≈ 0.4507
From mathematical tables or calculator, we find an angle whose cosine is 0.4507.
OAV = 63.210 (to 2 d.p.)
(b) The angle between line VN and the plane ABCD is OMV . The projection of line VM on plane ABCD is MO.
VM2 = MO2 + VO2
From triangle VAO above, VO = 22 AOVA
= √ (64 – 13) = √51
Tan OMV = 3
51 = 2.380
OMV = 67.210 (to 2 d.p.)
Exercise 10.4
1. The figure below is a square based pyramid. The triangular faces of the pyramid are isosceles triangles. The lengths of the slanting edges are 10 cm each.
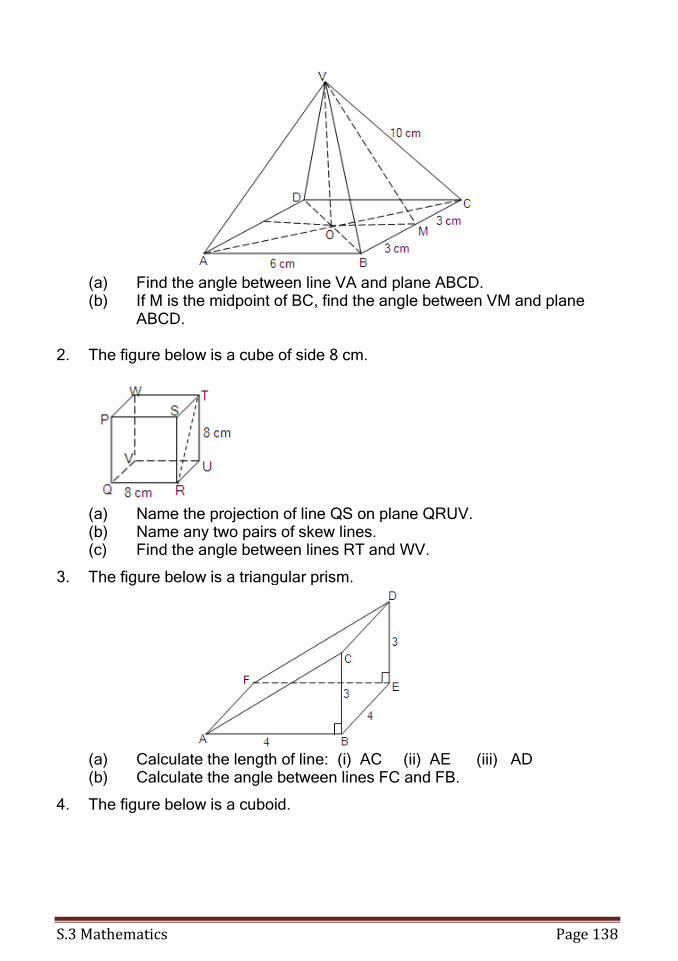
S.3 Mathematics Page 138
(a) Find the angle between line VA and plane ABCD. (b) If M is the midpoint of BC, find the angle between VM and plane
ABCD. 2. The figure below is a cube of side 8 cm.
(a) Name the projection of line QS on plane QRUV. (b) Name any two pairs of skew lines. (c) Find the angle between lines RT and WV.
3. The figure below is a triangular prism.
(a) Calculate the length of line: (i) AC (ii) AE (iii) AD (b) Calculate the angle between lines FC and FB.
4. The figure below is a cuboid.
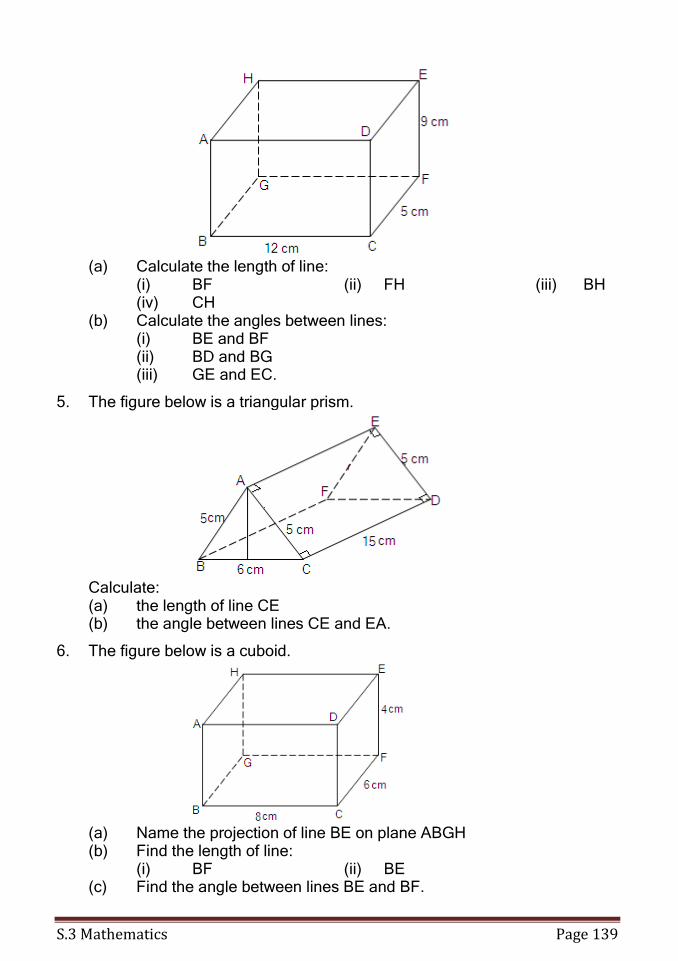
S.3 Mathematics Page 139
(a) Calculate the length of line:
(i) BF (ii) FH (iii) BH (iv) CH
(b) Calculate the angles between lines: (i) BE and BF (ii) BD and BG (iii) GE and EC.
5. The figure below is a triangular prism.
Calculate:
(a) the length of line CE (b) the angle between lines CE and EA.
6. The figure below is a cuboid.
(a) Name the projection of line BE on plane ABGH (b) Find the length of line:
(i) BF (ii) BE (c) Find the angle between lines BE and BF.
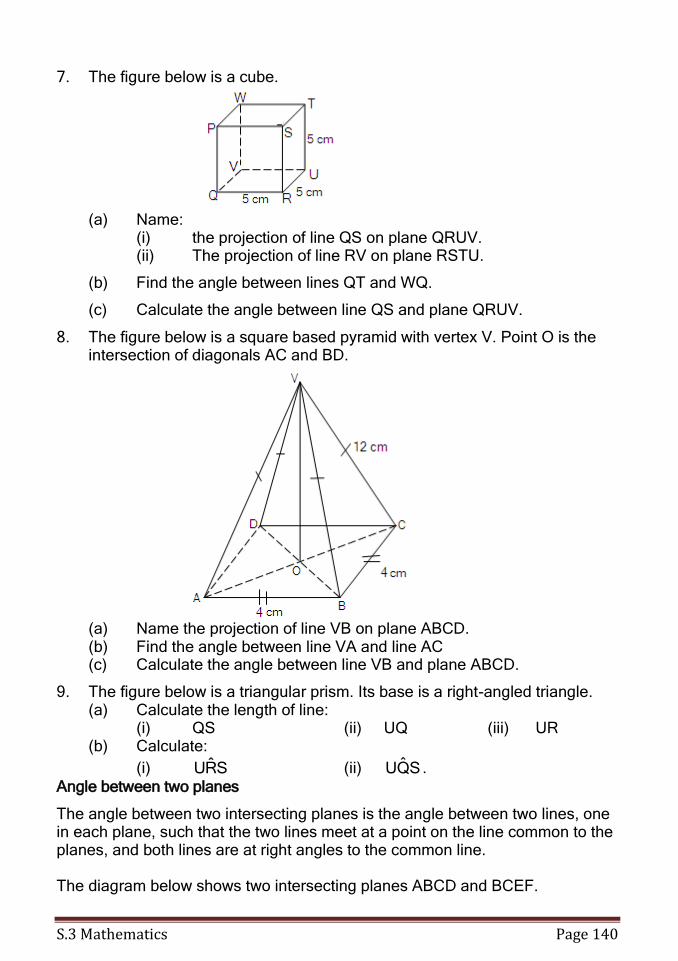
S.3 Mathematics Page 140
7. The figure below is a cube.
(a) Name:
(i) the projection of line QS on plane QRUV. (ii) The projection of line RV on plane RSTU.
(b) Find the angle between lines QT and WQ.
(c) Calculate the angle between line QS and plane QRUV.
8. The figure below is a square based pyramid with vertex V. Point O is the intersection of diagonals AC and BD.
(a) Name the projection of line VB on plane ABCD. (b) Find the angle between line VA and line AC (c) Calculate the angle between line VB and plane ABCD.
9. The figure below is a triangular prism. Its base is a right-angled triangle. (a) Calculate the length of line: (i) QS (ii) UQ (iii) UR (b) Calculate:
(i) SRU (ii) SQU . Angle between two planes
The angle between two intersecting planes is the angle between two lines, one in each plane, such that the two lines meet at a point on the line common to the planes, and both lines are at right angles to the common line. The diagram below shows two intersecting planes ABCD and BCEF.
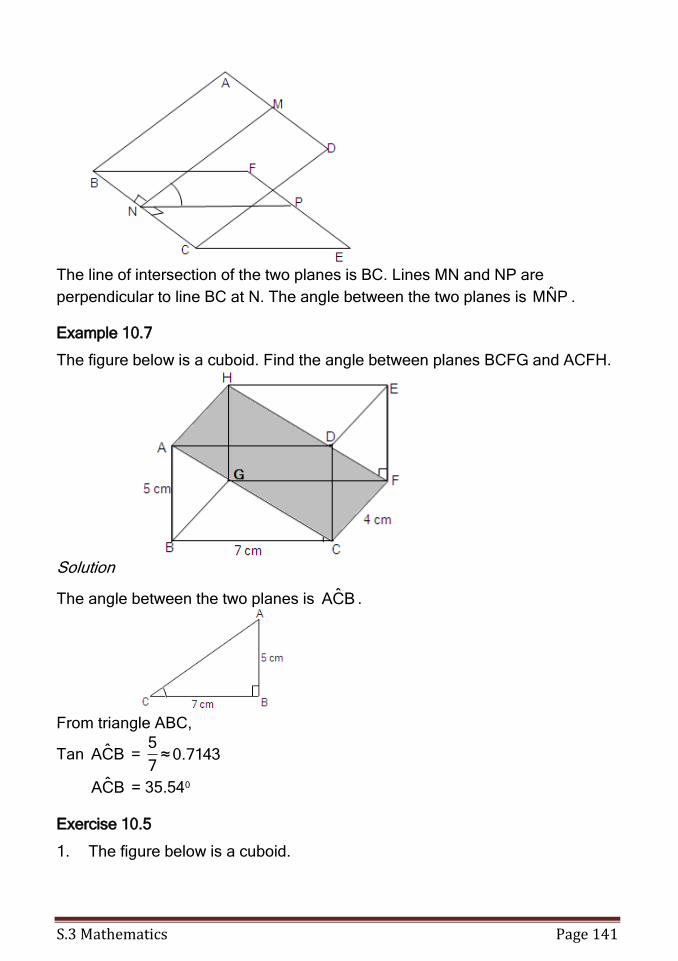
S.3 Mathematics Page 141
The line of intersection of the two planes is BC. Lines MN and NP are
perpendicular to line BC at N. The angle between the two planes is PNM . Example 10.7
The figure below is a cuboid. Find the angle between planes BCFG and ACFH.
Solution
The angle between the two planes is BCA .
From triangle ABC,
Tan BCA = 7143.0≈7
5
BCA = 35.540
Exercise 10.5
1. The figure below is a cuboid.
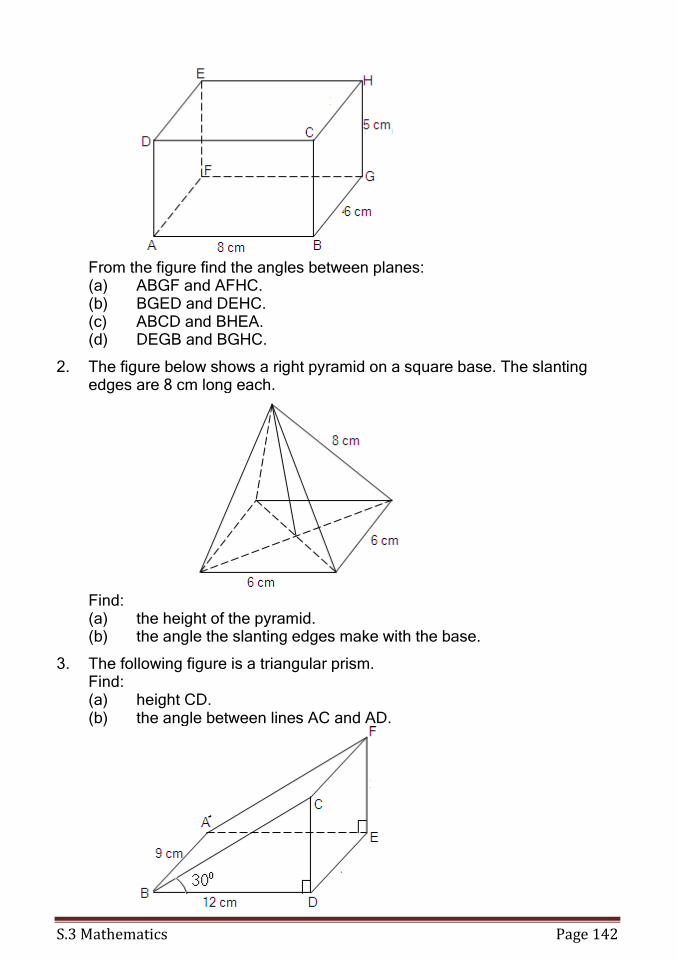
S.3 Mathematics Page 142
From the figure find the angles between planes:
(a) ABGF and AFHC. (b) BGED and DEHC. (c) ABCD and BHEA. (d) DEGB and BGHC.
2. The figure below shows a right pyramid on a square base. The slanting edges are 8 cm long each.
Find:
(a) the height of the pyramid. (b) the angle the slanting edges make with the base.
3. The following figure is a triangular prism. Find:
(a) height CD. (b) the angle between lines AC and AD.
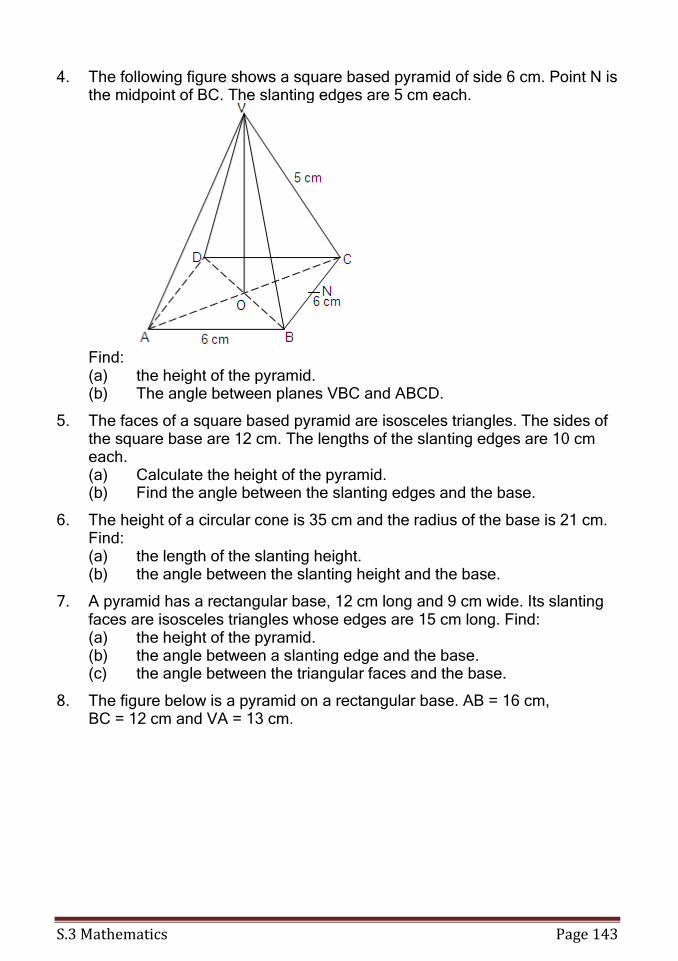
S.3 Mathematics Page 143
4. The following figure shows a square based pyramid of side 6 cm. Point N is the midpoint of BC. The slanting edges are 5 cm each.
Find:
(a) the height of the pyramid. (b) The angle between planes VBC and ABCD.
5. The faces of a square based pyramid are isosceles triangles. The sides of the square base are 12 cm. The lengths of the slanting edges are 10 cm each.
(a) Calculate the height of the pyramid. (b) Find the angle between the slanting edges and the base.
6. The height of a circular cone is 35 cm and the radius of the base is 21 cm. Find:
(a) the length of the slanting height. (b) the angle between the slanting height and the base.
7. A pyramid has a rectangular base, 12 cm long and 9 cm wide. Its slanting faces are isosceles triangles whose edges are 15 cm long. Find:
(a) the height of the pyramid. (b) the angle between a slanting edge and the base. (c) the angle between the triangular faces and the base.
8. The figure below is a pyramid on a rectangular base. AB = 16 cm, BC = 12 cm and VA = 13 cm.
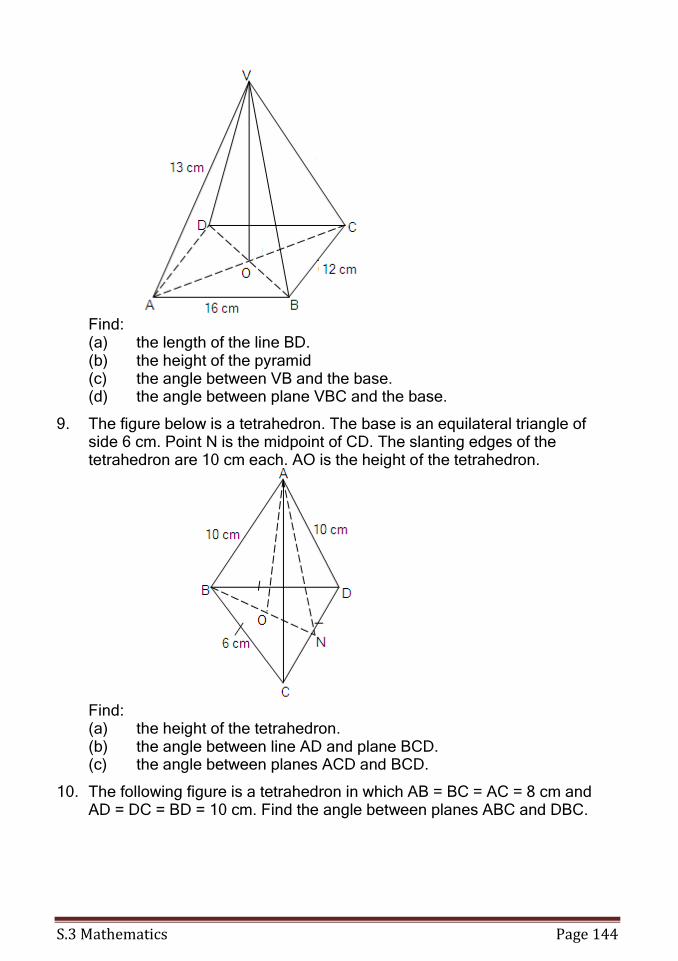
S.3 Mathematics Page 144
Find:
(a) the length of the line BD. (b) the height of the pyramid (c) the angle between VB and the base. (d) the angle between plane VBC and the base.
9. The figure below is a tetrahedron. The base is an equilateral triangle of side 6 cm. Point N is the midpoint of CD. The slanting edges of the tetrahedron are 10 cm each. AO is the height of the tetrahedron.
Find:
(a) the height of the tetrahedron. (b) the angle between line AD and plane BCD. (c) the angle between planes ACD and BCD.
10. The following figure is a tetrahedron in which AB = BC = AC = 8 cm and AD = DC = BD = 10 cm. Find the angle between planes ABC and DBC.
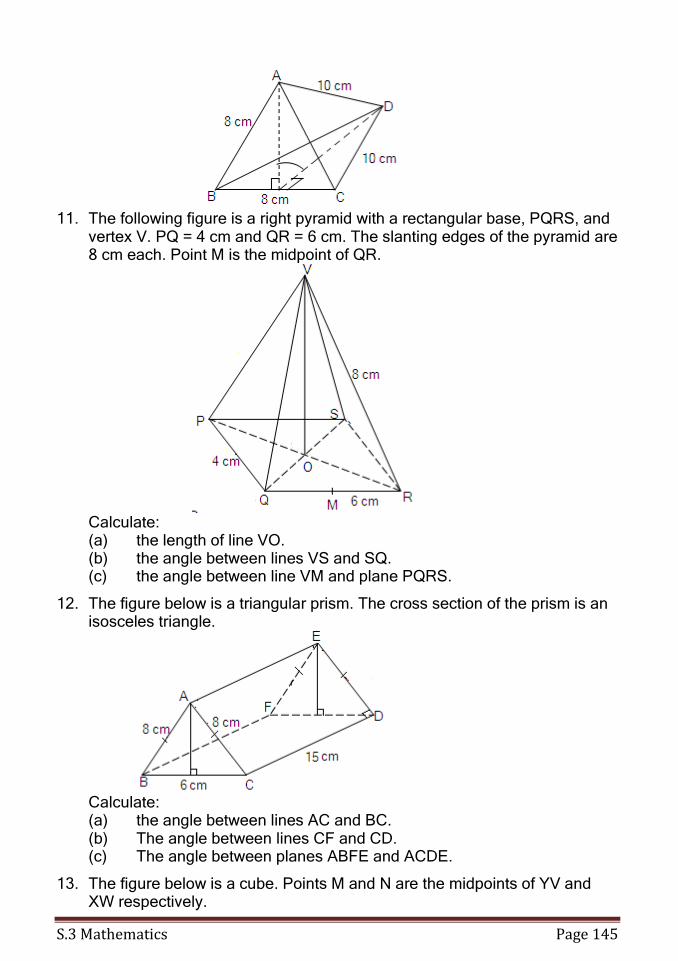
S.3 Mathematics Page 145
11. The following figure is a right pyramid with a rectangular base, PQRS, and
vertex V. PQ = 4 cm and QR = 6 cm. The slanting edges of the pyramid are 8 cm each. Point M is the midpoint of QR.
Calculate:
(a) the length of line VO. (b) the angle between lines VS and SQ. (c) the angle between line VM and plane PQRS.
12. The figure below is a triangular prism. The cross section of the prism is an isosceles triangle.
Calculate:
(a) the angle between lines AC and BC. (b) The angle between lines CF and CD. (c) The angle between planes ABFE and ACDE.
13. The figure below is a cube. Points M and N are the midpoints of YV and XW respectively.
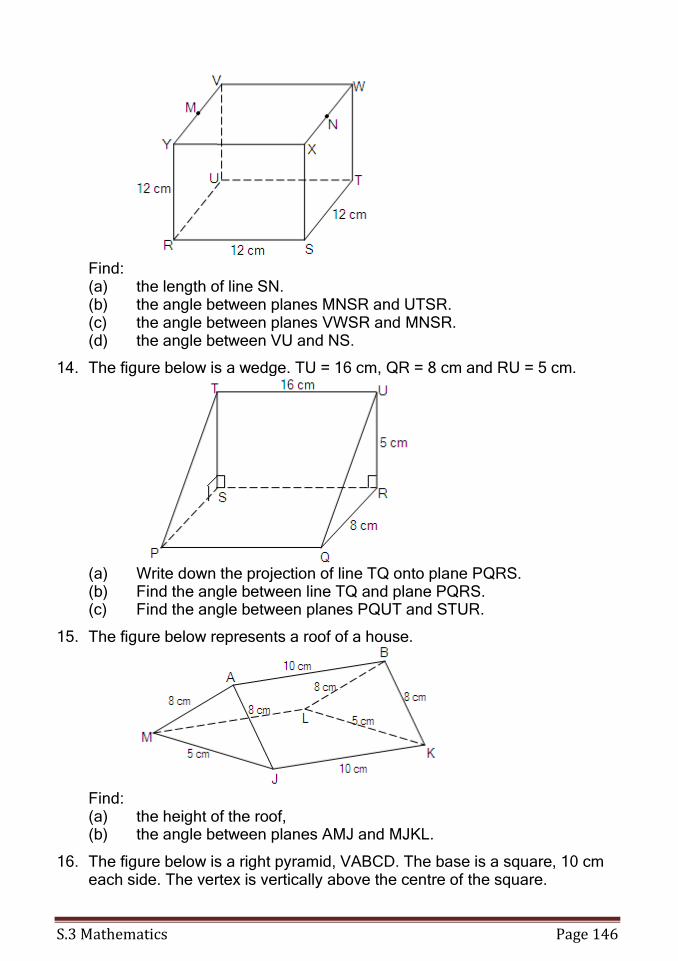
S.3 Mathematics Page 146
Find:
(a) the length of line SN. (b) the angle between planes MNSR and UTSR. (c) the angle between planes VWSR and MNSR. (d) the angle between VU and NS.
14. The figure below is a wedge. TU = 16 cm, QR = 8 cm and RU = 5 cm.
(a) Write down the projection of line TQ onto plane PQRS. (b) Find the angle between line TQ and plane PQRS. (c) Find the angle between planes PQUT and STUR.
15. The figure below represents a roof of a house.
Find:
(a) the height of the roof, (b) the angle between planes AMJ and MJKL.
16. The figure below is a right pyramid, VABCD. The base is a square, 10 cm each side. The vertex is vertically above the centre of the square.
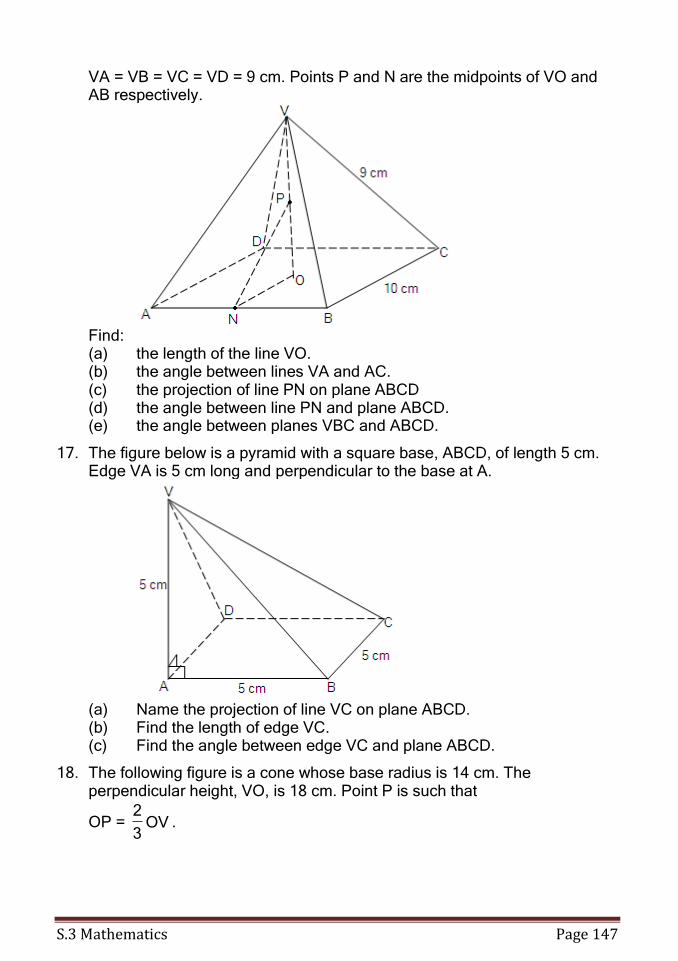
S.3 Mathematics Page 147
VA = VB = VC = VD = 9 cm. Points P and N are the midpoints of VO and AB respectively.
Find: (a) the length of the line VO. (b) the angle between lines VA and AC. (c) the projection of line PN on plane ABCD (d) the angle between line PN and plane ABCD. (e) the angle between planes VBC and ABCD.
17. The figure below is a pyramid with a square base, ABCD, of length 5 cm. Edge VA is 5 cm long and perpendicular to the base at A.
(a) Name the projection of line VC on plane ABCD. (b) Find the length of edge VC. (c) Find the angle between edge VC and plane ABCD.
18. The following figure is a cone whose base radius is 14 cm. The perpendicular height, VO, is 18 cm. Point P is such that
OP = OV3
2.
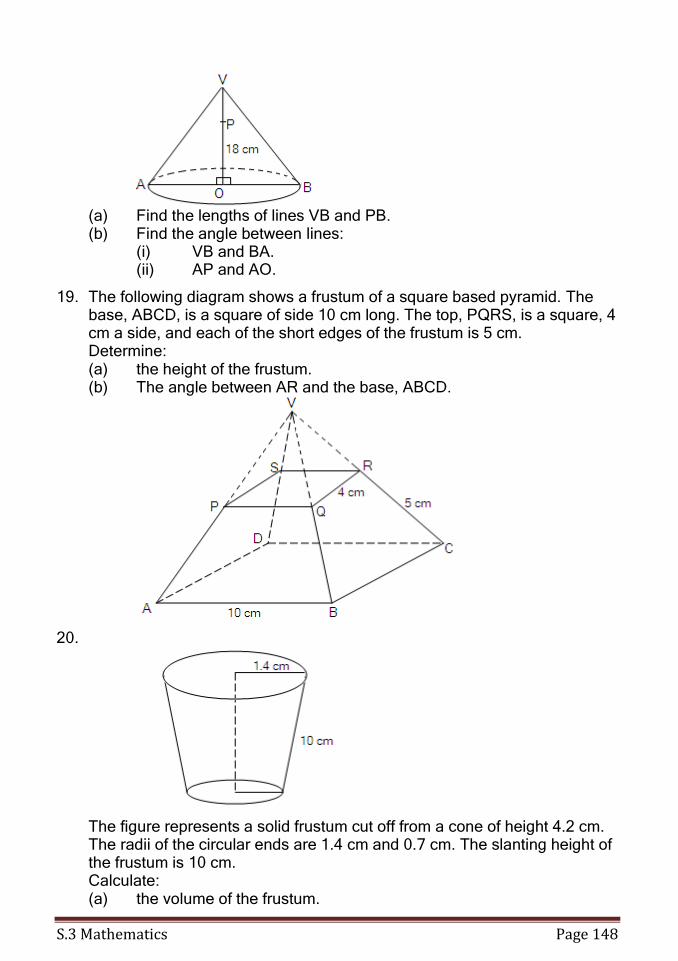
S.3 Mathematics Page 148
(a) Find the lengths of lines VB and PB. (b) Find the angle between lines:
(i) VB and BA. (ii) AP and AO.
19. The following diagram shows a frustum of a square based pyramid. The base, ABCD, is a square of side 10 cm long. The top, PQRS, is a square, 4 cm a side, and each of the short edges of the frustum is 5 cm. Determine: (a) the height of the frustum. (b) The angle between AR and the base, ABCD.
20.
The figure represents a solid frustum cut off from a cone of height 4.2 cm. The radii of the circular ends are 1.4 cm and 0.7 cm. The slanting height of the frustum is 10 cm. Calculate: (a) the volume of the frustum.
S.3 Mathematics Page 149
(b) the surface area of the frustum.
11. Further Logarithms
Logarithmic notation
When a number is expressed in the index form ax, x is called the logarithm and a is called the base.
The logarithm of y to the base a is written as ,yloga i.e. if y = ax, then
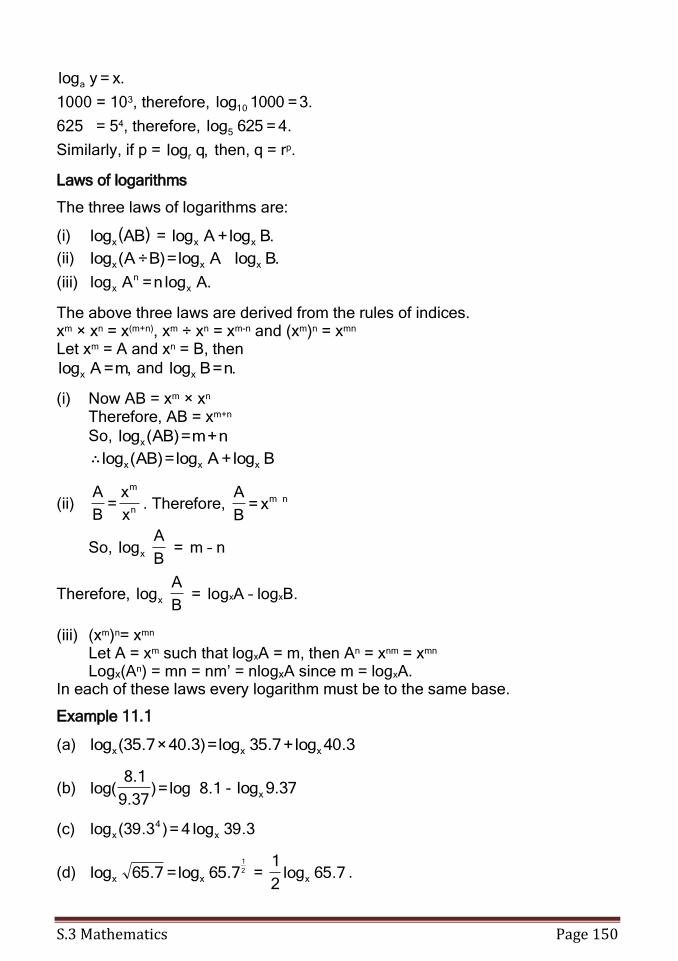
S.3 Mathematics Page 150
.x=yloga
1000 = 103, therefore, .3=1000log10
625 = 54, therefore, .4=625log5
Similarly, if p = ,qlogr then, q = rp.
Laws of logarithms
The three laws of logarithms are:
(i) ( )ABlogx = .Blog+Alog xx
(ii) .BlogAlog=)B÷A(log xxx
(iii) .Alogn=Alog x
n
x
The above three laws are derived from the rules of indices. xm × xn = x(m+n), xm ÷ xn = xm-n and (xm)n = xmn Let xm = A and xn = B, then
,m=Alogx and .n=Blogx
(i) Now AB = xm × xn Therefore, AB = xm+n
So, n+m=)AB(logx
Blog+Alog=)AB(log∴ xxx
(ii) n
m
x
x=
B
A. Therefore, nmx=
B
A
So, =B
Alogx m – n
Therefore, =B
Alogx logxA – logxB.
(iii) (xm)n= xmn Let A = xm such that logxA = m, then An = xnm = xmn Logx(An) = mn = nm’ = nlogxA since m = logxA. In each of these laws every logarithm must be to the same base.
Example 11.1
(a) 3.40log+7.35log=)3.40×7.35(log xxx
(b) 1.8log=)37.9
1.8log( - 37.9logx
(c) 3.39log4=)3.39(log x
4
x
(d) 2
1
7.65log=7.65log xx = 7.65log2
1x .
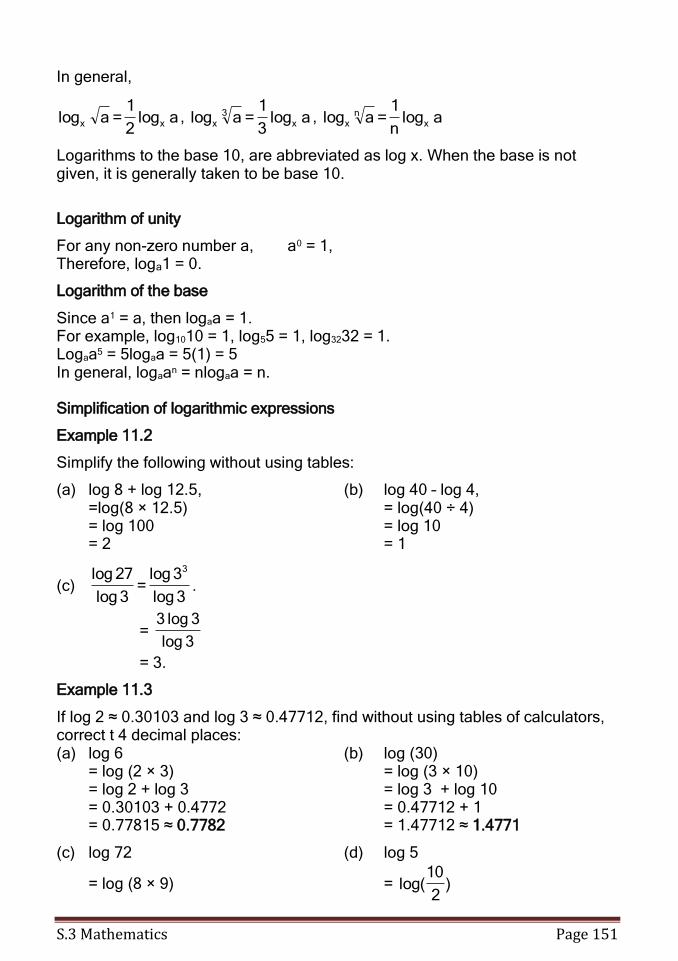
S.3 Mathematics Page 151
In general,
alog2
1=alog xx , alog
3
1=alog x
3x , alog
n
1=alog x
nx
Logarithms to the base 10, are abbreviated as log x. When the base is not given, it is generally taken to be base 10.
Logarithm of unity
For any non-zero number a, a0 = 1, Therefore, loga1 = 0.
Logarithm of the base
Since a1 = a, then logaa = 1. For example, log1010 = 1, log55 = 1, log3232 = 1. Logaa5 = 5logaa = 5(1) = 5 In general, logaan = nlogaa = n.
Simplification of logarithmic expressions
Example 11.2
Simplify the following without using tables:
(a) log 8 + log 12.5, (b) log 40 – log 4, =log(8 × 12.5) = log(40 ÷ 4) = log 100 = log 10 = 2 = 1
(c) .3log
3log=
3log
27log 3
= 3log
3log3
= 3.
Example 11.3
If log 2 ≈ 0.30103 and log 3 ≈ 0.47712, find without using tables of calculators, correct t 4 decimal places: (a) log 6 (b) log (30) = log (2 × 3) = log (3 × 10) = log 2 + log 3 = log 3 + log 10 = 0.30103 + 0.4772 = 0.47712 + 1 = 0.77815 ≈ 0.7782 = 1.47712 ≈ 1.4771
(c) log 72 (d) log 5
= log (8 × 9) = )2
10log(
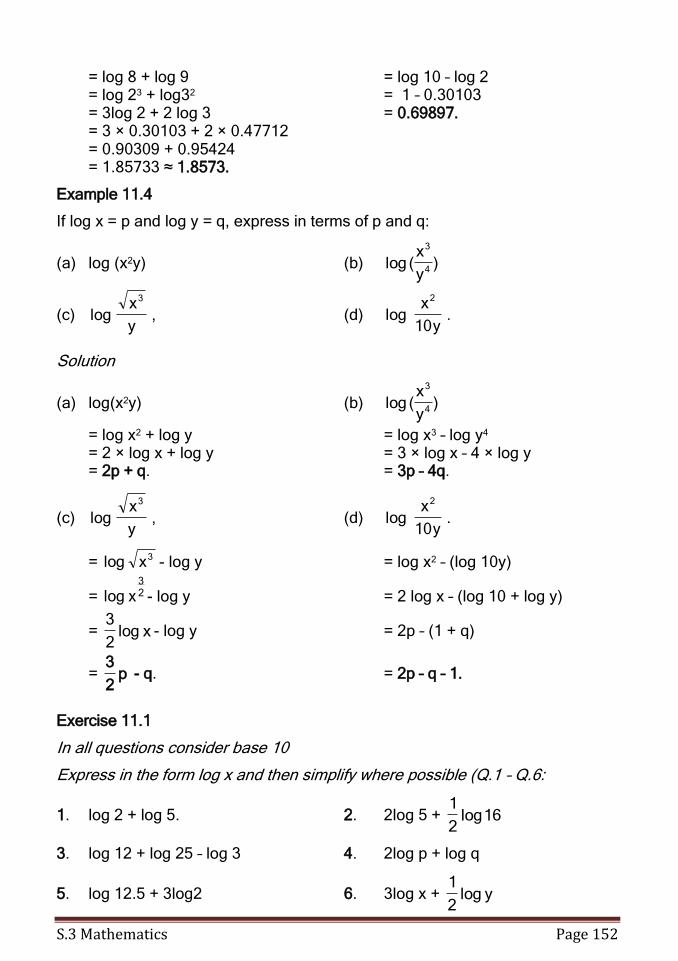
S.3 Mathematics Page 152
= log 8 + log 9 = log 10 – log 2 = log 23 + log32 = 1 – 0.30103 = 3log 2 + 2 log 3 = 0.69897. = 3 × 0.30103 + 2 × 0.47712 = 0.90309 + 0.95424 = 1.85733 ≈ 1.8573.
Example 11.4
If log x = p and log y = q, express in terms of p and q:
(a) log (x2y) (b) )y
x(log 4
3
(c) ,y
xlog
3
(d) .y10
xlog
2
Solution
(a) log(x2y) (b) )y
x(log 4
3
= log x2 + log y = log x3 – log y4 = 2 × log x + log y = 3 × log x – 4 × log y = 2p + q. = 3p – 4q.
(c) ,y
xlog
3
(d) .y10
xlog
2
= 3xlog - log y = log x2 – (log 10y)
= 23
xlog - log y = 2 log x – (log 10 + log y)
= xlog2
3- log y = 2p – (1 + q)
= p2
3 - q. = 2p – q – 1.
Exercise 11.1
In all questions consider base 10
Express in the form log x and then simplify where possible (Q.1 – Q.6:
1. log 2 + log 5. 2. 2log 5 + 16log2
1
3. log 12 + log 25 – log 3 4. 2log p + log q
5. log 12.5 + 3log2 6. 3log x + ylog2
1
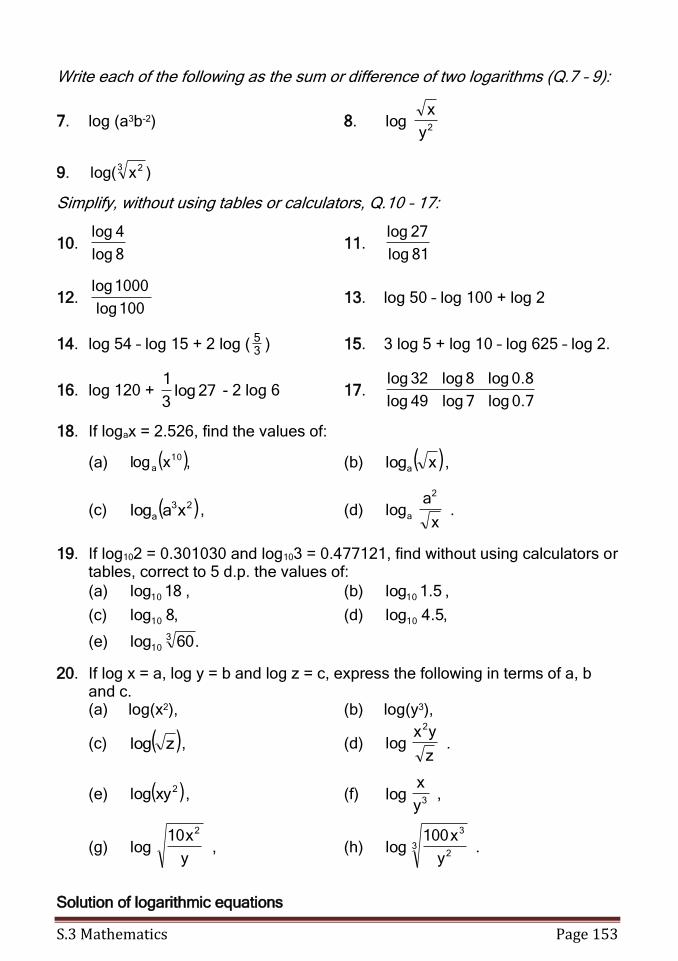
S.3 Mathematics Page 153
Write each of the following as the sum or difference of two logarithms (Q.7 – 9):
7. log (a3b-2) 8. y
xlog 2
9. )xlog(3 2
Simplify, without using tables or calculators, Q.10 – 17:
10. 8log
4log 11.
81log
27log
12. 100log
1000log 13. log 50 – log 100 + log 2
14. log 54 – log 15 + 2 log ( 35
) 15. 3 log 5 + log 10 – log 625 – log 2.
16. log 120 + 27log3
1 - 2 log 6 17.
7.0log7log49log
8.0log8log32log
18. If logax = 2.526, find the values of:
(a) ( ),xlog 10
a (b) ( )xloga ,
(c) ( )23
a xalog , (d) x
alog
2
a .
19. If log102 = 0.301030 and log103 = 0.477121, find without using calculators or tables, correct to 5 d.p. the values of:
(a) 18log10 , (b) 5.1log10 ,
(c) ,8log10 (d) ,5.4log10
(e) .60log 310
20. If log x = a, log y = b and log z = c, express the following in terms of a, b and c.
(a) log(x2), (b) log(y3),
(c) ( )zlog , (d) z
yxlog
2
.
(e) ( )2xylog , (f) y
xlog 3 ,
(g) y
x10log
2
, (h) y
x100log 3
2
3
.
Solution of logarithmic equations
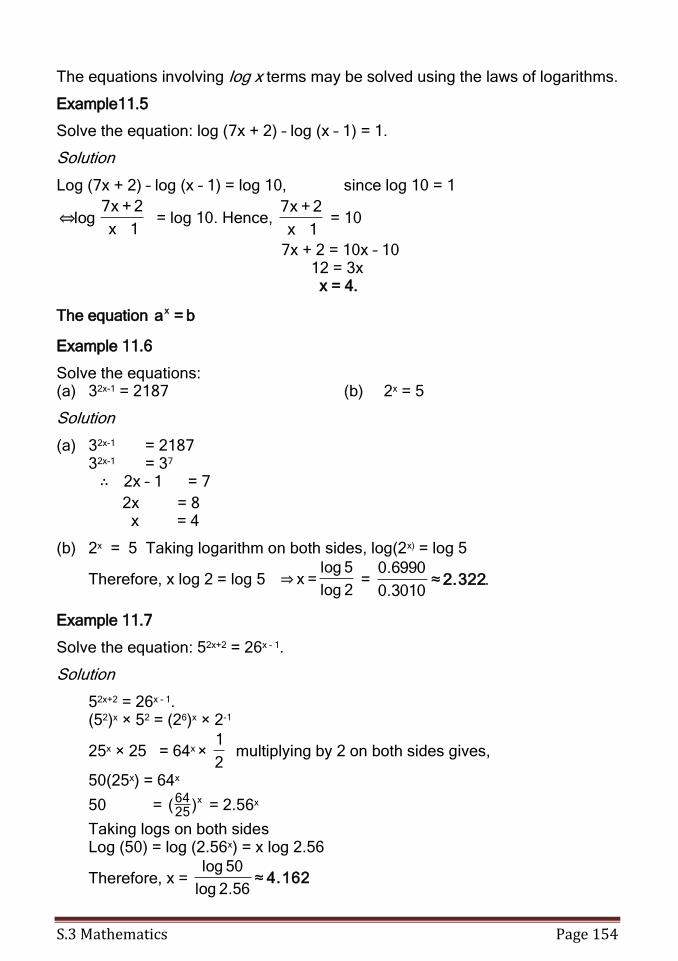
S.3 Mathematics Page 154
The equations involving log x terms may be solved using the laws of logarithms.
Example11.5
Solve the equation: log (7x + 2) – log (x – 1) = 1.
Solution
Log (7x + 2) – log (x – 1) = log 10, since log 10 = 1
1x
2+x7log⇔ = log 10. Hence,
1x
2+x7 = 10
7x + 2 = 10x – 10 12 = 3x x = 4.
The equation b=ax
Example 11.6
Solve the equations: (a) 32x-1 = 2187 (b) 2x = 5
Solution
(a) 32x-1 = 2187 32x-1 = 37 ∴ 2x – 1 = 7
2x = 8 x = 4
(b) 2x = 5 Taking logarithm on both sides, log(2x) = log 5
Therefore, x log 2 = log 5 2log
5log=x⇒ = .≈
3010.0
6990.02.322
Example 11.7
Solve the equation: 52x+2 = 26x – 1.
Solution
52x+2 = 26x – 1. (52)x × 52 = (26)x × 2-1
25x × 25 = 64x × 2
1 multiplying by 2 on both sides gives,
50(25x) = 64x
50 = x)(2564
= 2.56x
Taking logs on both sides Log (50) = log (2.56x) = x log 2.56
Therefore, x = 4.162≈56.2log
50log
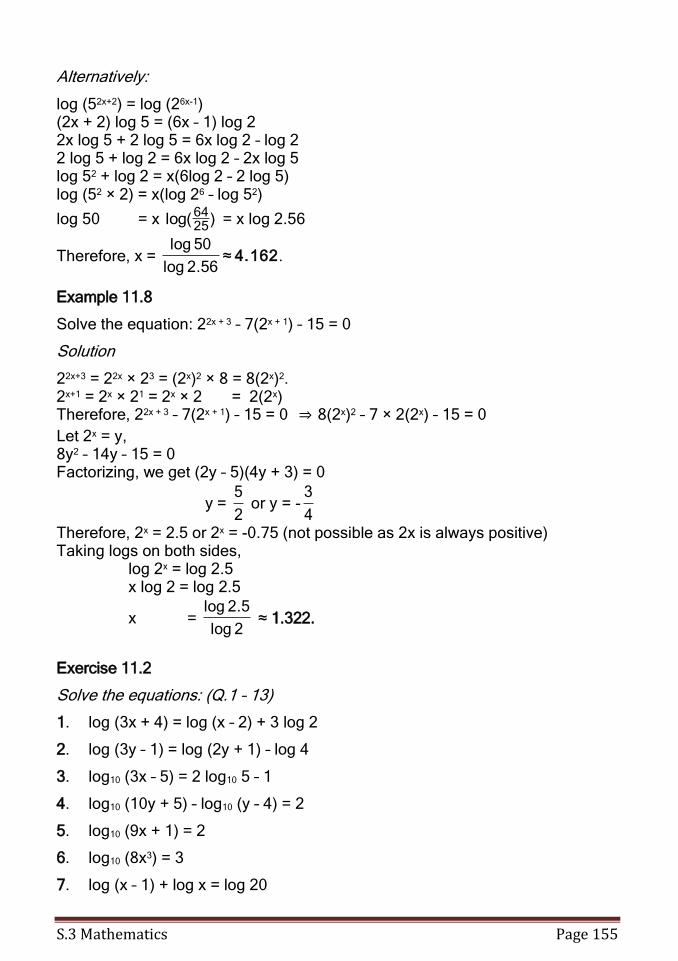
S.3 Mathematics Page 155
Alternatively:
log (52x+2) = log (26x-1) (2x + 2) log 5 = (6x – 1) log 2 2x log 5 + 2 log 5 = 6x log 2 – log 2 2 log 5 + log 2 = 6x log 2 – 2x log 5 log 52 + log 2 = x(6log 2 – 2 log 5) log (52 × 2) = x(log 26 – log 52)
log 50 = x )log(2564
= x log 2.56
Therefore, x = 4.162≈56.2log
50log.
Example 11.8
Solve the equation: 22x + 3 – 7(2x + 1) – 15 = 0
Solution
22x+3 = 22x × 23 = (2x)2 × 8 = 8(2x)2. 2x+1 = 2x × 21 = 2x × 2 = 2(2x) Therefore, 22x + 3 – 7(2x + 1) – 15 = 0 ⇒ 8(2x)2 – 7 × 2(2x) – 15 = 0
Let 2x = y, 8y2 – 14y – 15 = 0 Factorizing, we get (2y – 5)(4y + 3) = 0
y = 2
5 or y = -
4
3
Therefore, 2x = 2.5 or 2x = -0.75 (not possible as 2x is always positive) Taking logs on both sides, log 2x = log 2.5 x log 2 = log 2.5
x = 2log
5.2log ≈ 1.322.
Exercise 11.2
Solve the equations: (Q.1 – 13)
1. log (3x + 4) = log (x – 2) + 3 log 2
2. log (3y – 1) = log (2y + 1) – log 4
3. log10 (3x – 5) = 2 log10 5 – 1
4. log10 (10y + 5) – log10 (y – 4) = 2
5. log10 (9x + 1) = 2
6. log10 (8x3) = 3
7. log (x – 1) + log x = log 20
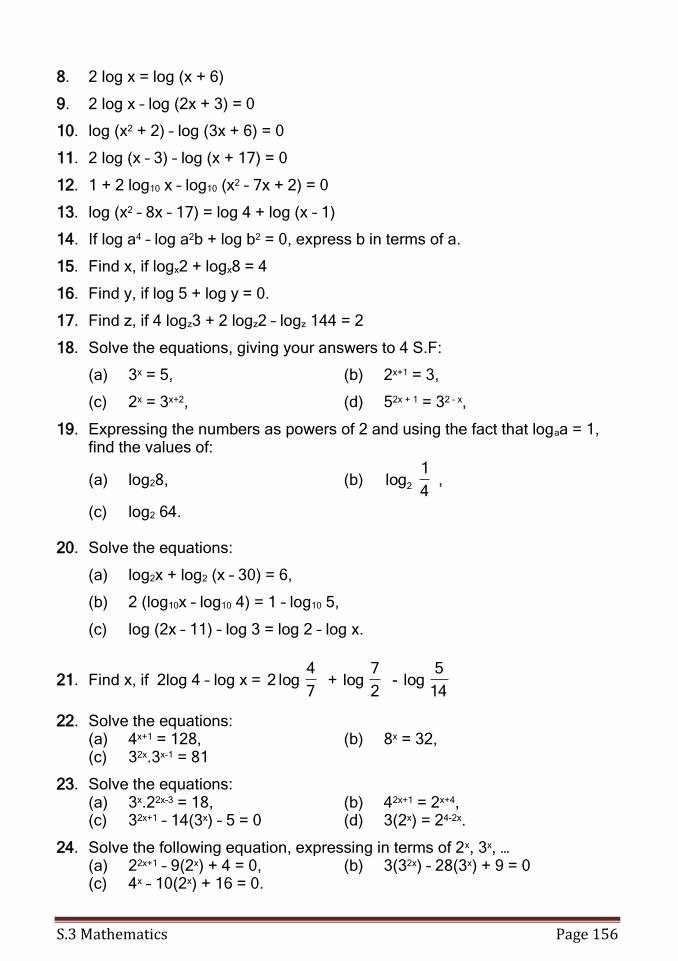
S.3 Mathematics Page 156
8. 2 log x = log (x + 6)
9. 2 log x – log (2x + 3) = 0
10. log (x2 + 2) – log (3x + 6) = 0
11. 2 log (x – 3) – log (x + 17) = 0
12. 1 + 2 log10 x – log10 (x2 – 7x + 2) = 0
13. log (x2 – 8x – 17) = log 4 + log (x – 1)
14. If log a4 – log a2b + log b2 = 0, express b in terms of a.
15. Find x, if logx2 + logx8 = 4
16. Find y, if log 5 + log y = 0.
17. Find z, if 4 logz3 + 2 logz2 – logz 144 = 2
18. Solve the equations, giving your answers to 4 S.F:
(a) 3x = 5, (b) 2x+1 = 3,
(c) 2x = 3x+2, (d) 52x + 1 = 32 – x,
19. Expressing the numbers as powers of 2 and using the fact that logaa = 1, find the values of:
(a) log28, (b) 4
1log2 ,
(c) log2 64.
20. Solve the equations:
(a) log2x + log2 (x – 30) = 6,
(b) 2 (log10x – log10 4) = 1 – log10 5,
(c) log (2x – 11) – log 3 = log 2 – log x.
21. Find x, if 2log 4 – log x = 7
4log2 +
2
7log -
14
5log
22. Solve the equations: (a) 4x+1 = 128, (b) 8x = 32, (c) 32x.3x-1 = 81
23. Solve the equations: (a) 3x.22x-3 = 18, (b) 42x+1 = 2x+4, (c) 32x+1 – 14(3x) – 5 = 0 (d) 3(2x) = 24-2x.
24. Solve the following equation, expressing in terms of 2x, 3x, … (a) 22x+1 – 9(2x) + 4 = 0, (b) 3(32x) – 28(3x) + 9 = 0 (c) 4x – 10(2x) + 16 = 0.
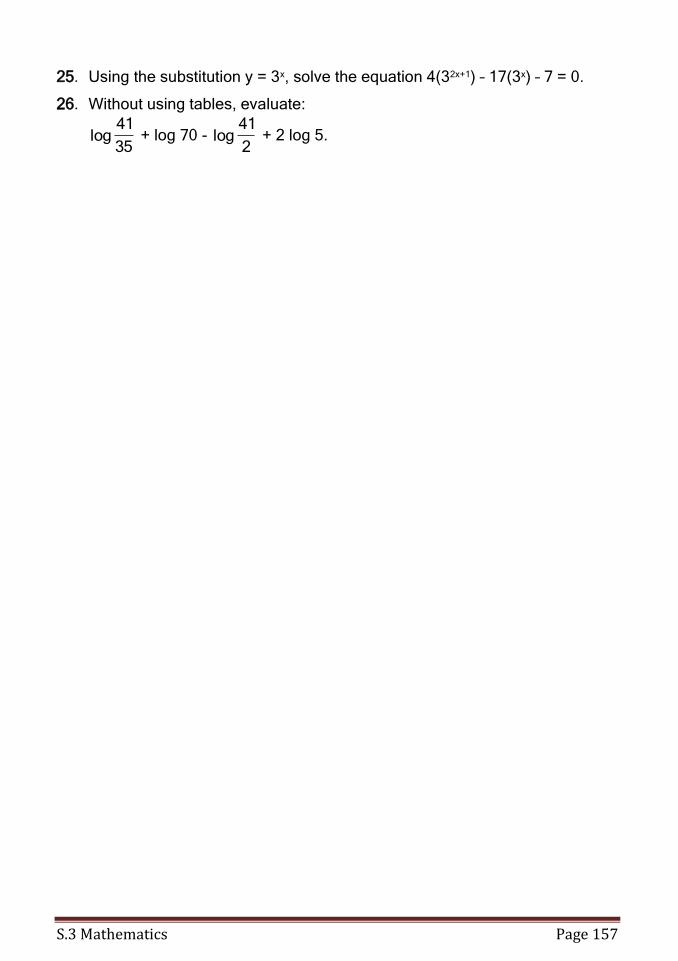
S.3 Mathematics Page 157
25. Using the substitution y = 3x, solve the equation 4(32x+1) – 17(3x) – 7 = 0.
26. Without using tables, evaluate:
35
41log + log 70 -
2
41log + 2 log 5.