O') IJ ELECTE
235
REPORT F33657-86-D-0094, 0004 COST OF QUALITY EVALUATION METHODOLOGIES HANDBOOK Ifn (V) O') WILLIAM J. GRUNENWALD DONOVAN C. WIKSTROM ROBERT SIMON IJ 0 WILLIAM CANCE ELECTE < WALLACE AND COMPANY MAR 2 4 9 594 DAYTON YELLOW SPRINGS ROAD FAIRBORN, OH 45324 28 JULY 1988 FINAL REPORT PREPARED FOR: IL Drnr'yTION StATEMENT Approved jot pubyic relo ase HEADQUARTERS, AIR FORCE SYSTEMS COMMAND AFSC/PLEQ ANDREWS AIR FORCE BASE, MD 20334-5000 HEADQUARTERS, AERONAUTICAL SYSTEMS DIVISION ASD/PMDQ * WRIGHT-PATTERSON AIR FORCE BASE, OH 45433 9 2 007
Transcript of O') IJ ELECTE

REPORT F33657-86-D-0094, 0004
COST OF QUALITY EVALUATION METHODOLOGIES HANDBOOKIfn(V)
O') WILLIAM J. GRUNENWALD
DONOVAN C. WIKSTROMROBERT SIMON IJ
0 WILLIAM CANCE ELECTE
< WALLACE AND COMPANY MAR 2 4 9594 DAYTON YELLOW SPRINGS ROADFAIRBORN, OH 45324
28 JULY 1988
FINAL REPORT
PREPARED FOR: IL Drnr'yTION StATEMENTApproved jot pubyic relo ase
HEADQUARTERS, AIR FORCE SYSTEMS COMMANDAFSC/PLEQANDREWS AIR FORCE BASE, MD 20334-5000
HEADQUARTERS, AERONAUTICAL SYSTEMS DIVISIONASD/PMDQ
* WRIGHT-PATTERSON AIR FORCE BASE, OH 45433
9 2 007

PREFACE
The Department of Defense and the Air Force have always recog-nized the need to insist on top quality in the wide variety ofmaterial that is purchased in support of the fighting forces.Recently, as part of the emphasis being placed on contractors andtheir actions relative to providing quality products, visibilityinto the actual Cost of Quality has become very important.
The concept of Cost of Quality cuts across all functional activi-ties involved in the development and acquisition of weapon sys-tems, related spares, and support equipment. Making Cost ofQuality visible is important because it will highlight areaswhere it is obvious that contractors are trying to inspect ortest quality in, rather than build it in. Seeing where contrac-tors are experiencing excessive costs (for example, in inspec-tion, test, reinspection, retest, engineering changes, material,labor, return to vendor, etc.) will enable government and con-tractor personnel to focus on efforts to find the root causes forthese costs and to eliminate those causes.
This handbook was developed for two purposes. First, the hand-book explains the concept of Cost of Quality in its basic formand in terms of the major categories of costs involved. Second,. the handbook deals with the specific aspects of Cost of Qualityinvolved with individual areas of expertise. Users are shown howto identify and evaluate Cost of Quality elements in their parti-cular discipline. Once captured, Cost of Quality provides avehicle for good multifunctional communication. Each functioncan relate to quality issues that cut across several functionallines. In this way, feedback is provided on common problems andeffectiveness of solutions. Overall, the handbook will help theuser to work with the contractor in the identification, evalu-ation, and management of Cost of Quality.
A word of caution. The handbook is not a "cookbook" or a "check-list". Rather, it is a guide intended to educate and enable theuser to think about Cost of Quality, understand it, and ask theright kinds of questions in order to find the cost. Once found,use of the cost data as a management tool then becomes the mainthrust. The handbook is not meant to stand alone. Rather, thevisibility into Cost of Quality that can be gained by using theprinciples provided in the handbook must be related to othercontractual requirements, especially MIL-Q-9858A, MIL-STD-1535A, 0and MIL-STD-1520C, to maximize the total effectiveness of whatthe government and contractor can and must do to ensure that thehighest quality products reach the users in the field.
Avdih 'iiy CodiS
Dist

TABLE OF CONTENTS
Pacte
Preface
Introduction/Overview ii
Executive Summary iii
Chapter
1 Basic Explanation of Cost of Quality 1-1
2 Requirements 2-1
3 Methodologies, General 3-1
4 Functional Sections 4-1
4-1 Program Management 4-1-1
4-2 Engineering 4-2-1
4-3 Manufacturing 4-3-1
4-4 Finance 4-4-1
4-5 Quality Assurance 4-5-1
4-6 Subcontractor Management 4-6-1
4-7 Logistics 4-7-1
4-8 Contracts 4-8-1
5 Implementation 5-1
6 Glossary of Terms 6-1
7 Bibliography 7-1
Appendices
A. Additional Lists of COQ Items
B. Survey Results
C. Proposal Review Checklist
D. Sample Award Fee Evaluation Criteria

LIST OF ILLUSTRATIONS
ii-1 Acquisition Life Cycle Technical Activity . . .ii-5
iii-1 Inspection vs. Prevention Focused Quality . . .iii-2
1-1 Find and Fix Focused Cost of Quality ........ 1-6
1-2 Prevention-Focused Cost of Quality .......... .1-7
1-3 Tennant Company Cost of Quality .... ........ 1-8
1-4 Cost of Quality Category Relationship ....... .1-9
1-5 Company vs. Function Cost of Quality ......... 1-10
1-6 Functional Contributions to Prevention Costs. .1-11
1-7 Functional Contributions to Failure Costs . . .1-12
1-8 Example Company Structure ... ........... .. 1-15
1-9 Pulling Up Cost of Quality ... ........... .. 1-16
1-10 Cost of Zero Quality Effort . .. ........ 1-17
1-11 Cost of 100% Find and Fix ... ........... .. 1-19
1-12 Cost of Prevention Focused Program .......... .1-21
1-13 Cost of Quality Category Relationship ....... .1-25
1-14 Rework, Engineering Drawing Example ........ .1-26
1-15 Cost of Quality/Indicator Trends ........... .1-30
2-1 Legal Basis for Cost of Quality .... ........ 2-2
3-1 Chart of Accounts Example ... ........... .. 3-6
3-2 Sources of Data ....... ................ .3-18
3-3 Analysis Methodology. . . ............ 3-29
3-4 Total Cost of Quality .... ............. .. 3-31
5-1 Integration of WBS and Organization Structure .5-1

LIST O7 TABLES
TABLEPAGE
1-1 Detailed Quality Cost Description Summary . . .1-3
1-2 Base Factors ....... .................. .1-14
1-3 Analysis Questions ..... ............... .1-23
1-4 Indicator Trend Relationships ......... 1-28
3-1 Functional Cost of Quality by Program Phase . .3-11
4-1-1 Program Management Cost of Quality. . . . . .4-1-4
4-2-1 Engineering Cost of Quality . .. .. .. . .. .4-2-4
4-3-1 Manufacturing Cost of Quality .. ......... .. 4-3-5
4-4-1 Financial Management Cost of Quality. . . . .4-4-4
4-5-1 Quality Assurance Cost of Quality ......... .. 4-5-3. 4-6-1 Subcontractors Cost of Quality ............ .4-6-5
4-7-1 Logistics Cost of Quality ... ........... .. 4-7-4
4-8-1 Contracts Cost of Quality ........... 4-8-3
0

JINTRODUCTION/OVERVIEWPURPOSE AND USE OF THE HANDBOOK
Thef purpose of the handbook is to function as an aid to theunderstanding of the concept of cost of quality and its value as amanagement tool. Individuals who are not a part of a qualityassurance organization must recognize that there are activities whichgo on in their area of interest that are indeed part of the totalcost of quality for an organization. Most importantly, the use ofthe cost of quality information as n aid in identifying problemareas and eliminating problem root causes across all functional areas-is the real purpose of capturing thelcost of quality in the firstplace. The handbook will enable all functional personnel tounderstand cost of quality, find the 0ost in their area, and judgeits use as an effective tool for Xdentifying and eliminatingproblems. /
Proper use of this handbook requires ihat Chapters one through threebe studied in their entirety so /hat the user can gain a clearundeistanding of the basic principls underlying the concept of Costof Quality. Specifically, the use 'will gain an understanding of thebenefits of having visibility iWto the Cost of Quality and how costof quality should be used ap( a management tool. Of particularimportance is the recognition,,hat cost of quality is one tool, to beintegrated with other toolsosuch as multidisciplined problem solving
* under MiL-STD-1520C, for -the purpose of reducing and/or eliminatingwhen possible, the generwei on of nonconforming material.
After absorbing the basic information in Chapters one to three, userscan refer to tie section in Chapter four which applies to theirparticular a of expertise. Here the user will find more specificdetail o ow to determine cost of quality in that partiuclar area ofintere . The user will be shown how to evaluate the cost, and howto " dge whether or not the contractor is effectively using cost of
'lity as an integral and effective tool for finding and eliminatingauses of defective output. The term output is used here because the
"product" supplied may be an engineering drawing, a purchase order, acontract modification, or an electronic circuit card.
KThis handbook is designed to be used by people involved with proposalevaluation, fact finding, should cost, quality audits, contractoroperation reviews, source selection, pre-award surveys, or any revieweffort in which visibility into what the government is paying forquality would be useful. All disciplines are involved in these typesof reviews and all disciplines have a share in the cost of quality.The quality representative involved in a particular review would bethe focal point for overall cost of quality evaluation results. Buteach of the other team members must find the cost of quality in theirspecific area, evaluate the cost, and make input to the qualityrepresentative for consolidation. The handbook is designed to enable. each participant team member to accomplish that task in support ofthe overall cost of quality effort.
i-

As mentioned, the handbook is divided into two major sections. Thefirst section (Chapters one through three) provides the tutorialneeded to enable users to fully understand the concept of the cost ofquality, what it means, how to identify it, and how it is to be usedin analysis. The second section (Chapters four and five) providesspecific help by area of expertise to enable users to apply theprinciples to their particular area of interest. Chapter five alsoprovides insight into methods that can be used to effectivelyimplement and use a cost of quality program.
THE TRUE NATURE OF OUALITY
Before discussing the concept of cost of quality, it is necessary toclearly explain the true nature of quality. The traditional view ofquality is focused on the following:
- Quality is the responsibility of the quality department- Quality relates only to the goodness of the final product,
i.e., the products finish, its dimensions, its power output,its operating temperature, etc.
- Manufacturing is the biggest contributor to lack of quality- Improving Quality will cost more money- Quality is defined by the manufacturer.
Unfortunately, much of what many people believe about quality isbased on these erroneous ideas.
Experts in the quality field today generally recognize that ratherthan the traditional ideas the real essence of quality is that:
Everyone in the organization contributes to the ultimatequality of the organization's output. Everyone must beresponsible for their contribution to that quality.
Quality relates to everything that contributes to the finaloutput. The sales person's capturing of the customer'srequirements, the designer's translation of thoserequirements into a design that meets the requirements, thepurchasing agent who buys the correct material/parts, theplanner who translates the design into production workinstructions, the process operator who follows theinstructions, the inspector/tester who audits all the above"processes", the packing and crating people who prep theproduct for final shipment - every one of these people canand does contribute to the ultimate quality of theorganization's *output, and to the cost of achieving thatquality.
Anyone described above can, and often does, contribute to alack of quality. Without going through the entire list, itshould be obvious that failing to properly perform any oneor more of the functions described will degrade the ability Vof the organization to effectively and efficiently generatequality output. Note the emphasis on effectively andefficiently.
ii-2

When one function in the organization has to "shore up" thelack of quality in one of its sister functions, theirremedial actions drive up costs. Further, the potential foractual degradation of the quality of the final product isgreatly increased because errors are basically beingtolerated and will ultimately escape the system and effectthe product.
Eliminating errors throughout the entire organization.improves quality. Work done to find and correct theseerrors is eliminated. Costs go down. Non-value addedeffort can now be channeled into value generating activity.Productivity goes up.
The customer defines quality. The customer establishes therequirements. Any product or output that meets thecustomers requirements and expectations will be judged bythat customer as being a quality product. The producercannot decide what is a quality product and say that thecustomer should recognize it as such. If that product doesnot meet the customer's requirements and expectations, nomatter how fancy the product is or how high and fast it willgo, it is not a quality product. Here, it is necessary totalk about internal as well as external customers. Everyonein the organization has customers within that organization,or internal customers. Each of these internal customersdefines the quality of the "products" they receive fromother functions. For example, manufacturing needs current,producible, and accurate blueprints from designengineering. Purchasing needs timely material requirementsfrom manufacturing, and product specifications fromengineering, and quality assurance. Purchasing is both a"customer of" these functions, as well as having them "ascustomers" of the results of the purchasing effort.
Recognizing that everyone in every function has a role in determiningquality, and that finding and eliminating causes of problems willreduce costs and improve output quality is the essence of quality andthe basis for using cost of quality as an effective management tool.
The fact that there are indeed "costs of quality" is driven by therequirement that some action is needed to ensure that the variousweapon systems and components bought by the Air Force do meet thedefined requirement. Some cost of quality must exist. The natureand size of that cost will be driven by a variety of conditions.
- Program phase- Type of technology/product- Governmental contractual requirements- The acquisition strategy- How the contractor is organized
10 - How the contractor accounts
ii-3

The activities that are underway under various functional areas areshown, as an example, in figure ii-i (note that not all functions areshown). As the reader moves from Chapters one through three and theparticular functional section in Chapter four in which he or she isinterested, they will find that activities highlighted, andgovernmental requirements presented, cover the various phases of theacquisition process (see Table 3-1). What the individual evaluatormust recognize is that a degree of Judament must be applied whenevaluating cost of quality. That judgment must be based first on thefunctional expertise and experience of the evaluator and, second, ona thorough review of the nature of the effort being evaluated withregard to phase, product, and the above listed conditions.
The goal is not to reduce cost of quality per se. The goal is to usecost of quality to understand where the costs are, by function and bycategory, and to understand what those costs reveal about both thecontractor's approach to quality and the effectiveness of thatapproach. Proper management of the quality effort to achieve a"prevention" posture will provide the best return to the governmenton money spent, and will result in an eventual lowering of total costof quality.
S
ii-4

ACQUISITION LIFE CYCLE TECHNICAL ACTIVITIES
Jaow Owinamm -....
oa ew e '. - n 'w 1ml - s9-- AWf a.,.-.n.- w
I ................. .. "-
3 1 MISa.m 1
- L J-m -
.--- -- 5- --"---
IIII
M& LAnMM Ilaa
*M - eM . ... ensue - -V
I sat M 't
.5 - 'in-
l Ib~6.0. I
SV..St9 I. I I.J
s- Ia i I-aw SL~
*V.SM ~ ~ ~ ~ ~ Fiur it * i-uue.hinu
MAUAGQN~ 55si- -

EXECUTIVE SUMMARY
The Cost of Quality Evaluation Methodologies Handbook was devel-oped for two purposes. First, the handbook provides a detailedtutorial on the meaning and value of the cost of quality concept.Second, the handbook provides specific guidance, by functionalarea, on how to find the cost of quality, how to judge its mean-ing, and how to use it in combination with other performanceindicators to judge the effectiveness and efficiency of the con-tractor's quality program.
Traditionally, quality has been seen as the responsibility of theQuality and Manufacturing departments. Quality has been "inspec-ted in". Most people believed that it costs more money to im-prove quality. Nonconformances were accepted as inevitable, andwere handled through scrap, rework, repair, or use as-is.
The traditional view has been wrong. It is now generally recog-nized in the quality profession, and more importantly, well be-yond, that quality is everyone!s responsibility. Every functioncontributes to the organization's ability to create quality out-put. For example, customer requirements must be accurately cap-tured and communicated. Engineering drawings must be correct.Purchase orders must be complete and accurate. Work instructions.must be clear and performable. Tests must be set up properly andthe right data collected and correctly interpreted. Inspectionsmust be focused on the important characteristics and attributes.Shipping and handling must protect the product and get it to theright customer. Failure in any one = more of these functionswill adversely affect arality. The costs associated with ensur-ing the quality of any functional area "output" is the essence ofthe cost of quality concept. It is present in everybody's func-tional area.
0 The traditional approach to cost of quality has focusedon scrap, rework and repair, which represents FAILURE.True cost of quality consists of four cost categories.
- Appraisal costs - looking for nonconformances
- Failure costs - disposing of nonconformances
Internal - before final delivery
External - after final delivery
- Prevention - avoiding nonconformances
0
il-1

o These cost categories are present for every function ina company, not just for the quality and manufacturingfunctions.
The cost of quality is not an end, but a means to an end. It
provides visibility for management:
o into the total cost of the quality effort.
o into problems reflected by the relationships betweeneach category, relative to each other, and to thetotal.
o into lower organizational level contributions to thequality effort.
o into the effectiveness of corrective actions.
The relationship between each cost of quality category is impor-tant, and can tell a great deal about whether a given qualityprogram is "inspection focused" or "prevention focused". Figureiii-1 illustrates the point.
INSPECTION FOCUSED PREVENTION FOCUSED
25X /APPRAISALAPPRAISAL PREVENTION 40Z48Z 45X
\FAILURE 2052
7INTERNALPREVENTION EXTERNAL FAILURE - 7X
?X FAILURE - aZ
Figure iii-l
Unless management analyzes the true composition of the cost ofquality relative to what is being contributed to each category byvarious organizational levels, and takes action to eliminateproblems highlighted by cost of quality figures, having the dataserves no worthwhile purpose.
The authority for the government to require defense contractorsto collect and use cost of quality data stems from: the direc-tion and instructions contained in the Federal Acquisition Regu-lation; Department of Defense Directives and Instruction; variousmilitary specifications and standards; and more specifically MIL-Q-9858A, paragraph 3.6, "Cost of Quality". Contractors are spec-
iii-2

ifically required to collect cost on "prevention and correction".Correction is failure cost, as it deals with disposition; andfits the failure cost definitions.
OCost of Quality data will normally be found as both direct andindirect costs. Direct costs can usually be found in existingreports, etc. Indirect costs require more effort to develop anaccurate estimate. A methodology has been provided in the hand-book that enables an analyst to determine the actual work contentof a given function. Based on the average time required to per-form each task, and the frequency of the task, an accurate esti-mate of the total hours can be made. From that estimate, thosetasks that meet the cost of quality category definitions can besegregated, and cost of quality estimated for that function.Combining the functional cost of quality data provides a totalcost of quality figure.
Now that the cost of quality is available, by functional area andas a total, action can be taken to use the data as a managementtool. Areas weak on prevention can be addressed. Improvementprogress can be tracked.
People in every functional area must be able to find and use costof quality information. The handbook provides guidance in thisregard for each of the following functions:
Program ManagementEngineeringManufacturingFinanceQuality AssuranceSubcontractor ManagementLogisticsContracts
Each functional section provides tests of typical functionalactivities, and break out costs of quality for each activity.Guidance is also provided on which category of cost of quality isinvolved, what contractual requirement may drive that cost, andwhat are typical measures of that cost in terms of functionalperformance (e.g., drawing errors/l,000 drawings; percentage ofpurchase orders with errors; average errors per work instruction,etc.).
Once cost of quality data is available, its meaning can be judgedin combination with other cost performance indicators. For exam-ple, under C/SCSC, variance from budget can be looked at forevidence that cost of quality factors are contributing to thevariance. Likewise, under MIL-STD-1567A, Work Measurement, vari-ance analysis can now include judgments about what role cost ofquality is playing in labor performance.
Cost of quality provides a valuable tool for both government andindustry. Cost of quality, when properly accounted for in allO functional areas, shows what it really costs to get the product
iii-3

to the field. If that product is not performing satisfactorily,then judgments can be made about the effectiveness and efficiencyof those resources being expended in the quality effort. Actioncan be taken and results tracked to correct the situation.
0
iii-4

BASIC EXPLANATION OF COST OF QUALITY
COST OF OUALITY
What is the cost of quality? The traditional approach to thisquestion has seen cost of quality as the cost of failure, orspoilage, or the effort required to bring material that does notconform to requirements back to a state where the material is onceagain acceptable for use. The focus has been on scrap, rework, andrepair. The data examined has encompassed the cost of the material,and the man hours required for disposition of material bymanufacturing. Often the data is expressed as a percentage of directlabor, or in the case of the material, a percentage of total workcenter output value.
The approach described above is one focused purely on FAILURE. Suchan approach falls short of identifying the true cost of quality forthe organization, and more importantly, fails to support the need formultidisciplined evaluation of problems to find the true root causesof errors and to eliminate those causes. Failure costs aredefinitely a part of the cost of quality, but only one part.
The cost of quality is:
"the cost of all efforts expended tofind nonconforming output, react toactual failures, both internally andexternally, and to prevent failures fromhappening in the first place".
"costs expended in the effort to findnon-conforming output are calledapRraisal costs".
"the costs of actual failures themselvesand their correction are called internalfailure and external failures costs".
"the costs of efforts designed to stopproblems or failures from occurring inthe first place are called preventioncosts".
We will begin by looking at definitions of each of the primarycategories of cost of quality.
ADPraisal Costs
These are costs that anyone expends in an effort to judge theacceptability of output and to identify any instance ofnon-conformance. Key terms here are evaluation activity,measure, or audit. The emphasis is on compliance with qualitystandards and/or performance requirements for any "output"(purchase order, engineering drawing, circuit card, actuator,etc.).
1-1
Failure Costs
These are costs that are associated with activity required toevgaluj and either correct or replace output that fails to meetestablished quality standards and/or performance requirements.The emphasis is on the decision regarding what to do and then theresultant action. Key terms are determine, disposition, rework,scraR, r ir, reaccomplish, or correct.
There are two types of failure costs:
Internal Failure
These are incurred Rrior to final delivery of the specificoutput to the customer (internal or external customer).
External Failure
These are incurred after final delivery of the specificoutput to the customer (internal or external customer).
Prevention Costs
These are costs incurred through efforts to avoid nonconformingoutput from occurring in the first place. These include actionsthat occur prior to or during all phases of business activity.The key idea here is that these actions are aimed at ensuringactivities will be done correctly before the activities actuallytake place. Thus, errors are prevented from happening in thefirst place.
Understanding the general concept of each category is important.First, knowing what costs fall under each category requires a clearunderstanding of what each category means. Second, the level of costin each category can tell you a great deal about what kind ofapproach an organization has towards quality in general. Third, therelative size of each category, when compared to each other as wellas to the total cost of quality, is again an indicator of possiblecourses of action needed to address quality issues in thatorganization.
Table 1-1 provides examples of the types of activities that can befound under each of the four main categories. Table 1-1 was takendirectly from the American Society for Quality Control publication,"Principles of Quality Costs".
1-2

Table 1-1 provides examples of the types of activities that canbe found under each of the four main categories. Table 1-1 wastaken directly from the American Society for Quality Controlpublication, "Principles of Quality Costs".
DLTAZL" QLA.LIY COST DESCUWTION SLNhEMARY
1.0 Preav~4T1n C0
a. ' a, -,a~urn~a APP.ALS&L COSTS*I3 MoitMe Aftt~u L.3 PWu~bnu APPUM COW
1.3.a CVM w.w FWGNPa SmWWRYCi.. L.3. Phemni w tmm" Iaaamm wd TomnI-3.2 Conwoano Ronm 12.1.2 bMumum SmawwI. m~ruu Duq -- lm 1.3 Oawdkmr dt Suvowu Ftadm.I Deag iuahu Pmgma " 5a2.1.4. 5mm Iftw.... We Comj , ft.
I.. Ommap 3.00M MAttva 2 Or..... IMW.MMMOI or Sa-sm Appfaaa1.. D m~ Fr& O oaaaiasMM TGm COW3.2. LSGII emg Quaufab. 2.2.1 PIvaus Ovua Irm',... Tea. Aadu3.2.1 F.M Tnal, Z22.1.1 OhKAw LOW33 FW- Iann I.2. FNO Or 5Slr% QiaaMa Aedas
3 .3.1 Sappam ftu." 2.2. 1.. buppaM. LI T40 Mamnaj13.2 SGWph" mq2.2.2 So-Up Wopman - Tou1.3.3 Piwmu 0mm Tack o 0.. Ru. I..2.3 Spraw Tomn iMarnamugj3.3. Smpp. Qiay 1-1a 224 PFMu COM. MUmANMwML.4 Onn 3Mu.Ub or SaY..) 2.s Labern..' SeppoI *4.*3 OWUiMM fW A a miiuue 2.16 %6aiuftm IesiPnin1.4.2 Ommm Oa-uY PMmap 2...3qumin AG-a1.4.13 Couip idOrIGO duean Qaali 1.2..2 M.,wmem IqaP... LAPIAu
MaiNimum. ad Co" 14NPm. =..4 Mafam " CWalau Lawe
1. 4.3 Op-um Sue pp an I ~ a 2.2.7 Fh-mLW m Ljonmmm s~d Coammaut .4.,4 Opiu QuaMI &*A=m :. LaoWa AWN"a COM3.4.3 OPKIuM PlC hm Ca"i 2..1 F.M Pa W i m Evat345 QUInaal A~MWWMawu 231. Spacual Pnm va ,bhuain13.1 ~AdAmmawt Salana L3.3 3.,iuami drw&i So"k im Spam, Pun3.1.2 Amuam Ean 2.4 Ia,.. a( Tag iae Imwm 0..3.3.3 Quma ft" Pm w m 2.3 M"NA"caius "Uary EwvauW
13.4. QMWy ft,*'wuam RuaquGr
1.5.7 QWf AedaM
3.0 DrrD.%AL FAftLIM COSTS 4a mfl.6AL FALRE COSTS3.1 PumUSarnM Doup FNal Cm (.Ioi" 4.1 Couple 3MMaaaauCamM r Ulm Sa't,
1. 1.1 Dump Conmu-8 ACO '.2 PiAM oos3.1.2 Pa-.~nma D o up Caag 4.3. IRUnhcam3 .32 Samo D wn D Ont awn 4.3. Rmiik CM3.3. ,4 PiMiag. 11mm. Cam .4 w&kniy Cla3.2 Paaua h~aws C. '4 L"a"e COW3.*2.31 PWaaaad Mmaie fta DMMUMN CaM 46 Ptfaihi3.2.2 Prbnmed mawna Psoaafgn Cam 47 CONmU.,U Osajull3.2:.3 Supo CoUYSC-n Amme A I LAW SAWS3.:.& Ru., of SeoP.. Ram 4.9 Oftf Eawrfal Pa,). Cm.s3.:.S UncowNWl.eua LOsa3.3 OpanI prem or Stevsl Reua Cm.3.3.1 Maw) Ru'. wa Cammm Aim Cam3.3.3. Omwo. coma13.1.2 Trwuunor w slm Aaumu Cam
3.3.3 Iamomm Sum, Com3.3.1.4 Opumam Comrwmsw MAck3.3.2 Opium m am Ppai Cm.3.3.2"3 leAnO3.3.2 .. VAmw3.3.3 PAmamw Cm.3.3.4 Ews Opmrnom3.3.3 Stam COmW IOMM~3.3.6 Dwyos EAd Nm.w orStw..3.1.7 Imal" NsOT Lo Loam3.4 Ol., Inamal PsalM CM.
Tabl~e 1-1
* Reprinted by permission, American Society for Quality Control,"Principles of Quality Costs", 1986
1-3

Appendix A contains other lists taken from various studies and 0publications. As mentioned earlier, understanding what costs fallunder each category requires a clear understanding of what eachcategory means. Careful study of the definitions given above and theinformation in table 1-1 and Appendix A should give the reader a goodgrasp of the basics. Note also that more detail is provided in theindividual functional sections found in Chapter four of the handbook.
One word of caution: It is easy to become overly concerned aboutvery precise placement of costs in the appropriate category. While acertain degree of accuracy is certainly important to avoiding theerroneous inflation or reduction of a given category, experience hasshown that the number of controversial costs is usually small andthat the danger of skewing the data is small. The best rule tofollow is to go back to the basic definitions of the categories.
Let's look at two examples. One might conclude that inspecting aproblem area with the purpose of preventing defects from getting outis an example of prevention costs. Go back to the definitions.Prevention costs are incurred through efforts to avoid non-conformingoutput from occurring in the first place. The inspection here isclearly finding defects after they have occurred. These inspectioncosts are appraisal, or costs incurred in an effort to judge theacceptability of output and to identify any instance ofnon-conformance. Remember the key terms: evaluate, measure, oraudit.
Another example could be an organization which has found that a groupof operators has been turning out excessive amounts of nonconformingoutput. The problem turned out to be a lack of clear understandingof requirements, so training was initiated. Isn't the cost oftraining part of the failure costs, since the training is thecorrective step resulting from the defects? Again, refer back to thedefinitions. Failure costs are those associated with activityrequired to evaluate and correct or replace output that fails to meetestablished quality standards and/or performance requirements.Remember the key terms: determine, disposition, rework, scrap,repair, reaccomplish, or correct. Once the defective output has beendispositioned, attention is turned to determining why the defectsoccurred in the first place and how to prevent them from recurring.The training is designed to do that and therefore it is a preventioncost, in line with the definition for the prevention category.
BENEFITS OF COST OF OUALITY
Now that the cost of quality categories are known and the variouscosts that are associated with each category are recognized, thevalue of having these costs can be discussed. A very important pointmust be made. Remember: the cost of aualitv is not an end initself, but a means to an end. Cost of quality represents one ofmany tools available for use in improving the overall quality of theproducts that the Department of Defense buys for use by defensepersonnel. As a beneficial tool, cost of quality:
1-4

1. provides visibility into the total cost of ensuringrequirements are being met.
2. points to problems in the quality program that are reflectedin cost of quality category imbalances, or excessive costsin the non-value added areas of quality activity.
3. acts as a diagnostic tool at lower organizational levels inidentifying problem areas.
4. allows judgements about the real thrust of a given qualityeffort from the perspective of "inspecting quality in"versus "designing and building quality in".
5. allows management to judge the effectiveness of correctiveactions taken to eliminate root causes and improve quality.
Once cost of quality has provided the above benefits, other qualitymanagement tools can then be applied to work problems and developsolutions. A contractor cannot be expected to successfully eliminatecauses for defective material unless he has good visibility intowhere his problems are. Assuming he is doing what is required underother contractural requirements, such as MIL-Q-9858A andMIL-STD-1520, his overall effort will now be significantly enhanceddue to the benefits of having cost of quality data available. Let'sexamine the benefits and see how each is realized.
Benefit 1: Provides visibility into the total cost of ensuringrecuirements are being met. Experts in the field of quality todayagree that the total cost of quality, expressed as a percentage ofsales, averages between 15% and 30% for American Companies. If thereader is familiar at all with the traditional measures of scrap,rework, and repair, these numbers totaled as a percent of sales, aretypically between 5 and 10%. Why the difference? Because scrap,rework, and repair only represent FAILURE COSTS, and morespecifically, INTERNAL FAILURE COSTS. Appraisal and preventioncosts, and external failure costs must be added in for a true pictureof the cost of quality. Seeing these other cost categories is vitalbecause:
appraisal costs show what it costs to find the items thatrequire scrap, rework, repair, or use as-is actions.
prevention costs show what level of effort is being expendedto avoid defective output, that is scrap, rework, or repairactions in the first place.
external failure costs show what costs are incurred afterthe output is in the hands of the customer and it fails tomeet customer requirements.
O It should be obvious that seeing all the cost categories, in allfunctional areas, is the only way to know the true total cost of thequality effort.
1-5

Benefits 2: Points to problems in the quality proQram that arereflected in cost of guality cateaory imbalances. or excessive costsin the non-value added areas of cuality. Now that the total cost isvisible, and particularly in view of why each category is importantas described above, attention can be turned to the relativeimportance of each category, both to the total and to each other.Look at figure 1-1.
PREENTION
7X
figure 1-1
Note that fully half the cost is incurred just finding defectiveoutput (appraisal). Just short of half is incurred in dispositioningthe defects after discovery (failure). Only 7% is incurred inefforts to prevent defects from occurring in the first place. Whatdoes all this mean?
If this is a MIL-Q-9858A contractor, compliance withparagraph 3.6, which calls for "prevention and correction ofdefects" is clearly heavy on the correction side.
Failure costs are high as a percentage of the total becausevery little is being done to prevent defects from occurring.
If this is a MIL-STD-1520C contractor, multidisciplineaction to determine and eliminate root causes for defects isnot being effectively implemented.
For the Air Force analyst, a logical next step with this contractorwould be to look at data on repeat nonconformances and overall defectlevel trends. Chances are excellent that the data would show:
- high incidence of repeat nonconformances.
fairly stable, or flat trends, showing no real improvementover time.
1-6

The importance of cost of quality data should now be clearlyapparent, particularly as an aid to point one toward otherindications of quality activity in order to make judgements aboutwhether the government is getting what is is paying for from thecontractor's quality system. The contractor is being paid to findand correct defects and to eliminate the causes, so as to prevent thedefects from recurring in the future. Further, prevention should beactive 3 f__ TPIr , to prevent many potential defects from everoccurring in the first place. A contractor operating with relativecosts of quality categories as shown in figure 1-1 will, in alllikelihood, have a total cost of quality in the 15 to 35% of salesrange.
Now look at Figure 1-2.
EXTERNAL FAILURE - 72
FAILURE - 0%
Figure 1-2
Note that almost fully half of the total cost is incurred inpreventing defects from occurring in the first place or fromreoccurring. Also note that as a percentage of the total, appraisalcosts is 40%, not far from the percentage in figure 1-1. Does thismean the contractor in figure 1-2 is still inspecting in "quality"?The answer is po, for the following reasons:
- with the heavy emphasis on prevention (assuuing it is aneffective effort) defects are being avoided in the firstplace, and those that do occur are not repeating in thefuture.
- the appraisal effort is necessary to ensure that theprevention effort is indeed working as intended.
0
1-7

the low failure cost percentages would tend to indicate theprevention program is effective.
with this type of program, looking at data on repeat defectsand defect trends oer time will likely show very lowrepeats and excellent downward trends.
Although appraisal is at 40% of the total, a contractor with relativecosts of quality as shown in figure 1-2 will usually have a totalcost of quality in the 5 to 10% of sales range. In this case, theactual appraisal effort, and its associated cost, is much smallercompared to the effort in figure 1-1,. because the total cost ofquality is lower.
As a further example of the above discussion dealing with figures 1-1and 1-2, real data from The Tennant Company, a company that hassuccessfully implemented a quality program oriented toward preventingdefects in the first place, and preventing reoccurrence of defectsthat do occur, is presented in figure 1-3.
COST OF QUALITY198017% OF SALES
1986 THROUGH MAYAPRIL7-9% OFSM17%I7 OF SALES ALR
FMFAILUREPPR T5 42%FIUE35% - PREElN0
50 41%
MtVMON15%
figure 1-3
Reprinted by permission, Tennant Company, "Quest for Quality", 1987
Notice that as effort in prevention grew as a percentage of the totalcost of quality, the total cost fell dramatically. Note also thatappraisal as a percentage of the total fell. But this companyexpects appraisal to stabilize at about the original percentage ofthe total. This is because the quality organization in this companyis now performing essentially an audit function to ensure everyoneelse's quality efforts are effective. The emphasis on everybody isimportant, and ties very well to the concepts of MIL-STD-1520C. Amultidisciplined approach to analyzing the root causes of qualityproblems recognizes that many functions can and often do contributeto generation of defective output. Unless every potentialcontributor takes an objective look at where they could have donesomething to cause the defect, real identification and elimination ofroot causes cannot take place.
1-8

Why does the emphasis on prevention result in lower overall cost ofquality and better quality in the end product?
- preventing nonconformances occurs through good analysis ofall "processes" and refinement of those processes so theyproduce little, if any, defective output.
- once confidence is gained in "process" capability, lessappraisal effort is needed to continue to verify processintegrity.
- less nonconforming output is generated that requiresdisposition actions.
- less failures occur in the field due to nonconformingproducts.
As an illustration of what happens look at figure 1-4.
0
S~ figure 1-4
OUALIT UN MNOWN I0 SNIOIMI GOLNO SPSCiIPCATIONS Of Sf|CWICAtSONI THA" OUAlIT? CONTIOLLIDNO MIASUREMENI 0O NOT TOTALLT *I|LICt to MAGRIW Not0
CUSTOMS' NoIS ASNMUM AT LOW9ST COST110*10 aO Pncost
CONTROL Of OUALITY
Reprinted by permission, American Society for Quality Control,"Quality Costs: Ideas and Applications", 1984
Notice that the 100% enforcement point reflects high appraisal andfailure and overall total cost of quality, with low prevention. Thegoal is to optimize total cost of quality through that increase inprevention needed to eliminate defective output, such that failureand appraisal costs are minimized. Notice that external failure islow at the goal point,-thus providing the customer the best outputpossible.
Benefit : Acts as a diagnostic tool at lower organizational levels. in identifvina problems areas. Looking back at table 1-1 we arereminded of the large variety of individual cost elements that go into each of the cost of quality categories. For example, underprevention costs in table 1-1 we find:
1-9

Operations (Manufacturing or Service)
- Operations Process Validation
- Operation Quality Planning
- Design and Development of Quality Measurement andControl Equipment
- Operation Support Quality Planning
- Operator Quality Education
- Operator SPC/Process Control
Consider a final assembly area for a complex mechanical product, suchas a jet engine. The cost of quality for the area is again made upof the categories of prevention, appraisal, and internal and externalfailure. The costs at this level contribute to the overall totalsfor the company. Look now at figure 1-5.
COQ - TOTAL COMPANY COQ - FINAL ASSEMBLY
EXTERNALFAILURE
A P A S L25X APPRAISAL
45XZ
INTERNAL /
FAILURE
20X
-INTERNAL
EXTERNAL FAILURE - 7E -PRVENTION
FAILURE - 8X 7X
Figure 1-5
It is entirely possible for a lower level unit within the company tohave cost of quality relationships that are significantly differentfrom those for the total company, as shown in figure 1-5. Themanager in final assembly should be concerned. It is obvious that ahard look is needed at what is being done in the area of prevention.Action should include looking at the cost elements listed above fromtable 1-1 for Operations, since final assembly is essentially the
1-10

O operation of putting the product together. The types of failuresbeing found by the appraisal effort should also be examined todetermine those that could be prevented by proper emphasis on theindividual prevention cost elements, and more specifically, theprevention activity that generates those cost elements. Validquestions to ask are:
- What are the failures we are experiencing?
- Which ones are contributing most to failure costs?
- Why are they occurring?
- What prevention effort is underway to address these highcontributors?
- Is current prevention failing?
- What are all the possible caulses for these highcontributors?
- What prevention action can be put in place to eliminatethese failures now and in the future?
Once these actions are taken the manager can then move to benefit #5,having visibility into cost of quality, discussed below.. A word here about use of cost of quality data by top management isappropriate. Refer again to figure 1-5. If top management looksonly at the total cost of quality and the relationship between thecategories they are not going far enough. In the above example,looking at figure 1-5, Cost of Quality - Total Company, at the makeup of the 45% prevention relative to each major function'scontribution may reveal the following (figure 1-6).
FUNCTIONAL CONTRIBUTIONS TO PREYENTION COSTSZ 1 5 ..
10-
T I ~ I II i i IFUNCTIONM ARKET ING IPROD. CONT. VENDOR 0 A ITEST CELL WELDING I
DESIGN ENG PURCHASING FINAL MACHINING PAINTINGASSEMBLY
0FIUURE 1-6
1-11

Alt.hough prevention is 45% of the total cost of quality, finalassembly is low relative to the percentage of contribution of the Wother functions. The next question to ask is, "What are the relativecontributions to failure costs (figure 1-7)?"
FUNCTIONAL CONTRIBUTION TO FAILURE COSTS
Z 30-
25-
20-
10-
I IFUNCTION
MARKETING jPROD. CONT. VENDOR QA TEST CELL WELDING I
DESIGN ENG. PURCHASING FINAL MACHINING PAINTINGASSEMBLY
FIGURE 1-7
It is obvious that 30% of the total company failure costs come out offinal assembly. In view of the lower effort in prevention and thehigh level of failure contribution, top level management should belooking to final assembly management to analyze the situation, takeaction, and report back.
There are a variety of circumstances that can and do dictate therelative relationships among functional elements and theircontributions to cost of quality. The example is intended to makethe point that management at all levels must use cost of quality dataas a tool to help identify and solve problems.
Benefit 4: Allows iudaements about the real thrust of a aiven effortto improve or manaqe quality from the perspective of "inspectingauality in" versus "designing and building quality in". As discussedunder benefit 1, the relative size of prevention and failure costs toeach other and to total cost of quality can be used to determine theapproach to quality being taken by a given company. When failure isvery high and prevention low, then appraisal effort is mostly to finddefective output, which is then dispositioned. On the other hand,when prevention is high and failure is low, appraisal is mostly toverify that prevention is indeed working. Appraisal of actual outputcan be reduced and the focus changed to audit of processes to ensureprocess integrity is maintained so that nonconforming output does notoccur. (&l processes, not only manufacturing processes.)
1-12

. Dneit 5: Allows management to ludge the effectiveness ofcorrective actions taken to eliminate root causes and improvegrualit. As discussed under benefit 3, once a manager has recognizedthat a problem exists by evaluating his cost of quality information,he can then monitor the effectiveness of any action taken to correctthe situation by watching how his cost of quality reacts. The costelements that go into his cost of quality should also be checked tobe sure specific actions are taken (costs here increase) and thatfailures are being eliminated as a result of these specific actions(costs here decrease).
BASES USED IN COST OF OUALITY
Another important area to consider in a discussion of the concept ofthe cost of quality is the subject of the bases used for calculatingcost of quality and for making judgements about what the costs mean.Any base chosen will vary in absolute terms over time as the level ofbusiness activity changes. Experience has shown that no matter whatthe base, expressing cost of quality as a percentage of that base hasproven to be the most useful approach. Keep in mind that cost ofquality is measured for two primary reasons. First, cost of qualityhelps to identify areas which need attention for makingimprovements. Second, once action to improve is underway, cost ofquality provides a means of measuring the actual improvementachieved.. In deciding the bases to be used, a close working relationship isneeded between the accounting, manufacturing, and qualitydepartments. An easy way to start is for an organization to look atwhat bases are currently measured. One advantage of using thisapproach is that it requires no changes in the current accountingsystem. A second advantage is that using existing bases keeps theinformation on a footing that is already well established andunderstood within the company. Management often already reacts tothese bases, so expressing cost of quality in these terms can make animpact on acceptance of the cost of quality numbers and the use ofthose numbers as management tool.
Bases that are frequently used include:
- total production costs
- net sales
- total purchased material costs
- total work center output
- direct labor hours
- productive direct labor
- shop - cost input
- contributed value
1-I3

- equivalent units of productive output 0
When a company selects the bases to be used, several importantfactors must be considered:
Are the bases sensitive to increases and decreases inproduction schedules?
If methods improvements through equipment modernization areachieved, will the bases be affected by lower direct costs?
- Are they affected by normal fluctuations in sales?
Are they sensitive to fluctuations in the price ofmaterials?
The matrix provided in Table 1-2 shows the applicability of thesefactors to each of the bases previously listed:
BASE FACICRS
Sensitive Moderni-to zaticrVlower Seasonal Materials
Prod. Sch. Direct Labor Fluctuation Price
Total Production Costs X
Net Sales X
Total Purchased MaterialCosts X
Total Work Center Output X X X
Direct Labor Hours X X
Productive Direct Labor X X
Shop Cost Irpit X
Contributed Value X
Equivalent Units of
Productive Ojtput X X
MUEE 1-2
1-1/,

Certain bases may be more appropriate for use in one area than inS another. It is perfectly acceptable to use a different base
among lower level cost centers. For example, production would beinterested in, perhaps, internal failure costs as a percent oftotal production costs. Purchasing, on the other hand, may wantto look at appraisal costs as a percentage of total purchasedmaterial costs. Engineering may want to consider preventioncosts as a percent of design engineering labor costs. The baseselected should be one that is a true reflection of what is beingexpended against the quality effort for that area.
As part of the development of this handbook, interviews wereconducted with a variety of companies doing business with thegovernment. Among the questions asked was "How are you express-ing the cost of quality?" The overall results of these inter-views are provided in Chapter 3, and Appendix D, but in terms ofbases being used we found generally:
- cost expressed as dollars- cost expressed as % of man hours- cost expressed as % defective- cost expressed as material cost in dollars- cost expressed as a % of sales
JUDGING THE MEANING OF COST OF QUALITY INFORMATION. A major problem for a government analyst in looking at cost ofquality numbers is how to judge their meaning for an individualprogram. For example, is the company collecting cost of qualityby department, by program, and by business unit, or only as atotal? As shown in our example earlier, dealing with the totalcompany versus the cost of quality for final assembly, it is veryimportant for management to understand what goes into a companytotal, and for lower level management to understand what theirunit contribution represents. The breakdown of contributions tothe total cost numbers should be driven by a logical applicationof the structure of the organization. For example, see Figure 1-8.
EXAMPLE COMPANY STRUCTURE
TOTAL COMPANY J'BC CORPORATION
BUSINESS SEGMANTS - 0AEROSPAC
PRODUCT LINES - Eff ICTER ER I7PT
COST CONTROL F_
CENTERS -- LDNG
FIGURE I-8
1-15

Understanding the contribution of each of the levels in Figure 1-8 to the total company cost of quality categories is important.Adverse trends, or unusually high cost at a lower level, may bemasked when combined with all other cost center input. With thisin mind, looking again at Figure 1-8, one could consider lookingat, for example, internal failure for "machining" as a contribu-tor to "Manufacturing" as a contributor to "Fighter", as a con-tributor to "aerospace", as a contributor to "total company" costof quality (figure 1-9).
PULLING UP COST OF QUALITY CONTRIBUTION-THROUDGH.THE STRUCTURE OF THE COMPANY
IABC CORPORATIONI
%AEROSPACE M[ARINEI
WELDING ING PAINT NGASSEMBLY
FIGURE 1-9
EVALUATING THE COST OF QUALITY
How do you know if the cost of quality is too high or too low, orjust about right? Is there an "acceptable range" for cost ofquality? Is continual improvement the real goal?
Recognize that at the producer there must be some cost ofquality. Otherwise there would be no control over output and nomeasurement of whether that output met requirements. It would beup to the user to prove the item's quality through actual use.If it performed as required and met all requirements, it wouldbe judged a quality product. If it failed, it would not bejudged a quality product. However, allowing for the user to findout whether the product is usable or not is not the way todetermine the quality. The manufacturer must take some action todetermine the product's acceptability before delivery. (SeeFigure 1-10).
1-16

Reprinted by permission, American society for Quality Control,"Quality costs: Ideas and Applications,
1984
a.o
O U A I T V I ~ N C ~ 4 w ~ 0 0ONO SPE~PJCA? oN
0 -M A U( E TO PC6IA~ N NTG A
Ca~lONfOS, I
Ofouc SPECIFTION THAisT OnAIYCNIL
CONRO QOFI~ OULTY 0-
of0 Quality Cost of Quality___ ___ ___ ___To Acquisition
To UserProdct-Posture
CoMr.uj ~Comnt
So QUALITY PROGRAM
excess a M i~costs- extra spares- extra equipment~
extra People- low operational ready rates
- degraded mission effectiveness
Figuzre 1-10

It is obvious that if the manufacturer is going to expend resourcesto determine product quality there will be a cost associated withthose resources. If the quality determination effort is eliminatingfield failures (other than normal wearout) then these quality effortsare satisfactory from the user's viewpoint. But how the qualityeffort is applied to eliminate field failures will determine to alarge extent how much it costs. If the user is paying the bills,then the cost of quality is a factor in determining the end itemprice.
If the contractor is screening all products, at selected intermediatestages, as well as just before final delivery, and is finding anddisposing of nonconforming items, then the production process is veryinefficient. The process is producing defective products. If theproducer knows this from experience gained through screeningproducts, then allowances will be built in (in addition to the costof actually doing the screening and disposing of the defects) forextra material, extra people, etc., to accommodate the scrap, rework,and repair needed to correct/eliminate the defects. All this extraallowance adds to the cost of the final product. The buyer is payingfor all the inefficiency in the producer's system. The producer mayhave an effective aualitv Droaram, based on elimination of fieldfailures, but not an efficient qualitv Program because he is allowinginefficient processes to generate defects and is passing along in thecost of the product the costs of finding and fixing the problems.(See Figure 1-11).
1-18

00
W
z C
a16
OUALITY UNKNOWN 100%. ENFORCEMEN GA
IT
NO SPECIFICATIONS F SPECIFICATIONS IN QUALITY CONTROLLED
ToL Acu to To serFINDAR FOR FIXST
QUALITY PROGRAM
- paying for inefficiency in producers "processes"- materials allowance for scrap- consumables for rework and repai.r- extra inspectors- extra inspection equipment- extra production people for rework- extra people to support entire MRB program
- engineers- quality technicians- clerks
- extra time to redo errors- engineering drawings- Purchase orders- bids/proposals
- "find and fix" does not prevent defects from reachingthe field. Still some cost of external failures. Highcost of internal failure.
Figure 1-11
1-19

What is described above 2nly addresses the readily visible costs
associated with manufacturing. What about costs such as:
- drawing error correction
- engineering changes
- engineering liaison calls
- planning revisions
- redone purchase orders
- incomplete bid packages
- re-inspection
- re-test
- pre-review of defective material
- use as-is
All these are examples of costs associated with inefficient processesthat are generating nonconforming output (engineering drawing; workinstruction; purchase order) and require extra resources to corrector dispose of the nonconforming material. Once more, additionalcosts are generated and are passed on to the customer.
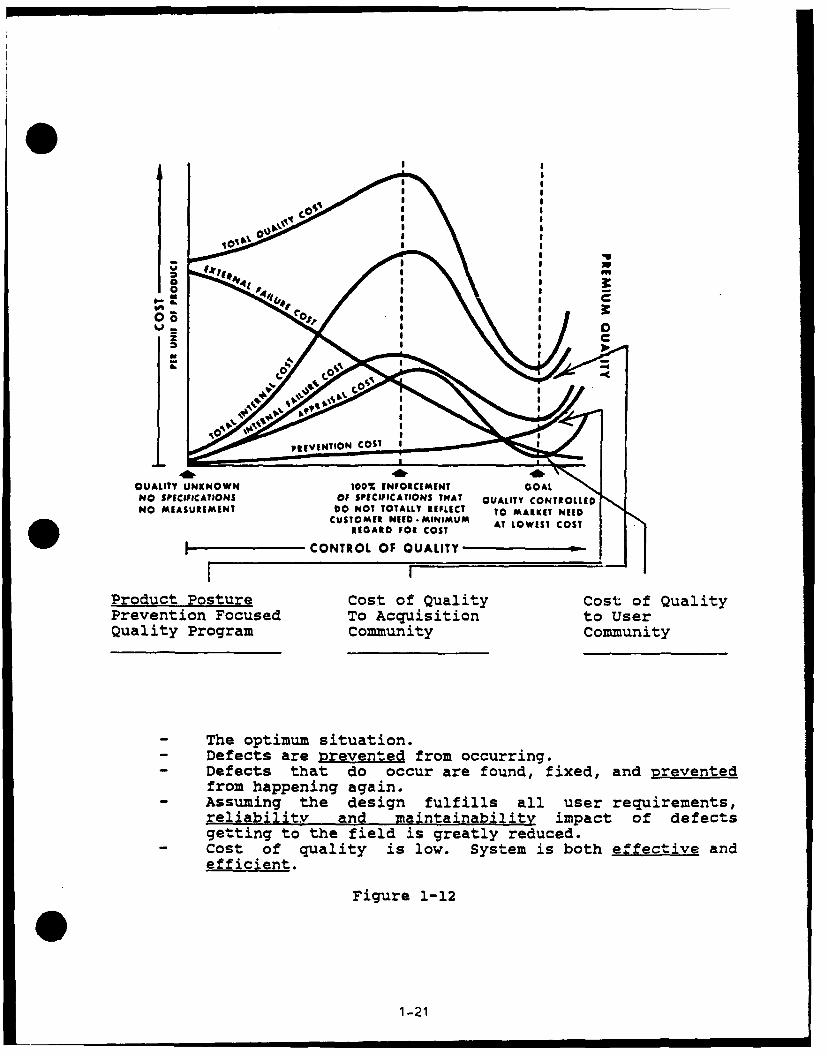
If the contractor is looking for nonconforming output and is takingsteps to determine the real cause of these nonconformances, andfurther, is putting into place actions that not only eliminate thenonconformances, but prevent them from occurring, then he isattacking and eliminating the inefficiencies in his processes. Costspreviously generated to accommodate the inefficiencies are greatlyreduced or eliminated. The buyer is paying for a program that willresult in effective and efficient production and on schedule deliveryof a conforming product, and should not be paying for excess costsneeded to support wasted resources. (See Figure 1-12).
0
1-20
0U
ii
z
I I
C.0
- TQUALITY UNKNOWN 0% ENFORCEMEINT GOALNO SPECIFICATIONS OF SPECIFICATIONS TMAT UALITY ONTREOLLEDNO MEASURIMENT 00 NOT TOTALLY REFLECT TO MARKETNEED
CUSTOMER NEED-MAINIIMUM AT LOWEST COST
REGARD FOR COST~~CONTROL OF QUALITY., -
Product Posture Cost of Quality Cost of QualityPrevention Focused To Acquisition to UserQuality Program Community Community
- The optimum situation.- Defects are prevented from occurring.- Defects that do occur are found, fixed, and prevented
from happening again.- Assuming the design fulfills all user requirements,
reliability and maintainability impact of defectsgetting to the field is greatly reduced.
- Cost of quality is low. System is both effective andefficient.
Figure 1-12
1-21

This all boils down to answering the following questions: 0Is the contractor's product failing in the field due tononconformances?
Is the contractor expending most of his quality costs infinding and fixing nonconformances before they reach thefield?
Is the contractor preventing nonconformances from occurringin the first place, and from recurring in the future?
See Table 1-3.
0
0
1-22

Oj~> > 1r.~ $4 4- $
> > 4 0 0 .4 3c
"4 4J U 0 0 ) r- 041 SO9 >OY 44341 t -I
41 >00V
S4 0V 4u 0 *~'4>) -1 -P4 041 -r44 4) $ -V )4 I
4) 0E 4 44J0 4 r 4-r -0Q.41010m (vt 40 002W 5443 V04) > U 0
>qO >i4 0 0 >q4 0 $4 4)64 )04) 0 ri-v4 C)
-0-k -$401 -4 V 10 0 A SZ M 40 k V 4'-4V0 V 04J 04) 0~~oo r. v ) 0 -
to > r. X4r. c0" .VrZ 1 0 I40a 40 004U - i4 0-44
V 44: 0t 0 1 9
~.eE-4
41
434140
44 mie- 041001 0 V 44 ONa
0. ~ ' ~4 to 4 4.) to0 - f J-H 4 4) V 1
0 ~~~ 04-)ra rk 10 0(4 k 0 0'-! 044v 0 040).
0 ~44- 14 4
Hr k N .k 4 T
44c'. 00 1-23r

Based on the above, what do we currently see as the situationwith contractors building systems for the Air Force?
The Air Force recognizes that having the user determinethe quality is not a viable alternative. Therefore, weknow we have some cost of quality.
Generally we have the condition of "find and fix", or100% enforcement of specifications.
A small, but growing number of aerospace prime andsubcontractors are adopting the "prevention" postureand are achieving effective and efficient quality pro-grams.
A large share of the costs are driven by the specificrequirements the Air Force places on contract. (SeeChapter 2, Requirements)
In order to judge whether the cost of quality is the correct costfor a contactor or for a particular program, apply the followingapproach:
- review contractual requirements and establish a clearunderstanding of what is required and what role eachfunctional area plays.
- Determine, based on functional expert analysis, if theeffort proposed by the contractor is appropriatefor the stated requirement.
- Determine the cost of quality, for the company, as well
as by program and by functiona area.
- Examine the contractor's performance for:
- nonconformance trends
- repeat nonconformance occurrence
- supplier rejects
- repeat supplier rejects
- field failures
- repeat field failures
- test results
1-24

relative percentages for--prevention, apprai-
sal, and failure costs
- waivers/deviations
0- engineering changes
Trends are much more important than absolute numbersfor performance indicators. (Note: ensure bases beingused are not affecting the data.)
The meaning of the trend data, relative to cost of quality, mustbe considered. Note that high levels or "up trends" correspondto the "Quality unknown" point on the left side of figure 1-13.The "steady trend" corresponds (assuming nonconformances havefallen and are now stabilized) to the "100% enforcement" point inthe center of figure 1-13. The "down trend" indicates movementalong the x axis of figure 1-13, with the object being theachievement of the "Goal" point on the right side of figure 1-13.Also, keep in mind that there will be good correlation betweenindicators. For example, nonconformance trends and repeat non-conformance trends will generaly be the same, although somerepeat problems can exist as the more difficult problems arestruggled with. The same holds true for supplier nonconformancesand repeat rejects. Field failures can be caused by bad designas well as failure to conform to the design. In this case, de-fect rates can be low and declining, but field failures can begoing up. Failures in this case are being caused by a designthat fails to meet operating requirements, even though the nutputis made to specification. Repeat field failures are an indicatorthat whatever fixes, i-f any, are being incorporated (assumingthey have reached the field) are not getting at the root cause.On the other hand, low conformance rates and high field failurescan indicate that the quality system is not findinQ noncon-formances that are there, and the nonconformances show up onlyafter they cause a field failure.
Z C
IZ
QU&LITY UMCNOWW 1Se 8gmIeCIMINT OCAL
NO SPI|CNIC ONS of SPICUSCAII@UI twat OAtITT COWI SOm
NO MiAIUIMIN1 0O NOT OAWS Wi 1 0 'to wigsCUSIONIS ATLi LOwIS1 COST
MAOAS. .O COST
ICONTROL Of QUALITY
Figure 1-13
1-25

A trend for a particular indicator must be judged from a shortrun and a long run perspective. If, for example, a contractor islooking at data monthly, then monthly changes must be judgedindividually as well as over three, six, or twelve month periods.Individual changes must be looked at in context to the overalltrends. Rate of change is also important. Overall level of thedata is also important. Let's examine each of these situations.
In figure 1-14 we see monthly changes of 2% in each month, Janu-ary through June, with a downward trend. Stability set in atapproximate 3-4% for July through September. A brief upward moveoccurred in June, but action was taken and the trend continueddownward in July. This was followed by a significant jump inOctober and November, not only in absolute numbers, but also therate change. The causes here require attention. Despite thesharp drop in December, it is too early to judge whether theupward trend has been reversed. (Notice here that the categorycould just have easily been for purchase orders, manufacturingplanning, retest, or bid and proposal rework, etc. "Reworkexists throughout the organization.)
REWORKENGINEERING DRAWINGS
. OFDIRECT LABOR16-
14-
12
4-2-
I I I I I i i MONTH
J F M A M J J A S 0 K P
FIGURE 1-14
As an aid to looking at indicators, their trends, and their rela-tionship one to the other, table 1-4 is provided. To use it:
Select an indicator from the list on the left handside, running top to bottom.
- Select a "trend-direction", i.e., up, stable, or down.
- Trace across left to right and see what the other indi-cators, listed across the top, may show in relation tothe indicator trend selected.
1-26

- Refer to footnotes when you encounter a box containinga number. The number corresponds to the applicablefootnotes.
For example, if you select "nonconforming, trend up", reading
across you find:
- repeat nonconformances usually are also "up"
- test failures are usually "up"
- repeat test failures are usually stable
- prevention costs in cost of quality will be low
- appraisal costs will be high
- internal failure costs will be high
- external costs will be high
Note that if you select "Defects, trend down", under "testfailures" and "external failures" you have footnotes 1, 2, 3, and4 indicated.. The point is that all the indicators must be looked at, bothindividually and in relation to one another, to make soundjudgments as to their meaning.
0
1-27

EXPECTED COMPARATIVE INDICTOR CONDITIONS
NEPCO- VENDOR IREPE AT ST REPEAT PE-NT. EXT.FORM- FO REJECTS VENDOR TEST ON SA L FAI- L A UR
IIC OR F - RJ REJECTSF FAILURE AILUREMNDlCATOR AdCES - ! - IDTIN A
NONCON- -IFORI S1 .0-w 1
ANCES ID
VENDOR US JEJECTSJS -- 1
REPEAT UYVENDOR
'REJECTS D ItII
REPE AT 1 7
TEST S
I PRE- U
PENTION 0
FAILE ME - LMMMALPPR11 U I M -1 e
[INT. U
EXT. 711-1 1 1 le eI [ i iP I~ Jil 1 1 9E1±1 EI0LEGEND:
U - TREND IS UP OR VALUE IS HIGH5 TREND IS STABLE OR VALUE IS MODERATE0 - TREND IS DOWN OR VALUE IS LOW
table 1-4
1-28

1. Could be low because nonconformances are caught before itemsgo to test.
2. Could be high due to bad design, even through manufacturingnonconformances are caught prior to test.
3. Could be low because nonconformances are not occurringduring manufacturing and those that occur are found andfixed prior to shipment.
4. Could be high due to bad design even through- manufacturingnonconformances are caught prior to shipment.
5. Nonconformances trend may be stabilized, but ability tolower it can be driven by repeat nonconformances, indicatinglack of correction of root cause.
6. Judged only against repeat nonconformances, test failureswill probably be down.
7. Testing may be weeding out nonconformances, but more likelyquality escapes are reaching the field.
S. Field failures can be controlled to a degree with the findand fix approach, but over time external failure will be at
*best moderate.
9. If appraisal is low because prevention is high (andeffective) then failure may be driven more toward low.
10. Could be high if low internal failure means system is notcatching nonconformances, or 2 could apply.
11. Numbers 3, 4, 7, 8, and 9 may apply.
As another aid to understanding the relationships between thecategories of cost of quality and the various indicators, figure1-15 shows three situations. As you move from the top to thebottom, the cost of quality category relationships, as apercentage of total cost of quality, change. Note that the mostlikely indicator conditions also change. Note also that the sizeof the total cost of quality gets smaller as we achieve aprevention focused condition. It is conceivable that the totalcould remain fairly constant. Even if this occurred, theachievement of the prevention focused condition is stillproviding the lowest failure rates and the highest customersatisfaction in the field.
-
1-29

COST OF QUALITY RELATIONHIPS MOST LIKELY INDICATOR CONDITIONS
- NONCONUORIANCES HIGH OR RISING.- REPEAT NONCONFORMANCES HI1GH OR RISING.- SUPPLIER REJECTS HIGH OR RISING.- REPEAT SUPPLIER REJECTS HIGH OR RISING.
APPRAISAL - TEST FAILURES NIGH OR RISING. COULD BE STABLEOR FALLING IF FIND AND FiX" IS GETTING DEFECTSPRIOR TO TEST.
FAILURE- REPEAT TEST FAILURES (SAME AS TEST FAILURES).
THIS IS A -FIND AND FIX- SITUATION
PREVENTION-NONCONFORMANCES STABLE OR BEGINNING TO DECLINE.
(ASSUMES PREVENTION EFFORT IS EFFECTIVE)- REPEAT NONCONFORMANCES STABLE OR BEGINNINGTO DECLINE.
,FAILURE - SUPPLIER REJECTS STABLE OR BEGINNING TO DECLINE.APPRAISAL POSSIBLE THAT ALTHOUGH INTERNAL QUALITY IS
STARTING TO IMPROVE, EFFORTS WITH SUPPLIERS ARETU STILL LACKING.
- REPEAT SUPPLIER REJECTS (SAME AS SUPPLIERREJECTS).
PREVENTION - TEST FAILURES STABLE OR BEGINNING TO DECLINE.ASSUMjES DESIGN is GOOD
- REPEAT TEST FAILURES (SAME AS TEST FAILURES).
THIS IS A 'SWITCH TO PREVENTION- SITUATION
- NONCONFORMANCES ARE LOW, HAVE BEEN ANDARE CONTINUING TO DECLINE.
- REPEAT DEFECTS NONCONFORMANCES ARE ALMOSTNON-EXISTENT.
- SUPPLIER REJECTS ARE LOW, HAYE BEEN AND ARE
APPRAISAL CONTINUING TO DECLINE. IT IS POSSILBE, BUTEXTREMELY UNLIKELY. THAT SUPPLIER REJECTS ARESTILL A PROBLEM. ONCE THE VALUE OF STRONGINTERNAL PREVENTION IS RECOGNIZED, IT ISEMPHASIZED WITH SUPPLIERS.
PREVENTION - REPEAT SUPPLIER REJECTS (SAME AS SUPPLIERREJECTS).
- TEST FAILURES ARE YERY LOW AND DECLINING.- REPEAT TEST FAILURES ARE ALMOST NON-EXISTENT.- APPRAISAL REMAINS A LARGE P[RCENTAGE, BUT NOW
THE FOCUS IS ON AUDIT OF ALL COMPANY UALITYSYSTEMS-, NOT -FIND AND FIX
THIS IS A PREVENTION FOCUSED CONDITION
figure 1-15
1-10

COST OF QUALITY-REQUIREMENTS
1. A question often exists in many people's minds concerningjust what legal or binding requirement exists that forms thebasis for cost of quality collection and reporting. Whileit is generally recognized that MIL-Q-9858A contains aspecific reference to cost of quality, there are many otherrequirements, based in regulation and law, that flow fromthe executive and legistlative branches down to thecontractor. What follows is a discussion of these variousrequirements. Tax-payers -demand cost-effective militarysystems and reliable performance throughout the acquiredsystem's life cycle. The citizens carry their views totheir government representatives in Congress to ensuredefense dollars are cost-effective. The Congress of theUnited States of America uses its legislative powers to passlaws, and to appropriate monies for the goods and servicesneeded to operate the government. The Executive branch ofgovernment is responsible for implementation of the laws andexpenditure of funds as authorized.
2. In the case of federally acquired goods and services theOffice of Management and Budget (OMB) through its Office ofFederal Procurement Policy (OFPP) issues the FederalAcquisition Regulations (FAR'S) which govern the acquisitionof all federal goods and services. FAR part 46 addressesQuality Assurance requirements. (Figure 2-1)
The following are several key requirements spelled out in the FARpart 46, involving Quality:
"Agencies shall ensure that contracts include inspection andother quality requirements . . .
that are determined necessary to protect the governmentinterest."
"The contractor is responsible for carrying out its obliga-tion under the contract."
"Agencies shall ensure that nonconforming supplies orservices are rejected, except as otherwise provided in46.407."
Far 46.407 nonconforming supplies or services is quoted in itsentirety for emphasis and better understanding. Underlining isfor emphasis!
0
2-1

FLOWDOWN OF LEGAL BASIS FOR COST OF QUALITYS
- HA1CN E OUH-HWCHCNBSPT
IIIU IRjobmENTSBacoa
SYSTEM ~ I C ASSONGLFRED D
PRe ODDO SPPECPASTAONDAR
VI C ALLOT IN THE COUGTRC
CASFA DUCTO D O-RE HO MUST COME PYNWTH
- APR COPLANCE L . REQIREMENTr-PEIFI SANARSDIECIO UTORTREQFiguEe 2-1
F IRFOCESYTE2-2M AN

(a) C officers should reject supplies = servicesn= conformina in all respects to contract reauirements(see 46.102). In those instances where deviation fromthis policy is found to be in the Government'sinterest, such supplies or services may b% accepted2ly as authorized in this section.
(b) Contractors ordinarily shall be iven an opportunity tocorrect 2K replace nonconformini suynlies 2r serviceswhen this can k% accomplished within the requireddelivery schedule. Unless the contract specifiesotherwise (as may be the case in some cost-reimburse-ment contracts. correction 9r replacement shall bewithout additional cost to the Government.Subparagraph (e)(2) of the clause at -2 2j-. Inspec-ion of SuDplies-Fixed-Price. reserves to the Govern-ment reinspection and retests because o Rrior rejec-tion.
(c) (1) In situations not covered by (b) above, the con-tracting officer shall ordinarily re-ect supplies orservices when the nonconformance adversely affectssafety, health, reliability. durability, performance,interchanaeabilitv of parts or assemblies, weight ora~pearance (where a consideration), or any other basicobjective o the specification. However, there may becircumstances (e.g., reasons of economy or urgency)when acceptance of such supplies or services is deter-mined by the contracting officer to be in the Govern-ment's interest. The contracting officer shall makethis determination, based upon-
(i) Advice of the technical activity that thematerial is safe to use, and will perform itsintended purpose;
(ii) Information regarding the nature and extentof the nonconformance;
(iii)A request from the contractor for acceptanceof the supplies or services (if feasible);
(iv) A recommendation for acceptance or rejection,with supporting rationale; and
(v) The contract adiustment considered appropri-ate. including any adjustment offered by thecontractor.
2-3

(2) The cognizant contract administration office, orthe Government activity directly involved, shall furn-ish this data to the contracting officer in writing.Except that in urgent cases, it may be furnished orallyand later confirmed in writing. Before making a deci-sion to accept, the contracting officer shall obtainthe concurrence of the activity responsible for thetechnical requirements of the contract, and wherehealth factors are involved, of the responsible healthofficial of the agency concerned.
(d) If the nonconformance is minor, in that it does notaffect any of the factors referred to in (c) above, thecognizant contract administration office may make the deter-mination to accept or reject, except where this authority iswithheld by the contracting office of the contracting acti-vity. To assist in making this determination, the contractadministration office may establish a joint contractor-con-tract administrative office review group. Acceptance ofnonconforming supplies that affect any of the factorsreferred to in (c) above is outside the scope of the reviewgroup and must be handled as specified there.
(e) Co ntacting officers shall discouraQe the repeated ten-der 21 nonconforming supplies or services, including thosewith only minor noneonformances, by appropriate action, suchas relection and documenting the contractor's performancerecord.
(f) Each contract under which nonconforming supplies orservices are accepted as authorized in (c) above shall bemodified to provide for Mn equitable price reduction orother consideration. However, when supplies or servicesinvolving minor nonconformances are accepted, the contractshall not be modified unless (1) it appears that the savingsto the contractor in fabricating the nonconforming suppliesor performing the nonconforming services will exceed thecost to the Government of processing the modification, or(2) the Government's interests otherwise require a contractmodification.
(g) Notices of rejection shall include the reasons forrejection and be furnished promptly to the contractor.Promptness in giving this notice is essential because, iftimely nature of rejection is not furnished, acceptance mayin certain cases be-implied as a matter of law. The noticeshall be in writing if-
(1) The supplies or services have been rejected at aplace other than the contractor's plant;
2-4
(2) The contractor persists in offering nonconformingsupplies or services for acceptance; or
(3) Delivery or performance was late without excusablecause.
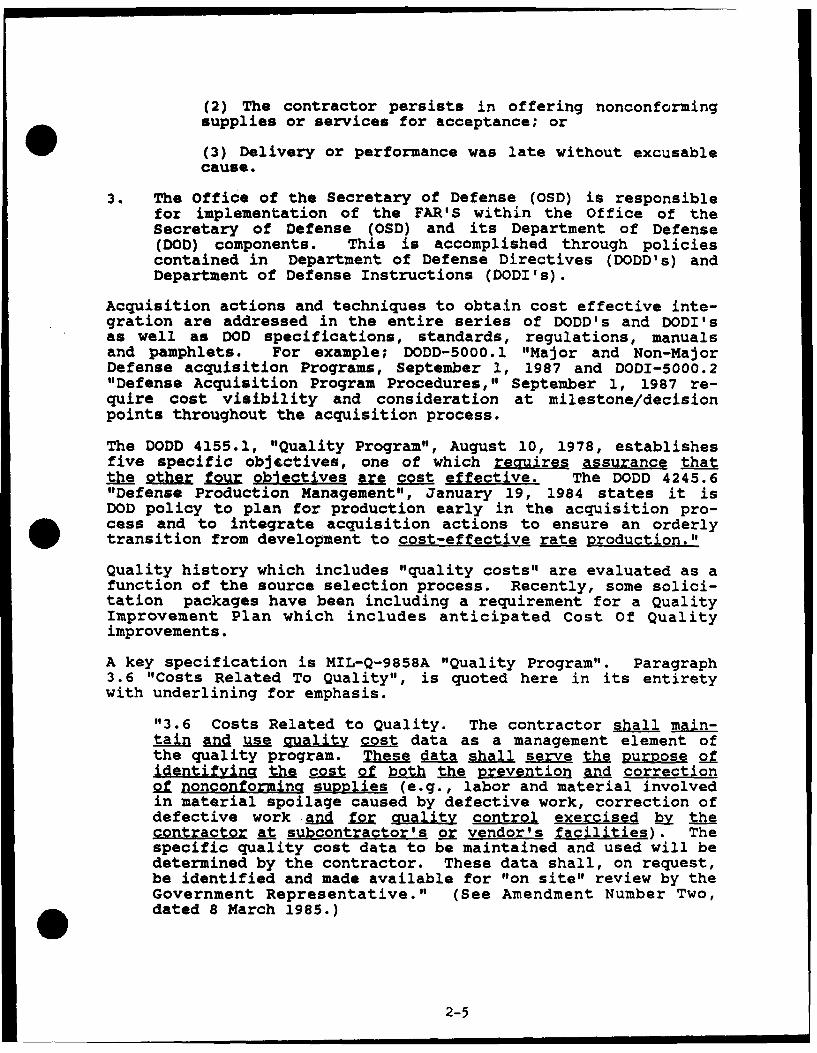
3. The Office of the Secretary of Defense (OSD) is responsiblefor implementation of the FAR'S within the Office of theSecretary of Defense (OSD) and its Department of Defense(DOD) components. This is accomplished through policiescontained in Department of Defense Directives (DODD's) andDepartment of Defense Instructions (DODI's).
Acquisition actions and techniques to obtain cost effective inte-gration are addressed in the entire series of DODD's and DODI'sas well as DOD specifications, standards, regulations, manualsand pamphlets. For example; DODD-5000.1 "Major and Non-MajorDefense acquisition Programs, September 1, 1987 and DODI-5000.2"Defense Acquisition Program Procedures," September 1, 1987 re-quire cost visibility and consideration at milestone/decisionpoints throughout the acquisition process.
The DODD 4155.1, "Quality Program", August 10, 1978, establishesfive specific objectives, one of which recuires assurance thatthe other foUr objectives are cost effective. The DODD 4245.6"Defense Production Management", January 19, 1984 states it isDOD policy to plan for production early in the acquisition pro-. cess and to integrate acquisition actions to ensure an orderlytransition from development to cost-effective rate production."
Quality history which includes "quality costs" are evaluated as afunction of the source selection process. Recently, some solici-tation packages have been including a requirement for a QualityImprovement Plan which includes anticipated Cost Of Qualityimprovements.
A key specification is MIL-Q-9858A "Quality Program". Paragraph3.6 "Costs Related To Quality", is quoted here in its entiretywith underlining for emphasis.
"3.6 Costs Related to Quality. The contractor shall main-tain and use auality cost data as a management element ofthe quality program. These data shall serve the Rurpose ofidentifying the cost of both the Prevention and correctionof nonconformina suDDlies (e.g., labor and material involvedin material spoilage caused by defective work, correction ofdefective work and for uality control exercised by thecontractor at subcontractor's or vendor's facilities). Thespecific quality cost data to be maintained and used will bedetermined by the contractor. These data shall, on request,be identified and made available for "on site" review by theGovernment Representative." (See Amendment Number Two,dated 8 March 1985.)
2-5

CURRENT GOVERNMENT FOCUS
Discussion with government personnel currently involved in perform-ing cost of quality audits revealed that the concentration has beensolely on the FAILURE cost area. The explanation given is thatfailure cost is the only contractual requirement for cost of qual-ity that currently exists in MIL-Q-9858A, paragraph 3.6 and 6.5,which talk to "cost of quality" and " . . . correction offailures." It is the opinion of the authors of this handbook thatthis interpretation falls short of what is required of contractorsby MIL-Q-9858A.
Paragraph 3.6 specifically states PREVENTION costs are required tobe maintained. Now refer to paragraph 3.5 of MIL-Q-9858A:
"3.5 Corrective Action. The quality program shall detectpromptly and correct assignable conditions adverse to qual-ity. Design. prhsng., manufacturing, testing or otheroperations which could ru in or have resulted in defec-tive supplies. services. facilities, technical data,standards or ther elements of contract performance whichcould create excessive losses 2r costs must be identifiedand chanaed as result f the rogram. Correctiveaction will extend t the performance 2f all suppliers andvendors and will be responsive to data and product forwardedfrom users. Corrective action shall include as a minimum:
a. Analysis of data and examination of product scrappedor reworked to determine extent and causes;
b. Analysis of trends in processes or performance ofwork to prevent nonconforming product; and,
c. Introduction of recruired improvements and correc-tions, an initial review of the adequacy of suchmeasures and monitoring of the effectiveness ofcorrective action taken.
Wording under 3.5 (b) is specific to PREVENTION. General wordingcovers APPRAISAL and FAILURE. These are clear, direct requirementsof the quality program. The costs associated with these must becaptured. Paragraph 3.6 calls for cost of prevention. Correctiveaction costs are part of failure.
Now look at paragraph 3.4:
"3.4 Records. The contractor shall maintain and use anyrecords or data essential to the economical and effectiveoperation of his quality program. These records shall beavailable for review by the Government Representative andcopies of individual records shall be furnished him uponrequest. Records are considered one of the principal formsof objective evidence of quality. The quality program shall
2-6

assure that records are complete and reliable. Insectiand testin records shall, as a minimum, indicate the natureof the observations together with the number of observationsmade and the number and type of deficiencies found. Also,rfor mntong work 2n u ond for A = insct ionAn= tsi shall indicate the acceDtability 21 W= 2rRroui and thi action taken in connect iol wilhdeficiencies. The quality program shall provide for theana uyie o use as-t re A& a k basis for manacementaction.
Here again, APPRAISAL is covered by the requirement to maintainrecords of all appraisal activity. FAILURE is covered again byreference to action taken in connection with deficiencies (failuresand their disposition). Additional wording appears under paragraph1.3, Summary:
"The program shall facilitate determinations of the effects ofcrualit deficiencies and raliit costs 2n 2r ice."
"All supplies and services under the contract, whether manu-factured or performed within the contractor's plant or at anyother source, shall be controlled at all points necessary toassure conformance to contractual requirements. The programshall pyr4d fr reventin An= ready detection of dis-crepancies and for tiel and po corrective action. Thecontractor shall make objective evidence of qualityconformance readily available to the Government Representa-tive. Instructions and records for quality must be
* controlled.
Paragraph 6.5 is specific relative to costs:
"The contractor shall make known to the government uponrequest the data associated with the costs and losses in con-nection with scrap and with rework necessary to reprocessnonconforming material to make it conform completely."
Strict interpretation limits the basis for cost of quality auditrequirements to paragraph 3.6 (see page 2-6) under failure only,and paragraph 6.5 misses the other clear requirements in MIL-Q forcapture and use of PREVENTION and APPRAISAL costs, as well as alltypes of FAILURE, not only scrap and rework of material. The sug-gested contractual clauses contained in chapter four are designedto get at what is already required. Whether these or similar typeclauses are adopted, MIL-Q-9858A clearly covers all cost of qualityin its present form.
OTHER REQUIREMENTS
Another key standard involving costs of quality is MIL-STD-1520C,"Corrective Action And Disposition System For NonconformingMaterial," 27 June, 1986. The primary purposes of the system areto identify and correct causes of nonconformances, prevent recur-. rence of wasteful nonconforming material, reduce the cost of manu-
2-7
... . ., I I

facturing inefficiency, and foster quality and productivityimprovement."
MIL-STD-1520C Paragraph 5.7.4 Nonconformance costs. states "Thecontractor shall determine and record the costs associated withnonconformances. The objective of generating the cost data is toprovide current and trend data to be used by the contractor indetemining ne fr and effectiveness of corrective action.The resultant cost data shall serve as a basis for necessary Cor-rective Action Board (CAB) and Quality Improvement Project (QIP)action when appropriate. Nonconformance cost summaries shall con-sist of scrap, rework, repair, use-as-is, and return to suppliercosts, Rlus other costs as determined appropriate by thecontractor."
Minm data summarization requirements in MIL-STD-1520C paragraph5.8 include all costs described in paragraph 5.7.4 of MIL-STD-1520C. Preparation of the required data shall not be less frequentthan quarterly. The contractor shall periodically ensure, both in-house, and at suppliers where appropriate, that audits are con-ducted of MIL-STD-1520C requirements to verify compliance and en-sure effectiveness. Nonconformance costs are included in theseaudits.
The Defense Logistics Agency (DLA), who administers many DoD con-tracts, issued change 4 to DLAM 8200.2. This change was "designedto assure uniformity of program application and performance ofrequired Defense Contract Administration Services (DCAS), QualityAssurance (QA) functional responsibilities." This change alsoincluded guidelines which helped to identify the types of costsgenerally included in the COQ categories of Prevention, Detection/Assessment and Failures. DLAR 8200.10 "Control of NonconformingMaterial", 8 June 1987 reflects an increasing effort by the govern-ment to control and reduce nonconformance costs. Under the author-ity of FAR 46-407 the government sent a signal to contractors withDLAR 8200.10, which provides a means to transfer nonconformancecosts back to the contractor. This indicates the governmentintends to enforce FAR 46.407 and will no longer accept what itconsiders to be excessive major or minor nonconformance of product.
The aforementioned requirements can be affected by the type ofcontract written, priorities within the contract, and flow-down ofrequirements to suppliers.
Other contractual requirements and standards such as MIL-STD-1535A,MIL-STD-1528A, and MIL-STD-1567A (especially variance analysisrequirements) involve cost of quality requirements (details pro-vided under functional sections 4-5, and 4-3). Additionally, manyother requirements exist that are cost effective issues involvingquality: design to cost, life cycle cost, logistics support anal-ysis, reliability, maintainability, producibility, value engineer-ing, pre-planned product improvements, industrial modernizationimproved. methods and processes, functional/physical configurationaudits, production readiness reviews, work measurement,cost/schedule reports, cost in time for the cognizant CAO to direct
2-8

remedial corrective actions, process requirements, electronicstress screening, workmanship practices, training - testing -inspection, purchase orders, failure reporting and corrective.action system (FRACAS), equipment - facilities - resources,material, procedures - instructions, shop practices, materialshortage, out of station work, schedule not realistic, engineeringdrawings (detail) late/changes, lack of tooling, planning/changesnot well coordinated, qualification of suppliers, bill of materialshortfalls, and inaccurate records.
Noncontractual agreements are also used by some agencies toestablish COQ goals and commitments when contractual requirementscannot be negotiated.
There are a wide variety of professional organizations thatestablish National Consensus Standards or Programs which areextremely valuable but are not contractual requirements. For exam-ple, the American Society of Quality Control (ASQC) has publishedmany books and articles that define quality costs and explain whyquality costs are important and how to control them. Additionally,the National Association of Accountants recently published a bookentitled "Measuring, Planning, and Controlling Quality Costs".Chapter one, Figure 1 and Appendix B of this handbook providecopies of the cost of quality items these professionalorganizations have identified as applicable and useful in mostcases.
The requirements for quality cost systems have existed for manyyears as a means of highlighting the cost of poor planning and.performance, that is, the cost of not doing things right the firsttime. However, these systems have not been well understood due toproblems with definition and application to specific managementtasks, specific job tasks, and various functional areas of respon-sibility.
An adequate definition of quality cost exists today. The govern-ment must grasp what is available, adopt a standard definition ofquality cost categories, build contract requirements that are flex-ible, yet adequately integrate all cost-effective efforts includingthe COQ requirements, and develop better systems for documenting,measuring, controlling, and reporting costs that achieve thedesired quality in on-schedule delivery of goods and services.
The program management office is the key to obtaining the integra-tion of all factors during the acquisition process and to ensurereasonable and cost effective COQ requirements exist in the negoti-ated contract. The contractor must comply with contractualrequirements by planning and implementing systems that control costof quality. The suggested cost of quality contractual clausesprovided in Chapter five provide ideas on ways to get what thegovernment wants.
2-9

O 3-1 METHODOLOGIES - GENERAL
Cost of Quality can be a key management tool. It is not asolution in itself, but rather a major tool to measure pro-gress or lack thereof over time. But, how is cost of qual-ity, that is, the cost of prevention, appraisal, and offailure, found?
Just as quality or excellence is everyone's responsibility,quality costs are accrued hy every one. Consequently, theyare within the ability of everyone to identify and impact,to a greater or lesser degree. If it is true that "whatgets measured, gets done", a measurement of cost is thefirst step toward management and control of cost of quality,to the benefit of the consumers, producer, and suppliers.
Earlier, the reader was introduced to cost of quality defi-nitions and categorization into prevention, appraisal, andfailure costs. These same categories should be used toquantify costs.
We can measure cost of quality in many ways, depending on
the category being considered. For example, failure:
Cost of nonconforming units
Mass of material nonconforming
Number of ECNs
or, Incorrectly prepared P.O.s
But only by costing all these expenses can we develop a truepicture of the impact of cost of quality to the organiza-tion. By comparing these costs to other performance andfinancial data, opportunities for cost reduction andenhancement of material quality can be pinpointed. Mostimportantly, the user in the field will benefit as well asthe producer. Make no mistake, there is no trade off here.A conforming, quality product can be delivered to the userand the producer can still cut his cost significantly.Recall the company example in Chapter one.
As an enterprise or organization develops towards excel-lence, more of the cost- of quality shifts- to- preventioncosts. Such an organization embraces preventative princi-ples, and high quality products and services become theresult of thousands of mini-scale efforts and decisions overtime. Measuring the cost of quality and comparing itsdevelopment over time allows for appraisal of the many
3-1

efforts and decisions. The only real purpose for developingthe cost 2f quality is to develop a keen understandinQ ofwhere process and product improvement, cost reduction, andquality enhancement can be achieved, so as to serve theusers interest euuallv well or better (Chapter one. Benefit#1 and #2). Developing data into useful information andusing that information for decision making is the goal.Information is power. Sharing the cost of quality informa-tion allows not only quality assurance professionals, butmanagers in all areas to study processes and operations andtake actions designed to eliminate waste and unnecessaryeffort, and promote the concept of "doing it" right thefirst time.
But where do we find costs of quality and types of activi-ties that generate these costs? Once identified, how do weexpress the costs in a meaningful manner and what purposewill this data serve?
As mentioned earlier, costs of quality are found in allareas of the typical organization:
Finance and Accounting
Human Resources
Materials Management
Manufacturing
Engineering
Distribution
Marketing
Customer and Field Service
As explained in Chapter one, cost of quality should be divi-ded into the categories of Prevention, Appraisal, InternalFailure, and External Failure. The listing of examples inTable 1-1 is taken from "Principals of Quality Costs" pub-lished by ASQC (See also, Appendix A). Although theserepresent thorough listings of cost of qualitypossibilities, few organizations will use exactly the samecategories. Many items can be added as they are uniquelysuited to a particular contractor and some may be deleted asinconsequential or not necessary.
Approaches will vary from contractor to contractor. Forexample, in many systems capital costs will not be measured.Capital costs would include such items as floor space andcapital equipment, as well as the associated depreciation.Also, indirect costs may be omitted. Indirect costs mayinclude costs such as customer costs associated with
3-2

external failure which are not reimbursed by the contractor,interests costs (or cost of money) for excess inventories,vendor quality costs affecting the contractor (the absenceof which would reduce product or service cost to the con-tractor), overhead costs for production of internal fail-ures, etc.
Basic Cost of Quality Structure
The most basic of quality cost systems should certainlyinclude the following:
- Prevention
a. The quality organization costs except forinspection, testing, and failure efforts.
b. New product testing and design efforts.
c. Q training
d. Supplier reviews and audits
- Appraisal
a. All inspection, internal and external
b. Quality data and information development and*analysis
c. Outsourced product or service evaluation andcontrol programs.
d. Product reliability testing
e. Inspection and test equipment and supplies
- Internal Failures
a. Scrap
b. Rework, repair, use as-is
c. Failure analysis
d. Engineering changes
e. Purchase order changes
f. Design re-evaluation
0
3-3

External Failures
a. Warranty Costs
-b. Returned goods
c. Product Liability Insurance
All of these basic costs of quality should be availablethrough the standard accounting system. The controller orcontractor financial contact should be able to supply thesecosts in a relatively accurate fashion.
Role of Controller Function
Proactive participation by the contractor's accounting orfinancial representatives will benefit in achieving the mostaccurate development of a total quality cost. It must beremembered that the cost of quality is a portion of thetotal quality program. Cost of Quality really defines theentire quality system, in terms of dollars. The cost ofquality should not be used as simply a cost cutting tool.Comparisons to previous performance over time is the primarypurpose for the cost of quality (Chapter 1, Benefit #5).Comparison to other firms or divisions tends to beinaccurate and misleading because of the fact that account-ing data are gathered and reported differently in variousorganizations and enterprises, product lines differ, andmanagement approaches vary a great deal.
The quality costs are to be found in many areas. It is atthis point that the Quality department personnel andaccounting personnel must interact. The quality person isprimarily responsible for the accounting of nonconformancesand errors. It is the controller and accounting personnelwho are responsible for assigning dollar values and costs tothe quality effort. Together, they must bring the rest ofthe organization under the total cost of quality umbrella.
Incorporating the responsibility for cost of quality withthe comptroller allows functions across all departments inthe company to participate. In addition, the costs reportedwill tend to have more credibility because they come fromthe same source as all other financial data for the company.
Sources for Costs of Quality
Most of the cost of quality can be found in the followingsources:
S
3-4

Contractual Requirements
In the event that government contracts for goodsor services are involved, certain quality require-ments may be part of the contract purchase agree-ment (e.g., various military specifications, MIL-Q-9858A, MIL-STD-1520C, MIL-STD-1535A, MIL-STD-1567A, Environmental Test Screening, FRACAS, etc.)Review of these contractually required documentswill provide a basis for then going to the respon-sible function to find costs associated with thesequality program requirements.
Chart of Accounts and General Lg
In the chart of accounts one will find the basicexplanation of all accounts, systematicallyarranged, applicable to a specific enterprise ororganization. Figure 3-1 provides an example of atypical chart of accounts. The example is not allinclusive.
The general ledger will list all detailed or sum-marized transactions for the business. In usingthis source, it will be necessary to seek guidancefrom finance or pricing personnel. Many costs ofquality will be included in other costs posted tothe general ledger. It will be necessary to makeestimates or complete further investigation toestablish many costs. Keep in mind that estimatesmay be required, and it is far better to use esti-mates which are made on an informed basis than toignore the cost.
Business Plan and Budget
This document will provide information concerningindirect, support and staff efforts, and types ofcosts of quality. For example, all costs forreturned goods, warranty, and field service shouldbe External Failure costs and recorded on thequality cost report accordingly. Training costsshould be appropriately accounted as preventioncosts. In some cases departmental or functionoperation (i.e., engineering, manufacturing) bud-gets will contain more detail than the corporatebusiness plan and/or budget. Referring to thesedocuments is a logical next step.
The operating budget should give you a reasonablycomplete listing of expense by account and cate-
* gory.
3-5

ABC COMPANY
CHART OF ACCOUNTS
7-1-88
ACCOUNT MACCOUNT DESCRIPTION
100 Salary
200 Hourly General201 General Indirect202 Trucking203 Inspection
300 Hourly Maintenance301 Mech. & Ele. Repair302 Die & Jig Repair303 Janitorial
400 Premium Pay
500 Hourly Fringe Benefits501 Vacation & Holidays502 FICA503 Welfare504 State Employment Ins.505 Fed. Employment Ins.506 Workmens Compensation
600 Salary Fringe Benefits
700 Operating Supplies701 Factory702 Janitorial703 Perishable Tools704 Medical705 Medical
800 Maintenance Supplies801 Mech. & Elec. Repair802 Die Repai4r803 Building Repair
900 Utilities901 Gas & Oil902 Electric903 Telephone
1000 Nonconforming Materia!1001 Returned Goods
Figure 3-1
0
3-6

Ex $t ~ C. .Satement p Re orts
Many organizations already have cost of qualityprograms developed to some level, but as discussedin Appendix B "Survey Results", most concentrateon failure costs. These reports can add valuableinformation and data. A clear understanding ofthe data should be obtained so that costs includedin this data are not duplicated or assumed and notstated in other areas. Nonconformance data willnearly always be available in these reports andwill significantly support cost of quality in themanufacturing area.
Labor Reorting Statements
In many cases, a separation of appraisal orinspection time versus standard operations timewill be provided. In many others, however, itwill be necessary to establish estimates forappraisal cost involved in direct labor efforts.(See Analytical Techniques in this chapter.) Ifthe contract calls for MIL-STD-1567A, WorkMeasurement, then data should be available (Seealso Chapter five, page 2).
Capital Eauipment Listing and Calibration Los
Appraisal equipment costs and user groups can beidentified from these sources. Calibration logsand reports will reside with the Q.A. personneland appraisal inspection Capital Equipment will belocated with O.H. and/or Finance.
Customer Service - Field Service Reports
Returned goods, warranty costs, and field servicecosts can be found in these reports which willsubstantially impact the External Failure Costs ofQuality.
Interviews and Operation Reviews
In many cases, without benefits of hard cost data,it will be necessary to estimate certain costs ofquality. This is an- accepted method of determin-ing costs of quality and in most cases,supervisors and involved engineering personnelhave accurate data on which to make assumptionsand estimates. In other circumstances it may be
* advisable to review the process concerned and to
3-7

develop costs based on the effort actuallyinvolved.
The technique provided later in this chapter-represents a format that might be used for such a-review process.
Summarizing the Cost of Qualit
When the data has been obtained or developed andeach cost has been defined as a prevention cost,appraisal cost, internal failure cost or externalfailure cost, the costs should be summarized andpresented as a Cost of Quality Report. Any organ-ized and traceable format can be used, such as theexample listed in Figure 3-4. This data can thenbe used to develop trend analysis to measure theimprovement of product service quality over time.An example of a cost of quality summary report isshown in Figure 3-4.
S
3-8

DIRECT COSTS
COST ACCOUNTI14G APPROACHES
In terms of the methodologies used by the contractor to accountfor costs, understanding the approach used will enable an AirForce evaluator to find the cost of quality within that account-ing technique. Keep in mind that actual visibility of or accessto the detailed numbers may be limited by type of contract andwhat, *if any, cost reporting requirements have been put in place.
As mentioned in Chapter five under "Verificatior'-and Audit",contracts with formal cost and schedule reporting provideaccounting basis stemming for work packages and planningpackages, as well as cost accounts. Again, recall that directcosts are covered here, but not indirect. A majority of thecosts associated with cost of quality will be indirect costs.
Cost Centers - usually an area in which a single, distinguishabletype of operation or function is performed. Cost centers aretypically divided further, based on the type of activityperformed.
Productive Cost Centers - specific work done, directlytraceable to the product.
- Service Cost Centers - individual activities that sup-port productive activities, but are not obviouslytraceable to a specific product. These are normallyclassified as indirect costs.
Cost accounting systems are usually found to be one of two basictypes. There are the Job Order and Process Cost Systems. Bothcan be either a historical cost system or a predetermined costsystem. Neither approach is applied in its "pure" form, but moretypically is modified to suit the particular contractor's methodof managing his business.
Under the job order cost approach, costs will normally be accumu-lated by jobs, lots, or orders. Workers will identify on theirtime cards the jobs on which they work, and a calculated overheadrate is then applied. Under the process cost approach, costswill normally be accumulated by units of product within eachprocess or department. Total costs for producing a kind of unitand the number of that kind of unit produced are determined forregular accounting periods. Then an average cost for the periodis determined.
The vast majority of Air Force programs will fall in the joborder cost area.
0
3-9
• . . . , , I II

Another approach involves the use of a Historical Cost System.The job order cost approach can also be called a historical sys-tem if the only data about an end products' production areaccumulated after the end product is produced. Historical dataare used in alr cost accounting systems, at least as a basis forcomparing actual results to predicted results. The reportingunder C/SCSC, which looks at budgeted cost of work performedversus actual cost of work performed, is using the historicalapproach. When a contractor uses historical costs as a basis forprojecting what the future costs will be, it is important tounderstand that many cost of quality elements, and their associ-ated costs, are driven by the phase of the program. Table 3-1shows a breakout by major functional area as to when variousactions that comprise typical cost of quality items occur foreach phase of the acquisition process. Note that the detailedinformation provided in each functional section in Chapter fourcan be used in conjunction with Table 3-1 and, when combined withjudgement, provide a good basis for determining exactly when (byphase) a particular cost of quality can be expect,.d to occur.
Closely related to the phase of the program is the recurring andnonrecurring aspect of many costs. Recurring costs are thosewhich will be incurred over and over again during the life of theprogram. Examples of recurring costs are:
- production material
- production labor
- ST/STE repair/maintenance
- expendable tools (drill bits, cutting/machine tools,etc.)
Nonrecurring costs are those that will be incurred as a one timeeffort, and are e:pended, will not be repeated. Examples are:
- design and manufacture of special tools/test equipment
- plant rearrangement
- tooling (jigs; fixtures)
- operating instructions
The analyst should be sure to consider whether a proposed cost isrecurring or nonrecurring, and whether it has been properly pro-posed and would be expected to occur in the phase of the programbeing considered.
The last approach that bears mentioning is the Predetermined CostSystem approach. These type systems accummulate data about theproduction of an end product before the end product is produced.Cost estimating techniques are used by the contractor to predicthis costs for doing a particular job.
3-10

zcZI Azi a.- 0 - - I
_z _
zt
2 uu'mLo
I -n
-C~ UU C -SX'C CL (n w w 6J c
-J (n .43 -nc0 4" 9x -r (
~.lL L-J 0'6 -io
- S Z-~ s
3-11

p ______________________________
I-(i
0 Iai- I1 zc
U6m ocI
En - 4 0 u ,4
(n -J 0-0 U,
U. 1 CL -ad =i~ -' -Cm4J X
;P. L" mn0-H
U, z
P. -a-
-J 4'z'I:
6- c- i - S- * - m
>-2 iLi9-
hj II z
>0
w. _ _ _ _ _ _ _ _ _ _ __ _ _ _ _ _ _ _ _ _ _ _
a-a
cc (Z6"-9x:L CL0
3.9 -- lQMba
Ta'e -
- .. I3-12

7 t
- o-
oC co : .2 VI
z~ Ix c
w-. CL c --
- n - ) 4. I. c a UP SS - *
I3-.
! AII 111
L. 0
-l I, r- ( l - .A;.(
zU0
0~ 4 4jIdelL

z
CL
z
C
g- -I. C ACn
LiL :E =aC0;.=c
a ~ ~ ~ ~ ~ ~ ~ d i - I- S -
0. CL Z - C1
I _ =I~.w"'-0.
zz -A7
-a C>. >
Q.4:
cn 0SA1
>0-J
Zz
=1 Loll
3-1

zL
0z
0 W IA. t I0 t
all" , >- C l
=1 mi j z:-C 1U
Ai :ul0w - V L4cJ-
co
imid -J = W
-I
3-1

z
(ncEn c
-J 0: 0: ll______11L JH>0 1 .- 0= L"0C
-c < - C - .- -, - CD .
z I-La.L
- "j - 4: - - P. - u E -! S - S-
z
0
Lai
1-3 16

COST ESTIMATING
There will be occasions when it is necessary for the Air Forceevaluator to develop an estimate independently from the contrac-tors estimate in order to allow for judgement about the validityof the contractor's numbers. There are a variety of techniquesused in developing cost estimates, to include the use of:
- Estimating relationships
- Special Analogies
- Special Estimates
- Rates, factors, and catalog prices
- Industrial engineering standards
- Cost model applications
- Trend analysis
- Parametrics
- Bottoms up
- Historical costing. It is not the function or intent of this handbook to go beyondproviding basic tools and approaches for estimating costs ofquality.
The starting point for an evaluator must be a thorough under-standing of what the tools are that are required by the contract.
Once the the tools are understood, both from the inherent natureof the work to be done, as well as from the specific and uniquegovernmental requirements, the analyst can use the informationprovided in Chapter four to work up an estimate of the cost ofquality. The technique outlined under "Analytical Techniques"for developing an empirical estimate is based on a detailedbreakdown of the actual work content. Once the decision has beenmade on the extent to which the analyst must do independent esti-mating, the sources for data must be investigated. The followinglist (Figure 3-2) provides some typical sources of data:
0
3-17

Figure 3-2
Daga Description Data Source
Engineering drawings Design data package
Product specifications Design data package
Written description of Proposalproduct
Bills of material Manufacturing engineering,purchasing department
Organization chart Personnel department
Ratios of labor, support, Personnel department andengineering organization
Job descriptions and skill- Wage and salary administrationlevel breakdown
Collective bargaining Labor relations departmentcontract
Definition of direct/ DCAA audit, productionindirect labor categories management wage administration
categories
Description of plant Proposal, process engineeringfacilities
Special equipment andprocesses
Management information ADP managementsystem and ADPcapability
Manufacturing capa- DCAS capability study, priorbility contracts
Process sheets Industrial and manufacturingengineering departments
Make-or-buy program Proposal
Production schedules Solicitation, proposal,production schedulingdepartment
Purchase orders Purchasing department
Material allowances
3-18

Estimates Proposal, bill of materialActual Production records of
start quantity less shippedquantity
Proratables Proposal support data
Cost-Estimating procedure Proposal, cost estimatingdepartment
Production output records Account, production control,management information system
Rework allowance Proposal support data,inspection records, qualitycontrol department, productionmanagement
Schedule backlog Production schedulingdepartment, managementinformation system
Labor efficiency report Production management,industrial engineeringdepartment
Variance from standard Cost accounting department,performance industrial engineering
department
Breakdown of raw material Inventory control department,dispersals material stores
Estimated spreadsheets Proposal support data
Departmental estimates Respective departmentmanagement
Experience curve Cost estimating department,derivations industrial engineering
department
Cost estimating Cost estimating department,worksheets industrial engineering
department
Work measurement Industrial engineeringstandards
Subcontractor Proposal, make-or-buy program,quotes purchasing department
Historical costs:Estimated and Contracting officer, directactual spreadsheets cost analysis files
3-19

Direct cost factors Prior contracts in contractingofficer's files, contractorADP files
Independent audits DCAA, private consultants,NAVPRO, AFPRO, DCAS
Manufacturing Process sheetsengineering files Manufacturing process
capabilitiesEngineering drawingsBills of materialTooling requirements
Design engineering files Product specificationsReliabilityQualityFunctionality
Engineering drawingsSpecial requirements
TemperatureHandling
Management information Summary production reportssystems Inventory Output
SchedulesLabor efficiency
Production control Production schedulesProduction output recordsMaterial allowances andaccounting proceduresBills of material for currentjobsMaterial storage and dispersalprocedures
Industrial engineering Development of cost estimatingfiles techniques
Predetermined time valuesStandard data
WorksheetsWork sampling studiesExperience curves
Process sheetsHistorical labor performancedataJob descriptions and skillbreakdownsDescription of plantfacilities and capabilities
3-20

Cost estimating Cost estimating anddepartment accummulating procedure
Departmental manpower requirementsProduct material estimatesExperience curve applicationsLabor performance factors
Quality assurance files Inspection plans andprocedures
Rework historyUnusual productspecifications
Purchasing department files Current purchasing policyPurchase ordersList of vendorsQuotes fromsubcontractors
Historical purchasing policyMake-or-buy program
Personnel Department Relative labor mix, amount,and quality
* Ratios of various labor groups
Organization characteristics
Names of key personnel andcontractor organizationterminology
Production management Labor performance reportsFiles
Definitions of laborcategories
Direct/indirectSkilled/unskilled
Top Management Explanation of questionablepolicies
Authority for capitalexpenditures
Knowledge for other datasources
3-21

Accounting department Cost breakdowns of laborfiles category versus major product
assembly
Differentiation between directand indirect costs
Breakdown of overhead items
Actual cost data (historical)
- Factors that must be considered when making judgements about the
nature of the contractors cost estimates must include:
- Past experience with similar/same product
- Make/buy situation
- State of contractors manufacturing capability (modern,labor intensive, etc.)
- Quantity to be produced
- Tolerance requirements
- Amount of development versus standard
- Product Complexity
- Contractors readiness (cold or warm base)
- Manufacturing technology required
- Inspection/test technology required
Always keep in mind the phase of the program, and recall that thelevel of effort required, and the nature of that effort, isdirectly driven by the phase the program is in, or will be in atthe time for which costs are being estimated. (Note that DoD4245.7-M, the "Transition Templates", is another excellent sourceof cost risk areas, broken down by program phase.) With all thisin mind, the analyst can move on to the next step.
3-22

INDIRECT COSTS
NLYTI TECHNIQUES
Where the data needed to capture cost of quality is not readilyavailable through the sources previously described, the parti-cular analyst will have to perform some analytical action todevelop an estimate of the cost. This is usually the case whendealing with indirect costs. This analysis can be done for adepartment, a section, a team, or for an individual. The tech-nique differs only-in the level of activity being reviewed, whichwill drive the values fc the individual components that combineto develop the estimate. The process described below providesboth an estimate of the total activity as well as an estimate ofthe cost of quality component of that activity. The technique isespecially useful when dealing with level of effort kinds ofactivity, and in the indirect areas where the costs are generallypooled.
What follows is an instruction sheet that outlines the step bystep technique. With that is an "Interview - Job Breakdown Work-sheet" that is used to capture the data. A completed exampleworksheet is also provided to illustrate the actual applicationof the technique. Note that the example is for a "non tradition-al" yuality measurement area. and should serve to reinforce thePoint that cost 2 qualitv is found in all functional areas.
3-23, , , , l I I I

INTERVIEW - JOB BREAKDOWN
STEP 1 Discuss the major functional responsibilities of the_job.
STEP 2 List the major activities performed under eachresponsibility.
STEP 3 Discuss the typical occurrence frequency of each majoractivity, usually weekly or monthly, cuarterly, etc.
- look for objective evidence of that frequency
Ex. number of drawingsnumber of reportsnumber of testsnumber of items producednumber of failuresnumber of purchase orders
STEP 4 Discuss the typical tim reuired to perform each majoractivity. Sources for these times may be:
- established standards- individual work logs.- actual observation, or a "walk through" of
the activity involved
STEP 5 Determine the period of performance for the proposedeffort. Usually will be the period of the contract.
STEP 6 Determine if the activity is a cost of quality. Ifyes, determine which category it represents.
STEP 7 Calculate the hours required:
Frequency x Hours x Period of Performance =hrs. (for each major activity)
Add up all the individual hours to arrive at a subtotal
Using professional judgment, determine factor for (ifapplicable):
- supervision (%)- miscellaneous tasks (%)
Then to subtotal Subtotal Hrsadd
Supervisibn factor x subtotal Supervision Hrsadd
Miscellaneous task factor x subtotal Misc :rs
Final Estimate _rs
3-24

INTERVIEW-JOB BREAKDOWNWORKSHEET
Functional AreaSpecific Job TitlePeriod of Performance (weeks or months)
MAJOR ACTIVITY TIME REG'D X FREQ EST N PREV APPIINT F IXT F
SUB TOTALSUPERVISION FACTOR(_)X SUB TOTAL -MISC. TASK FACTOR(-) X SUB TOTAL
TOTAL
PROPOSED HOURS ANALYSIS HOURS
COST OF QUALITY: PREVENTION APRAISAL._INT. FAILURE EXT. FAILURE
i TOTAL COST OF QUALITY -
3-25

INTERVIEW-JOB BREAKDOWNWORKSHEET
Functional Area_ PUIZC___6-_Specific Job Title M VY--Period of Performance (weeks or months) /4 cAvTA'
MAJOR ACTIVITY TIME REG'D X FREC = EST C N F, X
Y. I~P N PEAP N--rCvg CM,1LL. P MAr h, X
Iv r=A vAX w
_,(C~ 4tAA.c - .r P-a 6 - 30 P.=.- { ,,x,
- 6CZ W= 0 tr
(,M=a PPLI r 9ok0r0>I>K
00 0.. w. Z40 hTX
r,p 90
SUB TOTAL - 7o4SUPERVISION FACTOR(-) X SUB TOTAL -' AMISC. TASK FACTOR(I_-) X SUB TOTAL- 70
jTOTAL ,-77,S
PROPOSED HOURS I-Z. ANALYSIS HOURS -7IG
COST OF QUALITY: PREVENTION 2-..0 APRAISAL-OCINT. FAILURE 2 EXT. FAILURE -
[TOTAL COST OF QUALITY- 332 0
3-26

METHODOLOGY
Let's review briefly what has been presented in this chapter thusfar:
Sources for data reflecting cost of quality have beendiscussed.
Various approaches to cost accounting that a contractormay use have been described.
Cost estimating techniques for use by the Air Forceanalysts have been covered, to include another discus-sion of data sources.
An analytical technique to be used when empirical costdata, of the detail needed by the analyst, is notavailable has been provided.
Discussions and a checklist for use when making judg-ments about either proposed costs, or the analyst's ownestimate, have been included.
All the above provide the tools necessary to now develop the costof quality estimate for each functional area, and as a total forthe contractor. Using the tools and techniques described, the. analyst can follow the flow detailed in figure 3-3. The follow-ing is a narrative description of that flow.
Step 1. Review the contract. Ensure complete understanding ofexactly what is required of the contractor. Special emphasisshould be placed on cost of quality drivers. Refer to the"drivers" column in the tables provided under each function sec-tion of the handbook for help.
Step 2. Review the cost accounting approach used by the contrac-tor. Gain an understanding of exactly how the contractorcollects costs.
Step 3. Review existing data sources. Often the contractor willhave a variety of reports, logs, etc., that can provide cost ofquality figures. These figures may be usable numbers in theirown right, or may provide a basis for making an estimate of somelower level figure.
Step 4. If sources -do- not exist-such-that the analyst- can read-ily gain visibility into cost of quality, then the analyticaltechnique "Interview - Job Breakdown" should be used to developan estimate of the work content associated with cost of quality.. Note: In all likelihood, the answer to the question "sources
3-27

exist?", will be both yes and no. Sources will exist for somedata, and not for others. The analyst will find it necessary togo down D= branches, i.e., "yes" to "review costs proposed" and"no" to "apply analytical technique". Both branches lead back tostep 5.
Step 5. Apply professional judgment to the costs/activitiesproposed. Ask, "Are the costs for the right effort?" In otherwords, is what the contractor is proposing to do in line withwhat he is required to do, or should do, as a normal course ofaction in that particular functional discipline? The checklistin appendix C, "Proposal Review Checklist", will be useful inaccomplishing this step. If the answer is "yes", then ask, "Arecosts of quality evident?". If the answer to either of thesequestions is "no", then go to-step-6. If the answers to both is"yes", go to step 8.
Step 6. Verify contractual requirement. Be sure that a contrac-tual basis exists for a given effort. Beyond that, good commer-cial practice, or accepted functional discipline approach canalso be used as a judgment base for deciding the contractor hasnot proposed the correct effort. Once a requirement for theeffort is established, go to step 7.
Step 7. Submit a request for clarification or additional infor-mation. Either the contractor neglected to include informationin the proposal and can readily provide that information (inwhich case, go to step 8), or it will be necessary for the anal-yst to make an estimate of what the effort should be using theanalytical technique under step 4.
Step 8. Capture cost of quality. Now judgments can be madeabout what is proposed, or has been estimated, in terms of whatthe government wants to achieve by having cost of quality dataavailable for use as an effective management tool.
3-28

ANALYSIS METHODOLOGY
STEP I REYI EW CONTRACT
STEPR2YIEW COST ACCOUNTINGSTEP 2 APPROACH USED
STEP 3 REYI EW EXISTING]STEP3 lDATA SOURCES
SOURCES EXIST~YES [No
REVIEWCOSTSAPPLY ANALYTICAL STEP 4
STEP 5 APPLY PROFESSIONALLDVOPCS
PUALITYEDEN?-N REUS CLRFCTIOHNU DAT P
JUDGEMENT OESTIMATE
V
ARE COSTS FORNoTHE RIGHT EFFORT? N
DEEOP COST-ST CCONTRACTUAL
AND~C USIN TH TA
EQUIREMENTS YES,1 ,STEP 7
ARE COSTS OF R U AITQUALITY EVIDENT? O -RUT ADIATION L DATA
INFORMATION POIE
YES , No
STEP 8 C FA IT COT1 [TECHNQUE
0I
- A R E COSTS EXC ESSE-? 29-IS EFFORT PREVENTION _DEVELOP COSTORIENTED? !, L ESTI[MAE
-IS CONTRACTOR CAPTURINGAND USING THE DATA?
FEED COST TO TOTAL l
SCOST OF QUALMT
TOTAL COST OF QUALITY
3-29

HOW COST OF QUALITY IS SUMMARIZED
BY INDIVIDUAL PROGRAM
Basically, once the techniques described here, supported by theverification and audit activities outlined in Chapter five andthe functional evaluations in Chapter four, have been completed,then a summary of cost of quality for a particular program can beput together. All direct costs that have been identified can beadded under each--functional area, by cost of quality category.For indirect costs, either the results of the analyst's estimate,or the contractor's allocation percentage for pooled hours can beused (if more than one program is supported in the contractorplant). Again, these estimates or allocations can be added upunder each functional area, by cost of quality category. Allthese costs can then be totaled for the program, as shown infigure 3-4. Back up forms detailing each function may also bedesired. These could take the form of the "Functional Area Work-sheets" found at the end of each functional section in Chapterfive.
FOR THE CONTRACTOR'S TOTAL COST OF QUALITY
The same approach as described above for a specific program ap-plies for the total contractor cost of quality. In this case,all direct and indirect costs, by each functional area, that fallin each of the cost of quality categories is added up under eachcategory to result in the total cost of quality for the contrac-tor. The format in figure 3-4 applies for total company cost ofquality also. Again, back up sheets by function may also bedesired.
3-30

0. - TOTAL COST OF QUALITY
FOR
CATEGORY _FUNCTION PREYENTION APPRAISAL INT. FAILURE EXT. FAILURE TOTAL
PROGRAM MANAGEMENT
ENGINEERING
MANUFACTURING
FINANCE
QUALITY ASSURANCE
. SUB CONTRACT MGMT
CONTRACTS
TOTALS
AS OF DATEDATE OF LAST REPORT_
O F CHANGES -
Figure 3-4
3-31

Survey Results -
As part of the work done to develop this handbook, a telephonesurvey (copy in Appendix B) was conducted with 63 contractorsrepresenting the entire spectrum of products procured by all thebuying divisions of Air Force Systems Command. In addition,visits were made to two contractors who have made significant useof the cost of quality as a management tool. One visit was madeto a University to talk with a recognized expert in the field.
The results of all these survey activities are presented inAppendix B to give the handbook user some insight into what isthe current thinking on cost of quality. The data is obviouslyonly a sample population. As time toes on, the environment willchange and most likely a similar survey could yield differentresults. The data is presented here as an aid in thinking aboutand planning for dealings with industry in the cost of qualityarea.
S
3-32

- Functional Sections - Introduction
What follows are the detailed functional sections. Each isdesigned, when used in conjunction with the rest of the handbook,to enable the particular functional specialist to:
- identify the cost of quality in their area
- understand what drives the cost of quality
- focus on typical measures of the cost of quality
- make judgments about the costs
- Are the costs correct (right activities)?
- Are the costs reasonable (right amount;efficient)?
- Is there evidence that the costs will produce thedesired results (effective)?
A table has been constructed for each section which provides, asapplicable:
- a list of major functional responsibilities
- a list of specific activities for each major respon-sibility
- a list of cost of quality efforts for each activity
- a list of conditions/requirements that tend to drivethe cost of quality efforts
- typical measures of cost of quality effort
The purpose of the table is to enable the user to ask the rightquestions when evaluating a proposal in order to find the costsof quality. After this is accomplished, the evaluator can thenuse the worksheet provided to:
- determine those costs of quality that apply
- document the costs proposed for each effort
- document the analyst's allowed costs
- indicate the basis for judgment
0
4-1

MWe 2f these aids. and the evaluation methodoloay techniauesdibed in Charter three. applied t_ the specifics in eachfuntia a ass is the evaluator n arriving at thed results. The ela r should rely on his or her experi-ence A= Judgment when using these aides. They are not meant toprovide AU the answers. only to assist in the evaluationprocess. If the reader has n= done A thorough job 2f studyinQthe earlier sections f the handbook, pr some time has past sinceifit a" study. A review i1 stronglv recommended. Key areas arethe definitions of the primary categories of appraisal, internaland external failure, and prevention. Proper application of thedefinitions given in Chapter one will be one of the most valuablesteps in doing a cost of quality evaluation. The concept of costof quality being present in al. functional areas is also vital-toproper understanding of where the costs can be found. Typicalcosts of quality that apply to all, or most, functional areasare:
- training
- work output review
- testing
- error accounting
- procedure development/use/maintenance
- planning
The analyst should focus attention on those cost of quality con-tributors that represent major costs. It is not possible, inview of limited government personnel resources and time availableto analyze the given situation, to expect that every possiblecost contributor can be found. The 80/20 rule - or the view that80% of the cost will be found in 20% of the activities - is agood rule of thumb to follow. Again, the individual functionalanalyst's judgment must play a major role.
4-2

PROGRAM MANAGEMENT
The area of program management may appear on the surface to havelittle to contribute to the cost of quality. Remember, however,the term "output" used in Chapter one. Output refers to any-thing produced by any function in the organization, not onlyfinal product delivered to the ultimate customer. Program mana-gers produce a vast array of outputs. Looking at the typicalfunctions performed by program management, we find:
Organize
Plan
Build Team
Provide Leadership
Communicate
Control
React
* Handle Customer Relations
In performing these functions, the typical program manager must
be concerned with:
Contract Requirements
Program Plans
Risk Management
Contract Management
Configuration Management
Functional Management
Subcontractor Management
Product Performance
Accomplishing all of the functions outlined above allows theprogram manager to deal with the list of items he must be con-. cerned with. Action to build the correct team, made up of the
4-1-1

right kinds and numbers of people, will ensure that the variousfunctional activities will be provided for and accomplished. Toa very great degree the upfront work done by the program managerto build the right team, formulate the right plan, and correctlyimplement and control all activity under that plan will determinehow effective the organization is in executing the program.
Many of the activities performed by program managers are part ofthe total organization's cost of quality. Some examples are:
Prevention
- Team meetings to clearly explain contractual require-ments
- Review of "lessons learned" from past programs
- Review of team member candidates to ensure proper qual-ifications and experience
- Training (administrative people; program managementpeople)
Apraisal
- Program reviews
- Budget reviews
- Functional review support
- Design reviews
- Production readiness reviews
- Configuration reviews
Internal Failure
- Typos/spelling, etc. during plan preparation
- Missed meetings
- Missed functional coverage in plans
- Missed coverage of contractual requirement
- Internal schedule slippage
External Failure
- Incomplete/inaccurate bids or proposals
- Erroneous program status reporting
4-1-2

Late reports
- Missed reports
Program schedule slippage
Program plans and schedules are good sources for identifyingplanned program and functional reviews. Records of bid and pro-posal activity can indicate where the customer received inade-quate or erroneous information and had to ask for resubmission orclarification (External failure). Time spent by proqram Manage-ment people preparing for and participating in various functionalreviews can be determined from interviews and/or meeting minutes(Appraisal). Table 4-1-1 provides the breakout of responsibil-ities, actions, and cost of quality for program management. Theworksheets which follow the table provide a method for the ana-lyst to capture the cost of quality for a specific program.
0
4-I-3

T at1 -3
.1-1-4

IIII I I I I I I Ii i n n •
i
00
!' iii K
•I I
/,-1 -'

I~
Iie
4-1-6

COST OF QUALITY FUNCTIONAL AREA WORKSHEET
FUNCTIONAL-AREA - PROGRAM MANAGEMENT
VERED BASIS _UDGE
ACTIVITY YES NO PROPOSED ALLOWED TRENDS ACTUALS JUDGE
APPRAISAL
PROGRAM REVIEWS
BUDGET REVIEWS
FUNCTION REVIEWSUPPORT
DESIGN REVIEW
PRODUCTIONREADINESS
CONFIGURATION
.INTERNAL FAILURE
ERRORS IN PLAN
PREPARATION
MISSED MEETINGS
MISSED FUNCTIONALCOVERAGE IN PLANS
MISSED COVERAGE OFCONTRACTUALREQUIREMENT
INTERNAL SCHEDULESLIPPAGE
0
4-1-7

COST OF QUALITY FUNCTIONAL AREA WORKSHEET
FUNCTIONAL AREA - PROGRAM MANAGEMENT
VERED BASISACTIVITY YES NO PROPOSED ALLOWED TRENDS ACTUALS JUDGE
EXTERNAL FAILURE
INCOMPLETE/INACCURATEBID OR PROPOSAL
ERRONEOUS PROGRAMSTATUS REPORTING
LATE REPORTS
MISSED REPORTS
PREVENTION
TEAM MEETING TOCLARIFY/EXPLAINPROGRAM REQUIRE-MENTS
REVIEW OF "LESSONS
LEARNED"
TRAINING
SCREENING OFPROGRAM TEAMCANDIDATES
TOTALS
4-1-8

ENGINEERING
O Engineering specialties are those disciplines which support thedesign process by applying knowledge from a specific area toensure system operability in its intended environment. Thesedisciplines include, for example:
reliability
producibility
maintainability
human engineering
transportability
safety
electromagnetic compatibility
parts/materials/processes
All these specialists are integrated into the Systems Engineeringprocess. Once the customer's requirements have been clearlyestablished, it is the engineering function's job to convertthese requirements into a solution that meets those requirements.
Many of the specialist functions performed by engineering are inand of themselves directly related to the quality of the finalproduct, under reliability engineering, test engineering, andliaison engineering.
Judgments about the acceptability and appropriateness of allplanned engineering tasks and the man-hours proposed to performthose tasks will be made by the government evaluator(s) in theengineering function. As part of the evaluation of plannedtasks, the evaluator(s) should look for the presence and absenceof tasks normally associated with the cost of quality. Refer tothe second and third columns of table 4-2-1 as a guide to iden-tifying these tasks. Beyond the identification of the tasks,professional judgment concerning the resources (time, manpower,and equipment) proposed against each task is then applied. It ispossible the evaluation will result in both increases as well asdecreases being judged appropriate.
Table 4-2-1 provides a breakdown of the typical Systems Engineer-ing functions and tasks* one can expect a contractor to be per-forming. The applicability of some tasks may be dictated by theprogram phase. Others may be driven by contractual requirementsimposed by the government, as shown in the fourth column. Typi-cal measures of these costs of quality are provided in column. five.
4-2-1

Exiples of Cost of Quality in engineerin
Av~raisal (evaluate, measure, or audit output)
- Design reviews
- Drawing review
- Test audit
- Evaluate design for R M and Producibility
- Checking CAD, CAE, Drafting
- Vendor quality tracking
Failure (determine, disposition, rework, repair, scrap, correct
defective outDut)
internal (before delivery)
- Drawing errors prior to release
- Design errors prior to release
- Redesign problem solving prior to release
- Debug CAD, CAE- Drafting programs
- Test equipment failure
- MRB support
external (after delivery)
- Drawing errors after release
- Design errors after release
- Redesign problems solving after release
- Liaison calls
- Customer acceptance test
- Field return, evaluation/disposition
- Field service
4-2-2

0preven (avoid)
- Develop maintain/use of design handbooks
- Training
- Test planning and design
- Establish Quality Assurance Requirements
- Vendor qualification requirements
- Document/validate CAD, CAE, Drafting
- Test audit/set up
- Vendor surveys
Now look at table 4-2-1 for detailed breakout of major engineer-ing responsibilities, specific actions, associated cost of qual-ity, and method for capturing those costs.
4
4-2-3

III V aI Ii
', .I ' i, I I l i ;i
., l i iiIlIiI "i II ii
iiI~IiII
Ii
Table 4-2-1
4-2-4

., i
! ii
lI
Table 4,-2-1
4-2-5

L16
II II I I I I I i l
! Ii
•I
Table 4-2-1
4-2-6

I I ~IL I ! I I I a I1 Ii
* v
IIII ,nunu I I IiI

I I il I i ,1="2I I!
Iii12I I
I i!IiiSi 5
Table 4-2-1
/-.2-9

I I I II I
0 0
ii
I
Im
Table 4-2-1
4=-2-9

Iii I
j-I~. 1c
Table 4-2-1
/,-2-lfl

IIukt 'A
!I ;II I I I i
.- ilh• 1 :::3
0; I .19i I I iiiI" I0
Table 4-2-1
4-2-11

II I I ,
""I
IiIi I
Table ,;-2-1
Z-2-12

.1a
I-bli1 2 1 m m o m l

COST OF QUALITY FUNCTIONAL AREA WORKSHEET
FUNCTIONAL AREA - ENGINEERING
VERED _BASIS ,,ACTIVITY- YES NO PROPOSED ALLOWED TRENDS ACTUALS JUDGI
APPRAISAL
DESIGN REVIEWS
DRAWING REVIEWS
TEST SET UP REVIEW
TEST AUDIT
DESIGN EVALUATIONFOR R & M
VENDOR QUALITYTRACKING
CHECKING CADD, CAE,AND DRAFTING
PROCESS REVIEWS
INTERNAL FAILURE
DRAWING ERRORSBEFORE RELEASE
DESIGN ERRORSBEFORE RELEASE
REDESIGN PROBLEMSOLVING BEFORERELEASE
DEBUG CADD, CAE,DRAFTING PROGRAMS
TEST EQUIPMENTFAILURE
MRB SUPPORT
4-2-14

COST OF QUALITY FUNCTIONAL AREA WORKSHEET
FUNCTIONAL AREA - ENGINEERING
RVERED BASISACTIVITY YES NO PROPOSED ALLOWED TRENDS ACTUALS JUDGE
EXTERNAL FAILURE
DRAWING ERRORSAFTER RELEASE
DESIGN ERRORSAFTER RELEASE
REDESIGN PROBLEMSOLVING AFTERRELEASE
LIAISON CALLS
FIELD SERVICE
WARRANTY RETURNEVALUATION/DISPOS.
.PREVENTIONDEVELOP/USE
MAINTAIN HANDBOOKS
TRAINING
TEST PLANNING ANDDESIGN
ESTABLISH OAREQUIREMENTS
DOCUMENT/VALIDATECADD, CAE
TEST SET UP/AUDIT
VENDOR SURVEYS
TOTALS
4-2-15

0 MANUFACTURING
The manufacturing function consists of people with a diversenumber of disciplines and skills, who collectively utilize infor-mation and allocated resources to produce a product.
For example, the manufacturing function includes some of thefollowing skills and disciplines:
Industrial Engineering
Facilities Engineering
Manufacturing Engineering
Manufacturing Planning
Tooling Engineering
Production/Configuration Control
Software Programmers - Automated Systems/Equipment
Material Management
Computer Aided Manufacturing
Plant/Equipment/Tooling - Maintenance
Standards/Documentation Records Management
&hop Management
Crib Management
Fabrication
Process Management
Assembly
Management Information Systems Management
Manufacturing Inspection/Test
Training
Producibility
Internal Audit Management
Safety
4-3-1

Each of these activities is integrated into the overall manufac-turing process. All manufacturing activities must be consideredfor cost of quality when a company enters competition for a gov-ernment contract.
When a company is awarded a contract, it is imperative that ini-tial quality planning for the manufacturing requirements be con-ducted at the earliest practical time. Quality costs for manu-facturing must be identified for each contractual phase (i.e.,development, full scale development, low rate initialproduction). Tasks to be performed within each phase must showquality costs and persons responsible for those identified tasksmust be held accountable through a quality cost measurement sys-tem. To accomplish the manufacturing quality cost objectives anintense internal coordination and training effort is necessary.Additionally, the company business planning function must author-ize any increased scope as a result of refined understanding ofrequirements or additional investments/resources that may benecessary. The business planning function should be accountablefor reducing overhead (burden) quality costs with manufacturingcooperation and specific commitments.
If mutual understanding of manufacturing quality cost baselines,criteria, methods and objectives are in effect from the verybeginning of a program, the government and the contractor repre-sentatives for manufacturing can manage their responsibilitiesfor quality costs with effective corrective actions to reducetotal quality costs.
Every required task performed or not performed by manufacturinghas resultant cost of quality. Contractual requirements andprogram phase determine what these tasks are and when they are tobe accomplished.
Some of the more typical tasks or activities associated withmanufacturing cost of quality are listed below under the cate-gories of Prevention, Appraisal, Internal Failure, and ExternalFailure.
Examples of Cost of Quality in Manufacturina
APPRAISAL (evaluate, measure, or audit output)
- Manufacturing Inspection/Test
- Corrective Action, Material Review, and Disposition
- Parts Control Board
- Statistical Process Controls
- Cost Performance Reports 0
4-3-2

Production Readiness Review
- Manufacturing Performance Measurement
FAILURE (determine, disposition, rework, repair, scrap,
correct defective outpu)
Internal (before delivery)
- Internal/Supplier Scrap - Rework - Repair
- Rebalance - LOB system
- Improper Instructions
- Out of Station Work
- Machine, Tooling, Equipment - Downtime
- Retraining
External (after delivery)
- Field Failures
- Modification Expense
- Field Testing/Repair/Expense
- Operating Manual Changes
- Failure Reporting - Corrective Action Systems
- Lost Future Business
Prevention (avoid)
- Manufacturing Engineering - Design Coordination/
Producibility Analysis
- Risk Identification/Avoidance
- Requirements Review
- Methods, Equipment, Processes Review - IndustrialEngineering
- Production Planning
* Training
4-3-3

Table 4-3-1 provides a breakdown of typical manufacturing func-tions and tasks a contractor would be expected to perform. Theapplicability of tasks may be dictated by contractual require-ments and/or program phase. Typical measures or failure modes ofthe quality effort are provided in column five. To evaluateplanned tasks one should look for the presence or absence ofmanufacturing tasks normally associated with cost of quality.Refer to the examples in the second and third columns of table 4-3-1 to help identify these tasks.
Professional judgment concerning the resources (time, manpower,equipment, facilities) against each task must be applied. Dis-cussions between government and contractor representatives willbe needed to ensure mutual understanding. Evaluation resultingin either increases or decreases could be judged appropriatedependent upon circumstances. Quality costs must first be viewedin relationships to a task. Judgment must then include balancingcost of quality with other costs and ensuring that reduction of adirect cost does not result in an unplanned increase of indirectcost or increased cost to another function. Conversely, an in-creased manufacturing quality cost may result in unplanneddecreased costs to another function or to decreased overheadcosts. Manufacturing cost of quality must always be categorizedto have functional meaning/application to manufacturing. Howthat feeds into cost centers and accounting conventions is yetanother problem that must be resolved, (e.g., how to link themanufacturing data base to the financial data base).
Manufacturing plays a key role in ensuring that the product itproduces conforms to the design consistently and correctly overthe life of the product with low production and maintenance cost.Cost of quality management efforts can play a significant part inthe successful accomplishment of that role.
4-3-4

I I illl II III I i
Ii 1 111I 4
I I II I IIIIII i

IIII II I i I ,
IIIII I I I
I I I li
II Iii,
I I
ma2 - --

I i i I I I I i
'"I• -.
i i
• , LiI I I! I I

I I
4-3-8

COST OF QUALITY FUNCTIONAL AREA WORKSHEET
FUNCTIONAL AREA - MANUFACTURING
COVERD 0 BASISACTIVITY YES NO PROPOSED ALLOWED TRENDS ACTUALS JUDGE
APPRAISAL
MANUFACTURINGINSPECTION/TEST
MATERIAL REVIEWBOARD
PARTS CONTROLBOARD
STATISTICAL PROCESSCONTROLS
COST PERFORMANCEREPORTS
PRODUCTION
READINESS REVIEW
WORK MEASUREMENT
*REVIEWS/AUDITS
INFORMATION SYSTEMS
MANUFACTURINGSTABILITY - LOB
INTERNAL FAILURE
INTERNAL/SUPPLIER - SCRAP-REWORK - REPAIR
REBALANCE -LOB SYSTEM
IMPROPER INSTRUC-.TIONS
OUT OF STATIONWORK
0
4-3-9

I COST OF QUALITY FUNCTIONAL AREA WORKSHEET
FUNCTIONAL AREA - MANUFACTURING
COVERED BASISACTIVITY YES NO PROPOSED ALLOWED TRENDS ACTUALS JUDG
MACHINE, TOOLING,EQUIPMENT -DOWNTIME
RETRAINING
MATERIALSUBSTITUTION
ENGINEERING CHANGES
SET UP FORREWORK - REPAIR
WRONG CONFIGURATION
EXTERNAL FAILURE
FIELD FAILURES
MODIFICATIONEXPENSE
FIELD TESTING,REPAIR, EXPENSE
OPERATING MANUALCHANGES
FAILURE REPORTING -CORRECTIVE ACTIONSYSTEMS
LOST FUTUREBUSINESS
SUPPLIER ASSISTANCE
LABORATORYTESTING
SHIPPING COSTS
TRAVEL COSTS
4-3-10

COST OF QUALITY FUNCTIONAL AREA WORKSHEET
FUNCTIONAL AREA - MANUFACTURING
COVERED BASISACTIVITY YES NO PROPOSED ALLOWED TRENDS ACTUALS JUDGE
PREVENTION
MANUFACTURINGENGINEERING -DESIGNCOORDINATION/ANALYSIS
RISK.IDENTIFICATION -AVOIDANCE
REQUIREMENTSREVIEW
METHODS, EQUIPMENT,PROCESSES REVIEW
PRODUCTION PLANNING
TRAINING
.INITIAL QUALITYPLANNING AND QIP
WORK INSTRUCTIONS
SAFETYREQUIREMENTS
DETERMINATION "CRITERIA -CHARACTERISTICS
TOTALS
4-3-11

Finance
The financial and/or accounting departments represent the moneyside of business management. Typically, the people who work inthis function are charged with many responsibilities whichinclude, but are not limited to tracking, profit and loss,income, capital worth, cash flow, tax accounting, cost accountingand control, inventory control, accounts payable and receivable,asset conservation, many forms of budgets, and financial policyand forecasting. Accounting reports are financial explanationsof what has happened in the conduct of the company's business.In the case of budgets and some other reports, a forecast of theoperation and conduct of the business in the future is beinggenerated.
As is the case with other groups within an organization,(e.g.,legal or computer operations), a language unique to financeis often used. The analyst should become as familiar with theterms and words used by the particular contractor as possible.The primary purpose in any review of the financial area is toinsure that you fully understand what you examine or are told.You must not only determine what is explained by the numbers, butalso be keenly aware of what can be concealed. It is alwaysacceptable to request additional explanation if you do not fullyunderstand the data or information presented.
Developing cost of quality in any functional area, especially awhite collar area, will involve some amount of judgment on thepart of the analyst. For example, in business today, consider-able effort has been directed toward reducing direct costs bymeasuring and controlling the process that produces the product.Meanwhile, overhead costs have continued to increase. Today itis likely to have a condition where white collar cost of qualityexceeds cost of quality of blue collar workers. The cost ofQuality Functional Area Worksheet which follows Table 4-4-1provides some guidance to the analyst within the financial area.Keep in mind, there will probably be other costs within eachcategory that are specific to the company under review. Theinformation will, in many cases, not be quantifiable in dollarsor hours from actual data available. Judgments must be usedbased on observation, or the experience of the analyst. Use ofthe technique provided in Chapter 3 is recommended. Examples ofcost of quality in Financial Management are:
Appraisal (evaluate, measure, or audit output)
- audits, financial
- time and attendance review
0
4-4-1

accounts payable reviews
accounts receivable reviews
invoicing reviews
capital expenditure reviews
order entry and business backlog reviews
ledger reviews
Failure (determine, disposition, rework, repair, correct
defective output)
Internal (before delivery)
- invoicing errors
- invoicing delays
- uncollected receivables
- accounting errors corrected
- payable discounts not realized
External (after delivery)
- invoicing errors
- payroll errors
- accounts payable errors - vendor relations
- excess telephone expense
- premium expenses, freight and interest, raw mater-ial, prepayment
Prevention (avoid)
- education, internal training, and external jobrelated training
- budget preparation
- new product cost and selling price planning
- systems analysis and flow chart preparation
- quality cost system development
4-4-2

The judgment required to develop an informed opinion and conclu-sion should take into account any quality costs that are notincluded in the hours or dollars that are proposed. Also detailsof planned tasks should be examined to determine if costs inexcess of those required are proposed. Special attention shouldbe paid to the costs of Quality associated with contractualrequirements.
Table 4-4-1 and the worksheet following the table, should be usedto facilitate the analyst's review. The evaluation that isdeveloped will of necessity be the result primarily of theprofessional judgment, deduction and conclusions of the analyst.Use the methodology outlined in figure 3-3.
0
4-4-3 i

I SIIIIIII I I III
I!I
4-4-4

SIl~iliJil~ ii I~il
4-4-5

giIg11l i1i t1i tfI II I I II I I II I I I I
i iifi idh h.Ii i,,, Iii ii~ dIi! Iii.il
I I III1 I!
I :a eI

1111
III I I I II I
IS
0.1!
Table 4-4-1
• ' , ii I I I I II 4-4-7

InIi I a
ib-
P-
LT ab I
0= I
Ii.' -

COST OF QUALITY FUNCTIONAL AREA WORKSHEET
FUNCTIONAL AREA - FINANCE
COVERED_ BASISACTIVITY IYES NO PROPOSED ALLOWED TRENDS ACTUALS JUDGE
APPRAISAL
AUDITS, FINANCIAL
TIME ANDATTENDANCE REVIEW
ACCOUNTS PAYABLEREVIEWS
ACCOUNTS RECEIVABLEREVIEWS
INVOICING REVIEWS
CAPITALEXPENDITURE REVIEWS
ORDER ENTRY ANDBUSINESS BACKLOGREVIEWS
LEDGER REVIEWS
INTERNAL FAILURE
INVOICING ERRORS
INVOICING DELAYS
UNCOLLECTEDRECEIVABLES
ACCOUNTING ERRORSCORRECTED
PAYABLE DISCOUNTSNOT REALIZED
0
4-4-9

COST OF QUALITY FUNCTIONAL AREA WORKSHEET
FUNCTIONAL AREA - FINANCE
V RE BASIS ___
ACTIVITY YES NO PROPOSED ALLOWED TRENDS ACTUALS JUDGE
EXTERNAL FAILURE
INVOICING ERRORS
PAYROLL ERRORS
ACCOUNTS PAYABLEERRORS - VENDORRELATIONS
EXCESS TELEPHONEEXPENSE
PREMIUM EXPENSES,FREIGHT ANDINTEREST, RAWMATERIAL,PREPAYMENT
PREVENTION
EDUCATION, INTERNALTRAINING, ANDEXTERNAL JOBRELATED TRAINING
BUDGET PREPARATION
NEW PRODUCT COSTAND SELLING PRICEPLANNING
SYSTEMS ANALYSISAND FLOW CHARTPREPARATION
COST OF QUALITYSYSTEM DEVELOPMENT
TOTALS
0

0QUALITY ASSURANCE
Quality Assurance entails all those functions required toestablish procedures and integrate program plans for achievingand maintaining the required level of product quality,reliability, and compliance with all customer requirements.Generally speaking, a quality organization will consist ofdepartments or divisions responsible for:
- Quality Administration
- Quality Engineering
- Quality Operations
- Supplier Quality
- Metrology/Laboratory Support
A given quality organization will usually reflect some groupresponsible for each of these functions, although some may becombined with others. From a cost of quality perspective,. everythinQ done under the quality assurance function is part ofthe cost of quality. Many of the activities are done inconjunction with other functions, particularly engineering andpurchasing. All activities will fall in one of the four majorcost of quality categories.
The first step for the analyst is to evaluate the overallproposed quality assurance organization and the functionalactivities that are covered. Table 4-5-1 can be used as an aid,for both a generic list of major responsibilities and specificactivities, as well as identifying drivers from a contractualrequirements point of view. Questions to ask are:
- Are there any functions not covered by the proposedsystem?
- Are there any functions proposed that are not needed?
- Are all contractual requirements covered?
- Is there current evidence, resulting from ContractAdministration Service surveillance, of eitherstrengths or weaknesses in the existing/proposedsystem?
4-5-1

The second step is to look at the hours proposed for eachfunction. Often the contractor will project certain functionalhours as a percent of some other hour base, such as direct laborhours. Here are some typical basis for proposed hours.
Functional Hours Basis for Proposal
Inspection % of direct labor
direct inspector hours
Test planned test hours
Quality Engineering - % of direct labor
% of direct inspection
labor
ratio, QAEs to operators
Vendor Quality projected lots shipped
number of suppliers
Many of these functions became level of effort activities and itis difficult to judge what their level should be. Using the"Interview - Job Breakdown" technique described in Chapter three,the evaluator can arrive at a estimate of the actual hoursrequired.
4-5-2

I*iIIII !I jiI I!
I I I I I I IIIIIl
I iI
I4 I0 '.-.. sInuI I II II --

LLII I I l i I I I I i,
ji I I
I I I I I I *I I III
~Ii
IsI
45
I I •. ,•i IIIII i

"I W I lii.. .
d 3ii4-5-
"" ' III I I I II

II I I I I l m. . .
1]I I
-iii i d ,, , iII I I I I

• iILII
4-5-7

I COST OF QUALITY FUNCTIONAL AREA WORKSHEET
FUNCTIONAL AREA - QUALITY ASSURANCE
VERED _BASIS
ACTIVITY YES NO PROPOSED ALLOWED TRENDS ACTUALS JUDGE
APPRAISAL
INSPECTION
TEST
MONITOR TESTS
SYSTEMS AUDIT
DATA ANALYSIS
VENDOR AUDITS
DESIGN REVIEWS
INTERNAL FAILURE
CORRECTIVE ACTION
MATERIAL REVIEW
SCRAP
REWORK
REPAIR
EXTERNAL FAILURE
CORRECTIVE ACTION
VENDOR VISITS TORESOLVE PROBLEMS
VENDOR REJECTS
DETERMINE WARRANTYCOVERAGE
4-5-8

COST OF QUALITY FUNCTIONAL AREA WORKSHEET
FUNCTIONAL AREA - QUALITY ASSURANCE
COVERED ____REDBASIS
ACTIVITY YES NO PROPOSED ALLOWED TRENDS ACTUALS JUDGE
PREVENTION
QUALITY IMPROVEMENT
PROJECTS
METROLOGY
TRAINING
SUPPLIERQUALIFICATION
TEST PROOF OUT
QUALITY PLANNING
QUALITY ENGINEERING
TOTALS
0
4-5-9

0Subcontractor ManagementThe supplier of products, materials, and services, as well asnon-product services, can be defined as the source from which theproducer obtains many of goods and services required to operatethe company. The terms supplier, vendor, seller, furnisher,dealer, wholesaler, retailer, distributor, and importer, amongothers, are used, interchangeably in many areas, to describe thesource of materials and services. Usually government contractorsuse the terms vendor, suppliers, or subcontractor. In the caseof standard materials and services, those which are common andhave established standards, incoming inspection is typicallyappropriate for the certification and assurance of conformance.This is also generally applicable to minor components normallybuilt to industry standards, but which may have specificationsfrom the buyer or vendor. The requirements differ, however,where major products or services are concerned.
When major procurements are made, a different and more involvedrelationship is required between the prime contractor and thesubcontractor. The materials in question are typically sophis-ticated and the time frame for delivery and use precludes thepossibility of establishing a specification and providing incom-ing inspection at the proscibed delivery date to insure confor-mance. The buyer must establish a closer relationship with thesupplier to insure that all aspects of the procurement are asclosely managed, almost as if the product or service were actual-ly made or produced at the prime contractors' facility utilizingemployees of the prime contractor.
According to J.M. Juran, the establishment of the relationshipfor major purchases may consist of as many as 10 particularefforts. They are:
1. Establish a vendor Relations Q-policy.
2. Use multiple vendors for major procurements.
3. Establish a formal vendor qualification process.
4. Conduct joint quality planning; agree onresponsibilities.
5. Establish two-way communication.
6. Set up to detect and remedy deviations.
7. Conduct vendor surveillance.
4-6-1

8. Exchange inspection data; provide certification.
9. Under take improvement programs set up materialassistance.
10. Create and use vendor quality ratings.
Not all of these efforts will be necessary in every purchase, butthis listing can serve as a checklist. Judgement will berequired to determine which of these requirements should orshould not be met and the cost associated with the function. Thesuccessful application of these efforts toward excellence in theproduct or service delivered represent the subcontract qualityresponsibility and the costs associated will be the subcontractcost of Quality. A major driver is usually MIL-STD-1535A. Exam-ples of cost of quality in Subcontractor Management are:
Appraisal (evaluate, measure, an audit output)
- product quality audits
- in process and test inspection reviews
- manufacturing instruction reviews
- final source inspections
- vendor rating system
- combined MRB activities
- production readiness reviews
Failure
Internal (before delivery)
- redesign
- engineering change requirements
- additional equipment requirements
- purchase contract amendments
- excess travel and communication expense

External (after delivery)
- scrap
- rework
- returned goods replacement costs
- reinspection
- retesting
- increased transportation expense
Prevention (avoid)
- joint quality planning
- supplier quality systems reviews
- production risk assessments
- quality requirements for vendor contract
- personnel training
- packaging reviews
Judgement is essential in the evaluation of the subcontract func-tion. It will seldom be possible to find easily all costsassociated with the vendor relations and subcontract managementresponsibilites. Following Table 4-6-1 is a cost of qualityfunctional Area Worksheet which will provide some examples ofactivities that might pertain to your evaluation of the function.These do not include all areas for evaluation. Each review willhave costs specific to the business and operation involved. Aneffort must be made to indentify each and apply hours or dollar-ized costs as required. In some areas where hard, detailed costshave not been accumulated, or are part of aggregate costs forsome other purpose, it will be necessary to estimate, observe orcalculate to determine the cost of quality in question. Wheninterviews and observations are required for making judgementsthe Job Breakdown Worksheet (described in Chapter three) can behelpful. In developing appropriate quality costs, it is impor-tant to evaluate the activities individually and determine thatall activities are included and have not been overlooked or dis-. counted and that all costs presented are in fact applicable.Also, be sure all contractual requirements have been included.
4-6-3

Considerable effort and expense has successfully been expended oncontrolling quality in the "manufacturing" cycle. Recent experi-ence indicates that an equal or larger amount of contrcllablequality costs are lodged with the "white collar" functions. Infact, quality costs incurred by those who use pencils and tele-phones are as significant as those incurred by machine operatorsand manufacturing personnel. Less effort and resource have beenapplied to recognizing and capturing the cost of quality in thewhite collar functions, but it is clear that process control forbusiness processes, such as vendor review programs or deliveryschedule reviews in the subcontract management function, can besuccessfully applied.

* IN ll D b Dii N
I I I I I'H 1~I:I~ . e
4-6-5

I iic
4-6-6

COST OF QUALITY FUNCTIONAL AREA WORKSHEET
FUNCTIONAL AREA - SUBCONTRACT MANAGEMENT
COVERED BASISACTIVITY YES NO PROPOSED ALLOWED TRENDS ACTUALS' JUDGEi
APPRAISAL
PRODUCT QUALITYAUDITS
IN PROCESS ANDTEST INSPECTIONREVIEWS
MANUFACTURINGINSTRUCTION REVIEWS
FINAL SOURCEINSPECTIONS
VENDOR RATINGSYSTEM
COMBINED MRBACTIVITIES0!INTERNAL FAILURE
REDESIGN
ENGINEERING CHANGEREQUIREMENTS
ADDITIONALEQUIPMENTREQUIREMENTS
PURCHASE CONTRACTAMENDMENTS
EXCESS TRAVEL ANDCOMMUNICATIONEXPENSE
0
-6-7

COST OF QUALITY FUNCTIONAL AREA WORKSHEET
FUNCTIONAL AREA - SUBCONTRACT MANAGEMENT
OCVERED .__Y BASIS _
ACTIVITY YES NO PROPOSED ALLOWED TRENDS ACTUALS JUDGE
EXTERNAL FAILURE
SCRAP
REWORK
RETURNED GOODSREPLACEMENT COSTS
REINSPECTION
RETESTING
INCREASEDTRANSPORTATIONEXPENSE
PREVENTION
JOINT QUALITYPLANNING
SUPPLIER QUALITYSYSTEMS REVIEWS
QUALITYREQUIREMENTS FORVENDOR CONTRACT
PERSONNEL TRAINING
PACKAGING REVIEWS
TOTALS
0
4-6-8

LOGISTICS
Logistics is an integral part of the acquisition of any new wea-pon system. The system's support must be integrated into thedevelopment process, so the term Integrated Logistics Support(ILS) refers to the management and analysis actions necessary toassure effective and economical support of a material system,both during the various phases of development through deploymentand disposition.
Specific areas must be considered in accomplishing the ILS pro-cess. DoD Direct 5000.39 defines nine (9) elements of ILS asfollows:
Maintenance Plan
Manpower and Personnel
Supply Support
Support and Test Equipment
Training and Training Devices
Technical Data
Computer Resource Support
Packaging, Handling, Storage, and Transportation
Facilities
The contractor will normally be tasked with the requirement toperform Logistics Support Analysis (LSA) as the formal process ofexamining the weapon system and ensuring that all the logisticssupport elements are considered. Government decisions regardingthe maintenance concept are critical to determining the nature ofa majority of the other elements. The maintenance plan tends todrive all the other elements.
The government's ILS plan will provide specific task orientedguidance to the contractor regarding what must be done to planfor and adequately cover the nine ILS elements. Typical activi-ties are:
Maintenance Concept Analysis
* Lessons Learned Review
4-7-1

Develop Maintenance Allocation Chart
Technology Assessment
Built in Test
Automated Test Equipment
System Diagnostics
Organic versus Commercial Support
Deployment Analysis
Facilities Requirements Analysis
Training Analysis
The nature of these tasks, relative to their output, changes asthe program moves through the various phases of the acquisitionprocess (see table 3-1). Generally the activity moves from anal-ysis, to initial recommendations, to firm commitment to a givensupport approach, resulting in actions to provide the neededresources (equipment, parts, training, facilities, etc.).Throughout the entire process, cost of quality will be incurred.Examples of these costs are given below.
Appraisal (evaluate, measure, or audit output)
- ILS milestone progress review
- Individual LSA analyses review
- Equipment design review
- Facilities plan/design review
- Technical data review
- Training material review
Failure (detection, disposition, rework, repair, scrap, correct
nonconforming output)
Internal (before delivery)
Planning errors
LSA analysis not complete
LSA analysis errors

Facility power requirements not covered
- Technical training requirements overlooked
Technical data schematic errors
External (after delivery)
- Errors in plan submitted to government
- Errors/omission from LSA documents
- Sneak circuit in test equipment
- Facility met the design, but is inadequate
- Technical order errors (typos, omissions, incorrectlogic in trouble tree, etc.)
- Training not current with latest configuration ofequipment
Prevention (avoid)
- Training of LSA analysts
- Up front planning
- Development of handbooks
- Debug/proofing of computer models prior to actual usein LSA effort
- Review of lessons learned
Now look at table 4-7-1 for a detailed breakout of typical majorresponsibilities, activities, drivers, and cost of quality mea-sures for the logistics area. A worksheet to assist in capturingcost of quality is also provided.
4-7-3

I I
!
Ili
I i I!IIilIi.IwIliill
• • ll a l I I I I I
P ih

* I I l li
Iic
W I I I l i I I I I I
4-7-5

i I.I,
I!!I!

COST OF QUALITY FUNCTIONAL AREA WORKSHEET
FUNCTIONAL AREA - LOGISTICS
A IOVERED BASISACTIVITY YES NO PROPOSED ALLOWED TRENDS ACTUALS JUDGE
APPRAISAL
ILS MILESTONEPROGRESS REVIEW
INDIVIDUAL LSAANALYSES REVIEW
EQUIPMENT DESIGNREVIEW
FACILITIES PLAN/DESIGN REVIEW
TECHNICAL DATAREVIEW
TRAINING MATERIALREVIEW
INTERNAL FAILURE
PLANNING ERRORS
LSA ANALYSIS NOTCOMPLETE
LSA ANALYSIS ERRORS
FACILITY POWERREQUIREMENTS NOTCOVERED
TECHNICAL TRAININGREQUIREMENTSOVERLOOKED
TECHNICAL DATASCHEMATIC ERRORS
4-7-7

COST OF QUALITY FUNCTIONAL AREA WORKSHEET
FUNCTIONAL AREA - LOGISTICS
VERED BASISACTIVITY YES NO PROPOSED ALLOWED TRENDS ACTUALS JUDGE
EXTERNAL FAILURE
ERRORS IN PLANSUBMITTED TOGOVERNMENT
ERRORS/OMISSIONFROM LSA DOCUMENTS
SNEAK CIRCUIT INTEST EQUIPMENT
FACILITY MET THEDESIGN, BUT ISINADEQUATE
TECHNICAL ORDERERRORS (TYPOS,OMISSIONS, INCOR-RECT LOGIC INTROUBLE TREE, ETC.)
TRAINING NOTCURRENT WITHLATEST CONFIGUR-ATION OF EQUIPMENT
PREVENTION
TRAINING OF LSAANALYSTS
UP FRONT PLANNING
DEVELOPMENT OFHANDBOOKS
DEBUG/PROOFING OFCOMPUTER MODELSPRIOR TO ACTUALUSE IN LSA EFFORT
REVIEW OF LESSONSLEARNED
TOTALS _

CONTRACTS
The contracts function makes a very substantial contribution tothe cost of quality. Although the responsibilities of the con-tracts organization will probably vary from contractor to con-tractor, it generally is the primary legal link to the govern-ment. Through the contract, the terms and conditions, specifi-cations, tasking and financial aspects of the contractor -government relationship become binding on both parties. Theeffect of errors in any of these elements can have a directfinancial impact on both parties. A list of typical functionsperformed by contracts might look like this:
Proposal Preparation
Pricing
Negotiation
Contract Administration
Invoice/Progress Payment Submission
. Although these functions may not always be performed by the con-tracts organization, they represent the range of functions thatcould be performed there.
By the very nature of these functions, extensive interaction withother areas is required in order to convert the government'srequest for proposal (RFP) into a profitable contract that meetsthe customer's requirements. Since contracts is generally thefinal link in the chain which establishes the legal relationshipwith the government, its contribution to the cost of quality canbe significant. Errors committed in the pricing and negotiationof the contract are not easily remedied.
Following is a list of activities which become part of the costof quality.
Prevention
- Training (administrative, technical, and management)
- Development of handbooks and aids to job performance
- Development of plans and strategy
- Team meetings and effective communication of plans and
is strategies
4-8-1

A22raisal- Reviews of documents and negotiation positions
- Reviews of compliance with requirements
- Audits of pricing accuracy
- Reviews of submissions to the government
Internal Failure
- Errors in preparation of documents
- Negotiation errors
- Failure to meet internal milestones
External Failure
- Inaccurate or incomplete proposals or contracts
- Late proposals or contract submittals
- Defective pricing
- Incorrect submissions
Contract and correspondence files are good sources of informationon external failures. Records relating to proposal activity mayindicate where internal failures occurred during preparation ofproposals. Requests for clarification or notices of deficienciesin proposals will indicate external failures. Depending on wheresuch information is found, rejected progress payment requests,corrected requests, and rejected and corrected invoices will alsoindicate external failure. Additional information can always beobtained through interviews with persons involved with theseactivities. Table 4-8-1 describes the major responsibilities,activities and cost of quality for the contracts function. Aguide for analysis of the cost of quality is provided by thefunctional area worksheet. It is not meant to be all inclusive,but is a starting point and must be adapted to each organizationevaluated.
0

* ~i7I I I I I I
I~d I
II ~ iii i;I Ihi; diI ~ I
~ Ii~.I
.11 Iace .- 3-1
4-8-3

II I I i
ii 'lll+ N++ i!+ i +
Table /4-S-I,

V55
I I I I I I I 1
I I
.1 i I
I Im 1a Z L-8-

COST OF QUALITY FUNCTIONAL AREA WORKSHEET
FUNCTIONAL AREA - CONTRACTS ____ __________
VRED BASISACTIVITY YESNO PROPOSED ALLOWED TRENDS ACTUALS JUDGE
APPRAISAL
PRE NEGOTIATIONREVIEWS
CONTRACT DOCUMENTREVIEW
CHECK PROPOSAL VS.RFP
CHECK FOR PRICINGERRORS
CHECK FOR CURRENTPRICING DATA NOTSUBMITTED
REVIEW STATUS OFCONTRACTDELIVERABLES
COMPARE ACTUAL ANDREQUIRED DELIVERYDATES
CHECK INVOICES/PROGRESS PAYMENTREQUESTS FORACCURACY
INTERNAL FAILURE
PROPOSAL ERRORSPRIOR TO SUBMISSION
NEGOTIATION ERRORS
CONTRACT ERRORSPRIOR TOSIGNATURE
INVOICE/PROGRESSPAYMENT ERRORSDUE TO SUBMISSION
4-8-6

COST OF QUALITY FUNCTIONAL AREA WORKSHEET
FUNCTIONAL AREA - CONTRACTS
VERED BASISACTIVITY YES NO PROPOSED ALLOWED TRENDS ACTUALS JUDGE
EXTERNAL FAILURE
PROPOSAL ERRORSAFTER SUBMISSION
POST AWARD AUDITREPORTS(DEFECTIVE PRICING)
CORRECTIONS TOCONTRACTS
CLAIMS
LAWSUITS
LATE PROPOSALS
REJECTED OR DELAYEDPROGRESS PAYMENTREQUESTS
O REJECTED INVOICESOR DELAYED PAYMENT
PREVENTION
TRAINING
DEVELOP HANDBOOKS,CHECKLISTS, ANDGUIDES
PROPOSAL/NEGOTIATIONMEETINGS AND PLANS
COORDINATION OFNEGOTIATIONPOSITION/STRATEGY
TOTALS
0
4-8-7

IMPLEMENTATION
Programs which call for cost and schedule reporting as a contrac-tual requirement provide a ready source for first, getting visi-bility into specific costs of quality, and second, monitoringthose expenditures. Looking at the way that the contractor typi-cally generates the cost data, it is obvious that referring tothe individual work packages is one step toward finding readilyavailable cost data (figure 5-1).
%-,L~ r"T WORK BAKDOUN' STRUME.J
.... T...1,JNCrONAL. ORANI.ATION F.A
INTEGRATIOtq OF CWBS AND ORGANIZATIONAL STRUCTURE.
Figure 5-1
5-1

Work packages constitute the basic building blocks used by thecontractor in planning, controlling, and measuring contract per-formance. In addition, if the contractor has established costaccounts, at a level just above work packages in his contractorwork breakdown structure, then detailed costs from both a pro-posed and actual view may be available. Keep in mind that alldirect costs are accumulated in cost accounts. Current criteriado not require recording of indirect costs at this level. How-ever, overhead pools and corresponding budgets must be designatedand the methods used for allocation clearly defined anddocumented. Unfortunately, level of effort work has noestablished criteria for determination of acceptable levels.Often we find that the work involved with cost of quality islevel of effort. For example:
Engineering
- FRACAS
Quality
- QA Engineering problem solving
Once cost analysis has been performed and the costs proposed havebeen evaluated, the negotiations completed, and a contractawarded, performance against the budget is tracked. From a costof quality point of view, we are concerned that the costsexpended produce the desired results. The desired results areachievement of the contractual quality requirements, that is, theestablishment and implementation of an effective and efficientquality program. Effectiveness is measured by the performanceindication discussed in Chapter one and outlined in table 1-4.The trends must reflect that the quality effort is achieving anacceptable level of quality and is improving that level overtime. Each functional analyst's professional judgment must beapplied to determine the acceptability of the level of budgetedresources. Efficiency is measured by whether the resourcesbeing expended are the optimum for the results achieved.
Focus must be placed on analysis of variances that occur betweenbudgeted and actual costs over the life of the contract. Ifquality performance indicators are high, or trends are up, theanalyst must verify that the planned resources, assuming analysisshowed their level to be correct, are indeed being applied.Using the techniques and worksheets described in each of theindividual functional sections in Chapter five is the next step.
Programs covered by MIL-STD-1567A, Work Measurement, offeranother source of data that is useful in cost of quality anal-ysis. The essence of work measurement can be summed up in the
5-2

concepts of variance analysis and methods improvement. Onceengineered standards have been established for work performed,analysis of those variances that occur from the standard shouldbe aimed at finding and eliminating the cause of the variance.If the contractor's actuals show a consistent performance levelabove the standard hour content, the variance allowance canreveal cost of quality contribution. For example, is the processso difficult to control, to ensure that it produces conformingproduct, that extra care and time is needed by the operator, thuscausing the variance from standard? This is a prevention costcontributor. If the variance is due to excessive rework orrepair action, this is a failure cost contributor. Looking atthe variance analysis can be very helpful when doing cost ofquality analysis. In addition, if the contractor puts into placemethods improvements, besides the expected benefit of loweringthe standard, the result may well be a more capable andcontrollable process. Contribution to the prevention of errorsis evident. The initial investment, or a portion thereof, canbe legitimately counted as a cost of quality. Training of oper-ators, both to better control the old process, or properly imple-ment the new methods, is also prevention cost of quality.
POSSIBLE CONTRACTUAL CAUSE APPROACHES
In its present form, MIL-Q-9858A, paragraph 3.6, which clearlyestablishes the requirement for collecting and making availablecost of quality data, is subject to a good deal ofinterpretation. As discussed under requirements in Chapter two,.pages 2-6 and 2-7, even the government's interpretation has senta message to contractors that FAILURE costs associated withscrap, rework, and repair are the only costs actually required.Turning to MIL-STD-1520C, the requirement also is specific onfailure cost, but leaves selection of "other costs as determinedappropriate by the contractor". At this time, the best way toobtain the desired cost of quality effort on the part of a con-tractor, assuming he is not willing to adopt a wider interpreta-tion of existing requirements, is through specific contractuallanguage.
There are several approaches that could be used when consideringhow to both obtain the desired results and to positively motivatethe contractor to perform in the manner that maximizes benefitsof using cost of quality as a management tool. Request for pro-posal instructions to offeror must provide proper emphasis.After investigating various options, the methods recommended hereconsist of suggested contractual clauses, statement of work pro-visions, or combinations of both. It is generally agreed thatprofit is an effective motivator. Offering a contractor an awardfee, based on performance in the cost of quality management area,then becomes one approach. Getting a contractor into a "preven-tion mode" will have significant benefits for the life cyclecosts of his product, and would more than offset the cost of theaward fee. Making the fee a portion of the profit allowed on the. contract then ties it to the normal cost experienced by thegovernment, as opposed to an "over and above" amount. But
5-3

offering an over and above amount could also enhance the motiva-tional effectiveness of the fee. Obviously, it increases theinitial cost to the government, but again, the overall reductionin life cycle costs will more than offset this front endincrease. In addition, the total cost of quality, as discussedin Chapter one, figure 1-15, will decrease as the contractor getsinto the prevention mode, thus offsetting the cost of any awardfee.
What follows are examples of "suggested" contract clauses, andstatement of work provisions. Appendix E provides copies ofactual award fee wording from two contracts used in Air Forceprograms. The program identifying characteristics have beenremoved from each example. A logical consideration to follow anaward fee program, designed to get the contractor's managementfocus on moving towards a prevention mode, would be a sharedsavings program. Approaches currently used in the industrialmodernization incentive program could be modified. Once thefocus was on prevention, the reductions obtained in the cost ofquality total could then be shared. The share approach couldtake a variety of forms, and could be tied to other factors suchas improving reliability and/or reduction in field failures.Total cost of quality can run anywhere from 10% to 30% of sales,so shared reductions represents a significant amount of money.
SUGGESTED CONTRACTUAL CLAUSES
In order to ensure that the contractor captures cost of qualityin all the categories, i.e., prevention, appraisal, and internaland external failure, the following clauses are suggested.
CLEAR DEFINITION OF COST OF OUALITY DATA
"Cost of Quality. For the purposes of this contract, the con-tractor shall capture cost of quality under MIL-Q-9858A, para-graph 3.6 in a manner which segregates the cost for prevention ofdefective output and the correction of defective output (to bereferred to as failure costs). Under paragraph 3.4, the contrac-tor shall capture the costs associated with the effort expendedto generate the quality information for which records arerequired, i.e., the appraisal of the processes which result inthe final product. These costs shall be made available underauthority of paragrah 36. The requirement for prevention andcorrection costs is clearly stated in paragraph 3.6. Costsassociated with appraisal activity necessary to produce therecords of quality status essentially represent the costs associ-ated with the quality department inspection, audit, and testresources. Under authority of paragraph 3.5, these costs ofquality will be used by the contractor as a management tool toassist in exercising responsibilities for detection, correctionof assignable causes across the entire organization as well as atsuppliers, trend analysis aimed at prevention, and monitoring ofthe effectiveness of corrective action".
•~~ , MENEM II

. NCUION Qf SPECIFIC REOUIREMENTS DRIVING COST OUALITY
"Beyond requirements covered under MIL-Q-9858A, the contractorshall segregate all costs associated with the following efforts,as applicable, and include these costs as part of his cost ofquality management program:
MIL-STD-1520C Correction of Non-Conforming Material
MIL-STD-45662 Metrology
MIL-STD-1535A Control of Subcontractor quality
*MIL-STD-1567A Work Measurement
*MIL-STD-1528A Manufacturing Management
MIL-STD-100 Engineering Drawings
MIL-STD-810D FRACAS/FMEA
Environmental Stress Screening
Hardware Quality Audit
* Statistical Process Control
*Only the costs of collecting data, evaluating it, and act-ing to correct and prevent problems. Does not include costof establishing the work measurement or manufacturingmanagement program.
These costs shall include effort expended by all functionsassociated with the accomplishment of the specific tasks drivenby these government specifications/standards."
STATEMENT OF WORK PROVISION
If the use of either of these suggested clauses is not suitable,another option would be to specify what is required in the state-ment of work.
5-5
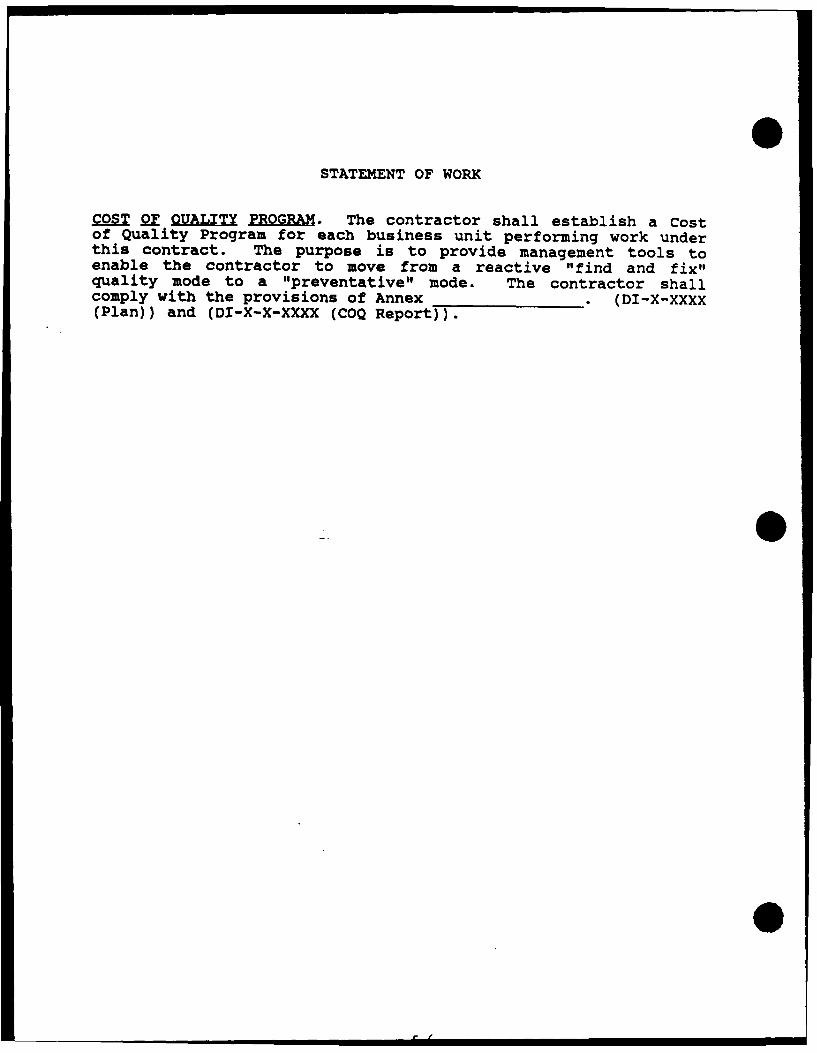
STATEMENT OF WORK
COST OF QUALITY PROGRAM. The contractor shall establish a Costof Quality Program for each business unit performing work underthis contract. The purpose is to provide management tools toenable the contractor to move from a reactive "find and fix"quality mode to a "preventative" mode. The contractor shallcomply with the provisions of Annex . (DI-X-XXXX(Plan)) and (DI-X-X-XXXX (COQ Report)).

ANNEX
COST OF QUALITY
Purpose. The purpose of this annex is to specify the generalprogram and requirements for the Cost of Quality Program.
scop.
Introduction. The traditional view of the Cost of Quality isfocused on the costs of scrap, rework and repair or more correc-tly, the cost of failure. By viewing only the costs of failure,this traditional approach has prevented us from identifying thetrue cost of quality and, therefore, has not helped to identifythe root causes of poor quality. A more useful approach to thecost of quality considers not only the cost of failure, but alsothe costs of appraisal and prevention. Additionally, failurecosts are subdivided into external failures and internalfailures. Cost of quality is one of the management tools avail-able for use in improving the overall quality of the goods andservices purchased by the Department of the Air Force. Speci-fically, it:
- provides visibility into the total cost of ensuringquality requirements are being met.
- points to problems in the quality program that arereflected in cost of quality category imbalances, orexcessive cost in non-value added activities.
- acts as a diagnostic tool at lower organizationallevels in identifying problem areas.
- allows judgments about the real thrust of a giveneffort to achieve quality from the perspective of"inspecting quality in" versus "designing and buildingquality in".
- allows management to judge the effectiveness of correc-tive actions taken to eliminate the root causes andimprove product quality.
Definitions.
a. Output - result or tangible product of any process(design, purchasing, manufacturing, etc.)
0
5-7

b. Cost of Quality - the cost of all efforts expended tofJnd non-conforming output, react to actual failures,both internally and externally, and to prevent failuresfrom happening in the first place.
c. Appraisal Costs - costs expended in the effort to findnon-conforming output. (See Page 1-1, this handbook.)
d. Failure Costs - the cost of actual failures themselvesare called internal failure and external failure costs.
e. Prevention Costs - the cost of efforts designed to stopproblems or failures from occurring in the first place.
Implementation Plan. The contractor shall develop a cost ofquality implementation plan covering each major business unitperforming work under this contact.
Purpose. The purpose of the implementation plan isthreefold -
1. Promote a Cost of Quality culture within the organiza-tion. This culture is built on the recognition thateveryone in the organization contributes to the ulti-mate quality of the organization's output and that thecustomers defines quality.
2. Define the Cost of Quality for the organization andthe system designed to capture it.
3. Assign tasking for overall management of the plan aswell as for the actual collection of the cost of qual-ity data.
Specific Reauirements
1. The plan shall be unique to the contractor so as to be read-ily used by management of each affected organizational ele-ment.
2. Although the plan will be unique, it should be tailoredalong the lines of accepted, existing programs such as theAmerican Society for Quality Control's "Principles of Qual-ity Cost".
3. The plan must identify the cost of quality by identifyingand listing all quality related activities under the generalcategories of Prevention, Appraisal, Internal Failure, andExternal Failure.
5-8

4. The plan must describe how the costs of these quality rela-ted activities will be captured and reported.
5. The plan must also describe how management will use thereported information to move from the traditional "find andfix" reaction mode to one of "prevention".
Measures.
The final section of the implementation plan shall establishmeasures, in terms of cost of quality, which will document theprogress in moving toward a totally "preventative" qualityenvironment. Improvement indicated by these measures must beverifiable by the contracting officer with the assistance of theCAO and/or DCAA. (Note: Use caution If "goals" are proposed.Merely achieving cost reductions is not the primary intent ofcapturing cost of quality data.)
Award Fee.
Because of the importance of high quality in the goods andservices purchased by the Department of the Air Force, thegovernment may, in selected instances, incentivize a contractor'smanagement of the cost of quality through use of an Award Feeprovision.
Specifications and Standards.
MIL-Q-9858A
MIL-STD-1520C
MIL-STD-1535A
MIL-STD-1567A
MIL-STD-1528A
5-9

GLOSSARY OF TERMS
ACCEPTANCE - The act of an authorized representative of thegovernment by which the government assumes for itself, or asagent of another, ownership of existing and identified suppliestendered or approves specific services rendered, as partial orcomplete performance of the contract on the part of thecontractor.
ACTUAL COST - The sum of the allowable direct and indirect costs(allocable) incurred as a result of producing a part, product, orservice.
BASELINE COST ESTIMATE (BCE) - A document which is a deliberatedetailed estimate of acquisition and ownership costs.
CALIBRATION - The comparison of a measurement system or device ofunverified accuracy to a measurement system or device of known orgreater accuracy to detect and correct any variation fromrequired performance specifications of the unverified measurementsystem or device.
CONFIGURATION - The functional and/or physical characteristics ofhardware/computer programs as set forth in technical documenta-tion and achieved in a product.. COST CENTER - Any subdivision of an organization comprised ofworkers, equipment areas, activities, or combination of thesethat is established for the purpose of assigning or allocatingcosts. Cost centers are also used as a base for performancestandards. Synonym: burden center, cost pool.
COST ESTIMATING RELATIONSHIP (CER) - The curve of a cost functionwhich relates the cost of a product to some measurable character-istic of its manufacture and from which extrapolations and inter-polations may be extracted for estimating purposes.
COST OF QUALITY - The costs of all efforts expended to find non-conforming output , react to actual failures, both internally andexternally, and to prevent failures from happening in the firstplace.
Appraisal Costs - The costs expended in the effort to findnon-conforming output.
Prevention Costs - The costs of efforts designed to stopproblems or failures from occurring.
Internal Failure Costs - The costs incurred for identifiedfailures prior to final delivery of the specific output tothe customer.
c-i

External Failure Costs - The costs incurred for a specificoutput that fails after delivery to the customer.
CRITICAL WEAKNESS RELIABILITY TEST - This test determines themode of failure when equipment is exposed to environments inexcess of the anticipated environments. By this testing, criti-cal levels can be determined from vibration, temperature voltage,cycles, etc., which will adversely affect the component. Insubsequent tests of the total system in which a stress levelexceeds the expected limits, an evaluation of the critical weak-ness tests will provide excellent insight as to what may havebeen damaged or what can be expected to fail.
DEMONSTRATION VALIDATION/RISK REDUCTION - The period when majorprogram characteristics are refined through extensive study andanalysis, hardware development, test and evaluations. The objec-tive is to validate the choice of alternatives and to provide thebasis for determining whether or not to proceed into full-scaledevelopment.
DESIGN TO COST - A process utilizing unit cost goals asthresholds for managers and design parameters for engineersnormally in terms of a single cumulative "average flyaway cost".This cost represents what the government has determined it canafford to pay for a unit of military equipment which meetsestablished and measurable performance requirements at a speci-fied production quantity and rate during a specified period oftime.
DESIGN TO COST GOAL - A specific cost established as a goal for aspecific configuration, established performance characteristicsand a specific number of systems at a defined production rate.
DIRECT COST - Those costs which can be traced directly to aspecific piece-part, subassembly, or product.
DIRECT ENGINEERING - Engineering effort directly traceable to thedesign, manufacture, or control of specific end products.
DIRECT LABOR STANDARD - A specified output or a time allowanceestablished for a direct labor operation.
DIRECT MANUFACTURING LABOR - Work which alters the composition,condition, conformation, or construction of the product; the costof which can be identified with and assessed against a particularpart, product, or group of parts or products accurately and with-out undue effort and expense; coloquially called "direct labor".
DIRECT MATERIAL - All material that enter into and becomes partof the finished product (including waste), the cost of which canbe identified with and assessed against a particular part,product, or group of parts or products accurately and withoutundue effort and expense.

EFFICIENCY FACTOR .- The ratio of standard performance time toactual performance time, usually expressed as a percentage.
FAILURE - The event in which any part of an item does not performas required by its performance specification.
FIXED COST - Those costs which remain relatively constantirrespective of volume.
FLOW DIAGRAM - The paths of movement of workers and/or materialssuper-imposed on a graphical representation of a work area.
FLOW PROCESS CHART - A graphic representation of the sequence ofall operations, transportations, inspections, delays, andstorages occurring during a process or procedure.
FLOW TIME - The time required for a defined amount of work to becompleted.
GANTT CHART - A graphic representation of a time scale of thecurrent relationship between actual and planned performance.
GENERAL AND ADMINISTRATIVE COSTS (G&A) - An overhead cost cate-gory for accumulation of such costs as personnel department,accounting, purchasing, etc.
GOVERNMENT ACQUISITION QUALITY ASSURANCE - The function by whichthe government determines whether a contractor has fulfilled hiscontract obligations pertaining to quality and quantity.
* IDLE TIME - A time interval during which either the workman, theequipment, or both do not perform useful work.
IN PROCESS INVENTORY CONTROL - The process whereby materials andparts are effectively and efficiently planned and controlled toassure their availability at the required stage or production.
INDEPENDENT COST ANALYSIS (ICA) - An analysis of program costestimates conducted by an impartial body disassociated from themanagement of the program.
INDEPENDENT COST ESTIMATE (ICE) - The government's cost estimateused for program approvals, for establishing budget estimates andas a baseline for evaluating offerors proposals. The ICE shouldbe an independent, objective unbiased estimate which stands onits own as a "yardstick" for evaluating offerors proposals.
INDIRECT COST - Costs necessary in manufacturing which cannot bereadily identified with or changed to a particular part, product,or group of parts or products.
INDIRECT LABOR - Work which is performed rendering servicesnecessary to production, the cost of which cannot be assessedagainst any part, product, or group of parts or productsaccurately or without undue effort and expense.

INDIRECT MATERIAL - Material consumed in the process of produ-tion or manufacture that does not become a part of the finishnedproduct and/or cannot be readily identified with or changed to aparticular part, product, or group of parts or products.
INDIVIDUAL ACCEPTANCE TEST - This is based on a test of predeter-mined critical items to verify their operational characteristicsprior to assembly into subsystems. Waivers to this requirementsuch as using the end item acceptance tests is not recommended asproduction expediency. This test should be capable of beingperformed on the same fixtures used for preceding type tests.
INDUSTRIAL ENGINEERING - The art and science of utilizing andcoordinating workers, equipment, and materials to attain adesired quantity of output at a specified time and at an optimumcost. This may include gathering, analyzing, and acting uponfacts pertaining to building and facilities, layouts, personnelorganization, operating procedures, methods, processes,schedules, time standards, wage rates, wage payment plans, costs,and systems for controlling the quality of goods and services.
INHERENT R & M VALUE - Any measure of reliability or maintain-ability that includes only the effects of item design andinstallation, and assumes an ideal operating and support environ-ment.
INSPECTION - The examination and testing of supplies and services(including, when appropriate, raw materials, components, andintermediate assemblies) to determine whether they conform tospecified requirements. -
JOB ORDER COST SYSTEM - Direct and overhead cost data are accumu-lated by each contract or order.
LABOR PRODUCTIVITY - The rate of output of a workman or group ofworkers per unit of time, usually compared to an establishedstandard or expected rate of output.
LABOR STANDARDS - A compilation by time study of standard timefor each element of a given type of work. Once element standardshave been established, the standards are applied to work contain-ing similar elements without making actual time studies of thework.
LIFE CYCLE COST - The Life Cycle Cost (LCC) of a system is thetotal cost to the government of acquisition and ownership of thatsystem over its full life. It includes the cost of development,acquisition, support and, where applicable, disposal.
LINE OF BALANCE - A graphic display of scheduled units versusactual units over a given set of critical schedule control pocinson a particular day.
MAINTAINABILITY - The abilit"y of an item to be retained in cr

restored to specified condition when maintenance is performed bypersonnel having specified skill levels, using prescribed pro-cedures and resources, at each prescribed level of maintenanceand repair.. MANPOWER SCHEDULING AND LOADING - The effective and efficientutilization and scheduling of available manpower according totheir skills to ensure that required manufacturing operations areproperly coordinated and executed.
MANTECH (MANUFACTURING TECHNOLOGY) - Manufacturing Technologyrefers to any action which has its objective, 1) the timelyestablishment or improvement of the manufacturing processes,techniques, or equipment required to support current andprojected programs, and 2) the assurance of the ability toproduce, reduce lead time, ensure economic availability of enditems, reduce costs, increase efficiency, improve reliability, orto enhance safety and anti-pollution measures.
MANUFACTURING, OVERHEAD - A form of indirect costs - accumulatedmanufacturing costs prorated over all products in process,generally as a percent of direct labor and/or material.
MATERIAL - Property which may be incorporated into or attached toan end item to be delivered under a contract or which may beconsumed or expended in the performance of a contract. Itincludes, but is not limited to, raw and processed material,parts, components, assemblies, fuels and lubricants and smalltool and supplies which may be consumed in normal use in the
* performance of a contract.
METHODS ENGINEERING - The technique that subjects each operationof a given piece of work to close analysis in order to eliminateevery unnecessary element or operation and in order to approachthe quickest and best method of performing each necessary elementor operation. It includes the improvement and standardization ofmethods, equipment, and working conditions; operator training;the determination of standard times; and occasionally devisingand administering various incentive plans.
METHODS STUDY - Systematic recording of all activities performedin a job or position of work including standard times for thework performed. Work simplification notes are written during thestudy.
METROLOGY - The science of weights and measures used to determineconformance to technical requirements including the developmentof standards and systems for absolute and relative measurements.
NONRECURRING - A descriptive term applied to a type of work,operation, part, or the like that does not recur frequently or inany reasonable regular sequence (also nonrepetitive).
OPERATION PROCESS CHART - Identifies the successive operations,O in their required sequence, for producing a product (component).

OPERATIONAL R & M VALUE - Any measure of reliability or maintain-ability that includes the combined effects of item design, quai-ity, installation, environment, operation, maintenance, andrepair.
PROCESS - 1) A planned series of actions of operations whichadvances a material or procedure from one stage of completion toanother, and 2) a planned and controlled treatment that subjectsmaterials to the influence of one or more types of energy for thetime required to bring about the desired reactions or results.
PROCESS COST SYSTEM - Total costs for producing a type of unit.The number produced are determined for regular accounting periodsand an average unit. The cost based on that data is determined.
PRODUCIBILITY - The relative ease of producing an item or systemwhich is governed by the characteristics and features of a designthat enable economical fabrication, assembly, inspection, andtesting using available production technology.
PRODUCIBILITY ENGINEERING AND PLANNING (PEP) - The productionengineering tasks and production planning measures undertaken toensure a timely and economic transition from development to theproduction phase of a program.
PRODUCTION MANAGEMENT - The effective use of resources to produceon schedule the required number of end items that meet specifiedquality, performance, and cost. Production management includesbut is not limited to industrial resource analysis, producibilityassessment, producibility engineering and planning, productionengineering, industrial preparedness planning, post-productionplanning, and productivity enhancements.
PRODUCTION PLANNING - The systematic scheduling of workers,materials, and machines by using lead times, time standards,delivery dates, work loads, and similar data for the purpose ofproducing products efficiently and economically and meetingdesired delivery dates.
PRODUCTION PLANNING AND CONTROL - The planning of operations thataccomplishes coordination of workers, material, and facilities toachieve effective and efficient production goals.
PRODUCTION READINESS REVIEW (PRR) - A formal examination of aprogram to determine whether the design is ready for production,production engineering problems have been resolved, and theproducer has accomplished adequate planning for the productionphase.
PRODUCTIVITY - The actual rate of output or production per unitof time worked.
PRODUCTS - All items, materiel, material, data, software,supplies, systems, assemblies, subassemblies, or portions thereofZ
.. .. • • . ,, i i- C

which are produced, purchased, developed or otherwise used byDoD.
QUALITY ASSURANCE - A planned and systematic pattern of allactions necessary to provide confidence that adequate technicalrequirements are established; products and services conform toestablished technical requirements; and satisfactory performanceis achieved.
QUALITY OF CONFORMANCE - The extent to which the product or sys-tem conforms to design criteria or requirements.
QUALITY OF DESIGN - The adequacy of the product or system designto meet the needs of the user.
QUALITY IMPROVEMENT - The emphasis on continual-, reduction ofquality costs, regardless of the starting point.
QUALITY PROGRAM - A program which is developed, planned, andmanaged to carry out, cost-effectively, all efforts to effect thequality of materiel and services from concept through validation,full-scale development, production, deployment, and disposal.
R & M ACCOUNTING - That set of mathematical tasks which establishand allocate quantitative R & M requirements, and predict andmeasure quantitative R & M achievements.
R & M ENGINEERING - That set of design, development, and manufac-turing tasks by which R & M are achieved.
RELIABILITY - The duration or probability of failure free perfor-mance under stated conditions.
REALIZATION FACTOR - The ratio of actual performance time tostandard performance time, usually expressed as a decimal number.
REWORK - Any corrections of defective work either before, duringor after inspection.
SCRAP - Residual material resulting from machine or assemblyprocesses, such as machine shavings, unusable lengths of wire,faulty parts.
SET UP TIME - The time required to arrange locating fixtures andequipment in order to begin productive work; including adjust-ments and take down of the original set up.
SHRINKAGE - An additional quantity of material added to thequantity listed on the Bill of Material to provide for spoilage,scrap, waste and natural attrition (See: Attrition).
SOURCE SELECTION - The process wherein the requirements, facts,recommendations and government policy relevant to an awarddecision in a ccmpetitive procurement of a system/project areexamined and the decision made.

SPOILAGE - A form of waste material resulting from misuse ofmaterial or errors in workmanship.
STANDARD - A term applied, in work measurement, to anyestablished or accepted rule, model, or criterion against whichcomparisons are made.
STANDARD COST - The normal expected cost of an operation, pro-cess, or product including labor, material, and overhead charges,computed on the basis of past performance costs, estimates, orwork measurement.
SYSTEM EFFECTIVENESS - The measure of the degree to which thehardware and software achieve the mission requirements in theoperational environment as evidenced in system availability,dependability, and capability.
SYSTEM R & M PARAMETER - A measure of reliability or maintain-ability in which the units of measurement are directly related tooperational readiness, mission success, maintenance manpowercost, or logistic support cost.
TECHNOLOGY MODERNIZATION - The coupling of modernization with theimplementation of advanced manufacturing technology by providingincentives for contractor (and subcontractor) capitalization.
TESTING - An element of inspection. Generally denotes the deter-mination by technical means of the properties or elements ofsupplies, or components thereof, including functional operation,and involves the application of established scientific principlesand procedures.
TOUCH LABOR - Defined as production labor which can be reasonablyand consistently related directly to a unit of work being manu-factured, processed, or tested. It involves work affecting thecomposition, condition, or production of a product; it may alsobe referred to as hands on labor or factory labor. it includessuch functions as machining, welding, fabricating, painting,assembling, and functional testing of production articles.
VARIABLE EXPENSE - Expenditures that vary in proportion to thevolume of production, such that an increase/decrease in produc-tion causes an increase/decrease in the variable cost.
VARIANCE - The difference between any standard or expected valueand an actual value. For example, the difference between theestablished standard cost and the cost actually incurred in Der-forming a job or operation.
WORK SAMPLING STUDY - A statistical sampling technique employedto determine the proportion of delays or other classifications ozactivity present in the total work cycle.

BIBLIOGRAPHY
1.ACCOMPLISMNT COT: BETTE PROJECT CONTROL
1971 BLOCK ELLERY B HARVARD BUSINESS REVIEW
2. ACCOuwTING MI T= RZAL COST OF QUALITYQUALITY PROGRESS 22-27 1986 LENANE DEAN-MICHAEL
3. ACCOUNING GUIDE FOR GOVERMENT CONTRACTSSEVENTH EDITION 1982 TRUEGER PAUL M COMMERCE CLEARINGHOUSE INC
4.ACE SYSTEM THAT IMPROVES QUALITY & PROFITS, ANASQC 38TH ANNUAL QUALITY CONGRESS 295-30 1984 TUTTLE JOHN PMILLIPORE CORP BEDFORD MA 01730
5. ACE: A SYSTEM THAT IMPROVES OUALTIY AND PROFITSQUALITY PROGRESS 59-61 1985 TUTTLE JOHN P
6.AFTER THE COMMITMENT THEN WHAT?ASQC 35TH ANNUAL QUALITY CONGRESS 897-90 1981 HAGAN JOHN TDIRECTOR-QUALITY MANAGEMENT ITT CORPORATION NEW YORK NY
7.AIR FORCE POLICY LETTER FOR COMMANDERS AFRP
190-1 1987
8.AXA MANAGEMENT HANDBOOK
HD31 A418 1983 FALLON WILLIAM K AMERICAN MANAGEMENTASSOC
9.AMERICA QUALITY AND PRODUCTIVITY IN PERSPECTIVEASQC 36TH ANNUAL QUALITY CONGRESS 475-48 1982 LANGEVIN ROGERG ARGYLE ASSOCIATES, INC. SOUTH SALEM NY
10.AN ENGINEERING ORGANIZATION'S COST OF QUALITY PROGR
QUALITY PROGRESS 29-34 1986 SCHRADER LAWRENCE J
11.APPLICATION OF ECONOMIC PRINCIPLES TO QUALITYASQC 38TH ANNUAL QUALITY CONGRESS 3-9 1984 BRADSHAW, JRCHARLES W WESTERN ELECTRIC COMPANY RICHMOND VA 23150
7-1

BIBLIOGRAPHY
12. . AUNVAILABILTY AND LIFE CYCLE COSTSASQC 36TH ANNUAL QUALITY CONGRESS 465-47 1982 MAYBEN J EGENERAL DYNAMICS FORT WORTH TX
13. ATTAINING MANUFACTURING EXCELLENCELOC-86-7192 1987 HALL ROBERT W DON JONES-IRWIN
14. B.KING QUALITY COST MODEL, ITS USES M RESULTS, A
ASQC 36TH ANNUAL QUALITY CONGRESS 195-20 1982 AUBREY, IICHARLES A MANAGER, QUALITY ASSURANCE CONTINENTAL ILLINOISNATIONAL CHICAGO IL ZIMPLER DEBRA A QUALITY CONTROLANALYST
15.BETTER PRODUCTS AT LOWE COSTSJOINT ENGINEERING MANAGEMENT CONFERENCE 45-53 1972 SHECTER
EDWIN S
16.BUSINESS MANAGEMENT AND QUALITY COSTQUALITY PROGRESS 13-18 1985 HITOSH KUME
17. CAN QUALITY COST PRINCIPLES BE APPLIED TO PRODUCT LIABILITY
ASQC 33RD ANNUAL QUALITY CONGRESS 295-29 1979 SHAININ DORIANCONSULTANT DORIAN SHAININ CONSULTANTS INC
18. COMMIT TO QUALITY
HD66T65 1986 TOWNSEND PATRICK L JOHN WILEY & SONS, INC.GEBBARDT JOAN E
19. CORRECTIVE ACTION IS MAGIC
ASQC 38TH ANNUAL QUALITY CONGRESS 41-45 1984 SEISSER RICHARDJ DIRECTOR OF QUALITY ASSURANCE GENERAL INSTRUMENT CORP
20.COST OF QUALITY
DLA CAMERON STATION 1987 DEFENSE CONTRACT ADMSERV ALEXANDRIA VA 22304 6100
21.CO Q7 QUALIY IN THE SERVICE INDUSTRIESASQC 32ND ANNUAL QUALITY CONGRESS 321-32 1978 ROSENZWEIGGEORGE VICE-PRESIDENT TECHNITROL TESTING LAB LTD.MISSISSAUGA ON
7-2

BIBLIOGRAPHY
22.COST Qr QUALTY = A M ZENT TOOLASQC 37TH ANNUAL QUALITY CONGRESS 378-38 1983 DEMETRIOU JAMESMANAGER OF QUALTIY ADMIN ITT AVIONICS DIVISION CLIFTON NJ07014
2.COST OF QUALITY, UKTS156G76 GROOCOCK J M PITMAN PUBLISHING
24. COST OF SOFTWARE OUALITY ASSURANCE, THEASQC 35TH ANNUAL QUALITY CONGRESS 684-68 1981 GOELLER W 0QUALITY MANAGER-PRIME PROGRAMS VOUGHT CORP DALLAS TX
25.COST OPTIMIZED QA FOR COMMERCIAL CONSTRUCTIONASQC 39TH ANNUAL QUALITY CONGRESS 228-23 1985 ROBERTS ALLEN TALLEN ROBERTS CONSULTATIONS RINGWOOD NJ 07456
26. COST REDUCTION THROUGH OUALITY MANAGEMENT
ASQC 35TH ANNUAL QUALITY CONGRESS 270-27 1980 SCANLON FRANKSECRETARY-DIRECTOR QUALITY THE HARTFORD INSURANCE GROUP
27. COSTING OUALITY FOR SENSITIVITY ANALYSIS
ASQC 40TH ANNUAL QUALITY CONGRESS 707-71 1986 KROEHLING HUGHE QUALITY CONTROL ENGINEER AT&T TECHNOLOGIES RICHMOND VA23231 PETRSEL LAWRENCE R
28. CUSTOMER-BASED MEASUREMENT CLOSE TO THE LOOP
ASQC 35TH ANNUAL QUALITY CONGRESS 675-68 1981 UTZIG LAWRENCEJ CONSULTANT-PRODUCT QUALITY GENERAL ELECTRONIC COMPANYFAIRFIELD CT 06431
29. CUTTING THE COST OF OUALITY
FARNSWORTH PUBLISHING INC 1967 CROSBY PHILLIP BINDUSTRIAL EDUCATION INSTITUTE
30. DEALING WI= THE SIDE U QUALITY IMPROVEMENT
ASQC 33RD ANNUAL QUALITY CONGRESS 763-76 1979 POLLARD, CMCJOHN W PRINCIPAL RATH & STRON, INC. LEXINGTON MA 02173
31. DESIGN AM MT2 LIFE CXCLI COST1978 BLANCHARD BENJAMIN S VIRGINIA POLYTECHNIC
7-3

BIBLIOGRAPHY
32. flIGN N ME FZCTIVE PROCUREMENT RATING SYSTEM
ASQC 34TH ANNUAL QUALITY CONGRESS 488-49 1980 DOBBINS RICHARDK PRINCIPAL SYSTEMS ENGINEER HONEYWELL, INC. FORT WASHINGTONPA
33. DISCOUTED AND M UNIT COSTS OU PRODUCT WARRANTYMANAGEMENT SCIENCE VOL 33 NO 7 916-93 1987 MAMER JOHN W
34.EXTENDING EFFECTIVENESS OF OUALITY COST PROGRAMSASQC 32ND ANNUAL QUALITY CONGRESS 200-20 1978 DOBBINS RICHARDK PRINCI QUAL ASSUR STAFF ENG HONEYWELL INC FORT WASHINGTONPA
35. FAIRFIELD RPUBLIC COMPANY QUALITY COST PROGRAM THEASQC 33RD ANNUAL QUALITY CONGRESS 584-59 1979 COMPANELLA JACKMANAGER QUAL ADMIN FARMING REP CO NEW YORK NY 11735
36.FOCUSING QUALITY COSTS USING THE BASICSASQC 40TH ANNUAL QUALITY CONGRESS 401-40 1986 WINCHELLWILLIAM 0 GENERAL MOTORS CORPORATION WARREN MI 48090
37.FRONT LINE COSTS ADMINISTRATION
1955 COOLING WILMER C CONOVER-MAST PUBLICATIONS INC
38.GROUP TESTING AND THE EFFECTS OF COST RATIOASQC 39TH ANNUAL QUALITY CONGRESS 563-56 1985 MUNDEL, P.E.AUGUST B CONSULTING ENGINEER WHITE PLAINS NY 10605
39.GUIDE FOR MANAGING SUPPLIER OUALITY COSTSQUAL COSTS COMM AM SOC FOR QUAL CONT SECOND EDIT 1987
WINCHELL WILLIAM 0
40.GUIDE FOR MANAGING VENDOR QUALITY COSTSASQC 35TH ANNUAL QUALITY CONGRESS 690-69 1981 WINCHELL W 0MANAGER CUSTOMER SATIS ACT CONSUMER RELATIONS & SER STAFFDETROIT MI 48202
41.GUIDE FOR MANAGING VENDOR QUALITY COSTSASQC 34TH ANNUAL QUALITY CONGRESS 483-48 1980 WINCHELL W 0MANAGER CUSTOMER SATISFACTION ACT WARREN MI 48090
7-/.. . .. i l II I II

BIBLIOGRAPHY
42. GPI Z11 XMANAN !DOQ QUALIT COSTS
ASQC 36TH ANNUAL QUALITY CONGRESS 367-37 1982 WINCHELL W 0CONSUMER RELATIONS & SER STAFF GENERAL MOTORS CORPORATIONDETROIT MI 48202
43. 43 I1P FOR DUCING QUALITY COSTSASQC 36TH ANNUAL QUALITY CONGRESS 360-36 1982 WILLIAMS RONALDJ LEVITON MANUFACTURING CO, INC. LITTLE NECK NY
44.FOR REDUCING QUALITY COSTS
ASQC 34TH ANNUAL QUALITY CONGRESS 56-59 1980 ZERFAS JAMES FMANAGER, QUALITY CONTROL JEFFEREY MINING MACHINERY DIVARRINGTON LANCE PRESIDENT
45. SGUIDE FOR REDUCING QUALITY COSTS CAMPENELLAQUAL COST COMM AMER SOC FOR QUAL CONTROL 1987
46.HANDBOOK FOR TOTAL OUALITY ASSURANCE
1986 STILE EDWARD M BUREAU OF BUSINESS PRACTICE
47.HANDBOOK FOR TOTAL QUALITY ASSURANCE
LOC-64-2221 1986 STILES EDWARD M BUREAU OF BUSINESSPRACTICE
48. HIDDEN FACTORY, THE
HARVARD BUSINESS REVIEW 142-15 1985 MILLER JEFFREY GVOLLMANN THOMAS E
49.HOW TO MAKE IT RIGHT THE FIRST TIME
BUSINESS WEEK 142-14 1987 PORT OTIS
50.HOW TO START A QUALITY COST PROGRAM D DON'TASQC 33RD ANNUAL QUALITY CONGRESS 410 1979 BROWN F X STAFFASSISTANT WESTINGHOUSE ELECTRIC CORP CHURCHILL BORO PV
O 51.51. N RESOURCE TOOL FOR QUALIT IMPROVEMENTASQC 39TH ANNUAL QUALITY CONGRESS 616-63 1985 BERGER, PH. D.JOHN A W.A. GOLOMSKI & ASSOCIATES CHICAGO IL 60605
7-5

BIBLIOGRAPHY52. Z ZT fNN Um X
1985 GUASPARI JOHN AMERICAN MANAGEMENT ASSOC NEW
YORK NY 053. IMPLEMENTING a .uALITX COST SYSTEM
QUALITY PROGRESS 16-19 1972 RHODES R C
54. IMROVED PRODUCTIVITY THROUGH OUALTI MGMTASQC 36TH ANNUAL QUALITY CONGRESS 491-50 1982 SCANLON FRANKTHE HARTFORD INSURANCE GROUP ITT WLD HEADQUARTERS NYHAGAN JOHN T
55. 55 SEARCH O EXCILLZNHD70,U5P424 1982 PETUS THOMAS HARPER AND ROW
PUBLISHERS WATERMAN, JR ROBERT H
56. INCREASED PROFITS THROUGH COMPANY WIDE COMMITTMENTASQC 39TH ANNUAL QUALITY CONGRESS 62-67 1985 ORTWEIN WILLIAMJ UNITED TECHNOLOGIES CORP EAST HARTFORD CT 06108
57. INNOVATIONS FOR OUAL-TY COSTS I-N THE NEW DECADEASQC 34TH ANNUAL QUALITY CONGRESS 546-55 1980 BREWER CLAYTONC GENERAL ELECTRIC CO
58.INSURANCE FIRM SHOWS THAT QUALITY HAS VALUEQUALITY PROGRESS 41-45 1985 TOWNSEND PATRICK L
59.INTEGRATED APPROACH TO QUALITy IMPROVEMENT, ANASQC 39TH ANNUAL QUALITY CONGRESS 434-44 1985 SHILLINGS J WALLEGHENY LUDLUM STEEL CORP BRACKENRIDGE PA 15014 DUNN DS WALL J Q
60.INVESTING IN PREVENTIVE OUALITY COSTSQUALITY PROGRESS 12-17 1978 VEEN B
61.I QUALITY OUT OF CONTROLREPRINTS OF SPECIFIC ARTICLES 8.024 1984 VENSON WILLIAM D
HOWARD BUSINESS REVIEW HEANY DONALD F
62._APENfE MANUFACTURING TECHNIQUES
1982 SCHONBERGER RICHARD J THE FREEPUSS A DIVISION
1? 41

BIBLIOGRAPHY
63. 3.JITj M NtQU ZROACH TQ QALITY IMPROVEMENTASQC 39TH ANNUAL QUALITY CONGRESS 342-34 1985 GOETZ VICTOR JWARNER - LAMBERT COMPANY MORRIS PLAINS NJ 07950
64.64. A~&GliM. QE QU.LIT ABIURhMN.ZU
TS156.6 S48 1985 SINKA MADHAU N JOHN WILERY & SONSWILLBORN WALTER W
65.MAN&GMINT ROLE R QUALITY CONTROL,
HAGON H T AMERICAN MGMT ASSO
66.MANAGING COST QO QUALITYASQC 37TH ANNUAL QUALITY CONGRESS 463-46 1983 MURTHY VYASARAJV HONEYWELL INFORMATION SYS, INC BILLERICA MA 01821
67..MANAGING FOR RESULTSDDC CATALOGUE CARD 64-12670 1964 DRUCKER LETER F HARPER
& ROW PUBLISHERS
68. MANAGING FOR SUCCESS THROUGH THE QUALITY SYSTEM
ASQC 38TH ANNUAL QUALITY CONGRESS 10-21 1984 CAPLAN FRANKV.P. CORP QUAL SYSTEMS GULL, INC. SMITHTOWN NY 11787
69.MANAGING FOR SUCCESS THROUGH THE QUALITY SYSTEM
29-58 1985 CAPLAN FRAK QUALITY PROGRESS
70.MANAGING QUALITY FOR HIGHER PROFITS
1982 BROH ROBERT A MCGRAW-HILL BOOK COMPANY
71.MANAGING THE QUALITY FUNCTION
1987 PEACH ROBERT W THE MANAGEMENT INSTITUE
72. MANAGING TO ACHIEVE QUALITY AND RELIABILITY
1971 NIXON FRANK MCGRAW-HILL
73.MANUFACTURING COST E'1INEERING HANDBOOKUNIVERSITY AMES, IOWA 1984 MALMSTROM ERIC DEPARTMENTOF INDUSTRIAL ENG IOWA STATE
7-'t

BIBLIOGRAPHY
74. 74 M ING RU N A PRODUCT OUALITYASQC 37TH ANNUAL QUALITY CONGRESS 385-39 1983 GRYNA, JR.FRANK M JURAN INSTITUE, INC. NEW YORK NY
5_MEASUREMENT EO AD QUALITY COSTASQC 39TH ANNUAL QUALITY CONGRESS 504-51 1985 BHUYAN SAMAR KMIDDLETOWN NJ 07748
7 QAL COSTS BY WORK SAMPLINGASQC 36TH ANNUAL QUALITY CONGRESS 138-14 1982 ESTERBY JAMES LDIRECTOR QUALITY ASSURANCE VICTOR EQUIPMENT COMPANY DENTONTX 76201
77. METHOD FOR PREDICTING WARRANTX COSTS. -ASQC 32ND ANNUAL QUALITY CONGRESS 205-21 1978 GRIMM ANDREW FMANAGER, QUALITY ASSURANCE CLARK EQUIPMENT CO. BUCHANAN MI
78.MIL-O-9858A3.3
79.MIL-STD-1520B
4.11-1
80. MIL-STD-1520C
5.7
81.MINIMIZED COST SAMPLING TECHNIQUEASQC 35TH ANNUAL QUALITY CONGRESS 958-96 1981 LEE DENNIS DSENIOR RELIABILITY ENGINEER SUNDSTRAND HYDRO-TRANSMISSIONAMES IW 50010
82. MINIMIZING QUALITY COSTS THROUGH EFFECTIVE DESIGN
ASQC 40TH ANNUAL QUALITY CONGRESS 411-41 1986 MAYHEW EMILY AQUALITY PPOGRAMS SPECIALIST BABCOCK & WILCOX LYNCHBURG VA24506 0935
83. MINIMIZING THE COST OF INSPECTION
ASQC 36TH ANNUAL QUALITY CONGRESS 485-49 1982 LATZKO WILLIAMJ IRVING TRUST COMPANY NEW YORK NY
7-8

BIBLIOGRAPHY
84. N]Lt._ C YOU COMPANIES OUALrTX POSTURE Tj SLOWINGASQC 36TH ANNUAL QUALITY CONGRESS 866-87 1982 DOBBINS RICHARDK PRINCIPAL SYSTEMS ENGINEER HONEYWELL INC. FORT WASHINGTONPA 19034
85. XRP. EATN AND OP
INVENTORIES & PRODUCTION MAGAZINE 1982 ROX ROBERT E
86. QN THE ROAD MO UALT SAVINGSASQC 39TH ANNUAL QUALITY CONGRESS 47-52 1985 GOELLER WILLIAMD LTV AEROSPACE & DEFENSE CO. DALLAS TX 75265
87. OVERCOMING REGULATORY CONSTRAINTS IN OUALITY COSTS
ASQC 36TH ANNUAL QUALITY CONGRESS 8-12 1982 SZYMANSKI EARL TCORPORATE QUALITY ASSURANCE ABBOTT LABORATORIES NORTHCHICAGO IL 60064
88. PARTICIPATING APPROACH TO QUALITY, A
ASQC 36TH ANNUAL QUALITY CONGRESS 373-37 1982 GUNNESON DR.ALVIN 0 V.P. & DIR- QUAL WORLDWIDE REVLON, INC. EDISON NJ
89. PHILOSOPHY AND USEFULNESS OF OUALITY COST. THE
ASQC 32ND ANNUAL QUALITY CONGRESS 644-64 1978 MOORE WILLIAM NMANAGER MANUFACTURING OPER WESTINGHOUSE ELECTRIC CORPSYKESVILLE MD 21784
90.POOR - OUALITY COSTASQC QUALITY PRESS 1987 HARRINGTON JAMES H
91. POOR OUALITY COSTASQC QUALITY PRESS T5156 H346 1987 HARRINGTON H D
92. 9 PREDICTING OUALITY COST CHANGES USING REGRESSION
ASQC 40TH ANNUAL QUALITY CONGRESS 405-41 1986 KRISHNAMOORTHIK S INDUSTRIAL ENGINEERING BRADLEY UNIVERSITY PEORIA IL0
93.PRINCIPLES OZ OUALITY COSTSASQC 36TH ANNUAL QUALITY CONGRESS 124-13 1982 CAMPANELLA JACKFAIRCHILD REPUBLIC COMPANY FARMINGDALE NY
'7_0

BIBLIOGRAPHY
94.PRZINILE 1 OUALIXTY COOTSQUALITY COSTS COMMITTEE 1986 HAGAN JOHN T AMERICAN
SOCIETY FOR QUAL CONT
PROCESS CONTROL MANAGEMENT
ASQC 38TH ANNUAL QUALITY CONGRESS 198-20 1984 DENISSOFFBASILE A CORNING GLASS WORKS RALEIGH NC 27604
96. 9 1ROT z THE RSULT O1 QUALITYASQC 39TH ANNUAL QUALITY CONGRESS 422-42 1985 SWATON LAWRENCEE ABBOTT LABORATORIES IRVING TX 75061
97. PROFIT IMPROVEMENT THROUGH SCRAP REDUCTIONASQC 38TH ANNUAL QUALITY CONGRESS 289-29 1984 REAMES J PCORPORATE MANA - QUAL ASSUR ALLIED CORPORATION MORRISTOWNNJ 07960
98. PROJECT COST CONTROL FOR MANAGERS
1985 TOMPKINS BILL G GULF PUBLISHING COMPANY HOUSTONTX
99.Q COST/RESULTS - THE PETROLENM INDUSTRYASQC 36TH ANNUAL QUALITY CONGRESS 873-87 1982 BREWER CLYDE WOTIS ENGINEERING CORP. DALLAS TX
100.OA CONNECTION: KEY TO EXCELLENCE THRU IMPROVEMENT!ASQC 40TH ANNUAL QUALITY CONGRESS 718-72 1986 DOBBINS RICHARDK HONEYWELL INC. FORT WASHINGTON PA 19034
101.QA SYSTEM CAN IMPROVE PROFITS. THEASQC 35TH ANNUAL QUALITY CONGRESS 915-92 1981 CASWELL A RABBOTT LABORATORIES LTD NORTH CHICAGO IL
102. UAL T
SPECIAL REPORT BUSINESS WEEK 142-14 1987
103. OUALITY & O OUALITY COSTS EOUALS PRODUCTIVITY
ASQC 37TH ANNUAL QUALITY CONGRESS 121-12 1983 AUBREY, IICHARLES A MANAGER, QUALITY ASSURANCE CONTINENTAL ILLINOISNATIONAL CHICAGO IL 60693
7-10

BIBLIOGRAPHY
104. OUALITY Um FINCE.
0 QUALITY 42 1987 BOUILLON, II LINCOLN
105.15Z&LIT CONTROLHEAR-TSK FORCE ON SELE DEF PROC MAT COMM ON ARM 1985
106.QbLITY CONTROLPRENTICE-HALL SECOND EDITION 1986 BESTERFIELD DALE H
107.QUALIT CONTROL FOR PROFIT
1977 LESTER RONALD H INDUSTRIAL PRESS INCENRICK NORBERT L PH.D MOTTLEY, JR HARRY E
108.QUALITY CONTROL HANDBOOKTHIRD EDITION 1979 JURAN J M MCGRAW-HILL BOOK COMPANY
109.QUALITY CONTROL HANDBOOK
T5156.Q3T8 1984 JURAN J M MCGRAW-HILLTUNDUALL D M
110.QUALITY CONTROL IN A SERVICE BUSINESS
1975 HOSTAGE GM HOWARD BUSINESS REVIEW
111.QUALITY CONTROL MEETING THE NEW COMPETITION
BERGER ROGER W EDUCATION FOR MANAGEMENT INC.
112.QUALITY COST & SCHEDULE SAVINGS FROM SURVEILLANCEASQC 38TH ANNUAL QUALITY CONGRESS 41-45 1984 HARDEE GEORGE EDIXON LLOYD M BIRMINGHAM FLETCHER A
113. QUALITY COST - THE WHOLE AND ITS PARTS
QUALITY 18-20 1976 HARRINGTON JAMES H
QUALITY COST -- A KEY TO PRODUCTIVITyASQC 35TH ANNUAL QUALITY CONGRESS 420-43 1981 HARRINGTON H JINTERNATIONAL BUS MACH CORP SAN JOSE CA
7-11
• .. , , m m im I II

BIBLIOGRAPHY
OUALITY COST ANALYSIS114. ASQC 35TH ANNUAL QUALITY CONGRESS 432-43 1981 ESTERBY JAMES L
DIRECTOR QUALITY ASSURANCE VICTOR EQUIPMENT COMPANY DAYTONTX 76201
116.OUALITY COST AND ECONOMIC ANALYSIS
17-29 1981 BERGER ROGER W AMERICAN MANAGEMENT ASSO
117..UALITY COST AND PROFIT PERFORMANCEASQC 32ND ANNUAL QUALITY CONGRESS 505-51 1978 BROWN FRANCIS XSTAFF ASSISTANT WESTINGHOUSE ELECTRIC CORP PITTSBURGH PV15235 KANE ROGER W STAFF ASSISTANT
118.OUALITY COST BREAKTHROUGHTS IN U.S. PRODUCTIONASQC 37TH ANNUAL QUALITY CONGRESS 202-20 1983 MUNDEL AUGUST BAUGUST B. MUNDEL ASSOCIATES WHITE PLAINS NY 10605
119. OUALITy COST II: THE ECONOMICS OF OUALITY IMPROVEMENTQUALITY PROGRESS 48-51 1985 HAGAN JOHN T
120.OUALITY COST PRINCIPLES A PREVIEWASQC 34TH ANNUAL QUALITY CONGRESS 542-54 1980 CORCORAN FRANKJ QA SPECIALIST TRAIN & MGMT SER LITTLE FALLS NJ 07424
121.OUALITY COSTS
IDEAS AND APP A COLL OF PAP AM SOC FOR QUAL CONT 1982
122.OUALITY COSTS - A NEW PERSPECTIVE
ASQC 33RD ANNUAL QUALITY CONGRESS 575-58 1979 KROEGER ROBERTC MANAGER RELIABILITY & QUAL ASS GENERAL ELECTRIC COMPANYAESD UTICA NY 12503
123. OUALITY COSTS - A REVIEW AND PREVIEW
ASQC 34TH ANNUAL QUALITY CONGRESS 538-54 1980 BREWER CLYDE WDIRECTOR-QUALITY OTIS ENGINEERING CORPORATION
124. OUALITY COSTS - WHAT DOES MANAGEMENT EXPECT?
ASQC 32ND ANNUAL QUALITY CONGRESS 608-61 1978 GRYNA, JR DR.FRANK M PROF OF INDUSTRIAL ENGINEERING BRADLEY UNIVERSITYPEORIA IL 61625
7-12

6-206 935- -COST OF QUALITY EVALUATION METHODOLOGIES HNOBOOK(U) 3.'3WALLACE AND CO FAIRBORN ON N J GRUNEWALD ET AL.29 JUL 88 F33657-96-0-0094
UNCLAISSIFIED F/O 5/1 NL
I EEEEEEEEEEE

Wo"I Il
fUU~~1 wI Ion1

BIBLIOGRAPHY
125. QUALITY 70-71 1979 ALFORD REX E
126.QALITX COSTO - WNZR T STT PhR III
QUALITY 40-42 1979 ALFORD REX E
127.QUALITY COST8 - WHZE _W START, PARTQUALITY 36-37 1979 ALFORD REX E
128. 1QLITY COSTS CAN Bl SOLD: PARTASQC 35TH ANNUAL QUALITY CONGRESS 737-74 1981 BREEZE JOHN DMANAGER QUALITY ASSURANCE HERMES ELECTRONICS LIMITEDFARRELL J R GENERAL MANAGER
129.QUALIT COIST U -THE ECONOMICS OF OUALITY IMPROVEMENTASQC 39TH ANNUAL QUALITY CONGRESS 53 1985 HAGEN JOHN T ITTCORP. NEW YORK NY 10022
130.OUALITY COSTS ;N A NON-MANUFACTURING ENVIROMENTASQC 37TH ANNUAL QUALITY CONGRESS 296-30 1983 SCANLON FRANKSECRETARY DIR OF ED/QUAL THE HARTFORD INSURANCE GROUPHARTFORD CT 06115
131. OUALITY COSTS IN THE PROCESS INDUSTRIES
ASQC 37TH ANNUAL QUALITY CONGRESS 207-21 1983 SIFF WALTERJAMES RIVER GRAPHICS SOUTH HADLEY MA 01075
132. OUALITY COSTS- PAY
ASQC 36TH ANNUAL QUALITY CONGRESS 860-86 1982 DEMETRIOUSJAMES MANAGER OF QUALITY ADMIN ITT AVIONICS DIVISIONCLIFTON NJ
133. OUALITY COSTS: IDEAS AND APPLICATIONS A COLLECTION OF PAPERS
AMERICAN SPEC QUAL CONT INC. 1984 VARIOUS
134.QUALITY COSTS: W_ KNOW WHERE WE'RE GOING! PO YOU?ASQC 37TH ANNUAL QUALITY CONGRESS 457-46 1983 WAYNE JAMES JMANAGER, ACCOUNTING HARNISCHFEGER CORPORATION ESCANABA MIGRIMM ANDRES F MANAGER, QUALITY CONTROL
135.QULI I OVEENT AND LEARNING IN PRODUCTIVE SYSTEMS
MANAGEMENT SCIENCE VOL 32 NO 10 1301-1 1986 FINE CHARLES H7-13

BIBLIOGRAPHY
136.QUALITY ZIPROVEM IN A MARKETING ORGANIZATION
46-51 1985 WARREN NICKELL L QUALITY PROGRESS
137.OUALITY IS ZPBU
1979 CROSBY PHILLIP B MCGRAW-HILL BOOK COMPANY
138. QRLIfl i ZB
TS156.6C76 CROSBY PHILLIP B MCGRAW-HILL
139. Q.UALITY I MORE TA MAKING A PRODUCT
139-14 1983 TAKEUCH HORIOTAKA HARVARD BUSINESS REVIEWQUELCH JOHN H
140.QUALITY MANAGEMENT THROUGH QUALITY INDICATORS: A NEW APPROACHASQC 33RD ANNUAL QUALITY CONGRESS 710-71 1979 PURI SUBHASH CCHIEF STATISTICIAN FOOD PROD & MARKETING BRANCH
141.QUALITY MANAGER'S JOB OPTIMIZE COSTS. THEASQC 37TH ANNUAL QUALITY CONGRESS 301-30 1983 NOZ JR. WILLIAMC PRINCIPAL ENGINEER POLAROID CORP CAMBRIDGE MA 02139REDDING BRADLEY F QUALITY MANAGER WARE PAUL A SENIORENGINEER
142. QUALITY MEASUREMENT FOR PERSONNEL SERVICES*
ASQC 34TH ANNUAL QUALITY CONGRESS 262-26 1980 HERSHAUER JAMESC PROFESSOR OF QUANTATIVE SYST ARIZONA STATE UNIVERSITYTEMPE AZ
143. QUALITY ON THE LINE
65-75 1983 GARVIN DAVID A HARVARD BUSINESS REVIEW
144.QUALITY OPTIMINZATION VIA TOTAL QUALITY COSTSASQC 35TH ANNUAL QUALITY CONGRESS 729-73 1981 ZALUDOVA A HNAT RES INST FOR MACH DES PRA ZALUD F H AUTO RESINST PRAG CZECH
145.UALITX POSTURE - A PROFIT/SURVIVAL CHALLENGE, YOUR
ASQC 35TH ANNUAL QUALITY CONGRESS 485-49 1981 DUBBINS RICHARDK PRINCIPAL SYSTEMS ENGINEER HONEYWELL INC. FORT WASHINGTONPA 19034
7-1/

BIBLIOGRAPHY
146.
WALLACE AND COMPANY
147. OUALTY PROQAM MODELING FOM COST ZrZETLIV TAILORING
ASQC 34TH ANNUAL QUALITY CONGRESS 648-65 1980 WILHELM W CMANAGER QUALITY ASSURANCE SYSTEMS POMONA CA
148. QUALXTY EUTATION = a PRECIOUS ASSZT
ASQC 34TH ANNUAL QUALITY CONGRESS 145-15 1980 UTZIG LAWRENCEJ CONSULTANT - PRODUCT QUALITY GENERAL ELECTRIC COMPANYFAIRFIELD CT 06431
149."QUALITY VS BUSINESS WHICH MANAGEMENT COMMITMENTASQC 37TH ANNUAL QUALITY CONGRESS 381-38 1983 DOBBINS RICHARDK PRINCIPAL SYSTEMS ENGINEER HONEYWELL INC FORT WASHINGTONPA 19034
150. OUALITY WITHOUT TEARS1984 CROSBY PHILLIP B MCGRAW-HILL BOOK COMPANY
151.OUALITY/RELIABILITY CHALLENGES FOR THE 1980'SASQC 34TH ANNUAL QUALITY CONGRESS 662-66 1980 GURANATHA TP. ENG XEROX CORP
152.OUEST FOR OUALIT
HALE ROGER L HOELSCHER DOUGLAS RROWAL RONALD E
153.RECENT ADVANCES IN STRESS SCREENINGASQC 40TH ANNUAL QUALITY CONGRESS 516-53 1986 HOBBS GREGG KPH.D. HOBBS ENGINEERING CORPORATION LAGUNA HILLS CA 92653
154.REDUCING APPRAISAL COSTSASQC 32ND ANNUAL QUALITY CONGRESS 650-65 1978 DAWES EDGER WCORP QUAL ASSUR MANAGER VEEDER - ROOT CO. HARTFORD CT 061020
155. FrAILURE COST AND MEASURING IMPROVEMENTASQC 37TH ANNUAL QUALITY CONGRESS 454-45 1983 WINCHELLWILLIAM 0 ADMINISTRATOR SERVICE SECTION GENERAL MOTORSCORPORATION DETROIT MI 48202
7-1 1

BIBLIOGRAPHY
156. LATIONHIP QZ FINAN CI I QBMTIO k QUALITY COSTS. A
TUTORIA0ASQC 39TH ANNUAL QUALITY CONGRESS 193-20 1985 SZYMANSKI EARLT ABBOTT LABORATORIES NORTH CHICAGO IL 60064
157. MXLING PLANO USINQ COST RATIOS MM LOT HISTORY
ASQC 38TH ANNUAL QUALITY CONGRESS 202-20 1984 KEATS BERT JASSOCIATE PROFESSOR DEPART OF INDUST AND MANAG TEMPE AZ85287 CASE KENNETH E PROFESSOR, OKLA STATE UNIV
15 8*. ELECTION QF HIL-STD-105D PLANS BASED ON COSTS
ASQC 35TH ANNUAL QUALITY CONGRESS 475-48 1981 LIEBESMAN DR.BURTON S BELL TELEPHONE LABORATORIES HOLMDEL NJ 07733
159. SOCIAL QALITY & REGULATORY COSTS
ASQC 34TH ANNUAL QUALITY CONGRESS 656-66 1980 SCHOCK, JRHARVEY E PRODUCT ASSURANCE CONSULTING HADDONFIELD NJ08033
160.SOLVING THE QUALITY COST EQUATIONASQC 40TH ANNUAL QUALITY CONGRESS 714-71 1986 KILDAHL DAVID DQUALITY ASSURANCE ENGINEER HONEYWELL INCORPORATEDMINNEAPOLIS MN 55440
161.STRATEGIC PLANNING OF QUALITY AND ITS ASSURANCE
ASQC 35TH ANNUAL QUALITY CONGRESS 491-49 1981 ZELLER HERMAN JSIEMENS A.G. MUNTCH
162. STUDY COSTS & IMPROVE PRODUCTIVITY
ASQC 36TH ANNUAL QUALITY CONGRESS 876-88 1982 ORTWEIN WILLIAMJ PRATT & WHITNEY AIRCRAFT EAST HARTFORD CT
163. 1 UPPLIERS QUIY ASSURANCE PROGRAM REOUIREMENTS
MIL-STD-1535A
164. ISCNIQUi USED FOR QUALITY COST CONTROL
WALLACE AND COMPANY
165.TEST COST AVOIDANCE PROGRAM TAT WORKS, AASQC 38TH ANNUAL QUALITY CONGRESS 77-81 1984 DUHAN DANIEL M
7-16

BIBLIOGRAPHY
166. T.= SJXUALi ZFZCT Q DATh GATHERINGASQC 35TH ANNUAL QUALITY CONGRESS 937-94 1981 JOHNSON BRUCEDIRECTOR QUALITY ASSURANCE MSI DATA CORPORATION COSTA MESACA
167. THE SUPERMANAGERS
HD31.H445 1984 HILLER ROBERT TRUMANS TALLY BOOKS
168. THEORY1986 GUSPARI JOHN AMERICAN MANAGEMENT ASSOC NEW
YORK NY
169. TOTAL OUALIT CONTROLTHIRD EDITION 1983 FEIGENBAUM A V MCGRAW-HILL BOOK
COMPANY
170.TOTAL OUALITY CONTROLTS156F44 1983 FEIGENBAUM A V MCGRAW-HILL BOOK CO
171.TUTORIAL ON QUALITY COSTS-WHAT & HOWASQC 34TH ANNUAL QUALITY CONGRESS 376 1980 WILLIAMS RONALD JQUALITY ASSURANCE TECHNICIAN AUTOMATIC SWITCH COMPANY
172. USING QUALITY COST ANALYSIS FOR MANAGEMENT IMPROVEMENT
INDUSTRIAL ENGINEERING 46-50 1987 BLANK LEE P.E.SOLARZANO JORGE
173. USING OUALITY COSTS IN PRODUCTIVITY MEASUREMENT
ASQC 37TH ANNUAL QUALITY CONGRESS 211-21 1983 SINK SCOTT DPH.D. PE SCHOOL OF INDUSTRIAL ENG STILLWATER OK 74078KEATS JOHN B PH.D. PE ASSOC PRO ASSIST PRO
174.VERIFYING DESIGN QUALITY
ASQC 38TH ANNUAL QUALITY CONGRESS 176-18 1984 BURGEES JOHN AWESTINGHOUSE ELECTRIC CORP MUNCIE IN 473020
175.WAST-COME OUT, COME OMT WHEREVER YOUR ARE
5-8 1987 BODEK NORMAN PUBLISHER PROCTIVITY INC
7-17

BIBLIOGRAPHY
176. nX Q-Q NEED ZRINDUSTRY WEEK 37-39 1978 SMITH MARTIN R
177.YOU COST C, 9_TIN UP T I 0
HARVARD BUSINESS REVIEW 133-13 1982 EILER ROBERT GGLETZ WALTER K KEAGAN DANIEL
178.ZERO DEFECTS
1966 HALPIN J F MCGRAW-HILL
7-18
0
APPENDIX AEXAMPLES OF TYPICAL COSTS OF QUALITY
0
S

Preventon:Quality engineeringQuality circlesQuality trainingSupervision of prevention activitiesPilot studiesSystems developmentProcess controlsTechnical support provided to vendorsAnalysis of in-house processes for the purpose of improving qualityAuditing the effectiveness of the quality system
Appraisal:Supplies used in test and inspectionTest and inspection of incoming materialsComponent inspection and testingReview of sales orders for accuracyIn-process inspectionFinal product inspection and testingField inspection at customer site prior to final release of productReliability testingSupervision of appraisal activitiesPlant utilities in inspection areaDepreciation of test equipmentInternal audits of inventory
Internal Failure: -Net cost of scrapNet cost of spoilageDisposal of defective productRework labor and overheadReinspection of reworked productRetest of reworked productDowntime due to quality problemsNet opportunity cost of products classified as secondsData re-entered due to keypunch errorsDefect cause analysis and investigationRevision of in-house computer programs due to software errorsAdjusting entries necessitated by quality problems
External Failure:Cost of responding to customer complaintsInvestigation of customer claitns on warrantyWarranty repairs and replacementsOut-of-warranty repairs and replacementsProduct recallsProduct liabilityReturns and allowances because of quality problemsOpportunity cost of lost sales because of bad quality reputation
-. r.:e' :y :ernis::r.: " -.. . :r.z "- -- ' .... .. ..Asscciat:. :f. .,- -- -' '- --- ,9

A. APPRAISAL COSTS
1. Production equipment qualification and recertification
2. Evaluation and audit of entire quality assurance program
3. Quality inference data analysis
4. Process control data analysis
5. Final test at customer's site; can be divided or categorizedas salaries, equipment not capitalized, rental charges forequipment, supplies, travel expense, and subsistence
6. Final test in plant by sampling techniques; can be dividedor categorized as wages, equipment not capitalized, rentalof equipment, and supplies
7. Final inspection in plant by sampling techniques; can bedivided or categorized as wages, equipment not capitalized,rental of equipment, and supplies
8. Portion of 100% final test chargeable to quality inference
9. Portion of i00--final inspection chargeable to qualityinference
10. Outside laboratories charges for tests on finished goods
11. Portion of 100% laboratory final test chargeable to qualityinference
12. Inspection and release of finished prototypes or firstfinished units
13. Test of finished prototypes or first finished units
14. Incoming test by sampling techniques; can be divided orcategorized into wages, equipment not capitalized, rental ofequipment, and supplies
15. Incoming inspection by sampling techniques; can be dividedor categorized into wages, equipment not capitalized, rentalof equipment and supplies
16. Portion of 100% incoming inspection chargeable to qualityinference
17. Portion of 100% incoming test chargeable to qualityinference

18. Outside laboratories charges for tests on incoming material
19. Vendors charges for tests on incoming material
20. Laboratory test of incoming materials by samplingtechniques; can be divided or categorized into wages,equipment not capitalized rental of equipment, and supplies
21. Portion of 100% laboratory test of incoming materialschargeable to quality inference
22. First piece inspection; can be divided or categorized intowages, equipment not capitalized rental for equipment, andsupplies
23. First piece test; can be divided or categorized into wages,equipment not capitalized, rental for equipment, andsupplies
24. In-process inspection by sampling procedures; can be dividedor categorized into wages, equipment not capitalized, rentalfor equipment, and supplies
25. In-process test by sampling procedures; can be divided orcategorized into wages, equipment, and supplies
26. Portion of 100% in-process inspection chargeable to qualityinference
28. Portion of 100% laboratory in-process test chargeable toquality inference
29. Outside laboratories charges for tests on in-processmaterial
30. Process control tests; can be broken into wages, equipmentnot capitalized, rental for equipment, and supplies
31. Cost of product destroyed in testing; can be divided intoincoming, in-process, first piece, and process control
32. Auditing systems and procedures
33. Auditing product-quality
34. Auditing process control and process control tests
35. Audit of product packing

36. Audit activities to evaluate end product quality andreliability; including auditing systems, procedures,calculations and performance
37. Surveillance of special operations and processes
38. Vendor quality surveillance
39. Inspection supplies
40. Test supplies
41. Tests for evaluating end product quality and reliability,includes life, environment and reliability tests
42. Set-up for test
43. Set-up for inspection
44. Test of product packing
45. Inspection of product packing
46. Quality checking operations by production employees
47. Inspection and test activity to review templates and tools
48. Reinspection of jigs and fixtures
49. Requalification tests of tools and processes
50. Inspection and test activity to give data on effectivenessof corrective actions
51. Reports of inspections
52. Reports of tests
53. Data processing, filing, and summarizing
0"

B. INTERNAL FAILURE
1. Failure analysis including cause of scrap and cause ofrework; can be further divided or categorized as wages,rental of equipment, equipment not capitalized, supplies,and vendor contacts
2. Failure analysis of purchased parts including investigationof cause of scrap and cause of rework; can be segregatedinto wages, equipment not capitalized, rental charges forequipment, supplies, travel costs, and vendor contacts
3. Failure analysis consisting of special tests and inspections
4. Portion of 100% final test due to need to eliminate defec-tive product
5. Portions of 100% final inspection due to need to eliminatedefective product
6. Portion of 100% laboratory final test chargeable to need toeliminate defective product
7. Portion of 100% incoming test chargeable to need to elimi-nate defective product
8. Portion of 100% incoming inspection chargeable to need toeliminate defective product
9. Portion of 100% laboratory test of incoming materialschargeable to need to eliminate defective product
10. Portion of 100% in-process test chargeable to need to elimi-nate defective product
11. Portion of 100% in-process inspection chargeable to need toeliminate defective product
12. Portion of 100% laboratory in-process test chargeable toneed to eliminate defective product
13. Material Review Board activities either formal or informal;may be subdivided into disposition is scrap, disposition isrework, disposition is downgraded material
14. Rework (includes failure correction in defective product);may be divided into (a) produced internally and (b) purchasematerial; (a) may be then divided into inspection and testerror or production error; (b) may be divided into orderedincorrectly or defective

15. Evaluation of reworked material inspection and test data
16. Inspection of reworked material
17. Test of reworked material
18. Rework fault of vendor
19. Scrap; production error; may be divided into producedinternally or purchased material-
20. Scrap; test or inspection error; may be divided into pro-duced internally or purchased material
21. Scrap; material in stock or received before effective can-cellation which failure analysis shows to be inadequate
22. Charges for canceling orders when defect analysis shows
material to be inadequate
23. Scrap; fault of vendor
24. Downgrading; loss in value of product due to not meetingplanned requirements but still has more than salvage value
25. Downtime; loss in production time due to failure analysis or
defective product
26. Reinspection due to product defects (not after rework)
27. Re-test due to product defects (not after rework)
28. Extra production operations added because of presence ofdefectives
29. Extra inspections due to product defects (not 100%screening)
30. Extra tests due to product defects (not 100% screening)
31. Incidental costs of scrap
32. Incidental costs of rework
33. Replacement of lost material
34. Replacement of material damaged between departments
35. Rejection report writing and processing

36. Extra record keeping due to defective products
37. Burden arising from excess production capacity necessitatedby defectives 38. Vendor charges for corrective engineeringfor process
39. Corrective engineering for processes - not analysis
40. Retooling because of corrective engineering
41. Rework of patterns, molds, or jigs due to low quality
42. Redesign of patterns, molds, or jigs due to low quality
43. Refabrication of patterns, molds, or jigs due to low quality
44. Defect inference data analysis (failure analysis data anal-ysis)

C. EXTERNAL FAILURE
1. Field failure analysis for purpose of taking correctiveaction for future production
2. Field complaint investigation for purposes of taking volun-tary corrective action on equipment now in customers' use;may be divided into wages, travel expense, subsistence,equipment, and supplies
3. Field complaint investigation for purpose of in-guaranteecorrections; may be divided into travel, subsistence, wages,equipment, and supplies
4. Field complaint negotiations with customers
5. Field repair performed voluntarily to prevent future cus-tomer complaints
6. Field service performed voluntarily to prevent future cus-tomer complaints
7. Engineering for in-plant correction of field complaintbecause of expressed or implied guarantees
8. Engineering for field correction of field complaint becauseof expressed or implied guarantees
9. Repairs for in-plant correction of field complaint becauseof expressed or implied guarantees
10. Repairs for field correction of field complaint because ofexpressed or implied guarantees
11. Production for in-plant correction of field complaintbecause of expressed or implied guarantees
12. Production for field correction of field complaint becauseof expressed or implied guarantees
13. Service for in-plant correction of field complaint becauseof expressed or implied guarantees
14. Service for field correction of field complaint because ofexpressed or implied guarantees
15. Billing adjustment or allowance because of expressed orimplied guarantees

16. Loss of quality or reliability incentive fees
17. Loss of customer good will
18. Business policy concessions to customer (not part of qualityrelated costs) 19. Vendor charges for corrective engineeringfor product
20. Corrective engineering for product - not failure analysis(possibility caused by quality or reliability failure anal-ysis)
21. Vendor charges for failure analysis
0

0D. PREVENTION
1. Vendor charges for quality engineering in process planning
2. Vendor charges for quality engineering in product design
3. Quality engineering in designs for product including exam-inations of tolerances.
4. Quality engineering in new designs of processes
5. Planning control of vendor audits, surveillance and surveys
6. Travel costs for other quality purposed (not failure anal-ysis)
7. Vendor contacts for quality purposes not failure analysisefforts
8. Verification and review of information supplied to vendor
9. Travel costs for vendor rating
10. Vendor contracts for vendor rating
11. Vendor rating; analysis of performance records
12. Vendor rating; keeping performance records
13. Vendor rating; evaluating quality capabilities
14. Vendor rating; evaluating reliability capabilities
15. Planning incoming test
16. Planning incoming inspection
17. Formulation and issuance of test procedures
18. Formulation and issuance of inspection procedures
19. Implementing test and inspection procedures
20. Purchase of test or material for devices (not capitalized)including procurement planning
21. Purchase of inspection devices or material for devices (notcapitalized) including procurement planning
O 22. Construction of test devices (not capitalized)

23. Construction of inspection devices (not capitalized)
24. Design and development of test devices (not capitalized)
25. Design of inspection devices (not capitalized)
26. Design of measurement devices (not capitalized)
27. Design and development of control devices (not capitalized)
28. Rental or use charges for others' inspection equipment
29. Rental or use charges for others' test equipment
30. Depreciation write-off for capitalized inspection and testequipment (may be different from tax write off)
31. Formulation, issuance, and implementation of process con-trols
32. Development of process controls
33. Review of product packing
34. Training and education of inspection employees for quality
35. Training and education of test employees for quality
36. Training and education of special process evaluation employ-ees for quality
37. Planning quality training and education
38. Conducting quality training and education
39. Employee certification and training for training for certi-fication and recertification (does not include instructionfor achievement of normal proficiency)
40. Training and education of production employees for quality
41. Reliability engineering benefiting quality
42. Other reliability activities benefiting quality
43. Quality review of tool design
44. Tool use coordination
45. Customer contacts for quality purposes not failure analysisefforts

46. Evaluation of customer quality requirements and existing
plant capabilities
47. Formulation, issuance, and implementation of quality plans
48. Formulation and interpretation of quality standards
49. Formulation and coordination of specifications
50. Prescribing and recording policies and procedures for qual-ity assurance
51. Planning and performing process capability experiments
52. Analysis of pre-production run data
53. Analysis of quality inference data prior to product shipment
54. Evaluation and analysis of entire quality cost data
55. Maintenance of test equipment
56. Maintenance of inspection equipment
0 57. Calibration of test equipment
58. Calibration of inspection equipment
59. Calibration of production equipment
60. Maintaining primary standards
61. Calibration laboratory for gauges and measuring devices
62. Vendor audit

E. GENERAL COSTS
1. Planning quality cost analysis system
2. Administration costs; includes elements not logically a partof quality creation, quality inference, or defect inference
3. Accounting and data processing cost incurred in accumula-ting, analyzing and reporting quality and reliability data
4. Handling and records control of equipment in storage or intransport to calibration laboratory
5. Cost of power consumed in test, inspection, or qualityassurance department
6. Value of floor space used primarily for inspection or test
7. Equipment depreciation; remaining book value at time ofreplacement of capitalized equipment
8. Approval by outside agencies such as Underwriters Laboratoryfees, product endorsement fees, insurance underwriters, andoutside test labs
9. Control of stores tools
10. Periodic inspection of stored tools
11. Quality and reliability studies for bid proposals

APPENDIX BSURVEY RESULTS

INDUSTRY SURVEY QUESTIONNAIRE
(CONDUCTED VIA TELEPHONE)
1. Are you using any measures of cost of quality as a
management tool at this time?
Yes or No
2. If yes, at what level? (who looks at/uses the data?)
3. If not, why not? Have you considered it, and then rejectedit?
4. What are the measures you are looking at?
5. How is the data expressed?
6. How is the data captured?Through standard accounting system?Special systemAny changes made to accounting system?
What?
7. What are you doing as a result of having the data?Goals to reduce?
Identifying problem areas?
8. What are you using to gage the meaning of your COQmeasurement? (Standard for measurement)

9. How long have you been measuring COQ and using it as amanagement tool?
10. What caused you to start looking at COQ?GovernmentOther
11. Based on your experience up to now, do you believe use ofCOQ will continue?
12. In order to make the handbook of maximum benefit togovernment and the contractor, what one thing would yourecommend we include when developing the book?

0 40
I~i -wA
-J ~ -> - 0
>~ 0 go
CD_ z u A
0 .4 ca uj Jwl 0LJ :m- L&
4cI ON
knzI- w
Z -J O ~ Cttoo.,
La.. LU ~ .~ Z
LU 0 ~ ' ~ LU >- > tI
0 0 OLL0
LUJ -cc
-~~ (a-~4-
LL ~ . O L L Z -14j

TlpoeSurvey
Generally speaking, those companies surveyed indicated that theywere using cost of quality as a management tool. Four chose notto respond to our survey when called. Of the two companies notusing it, reasons given were:
- Three chose not to respond to our survey when called.
- One had just recently established a quality department.
- One had tried it and had not found it to be useful.
Of those companies using cost of quality, 73% indicated thattheir primary focus is on internal failure costs, while 38% saidthat they also looked at appraisal and prevention costs. How-ever, of that 38% (24 companies), only two were looking beyondthe quality department for any costs, in this case at the engi-neering function. Two of the twenty four were following thegeneral guidelines developed by the Aerospace Industrial Associ-ation and the America Society for Quality Control.
As for who looks at the data, 83% or 52 companies indicated thattop and middle level managers reviewed the data in some form, butonly 40% said that the data was used at the first line supervi-sion level as an aid to getting at problems.
0The survey revealed that 68% of the companies expressed the datain terms of some dollar amount. Thirty percent looked at thedata as a percentage of sales, while 49% looked at the data as apercent of direct labor. Seven companies looked at the data interms of actual direct hours expended, and one in terms of per-centage of material.
In 68% of the companies, cost of quality data used was capturedthrough the normal accounting system. Use of a system above andbeyond the normal accounting system occurred in 49% of the com-panies (so in 49% both the normal and an additional system isused). Usually the additional system consisted of personal com-puters located in the quality department.
As for what use is made of the data, 40% said they had estab-lished goals for reduction. However, many felt goals were not agood idea, and the survey found that 51% were using trend analy-sis rather than goals. Fully 23% were also using Pareto analysisas a technique for making meaningful use of the data. Only 17%said that they specifically used the available cost of qualitydata as a tool for their corrective action board process (thesurvey did not determine what percent of the contractors surveyedhad MIL-STD-1520 as a contractual requirement).

In terms of how long the companies had been using cost of quality
as a management tool, the survey revealed:
1 year 15%
1 - 3 years 20%
3 - 10 years 38%
10 years + 27%
When asked what caused them to embrace cost of quality as a man-agement tool, 74% said it was the government requirement, while57% said it was a combination of both government and recognitionof the good business sense to do it. Fully 100% said they willcontinue to use cost of quality as a management tool.
Company representatives were also asked to express their opinionregarding what the handbook should contain in terms of guidance,cautions, etc. The list below reflects their input. Note: Itis divided or categorized by the "top ten" responses, followed byall other input. The number in parenthesis indicates the fre-quency of that response.

INDUSTRY COMMENTS ON WHAT TOINCLUDE IN HANDBOOK
TOP TEN
Allow for implementation leeway - unique by company
(17)
- Tie in with 9858 and 1520. (10)
- Does contractor have a system and is he pursuing
improvement. (9)
- Do not attempt to compare companies or industries. (9)
- Define cost of quality. (9)
- Explain how to use the data, especially MRB and CAB.
(5)
- Use trend analysis, long term, not short term. (4)
- Manage the basic information. (4)
- Stress multi-disciplined approach early on. (4)
- Do not pressure into producing bad data. (4)
0

0ALL OTHER REPN
- Quality not measured by SSR only. (3)
- Be cautious of overhead affects on data. (3)
- Put audit requirements on contract. (3)
- Define prevention costs better. (3)
- When COQ should be applied by the government. (3)
- Normalize data and do not expose the contractor. (3)
- Use goal setting so contractor knows how he doing. (3)
- Appreciate product mix and quality system differences.
(2)
- Use phased in approach, like on 1567.
- Top level in government sees need for defect reporting
supported by COQ; lower level fragmented at system
level, no emphasis on effectiveness.
- Use transition process to get better quality.
- Recognize that looking at percent reduction is wrong.
- Be positive.
- Engineering effort is often intangible.
- Hard to find engineering measure you can track
statistically.
- Measure down to low enough level to be useful.
- A good measurement base is needed.
- Better definition of government upper and lower limits.
- Back off on getting vendor costs.
- Emphasize prevention.

Prevention costs not worth the effort.
Handbook 50 not contractual, but used to evaluate.
- Train government and industry on what is desired in
Cost of Quality
Get company officials to buy into Cost of Quality.
Vendor Cost of Quality very important and has big
savings potential.

RESULTS OF ON-SITE INTERVIEWS
CONTRACTOR VISITS
In addition to the 63 contractors interviewed over the telephone,
on-site visits were made to two contractors, one Defense Contract
Administration Services (DCAS) Regional Headquarters, and one
recognized cost of quality expert in the world of academia.
Both of the contractors visited were under DCAS surveillance.
They confirmed that during their recent cost of quality audits
conducted by DCAS, the focus was on FAILURE costs only. (See
comments in Chapter 2, pages 2-8 to 2-12). Although DCAS has
expanded on what the people in the field should understand and
look for in the cost of quality area in DLAM 8200.2, the contrac-
tors that were visited, as well as several of those contacted by
telephone, made the point that the DCAS manual is not a contrac-
tual requirement, and they were not doing anythinQ in terms of
trvina to comply with that manual. Both contractors also expres-
sed concern over the fact in dealing with the government, they
feel everyone wants something different. DCAS wants one thing,
DCAA another, the Air Force yet ancther, and so on. In terms of
what should be included in the hanc.ook, the responses given by
the contractors visited have been included in the lists of the
industry "top 10" and "All Others", given above.
In our discussion with DCAS personnel, we found a great deal of
consistency between what they saw as problems in dealing with
cost of quality and what the contractors said (telephone and

those visited). For example, the emphasis must be on the use of
cost of quality data, not on just having it available. Flexibil-
ity is needed to acco-uodate different product lines, different
program phases, and different business management and financial
accounting approaches. One point made was that it is difficult
to ascertain at this stage what, if any, benefits are being real-
ized through the contractors' corrective action board process by
having/using cost of quality information. One opinion expressed
was that doing a good cost of quality effort can be used effec-
tively when tying in other government initiatives, such as Air
Force GET SPEC, and emphasis on prime contractor of
subcontractors.
GOVERMNT DISCUSSIONS
In terms of what DCAS personnel recommended be included or
covered in the handbook, these are the major items discussed.
- Standard base for expressing cost of quality would be
beneficial.
- Documentation of contractor action taken as a result of
reacting to cost of quality is lacking and is needed.
- Overhead rates vary too much, not true reflections of
cost of quality burden. Should use FPRA rates, clearly
defined. Need to standardize.
- Data must be traceable down to the nonconforming item.
- What corrective action should be included in cost of
quality should be spelled out.
Warranty costs must be clearly defined.
- Importance of "start up scrap", planned scrap

versus actual spoilage should be considered.
Once elements are identified, data must be collected.
Set no dollar threshold on what is good or bad for cost
of quality.
Clearly express the purpose of why government is look-
ing at Cost of Quality and wants contractors to look at
it.
Allow contractor to use estimates, as long as he can
justify ths estimate.
Must protect the data.
Allow contractors to establish standards. Must be
updated.
EXPERT OPINION
Our discussion with the recognized expert centered around that
person's extensive experience in industry, academia, and as a key
player for over 15 years with the American Society for Quality
Control (ASQC) Cost of Quality committee activities. The high-
lights of our discussions focused on the fact that data has shown
what big contributions are made by functional activities other
than lust the auality department to a company's total cost of
quality. For example, there is typically a heavy emphasis on
test activities, to verify or prove the quality of the product.
Often, as much as 70% of the quality budget is spent in test.
But, production operator inspection has been found to be a bigger
cost than formal quality department inspections. Companies today
are doing everythinq they can to reduce direct labor to aide

Drofitability. ptroer use. cost of quality would pay much
biggr diidnds, because it attacks the entire organization.
Direct labor is typically, although not always, a fairly small
percentage of the total cost of an item. The preferred base for
measuring cost of quality is "percent of value added". The most
important aspect of having the cost of quality, other than using
it, is the fact that you now have "defined the quality system",
expressed in terms of the cost of that system.

APPENDIX CPROPOSAL REVIEW CHECKLIST
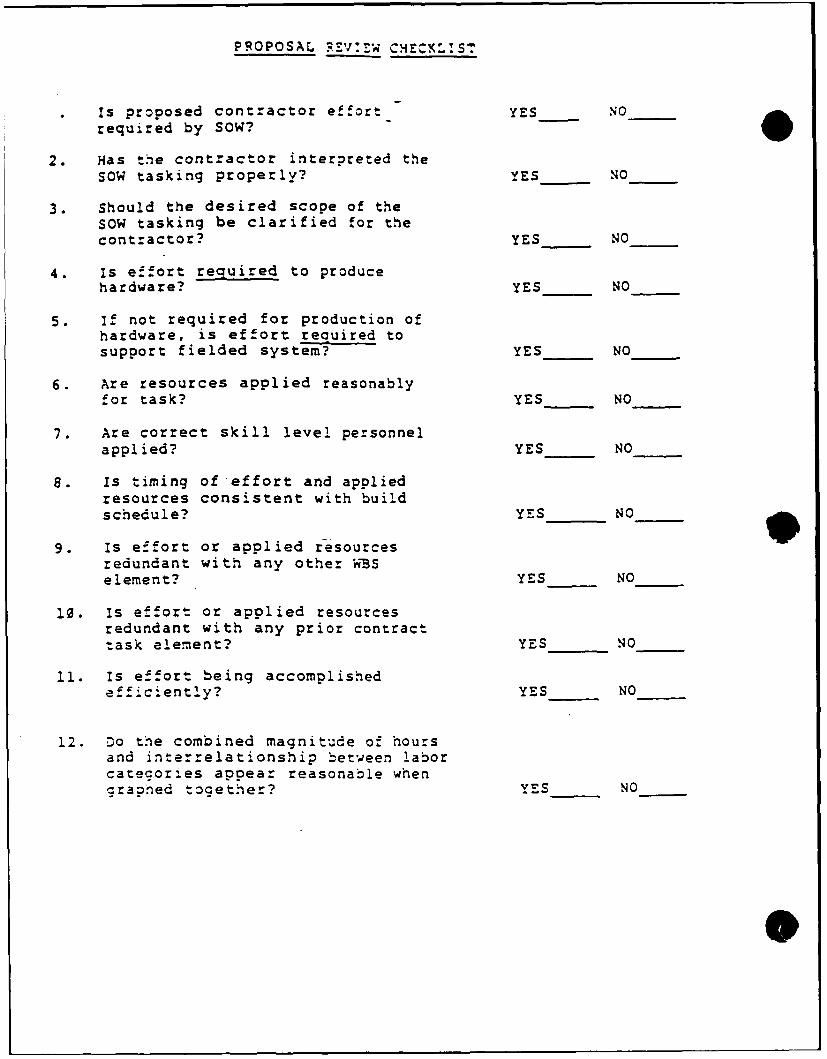
PROPOSAL RZV:-.W C XE2KLIST
Is proposed contractor effort YES NOrequired by SOW?
2. Has the contractor interpreted theSOW tasking properly? YES NO
3. Should the desired scope of theSOW tasking be clarified for thecontractor? YES NO
4. is effort required to producehardware? YES NO
5. if not required for production ofhardware, is effort recuired tosupport fielded system? YES NO
6. Are resources applied reasonablyfor task? YES NO
7. Are correct skill level personnelapplied? YES NO
8. Is timing of effort and appliedresources consistent with buildschedule? YES NO
9. Is effort or applied resourcesredundant with any other WBSelement? YES NO
10. Is effort or applied resourcesredundant with any prior contracttask element? YES NO
11. Is effort being accomplishedefficiently? YES NO
12. Do the combined magnitude of hoursand interrelationship between laborcategories appear reasonable whengraphed together? YES NO

APPENDIX DSAMPLE AWARD FEE
EVALUATION CRITERIA

SAMPLE AWARD FEE EVALUATION CRITERIA
I. FEE DETERMINATION
A. Evaluation Criteria
The evaluation criteria and relative weightings are asfollows:
1. Improvement Goals - Achievement of qualityimprovement goals stated in Program Task Plans(PTP) based in part on use of cost of qualitydata. (20%)
2. Schedules - Reasonableness of projection anddegree of achievement of the following PTPmilestones consistent with the Statement of Workpriority system (10%).
a. Capturing cost of quality
b. Dissemination of cost of quality
c. Evidence of use of cost of quality
d. Results of cost of quality based improvementprojects
3. Budget Projection - Ability to accurately projectWBS 3rd level budgets (a comparison of WBS 3rdlevel budgets versus projected WBS 3rd levelEAC's) (15%).
4. Cost Control - Ability to control the cost of thetotal quality effort (cumulative budget to dateversus cumulative actuals to date) (15%).
5. Cost of Quality Management - Efficiency/effective-ness of accomplishing cost of quality objective insupport of the program (15%).
6. Responsiveness - Quality/timeliness/completeness/appropriateness of the Contractor's responsivenessto Government direction in the cost of qualityarea (15%).
7. Program Reviews - Quality/timeliness/completeness/appropriateness of use of cost of qualityinformation in reviews (including technical,management, and business aspects) (10%).

SECTION H - SPECIAL PROVISIONS
II. MANAGEMENT
Achievement of a Prevention Emphasis (Award Fee Available:)
OVERALL OBJECTIVE: Aggressive and innovative pursuit ofimproved Prevention Cost Effectiveness which providesincreased mission capability, better long-term readiness,and more cost-effective support.
A. Management Awareness - Direct involvement of managementthat demonstrates their commitment to Prevention CostEffectiveness improvements resulting from better appli-cation of preventative measures, which include:
o Thorough Prevention planning that has maximum costeffectiveness as demonstrated by reduced failurecosts.
o Program management support demonstrated by insti-tuting program-wide prevention policies that pro-mote improvement of Quality, and lower total cost9of Quality.
B. Engineering Analysis - Development of innovativemethods to assess Prevention measu~res. criteria forevaluation will include:
o Approaches to predicting and evaluating potentialproblems to support prevention planning and imple-mentation
o Utilization of prevention techniques that enhanceconfidence in early achievement-of requirements.
C. Management of Vendors - Positive measures taken toaffect improvement of prevention of defective outputthrough management of vendors. Specific evaluationcriteria are:
o Timely identification and resolution of problemsthat arise in the prevention management area ofcost of quality.
D. Testing - Achievement, as rapidly as possible, ofmaturation of reliability in order to maximize FSDmission success rate and insure readiness at IOC.

Criteria for evaluation will include:
o Early completion of scheduled reliability teststhat result in early accomplishment of other taskson the program schedule.
o Incorporation of prevention fixes that enhanceweapon system performance and supportabilitygoals.
III. TECHNICAL AND OPERATIONS (Award Fee Available:)
OVERALL OBJECTIVE: Aggressive, comprehensive use of cost ofquality as a management tool during design, development,manufacturing, quality assurance, subcontract management,and test efforts which drive superior operational effective-ness, system performance, and overall schedule accomplish-ment without compromising cost and supportability objec-tives.
A. Engineering Management - Evaluation will focus ondesign, development, and test tasks. Criteria willinclude:
o Problem Resolution: Rapid identification, throughuse of cost of quality information, of problemsand development of thorough corrective-actionplans. Rapid implementation of solutions thatoptimize benefits to the overall weapon system.
o Major Reviews: Thorough planning and professionalexecution of major reviews. Rapid response toaction items with creative resolution of areasdisagreement.
o System Performance Validation: Early completionof successful Flight Worthiness and QualificationTesting. Rapid evaluation of flight test data andearly validation of system and component perfor-mance.
B. Quality Assurance - Implementing Quality ImprovementPrograms (QIPs) which are based on cost of qualityindicators at suppliers. Areas to be evaluated atsuppliers will include:
o Top level management and commitment to improvequality, through use of cost of quality.

o Annual improvement goals which are measured andreported.
o Training and awareness programs.
C. Manufacturing Management - The ability of manufacturingmanagement organization to exceed expectations andcontractual requirements. Emphasis will be placed onuse of cost of quality data in the areas of:
o Management visibility
o Internal schedule status
o Productivity and Quality Improvement Programs
o Timely identification and resolution of productionrisks
D. Subcontract Management - The ability of subcontractmanagement organization to exceed Air Force expecta-tions and contractual requirements in managing subcon-tracts and materials requirements, particularly withthe critical subcontractors. Emphasis will be placedon use of cost of quality data in the areas of:
* o Management visibility
o Schedule status
o Productivity and Quality Improvement Programs
o Timely identification and resolution of productionrisks
E. Test Program - Timely, flexible, and substantial test-ing of the entire system, component functions, andperformance. The evaluation will be based on use ofcost of quality data as an integral part of:
o Imaginative and innovative efforts to effectivelyplan and document the test program.
o Perceptive approaches to accomplish test objec-tives.
o Superior management application of resources tostay on or ahead of schedule.

0IV. PROGRAM MANAGEMENT (Award Fee Available:)
OVERALL OBJECTIVE: Efficient, creative, and integratedmanagement approaches which stimulate superior cost effec-tiveness, enhanced system performance, and fulfillment ofrequirements well ahead of schedule, through integration ofcost of quality as a key management tool. Implementationshould be through disciplined management approaches employedin a timely manner.
A. Interface Management - How thoroughly and expeditiouslythe Contractor resolves management issues highlightedby cost of quality data. Items of interest include:
o Interface management communications.
o Adherence and adequacy of interface managementplans.
o Functional implementation and reporting of inter-face efforts.
B. Configuration -Management - Operation in an active man-agement mode, using innovative and creative methods toidentify potential trouble areas and resolve issuessurfaced by cost of quality indicators before theybecome problems. Items of interest include:
o Changes to established baselines.
o Configuration of each end item.
o Quality of data to enhance the streamlined manage-ment approach of the
D. Schedule and Cost Control - Creative management actionthat greatly improves schedule cost performance throughthe use of cost of quality data while meeting/exceedingthe program schedule milestones. Items of interestinclude:
o Ingenious plans to avoid potential cost overrunsthrough use of cost of quality as an integral partof program cost management.
o Creative planning to meet/exceed major scheduledprogram milestones.