o. · Ground-Penetrating Radar (GPR) surveys The ground-penetrating radar is an impulse radar...
34
• l Northeast NTC united States Department of Aqrioulture Soil conservation service 160 East 7th street Chester, PA 19013-6092 215 - 499-3960 Subject: Archaeological Studies in Hawaii Date: 7 May 1990 using Ground - penetrating Radar (GPR) Techniques; March 11-27, 1990 To: Don Hibbard Director Historic Preservation Program Department of Land and Natural Resources P. o. Box 621 Honolulu, Hawaii 96809 Field Investigation summary 1. Name of scs personnel: James A. Doolittle 2. State Visited: Hawaii 3. Dates and Duration: 11 to 27 March 1990; 17 days 4. Cooperating Institutions: A. USDA-Soil Conservation Service B. State of Hawaii - DLNR - State Historic Preservation 5. Objectives of Visit: To explore the potential of using ground - penetrating radar (GPR) and electromagnetic induction (EM) techniques for archaeological investigations in Hawaii. Research addressed the growing need for the development of rapid, economical, non-destructive methods to assist archaeologists assess sites. 6. summary of Activities: The ground-penetrating radar unit (@ 450 lbs) was shipped to Honolulu, Hawaii, on 28 February 1990. The unit arrived in Honolulu during the week of 5 March and was picked up by members of the State Historic Preservation staff. I arrived in Honolulu on 11 March 1990. Archaeological field investigations were carried out with the GPR on Oahu (12-14 March), Hawaii (15- 17 March), Kauai (17- 21 March), and Maui (22-23 March). The radar unit was returned to Philadelphia, Pennsylvania , on 23 March. A paper entitled "Ground- penetrating radar: possible uses in Hawaii" was presented at the 3rd Annual Meeting of the Society for Hawaiian Archaeology, Bishop Museum; Honolulu ('24-25 March). I departed Honolulu on the evening of 26 March and arrived in Philadelphia on 27 March.
Transcript of o. · Ground-Penetrating Radar (GPR) surveys The ground-penetrating radar is an impulse radar...

•
l
Northeast NTC united States Department of Aqrioulture
Soil conservation service
160 East 7th street Chester, PA 19013-6092 215- 499-3960
Subject: Archaeological Studies in Hawaii Date: 7 May 1990 using Ground- penetrating Radar (GPR) Techniques; March 11-27, 1990
To: Don Hibbard Director Historic Preservation Program Department of Land and Natural Resources P. o. Box 621 Honolulu, Hawai i 96809
Field Investigation summary
1. Name of scs personnel: James A. Doolittle
2. State Visited: Hawaii
3. Dates and Duration: 11 to 27 March 1990; 17 days
4. Cooperating Institutions: A. USDA-Soil Conservation Service B. State of Hawai i - DLNR - State Historic Preservation
5. Objectives of Visit: To explore the potential of using ground- penetrating radar (GPR) and electromagnetic induction (EM) techniques for archaeological investigations in Hawaii. Research addressed the growing need for the development of rapid, economical, non-destructive methods to assist archaeologists assess sites.
6. summary of Activities: The ground-penetrating radar unit (@ 450 lbs) was shipped to Honolulu, Hawaii, on 28 February 1990. The unit arrived in Honolulu during the week of 5 March and was picked up by members of the State Historic Preservation staff. I arrived in Honolulu on 11 March 1990. Archaeological field investigations were carried out with the GPR on Oahu (12-14 March), Hawaii (15- 17 March), Kauai (17 - 21 March), and Maui (22-23 March). The radar unit was returned to Philadelphia, Pennsylvania , on 23 March. A paper entitled "Groundpenetrating radar: possible uses in Hawaii" was presented at the 3rd Annual Meeting of the Society for Hawaiian Archaeology, Bishop Museum; Honolulu ('24-25 March). I departed Honolulu on the evening of 26 March and arrived in Philadelphia on 27 March.

•
2
7. summary of Results: Geophysical techniques of ground-penetrating radar and electromagnetic induction provide rapid, cost effective, and nondestructive methods for detecting the presence and pinpointing the location of buried artifacts. These tools are compatible and can be used in Hawaii for reconnaissance and pre-excavation surveys. However, results are highly site specific and interpreter dependent.
Not all environments are equally suitable for the use of these techniques. Ground-penetrating radar provides the best results in coarse-textured, resistive soils. Its use in most moderately-fine or fine textured soils is discouraged. Electromagnetic induction techniques will provide better results in moderately-fine and fine textured, conductive soils.
The predominantly coarse-textured soils that fringe many areas of the Hawaiian Islands are well suited to archaeological investigations using GPR techniques. While these soils are of minor extent, they cover a significant portion of the coastal landscape where desires for development and preservation appear to most often clash. In these areas GPR techniques can be used effectively to assess site conditions, facilitate excavation strategies, decrease field time and costs, and pinpoint the location of buried artifacts.
In other areas of the Islands, EM techniques are more suitable for archaeological investigations. However, with EM techniques assumptions must be made concerning the homogeneity of site conditions and the factors responsible for the relative variations in measurements. In addition, the resolution of EM techniques is less than with GPR techniques.
This field trip has demonstrated the use of two geophysical techniques for archaeological investigations. However, the primary purpose of this field trip was to determine the feasibility of using GPR techniques for archaeological investigations in Hawaii. This objective was accomplished and field work has led to a better understanding of the soils and site conditions best suited to GPR investigations.
Field work was most intense and a wide geographic area was covered. Each participants will have differing opinions as to the utility of using these techniques for archaeological field studies. This is good and is expected. I feel confident, that in time, consultants will begin to offer radar services to developers who are concerned with expediting archaeological field investigations. staff members have been exposed to GPR and EM techniques and are familiar with their field operations. As I have always
•
attempted to demonstrate the "bad" with the "good, 11 I am confident that members of your staff are better equipped to interpret the results of these radar surveys.
My sincere thanks to and a "well done" are extended to Ms. Nancy McMahon who directed field activities and kept us on schedule despite numerous logistic ' problems.
With kind regards. Aloha!
James A. Doolittle Soil Scientist (GPR)
cc: E.G. Knox, Head, NSSL, NSSC, scs, Lincoln, NE M. J. Kaczor, Archaeologist, scs, Washington, D.C. C.G. Olson, Staff Leader, FIS, NSSL, NSSC, scs, Lincoln, NE N. McMahon, Archaeologist, DLNR, Honolulu, HI C. w. Smith, state Soil Scientist, scs, Honolulu, HI
3

•
4
8. Discussion of Results:
Ground-Penetrating Radar (GPR) surveys
The ground- penetrating radar is an impulse radar system designed for shallow subsurface site investigations. Pulses of electromagnetic energy radiate into the ground from a transmitting antenna. Each pulse consists of a spectrum of frequencies distributed around the center frequency of the antenna. Whenever a pulse contacts an interface separating layers of differing electromagnetic properties, a portion of the energy is reflected back to the receiving antenna. The receiving unit amplifies and samples the reflected energy and converts it into a similarly shaped waveform in a lower frequency range. The processed, reflected waveforms are displayed on a graphic recorder or are recorded on magnetic tape for future playback or processing. The graphic recorder uses a variable gray scale to display data. It produces images by recording strong reflections as black and lesser intensity reflections in shades of gray.
The GPR systems used by in this study was the Subsurface Interface Radar (SIR) System-a manufactured by Geophysical Survey Systems, Inc. The SIR System-a consists of the model 4800 control unit, the ADTEK DT- 6000 tape recorder, the ADTEK SR-8004H graphic recorder, and a power distribution unit. A microprocessor, which has programs to enhance signals, remove background noise, and amplify weak signals obscured by background noise, was available but was not used in this study.
Five antennas (ao, 120, 300, 400, and 500 MHz) have been used to investigate earthen materials. Two higher frequency antennas (900 and 1000 MHz) are available but their use has been limited to the investigation of rebar, road pavements, and bridge deckings. The lower frequency antennas (80 and 120 MHz) have longer pulse widths, greater radiation powers, and emit signals that are less rapidly attenuated by earthen materials. The higher frequency antennas (300, 400, and 500 MHz) have shorter pulse widths and greater powers of resolution, but are limited to shallawer depths. For most field work, the 120 MHz antenna has been found to provide the best balance of probing depth and resolution. For archaeological investigations in predominantly coarsetextured materials, the 500 MHz antenna is preferred.
Each of these antennas has a fairly broad radiation pattern. Theoretically, the radiation pattern is conical with the apex of the cone at the center of the antenna. Reflections from an interface are a composite of returns from within the area of radiation.
•
5
Oahu:
Kualoa Regional Park, Waikane {12 March 1990) -The study sites were in ne;rly level areas of Jaucas sand, O to 15 percent slopes (Jae) . The Jaucas series is classified as carbonatic, isohyperthermic Typic Ustipsamments.
The first study site was located along the shore in an area which had been used by an archaeological field school. Several random transects were conducted with the 120 and 500 MHz antennas. Although displaying superior powers of penetration, the resolution of the lower frequency 120 MHz antenna was too coarse to discriminate smaller or more closely space anomalies. The 500 MHz antenna performed well displaying superior powers of resolution and adequate powers of penetration (profile to a desired depth of 190 cm). The velocity of signal propagation through the upper 2 meters of the Jaucas sand profile was estimated to be 0.29 feet/nanoseconds (ns).
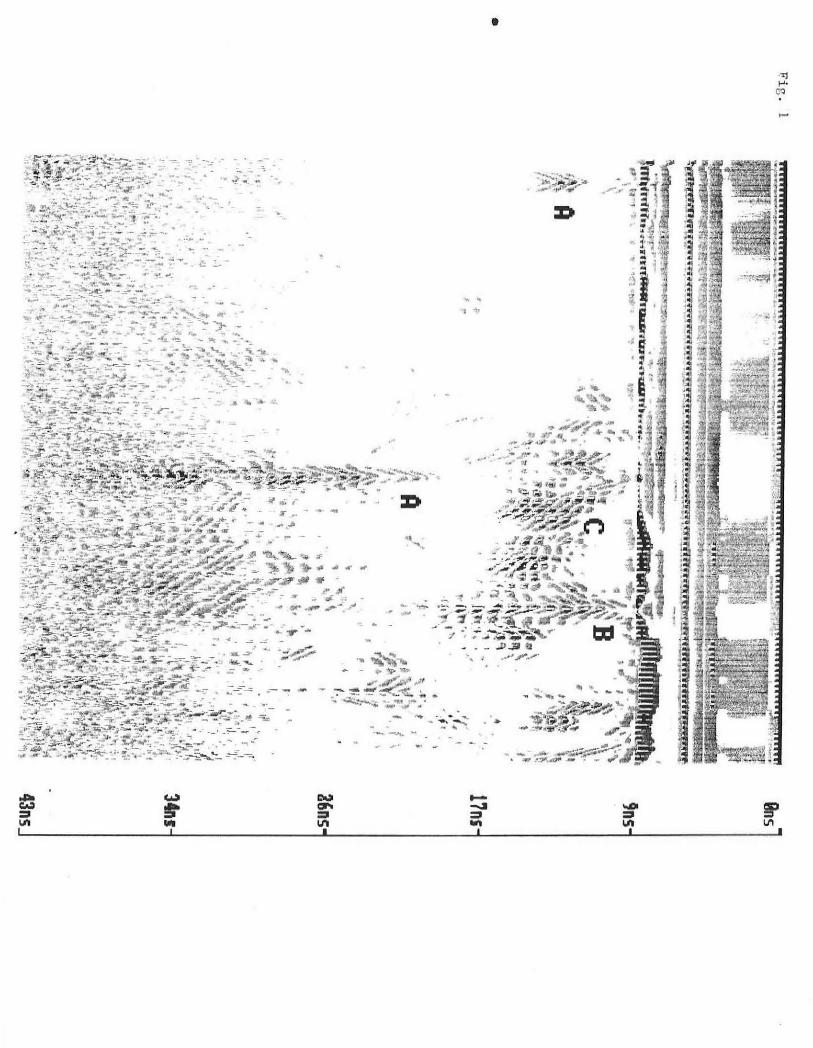
Figure l is a representative profile from this study site. The vertical scale is a time scale based on the round- trip travel time of the electromagnetic energy. To estimate depths, the formula: speed (0.29 feet/ns) * one way travel time (ns/2) is used. The horizontal scale is based upon the speed of antenna advance across the study area. The 500 MHz antenna discerned (i) a buried metallic reflector at 40 cm (see Figure 1, B), (iii) several buried point reflectors believed to be burials, (iii) a buried A horizon of cultural significance, (iv) a suspected buried wall, and (v) the presence of and depth to the underlying coral.
Subsurface anomalies can be divided into two groups: point reflectors and linear reflectors. Soil horizons, geologic strata, and cultural layers having horizontal extents greater than 1 to 5 meters are linear reflectors (see Figure 1, C). Small objects, such as stones, buried artifacts or foundation walls (when crossed perpendicular to their long axis ) , having limited horizontal .extent are point reflectors. Point reflectors produce hyperbolic patterns similar to the images designated by the letter "A" in figures 1 and 2. As the radar's radiation pattern is conical, the radar "sees" point objects before and after the antenna is directly over the feature. The hyperbolic pattern results from range changes as the antenna approaches, passes over, and goes beyond subsurface anomalies.
In Figure 1, several randomly spaced point reflectors (A) occur at depths ranging from about 60 to 90 cm. As these
* Map unit symbol used in published soil survey report are enclosed in brackets following map unit names.

•
6
reflectors were randomly spaced and their occurrence did not suggest a linear trend, these anomalies were believed to be burials. Commonly, for burial, bodies were tied in a "flexed" or fetal position. Though this procedure reduces the lateral extent and the probability of missing a burial site with a single pass of the antenna, it increases the likelihood of detection if the antenna passed directly over a burial site. The concentration of artifacts and bones in these burials increases the probability of detection.
A buried A horizon was identified on the radar profiles and confirmed with a ground-truth observation. This dark colored horizon was buried beneath about 30 to 40 cm of wind blown sands. The horizon was identified as "cultural layer A3". Two additional, lower- lying "cultural layers" or buried A horizons were identified on the radar profiles (not on Figure 1). These strongly contrasting layers produced radar images with multiple, wide, dark bands (greater reflective gradient). Stratification within the sands produced segmented images of lower amplitudes (see c in Figure 1) .
An attempt was made to trace the continuation of a known, buried wall. The location of a previously excavated trench and point reflectors believed to be the wall were identified. However, the study was too cursory to confirm the existence or extent of the buried wall.
The radar response at this site was most exceptional. The 500 MHz antenna profiled to a depth immediately below the sand/coral interface. The higher concentration of soluble salts within the coral were believed to be sufficient to restrict the penetration of radar signals.
During the afternoon of 12 March, multiple transects were conducted with the 500 MHz near an abandoned stone hut within Kualoa Regional Park. The purpose of this radar survey was to locate the site of a known pig burial.
A distinct point reflector was identified in the general area of the known pig burial (see Figure 2, A). Several closely spaced (< 50 cm), parallel grid lines were established across the site of the suspected burial. However, only one transect disclosed the location of the burial. The 500 MHz antenna scans a relatively narrow area (< 30 cm), and the potential for committing "errors of omission" are .a concern to field personnel. This exercise demonstrated the possibility of overlooking a known artifacts even when a closely spaced grid interval is used.
In a nearby area, several transects were conducted perpendicular to the presumed subsurface extension of a buried fish pond wall. On all profiles, a continuous subsurface image of the the water table was observed. This reflector ranged from 80 to 120 cm in depth. In coarse-

•
textured soils, where the capillary fringe is abrupt, a sharply contrasting zone separates dry from wet soil materials and represents a strong radar reflector. This sharply contrasting zone defines the water table which (in coarse-textured soils) was apparent on radar profiles.
7
The buried fish pond wall were expressed as contrasting areas of weakly expressed, highly segmented and irregular imagery (see area enclosed by rectangle in Figure 3). Images from the disturbed wall areas occurred at depths of 35 to 40 cm and caused the abrupt truncation of images from the water table and other soil features. Adjoining the fish pond wall s and sloping downwards to depths of 90 to 120 cm was a rather smooth and continuous interface believed to be the boundary of the fish pond ("A" - highlighted in Figure 3). ·
Waiale'e, Kahuku (13 March) -Multiple radar traverses were conducted along a dirt road in an attempt to chart the location · and extent of buried fish pond walls. The roadway was located in nearly level areas of Jaucas sand, o to 15 percent slopes (Jae) and Beaches (Bs) . The soils beneath the roadway included Jaucas and Waialua (very-fine, kaolinitic, isohyperthermic Typic Haplustolls). Strata of reddish silty clay ranging in depth from 0.1 to >3.0 meters rapidly attenuated and restricted penetration of the radar signal. In areas where the fine-textured subsoil was absence, a profiling depth of greater than 3.0 meters was attained with the 120 MHz antenna.
The roadway was heavily disturbed and was underlain by layers of fill materials. The radar detected multiple layers of recent fill materials, buried trash, drainage pipes, and soil horizons. Although the radar provided a wealth of information concerning the subsurface features beneath the roadway, the high concentration of modern cultural "artifacts" masked the identity and the location of prehistoric artifacts.
Royal Mausoleum. Honolulu (14 March) -The Royal Mausoleum is located in an area of Makiki clay loam, Oto 2 percent slopes (Mk.A). The Makiki series belongs to the fine, mixed, isohypertherm'ic Andie Ustic Humitropepts family. The purpose of this survey was to locate buried structural walls and a purported tunnel believed to extend away from the mausoleum. The radar search identified no obvious structural features.
Multiple transects were conducted around the perimeter of the buried mausoleum with the 120 MHz antenna. The high clay content of the subsoil limited the profiling depth to the upper 50 to 60 cm of the soil profile. The 500 MHz antenna was tested at this site, but its penetration was restricted to depths of less than 10 cm. The radar provide some "near-

•
surface" information to the archaeologist considering the investigation of this site. Although resolution and profiling depth was poor, the radar discerned disturbed areas , buried pipe and utility lines, and subsurface anomalies.
The potential for using GPR techniques in areas of Makiki or other fine-textured soils having a "montmorillonitic" or "mixed" mineralogy is poor because of rapid rates of signal attenuation and the severely limited profiling depths.
Fort Pe Russy Military Reservation, Waikiki Cl4 March) -
8
Fort De Russy is located in a miscellaneous area of Fill land (FL). The fill consist of predominantly coarse-textured materials dredged from the ocean bottom or hauled from nearby areas.
Multiple transects were conducted with the 120 and 500 MHz antennas in an open area within the military compound. The purpose of this survey was to evaluate the radar's potential for detecting and mapping the location of fish ponds and drainage canals which had been buried beneath the layers of fill.
In areas of Fill land, the depth of radar penetration was effected by soluble salts within the dredged materials and limited by underlying layers of marine clays. The transected areas were underlain by marine clays at a depth of about 1.5 meters.
The radar's response in areas of predominantly coarsetextured "Fill land" was good. The radar discerned several disturbed areas, drainage canal walls, a filled former exploratory trench, buried pipe and utility lines, and several subsurface anomalies.
Hawaii:
Laya tunnel detection - Pahoa and Hawaii Volcanoes National Park (15 & 16 ·March) -Ground-penetrating radar techniques were used to confirm the location and map the extent of lava tunnels, measure roof thicknesses, and characterize the internal stratigraphy of basalt in areas of old (Pahoa) lava flows. In areas of recent lava flows (Hawaii Volcanoes National Park), the radar failed to provide sufficient resolution and profiling depths to detect the location of buried heiau walls.
The 120 MHz antenna was used with a scanning time of 300 ns. This scanning time provided a profiling depth of about 18 meters (assuming a dielectric constant of 6.0 for basalt). However , imagery was restricted to depths of 9 and 3 to 4 ·

•
9
meters, in old and recent lava, respectively. Heat and differing mineralogical composition were believed to be the principal factors causing the reduced depth of penetration in the recent lava flows (from Kilauea crater).
Figure 4 is a representative profile from the Pahoa site. The location of a lava tunnel has been enclosed by a box (see Figure 4). In areas underlain by tunnels, a depression or draw down of the overlying strata was often apparent on radar profiles. This feature can be used as an accessory characteristic useful in identifying the location of lava tunnels on radar profiles. Also evident in Figure 4 are multiple lava layers, fractures , and anomalies within the lava.
The presence of lava tunnels is often difficult to detect on radar profiles. Cavities and tunnels are most easily identified when they are relatively large, have smooth and highly contrasting boundaries, and occur in mediums which are relatively homogeneous. It is easier to define a tunnel in a massive, homogeneous rock than in highly bedded, contorted, or deformed materials. In Figure 4, multiple, irregular reflections from successive flows and the irregular boundaries of the cavity mask the location of the tunnel. In addition, a tunnel must be large to create a favorable size to depth ratio. Small cavities are more difficult to detect with increasing depth.
South Point Cl6 March) -Remnants of the oldest known Hawaiian settlement (750 AD) were found on this wind swept point of land. A habitation site, dating from 1000 AD, had earlier been excavated by Bishop Museum . The selected study sites consisted of aeolian sands overlying volcanic ash. The depth to ash and the thickness of sands varied across the dunes. Although, both antennas provided adequate profiling depths (scanning times were so or 70 ns), emissions were rapidly attenuated in the underlying ash.
Figure 5 is a representative profile from South Point. The boundary separating the sands from the volcanic ash is well expressed across much of the profile (dips out of range in the central portion of this figure). Features identified in this figure include a point object (A), buried cultural layers and strata (B} within the sands, and an abrupt stratigraphic break (C) which may have been caused by man's activities. The identity of the point reflector (A) was not explored. This object could represent a burial, stones, or other similar point reflectors.
In an adjoining area attempts were made to locate a stone platform buried within the ash. Images of the platform were poorly expressed and difficult to recognized on the radar

•
10
profiles. Without prior knowledge of the platforms location , this feature would not have been identified.
Rauai:
Pacific Missile Testing Range Facility, Barking Sands (19 March) -Sites were located in an areas of Jaucas loamy fine sands, o to 8 percent slopes (JfB). Two sites were investigated with the 120 and 500 MHz antennas.
At the first site, located near several buildings, known burial sites and utility line corridors were flagged and passes were made with each antenna. The 500 MHz provided exceptional resolution of subsurface features and anomalies to depths of over 3 meters (maximum range probed). Features identified on the radar profiles included a filled exploratory trench, several unidentified point reflectors (probable burials), and utility lines buried beneath the sands and a paved roadway.
The second site was along the summit of a short, steep beach escarpment. The response of the GPR was similar to the first site. Several point reflectors were observed on the radar profiles. One of these anomalies, was buried at a very shallow (< lOcm ) depth. This anomaly was excavated and found to be a small area of burned ash from a camp fire.
Waiopili Heiau. Kaloa (19 March) -The walls of a heiau appeared to extend beneath an area now used as a gravel quarry. This heiau was located in areas of Jaucas loamy fine sand , Oto 8 percent slopes (JfB), and Mamala stony silty clay loam, o to 12 percent slopes (MnC). Mamala is a member of ·the clayey, kaolinitic, isohyperthermic Lithic Haplustolls family.
Seven transect lines were established across the area believed to overlie the buried wall. Soils consisted of calcareous loamy sands overlying a strata of undetermined composition.
Several point and linear reflectors were observed on the radar profiles. On six of the s even transects, a series of point reflectors were aligned in a straight line. This pattern suggested the occurrence of a wall to the heiau. This study demonstrated the potential for using GPR techniques to monitor disturbed areas for evidence of former structures.

•
11
Russian Fort Elizabeth. Waimea (20 Ma.rchl -The construction of Fort Elizabeth was completed in 1817. In 1864, the fort was abandoned.
A GPR survey was conducted within the interior of the fort to locate artifacts and major stratigraphic changes representing occupation surfaces.
Fort Elizabeth is located in an area of Makaweli stony clay loam, Oto 6 percent slopes (MhB). Makaweli soils belong to the clayey, kaolinitic, isohyperthermic Typic Torrox family. The high clay content of this soil attenuated the radar signals and limited the profiling depth. However, the clays of this Oxisol were more highly weathered (kaolinitic mineralogy class) than at other sites visited and the profiling depth of the GPR was better than anticipated. The 120 MHZ antenna was used with a scanning time of 60ns.
A grid was established within the interior of the fort for the purpose of conducting an electromagnetic (EM) survey. The grid interval was 5 meters. A GPR survey was conducted by hand towing the 120 MHz along portions of transect lines X45 and X50 (see EM contour plots).
Figure 6 is a representative profile from transect line X45. The vertical scale is a time scale based on the round-trip travel time of the electromagnetic energy. Assuming a velocity of propagation of 0.33 feet/ns for moist clayey soil, the depth of consistent profiling ranged from 1.2 to 3 meters.
As no ground-truth information was gathered at this site, few images can be depth scaled or identified with a high degree of confidence. In Figure 6, a distinct soil horizon or geologic strata (A) occurs at a depth of about 1 to 3 meter. This feature is best expressed in the central portion of this profile (near 24 ns) where it consist of two dark black bands. Above this interface, the imagery is exceedingly complex and interpretations are difficult. The upper part of this profile is cluttered with numerous point and segmented linear reflector. Though highly disturbed, cluttered, and difficult to interpret , the radar profile can be subdivided into areas of similar graphic imagery or signatures. In Figure 6, the imagery appears less cluttered near "B" than about "C." If this imagery represents cultural noise, area "C" appears to have the higher concentration of artifacts.
In Figure 6, three distinct zones have been enclosed in rectangular boxes. Note that each zone has a unique graphi c signature which differs from adjoining areas. In addition, each zone appears to be terminated by abrupt vertical breaks in the imagery. Also, distinct point reflector (possibly foundation walls) are to the right of two of these boxes.

•
These areas are suspected of representing unique areas of occupation history, and possibly the location of former structures.
Keoneloa Bay villas, Koloa CMarch 20)-
12
An area of Dune land (Dl) was transects with the GPR as part of a brief reconnaissance survey conducted during the evening of 20 March. The area consisted of a series of hills and ridges formed shifting sands.
The 500 MHz antenna was used along several transects which crossed a large dune. The GPR survey identified the location of (i) buried A horizons, (ii) numerous unidentified subsurface anomalies (possible tree roots, rocks, artifacts, burials), and (iii) presence and depths to indurated (lithified) sands. The graphic records of this site will be used by the archaeologists investigating this site.
Maui:
Waihe'e. Wailuku CMarch 22 ) -The GPR was demonstrated by conducting multiple transects across a 6 by 6 meter grid. The grid was located in an area of Jaucas sand, o to 15 percent slopes (JaC). Using the 500 MHz antenna, several point reflectors and a small , irregularly shaped area containing multiple layers were located within the grid. The extent of a cultural layer (buried A horizon) was determined with the GPR. The radar survey disclosed that the cultural layer was confined to an area immediately adjacent to the shore.
The transect line was extend inland several hundred meters in order to chart the depth to and lateral extent of an underlying finer-textured layer. The transect line extended into an area of Pulehu silt loam, o to 3 percent slopes (PpA). The Pulehu soil series belongs to the fine-loamy, mixed isohyperthermic Cumulic Haplustolls family. The radar provided good imagery of the soil profile above the finertextured (silty clay -loam) strata. However, this strata restricted radar profiling. The GPR provide a continuous record of the depth to the finer-textured layer.
Haleki I 1 - Pihana Heiaus state Park <March 2_3) -The heiaus were located on the summit of a low ridge in an area of Puuone sand, 7 to 30 percent slopes (PZUE). Puuone is a member of the carbonatic, isohypertherrnic Typic Ustipsamments family. The Puuone soil is underlain by a cemented layer of calcareous sand at depths ranging from o.s to 1.0 meters
Six traverses were made with the 500 MHz antenna across a portion of the Pihana Heiau. The purpose of this

•
1 3
investigation was to determine whether the GPR could detect a thin pebble layer (ili ili ) which occurred near the soil surface. No ground-truth observations were made at this site to determine the velocity of signal propagation or the depth of penetration.
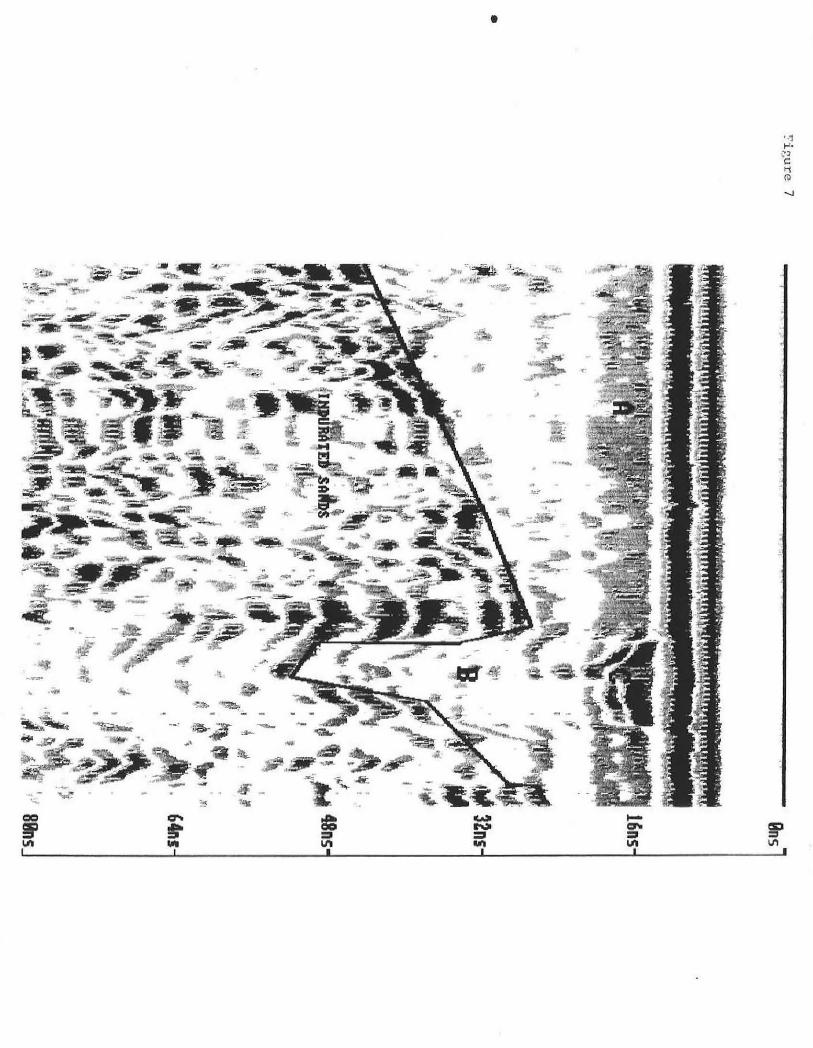
Figure 7 is a representative profile. The ili ili layer (segmented, dark images about "A" ) appears weakly expressed and discontinuous in the upper part of this profile. The contact of noncemented sands with indurated sands has been defined with a dark line. This contact slopes upward from left to right in this figure. The contact appears to have been excavated by a trench or hole at "B". In Figure 7, layers of contrasting fill or disturbed materials are evident at "C". These materials overlie but do not extend into the excavated trench. The archaeologist investigating this site, Michael Kolb (UCLA) , had no record of an excavation occurring at site "C" nor knowledge of the underlying cut into the indurated sands.
The GPR performed exceptionally well at this site and can be of invaluable assistance to future archaeological investigations at this site.
Cemetery (March 23 ) -It was repeatedly stated that burials should appear as hyperbolic patterns on radar profiles. As very little or no ground-truthing was performed at the sites visited during this field trip, it was difficult to verify interpretation. A known grave site was traversed with the 500 MHz antenna in order to confirm the representation of burials by hyperbolic patterns. In Figure a, a historic grave site was traversed with the 500 MHz antenna. The image of the burial is evident immediately below point "A". The images assumes a hyperbolic pattern and confirms earlier interpretations.

•
14
ELECTROMAGNETIC (EM) SURVEYS
Electromagnetic (EM) methods measure the electrical conductivity between the receiver and transmitter coils. For surveying, the EM-38 meter is placed on the ground surface. An oscillating dipolar magnetic field is produced by the transmitter coil. This primary magnetic field induces an electrical current in the ground which generates a secondary magnetic field in a manner that the amplitude of the induced current is proportional to the electrical conductivity of the scanned earthen materials. The magnitude of this current is measured at the receiver coil and is a function of the apparent electrical conductivity of the soil.
Electromagnetic methods measure the apparent electrical conductivity of earthen materials. Factors influencing the conductivity of earthen materials include (i) the volumetric water content, (ii) amount and type of salts in solution, (iii) the amount and type of clays in the soil matrix, and (iv) the soil temperature. Measurements are expressed in millisiemens/meter (mS/m) .
Field Methods Geonic Limited EM-38 electromagnetic induction soil conductivity meter was used in this study. With the EM-38 meter placed on the surface and orientated in a vertical dipole position, measurements of apparent electrical conductivity were made to depths of about 1.5 meters. The EM-38 electromagnetic ground conductivity meter was developed specifically for measuring soil conductivity within the root zone (McNeill, 19B6a). The operation of the EM-38 meter is described in detail by McNeil! (1986b).
As discussed by Benson and others (1984), the absolute values are not necessarily diagnostic in themselves, but lateral and vertical variations in conductivity are significant. Interpretations of the EM data are based on the identification of spatial patterns in the data set. The SURFER computer graphics software program was used to construct two-dimensional contour plots of the EM data. Contouring has been extensively used to locate and determine the areal extent of subsurface anomalies. It was anticipated that changes in electromagnetic conductivity could be related to differences in soil properties resulting from the activities of man.
Russian Fort Elizabeth (March 20) -Fort Elizabeth was constructed during the period of 1816 to 1817. In 1864, the fort was abandoned. Figure 9 is a copy of a detailed map of the fort prepared by the Bishop Museum. The grid interval is 5 meters and is identical to the one used for the EM survey.

•
15
An EM survey was conducted within the interior of the fort. The purpose of this study was to locate major stratigraphic changes which represent variations in soil type, ground modifications or occupation surfaces. A grid was established within the interior of the fort for the purpose of conducting an electromagnetic (EM) survey. The grid interval was 5 meters. Measurements were taken at each grid intersect.
Fort Elizabeth is located in an area of Makaweli stony clay loam, o to 6 percent slopes. Makaweli soils belong to the clayey, kaolinitic, isohyperthermic Typic Torrox family. Moist soil conditions and the moderately high clay content of the Makaweli soil are believed to be responsible for this site's moderately high electrical conductivity values. The apparent electrical conductivity averaged 228 mS/m with a range of 30 to 470 mS/m. Lower readings (< 200 mS/m) were obtained over rubble from structural and fortification walls. The rubble consists of basalt rock fragments which are more resistive than the surrounding clayey soil materials. Rubble and areas of occupation history produce EM measurements with lower conductivity values.
Figure 10 and 11 are contour maps of apparent ground conductivities measured with the EM38 in the vertical profiling mode. The contour interval is 40mS/m. These figures are identical except that the grid lines have been superimposed on the diagram in Figure 10 .
The outline of features within the fort's interior have been closely approximated by the SURFER software program. However, as a result of the relatively coarse grid interval used, the form and exactness of these features do not completely correspond with those shown in Figure 9. Areas o f lower conductivities correspond with the barracks, magazine, guard room, flagstaff, quarters, and rubble along the fort's ipterior perimeter. However, additional areas of low conductivities occur at the intersection of lines X20 and Y55, X45 and Y75, and xso and Y50 . These electromagnetic anomalies do not correspond with any known feature expressed on the Bishop Museum's map (Figure 9). Patterns of lower conductivities are more evident in Figure 12. In this figure, only conductivity values less than 200 mS/m have been plotted and the contour interval is 10 rnS/m.
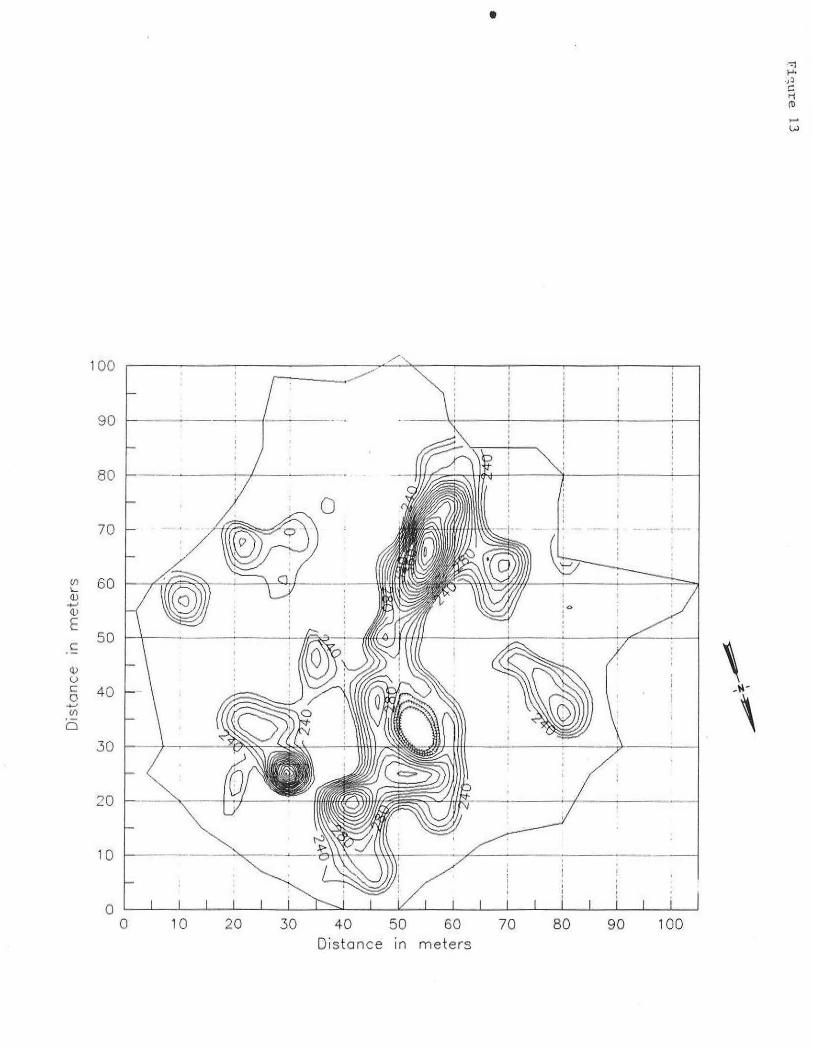
The spatial variability of areas having higher conductivities can provide insight into major stratification breaks which occur within the fort. In Figure 13, only conductivity values greater than 240 mS/m have been plotted. The contour interval is 10 mS/m. Zones of higher conductivity may correspond to areas of clay enrichment, fewer basalt rock fragments, deeper depths to bedrock (if the bedrock is within 1.5 meters of the soil surface), or buried metallic objects.

•
16
A major trough of higher conductivity values extends across the interior of the fort. The spatial pattern of this trough suggests the location of a former swale or drainageway which recieved clay enrichment from adjoining areas and contains fewer rock fragments. Two additional areas of higher conductivity are evident in Figure 13. One area (XSO Y35) adjoins the entrance, the other area (X30 Y25) adjoins the magazine. Although the area adjoining the magazine is connected with the trough and may be a former low in the landscape, the exceptional high conductivities at this site could indicate the presence of buried metallic objects.
Nawiliwili (March 21) -An electrical conductivity survey, using electromagnetic induction (EM) methods, was carried at Nawiliwili. The site was formerly a cemetery. Many graves have been re-interred. However, it was believed that some burials remained. A local resident with knowledge of the former cemetery, selected the area to surveyed with the EM3B conductivity meter. The area was restricted to a five meter square area. The grid interval was one meter. The apparent electrical conductivity was measured at each grid intersect.
The soils on Nawiliwili site are very conductive. The site is located in an area of Lihue silty clay, o to 8 percent slopes (LhB). Lihue series belongs to the clayey, kaolinitic, isohyperthermic Tropeptic Eutrustox family. Moist soil conditions and the high clay content of this soil are believed to be responsible for this site's relatively high electrical conductivity values. The apparent electrical conductivity averaged 334 mS/m with a range of 160 to 560 mS/m. At grave sites, artifacts will displace the soil clays. Artifacts are presumed to be more resistive than the surrounding soil materials and will produce EM measurements with lower conductivity values.
Figure 14 is a two-dimensional contour plot of apparent conductivity values within the study area. The contour interval is 20 mS/m. A distinct area of low conductivity values occurs in the upper left-hand corner of this figure. This area of low conductivities corresponds with an area of rocky (more resistive) soils. It is presumed that the more resistive rocks have displaced the conductive soil materials producing lower EM values.
In the upper right-hand corner of Figure 14, two unique, parallel linear features are evident. A trough of low conductivities (x = 4, y = 2.5 to 4.25) occurs adjacent to a ridge of high conductivities (x =3, y = 2.5 to 4.25). Though conjectural, could the first feature be a burial site and the latter where the exhumed clays from the grave were temporally piled.

•
17
The above-mentioned trough and ridge of soil conductivity values appear in Figure 15. Figure 15A plots conductivity values with a contour interval of 40 mS/m. In Figure 15B, a relative plot of EM values has been plotted. All measurements are relative to the averaged apparent electrical conductivity value of 334 mS/m. Again the features discussed earlier reappear.
The prepared two-dimensional contour plots provided information supporting the location of a rock pile (upperright corners) and a potential grave site (upper-left corners). While tantalizing, these observations must be supported and verified by ground-truth exploratory excavations. The utility of using EM methods for archaeological investigations has been demonstrated.

•
References
Benson, R. c., R. A. Glaccum, and M. R. Noel. 1984. Geophysical techniques for sensing buried wastes and waste migration: an application review. IN: D. M. Nielsen and M. curl (eds.) Surface and Borehole Geophysical Methods in Ground Water Investigations. NWWA/EPA Conference, San Antonio, Texas, p. 533-566.
18
McNeill, J. D. 1986a. Rapid, accurate mapping of soil salinity using electromagnetic ground conductivity meters. Geonics Ltd., Mississauga, Ontario. Tech. Note TN-18. pp. 15.
McNeill, J. o. l986b. GEONICS EM38 ground conductivity meter operating instruction and survey interpretation techniques. Geonics Ltd., Mississauga, Ontario. Tech. Note TN-21. pp. 15.

•
•
-- .::, .. _ -.
. ... - ... . ... ~ .. '

• ..
:.j: .. . ~.
. Jt-,. ....
..
f ..
•
-,~, . , '
.s. .•
~; .• ";i ~$/f . ...... .
. • .
' "I ~
j ·.i'i'
·. ' ....

•
1,:)
... . ..

•
r. ....
:~ ~
-. ""' .. ~~
. &:.,,
.q, it ~ ,
/J - ~' ). t'
# ....__ .. ..
-~ ., ;i
,j '

•
.:
,.
f ... r I
r .j ..... ~Q c ·~ (\)
V1

--·· ~ .. ,,_ ..... ~ ..... ...,._ .... -' ~ --~ ~-
iif a ;:r;---· :t,, ~1... ~!
~
.;.-... ....... ,. -!.._____ -~! ~
-!!:-::._ -_,. ... ,.,.,. ~-'· ~...----...-........ ................. _.
·~E-.: _--:-'"~
~ , l .. "'~~~
... ~··~
-
....
- ·~·
. ..
...
~ (j•
r' ii~ ,.
...,
., ,.,;r---i~ ~ ~ z ... ~ ~~ ~ ..... .,,,. ~ ~U;. ~ ~;>· t.w:-... -....,. ~ .. ..... .. --
•
-, c
...
•
" ......
..,. -.

HAW-12 Created Apr 25,1990 512 samples / scan
11:22 2 5.6 scans / sec
JAPANESSE GRAVE
·-~-
.. ,!!Jtf .. ~ -~
•
Modified Apr 25,1990 position: O nS range:
11:25 80 ns
'f'.M ,_.
~~,,;",,..f"
... .

...... , ....
U.t• A,l\r .. nun11 -•·4 ..
~l.P..Y:>I·~ UIS HUt't'ZIH 1¥0'
o'· i;";' I .o
0 r 0
•
-··
. c
• ' ',O
8
' • • : .,._...;- ._W'f 'fMI
' : ' f ,. 11"'11 ' o
.. ; !
'
' ' I
' '

(/) L. ()..)
........ (!.>
E c
Q) ()
c 0 ......, (fJ
i:5
•
FORT ELIZAB ETH, WAIMEA, 1-<AUAI
100
90 f-----~-~
80
70
60
50
40
30
10
\) '
j~ ' '
0 .___.__,___..~_.___,__.____.___....__~-"'-__J~-'-_,_-'-~'---'---'---'----''--....._~
0 10 20 30 40 50 60 70 80 90 100 Distance in meters
\ \

•
FORT ELIZABETH , WAIMEA, KAUAI
90
80
70 uO (/) 60 )\9 L. Q) ...... (])
~ 50 \ c
(]) (.) -~ -c 40 \ 0 ....., (/)
i:5
30 C~)
c;::;>
20 ,---.. ,~
10
0 .__.___~--1---L----1.-1..........:;:,,,--'---"--
o 10 20 30 40 50 - ) 80 90 100 Distance in rr -:-:-:· :;

•
100
90
80 ---
@ @ ' I
70 ' . t·
_ I
(/) I... 60 Q) ijl ..... Cl> E
50 c
-\i} \ I
' v ' ()
I I
c: 40 I I - ~ -·---··----4--- L .. --~
0 I I
\ : I I ..... I C/) I I
~ I
i:5 I I ' I I I I
30 I
20
10
0 0 10 20 30 40 50 60 70 80 90 100
Distance in meters
100
90
80
70
(/) 60 L <l.) ....., Cl> E .5
50
q,, 0 c 40 0 ..._, (/)
0
30
20
10
0 0
•
r-------,/"'··
~----1------- .
10 20 30 40 50 60 Distance in meters
' c> I
' :
70 80 90 100
\ -,
-":'] ..... . ,~ c H co -w

4
(/) L J Q)
-+-' Q)
E c
Q)
~ 2 0
-+-' (/)
0
•
EM38 SURVEY AT NAWILIWILI, l<AUAI
0 L-_l_~~~~_L_~~~~~----l...J-..l---'--L--1.-'-~-=----l...~-L-->-..>.--U-J->-...1.-L-'-.L.....L..-'-':..-L-J
5 0 2 3 4
Disto nee 1 n n1eters
,, ....

(/) 0:: w f-
5.0
4.0
w 3.0 >
z
t5 2.0 z <{ 1-(/)
0 1.0
Vl CL w f-
0.0 0.0
5 .0
4.0
w 3.0 2
z
ts 2.0
z ~ (/)
0 1.0
0.0 0.0
A
1.0 2.0 3.0 4.0
DISTANCE IN METERS
B
1.0 2.0 . 3.0 4.0
DISTANC E IN METERS
•
5.0
5.0
"'I!\ ...... tO c '""i ro -(J"I