Ó 1998 Menascé & Almeida. All Rights Reserved.1 Capacity Planning for Web Performance Dr. Daniel...
80
998 Menascé & Almeida. All Rights Reserved. 1 Capacity Planning for Web Performance Dr. Daniel Menascé George Mason University, VA Dr. Virgílio Almeida Federal University of Minas Gerais, Brazil
-
Upload
aubrey-wood -
Category
Documents
-
view
222 -
download
0
Transcript of Ó 1998 Menascé & Almeida. All Rights Reserved.1 Capacity Planning for Web Performance Dr. Daniel...

998 Menascé & Almeida. All Rights Reserved. 1
Capacity Planning for Web Performance
Dr. Daniel MenascéGeorge Mason University, VA
Dr. Virgílio AlmeidaFederal University of Minas Gerais, Brazil

998 Menascé & Almeida. All Rights Reserved. 2
Capacity Planning for Web Performance: metrics, models and
methods Prentice Hall, June 1998
Dr. Daniel Menascé ([email protected])
George Mason University
Dr. Virgilio Almeida ([email protected])
Universidade Federal de Minas Gerais
998 Menascé & Almeida. All Rights Reserved. 3
Approach
• Provide an engineering framework to performance and quantitative analysis of Web services behavior.
• How?How?

998 Menascé & Almeida. All Rights Reserved. 4
A Simple Approach to Web Performance
K
i
i
K
WWWi 1 P

998 Menascé & Almeida. All Rights Reserved. 5
A Simple Approach to Web Performance
K
i
i
K
WWWi 1 P

998 Menascé & Almeida. All Rights Reserved. 6
A Really Simple Approach
U
SR
1

998 Menascé & Almeida. All Rights Reserved. 7
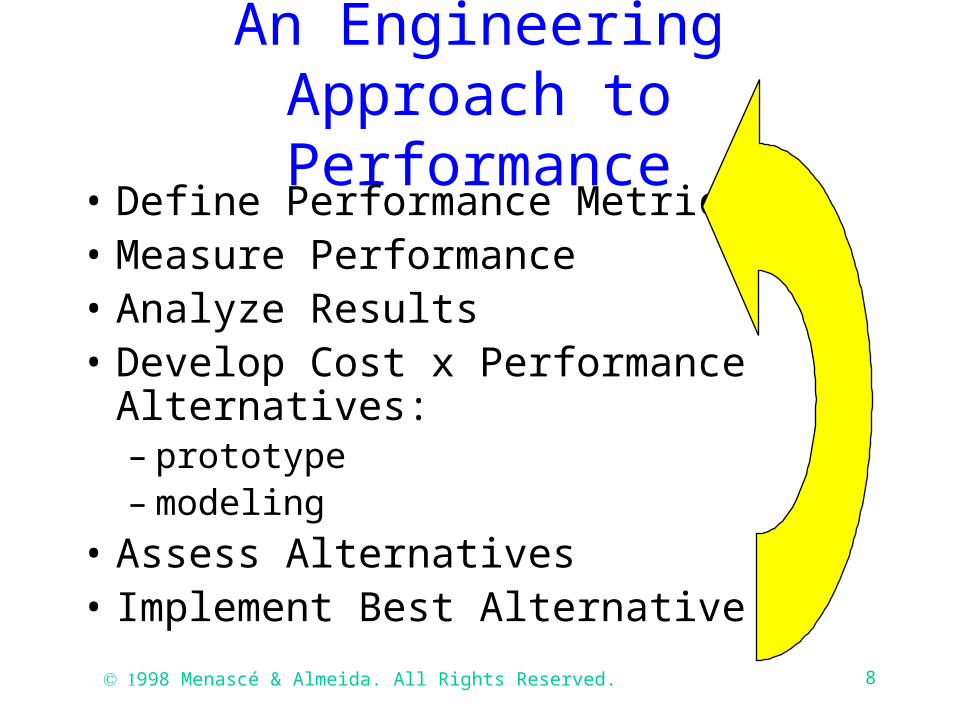
An Engineering Approach to Performance
• Define Performance Metrics• Measure Performance• Analyze Results• Develop Cost x Performance
Alternatives:– prototype– modeling
• Assess Alternatives• Implement Best Alternative
998 Menascé & Almeida. All Rights Reserved. 8
An Engineering Approach to Performance
• Define Performance Metrics• Measure Performance• Analyze Results• Develop Cost x Performance
Alternatives:– prototype– modeling
• Assess Alternatives• Implement Best Alternative

998 Menascé & Almeida. All Rights Reserved. 9
Why is performance a critical issue?
• Competitive performance is a key component in e-commerce and Internet-based mission critical applications.
• Web performance experienced by users varies enormously, depending on many factors: geographical location, time of the day, breaking news, etc.
998 Menascé & Almeida. All Rights Reserved. 10
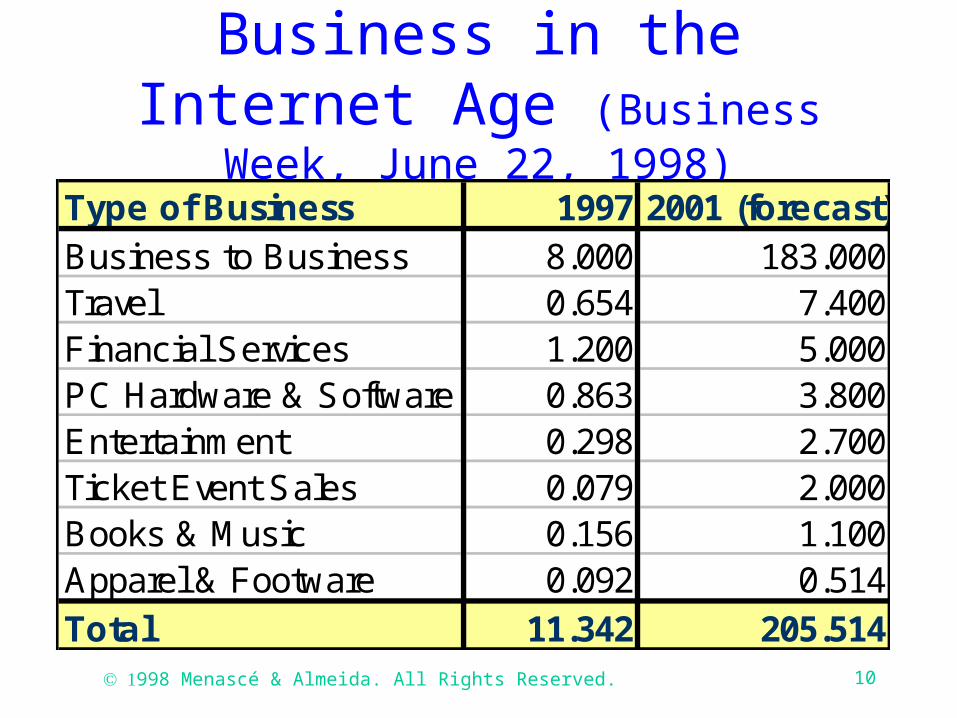
Business in the Internet Age (Business Week, June 22, 1998)
Type of Business 1997 2001 (forecast)Business to Business 8.000 183.000Travel 0.654 7.400Financial Services 1.200 5.000PC Hardware & Software 0.863 3.800Entertainment 0.298 2.700Ticket Event Sales 0.079 2.000Books & Music 0.156 1.100Apparel & Footware 0.092 0.514Total 11.342 205.514
998 Menascé & Almeida. All Rights Reserved. 11
Caution Signs Along the Road
(Gross & Sager, Business Week, June 22, 1998, p. 166.)
There will be jolts and delays along the way for electronic commerce: congestion is the most obvious challenge.

998 Menascé & Almeida. All Rights Reserved. 12
What are people saying about Web performance…
• “Tripod’s Web site is our business. If it’s not fast and reliable, there goes our business.”,
Don Zereski, Tripod’s vice-president of Technology (Internet World)
• “Computer shuts down Amazon.com book sales. The site went down at about 10 a.m. and stayed out of service until 10 p.m.”
The Seattle Times, 01/08/98
Menascé & Almeida. All Rights Reserved.
998 Menascé & Almeida. All Rights Reserved. 13
What are people saying about Web performance…
• “Sites have been concentrating on the right content. Now, more of them -- specially e-commerce sites -- realize that performance is crucial in attracting and retaining online customers.”
Gene Shklar, Keynote, The New York Times, 8/8/98
998 Menascé & Almeida. All Rights Reserved. 14
What are people saying about Web performance…
• “Capacity is King.”Mike Krupit, Vice President of Technology, CDnow,
06/01/98
• “Being able to manage hit storms on commerce sites requires more than just buying more plumbing.”
Harry Fenik, vice president of technology,
Zona Research, LANTimes, 6/22/98
998 Menascé & Almeida. All Rights Reserved. 15
What are people saying about Internet performance…
• “The capacity crunch is real and will continue for quite some time.”
Mike O’Dell, Chief Scientist, UUNET
998 Menascé & Almeida. All Rights Reserved. 16
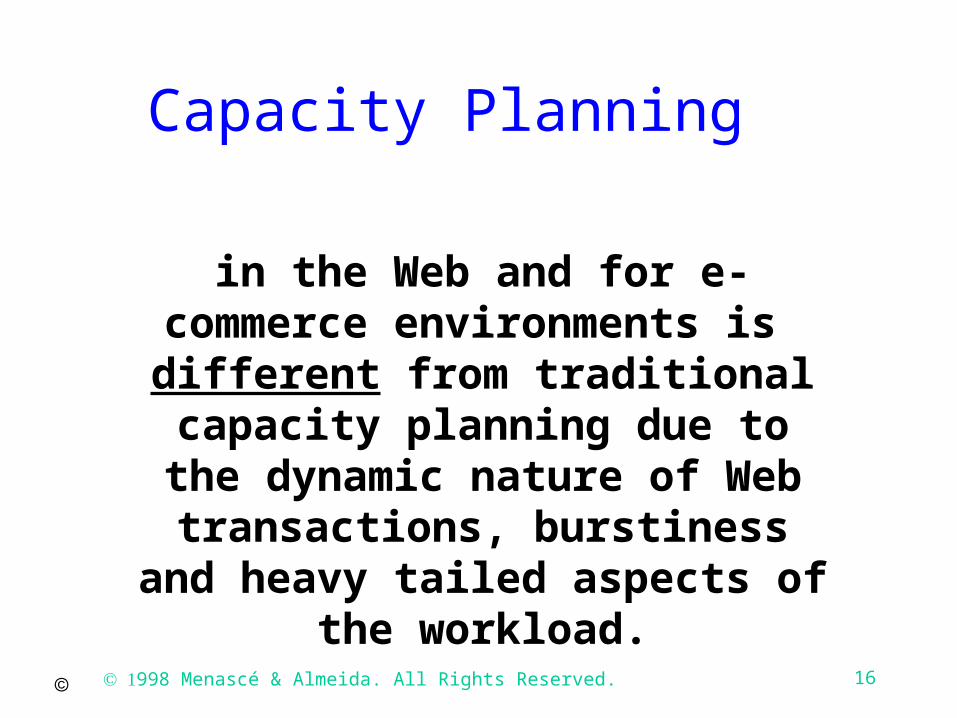
Capacity Planning
in the Web and for e-commerce environments is different from traditional
capacity planning due to the dynamic nature of Web
transactions, burstiness and heavy tailed aspects of the
workload.
998 Menascé & Almeida. All Rights Reserved. 17
Outline
• Part I: Motivating Example
• Part II: Web and Intranet Performance
• Part III: Capacity Planning Methodology
• Bibliography
998 Menascé & Almeida. All Rights Reserved. 18
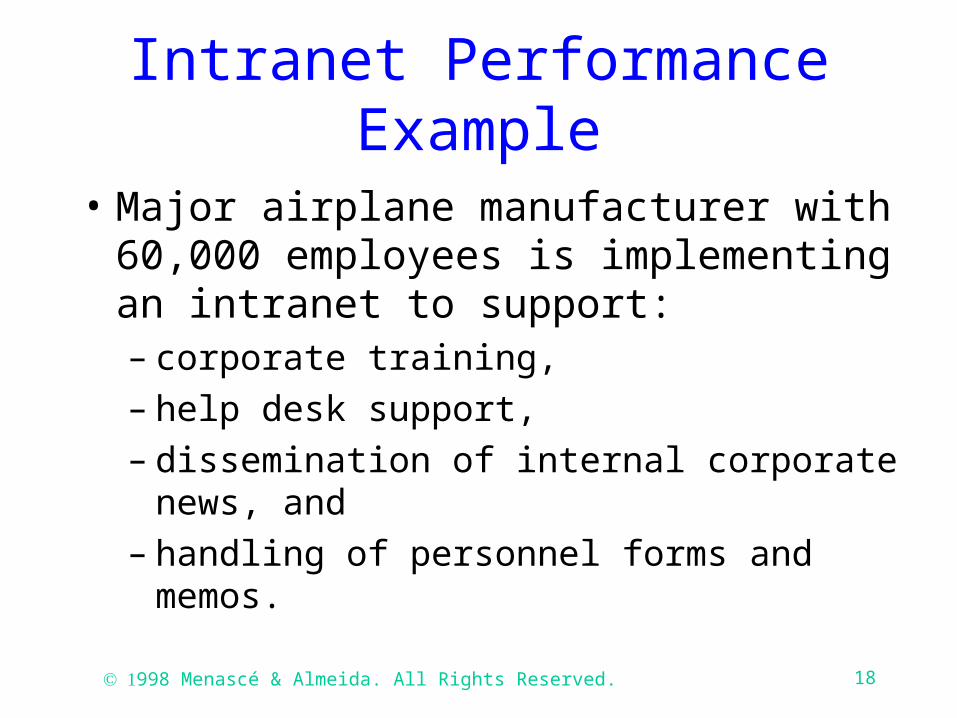
Intranet Performance Example
• Major airplane manufacturer with 60,000 employees is implementing an intranet to support:– corporate training,– help desk support,– dissemination of internal corporate news,
and– handling of personnel forms and memos.

998 Menascé & Almeida. All Rights Reserved. 19
Intranet Performance Example
• Help desk application:– dedicated Web server with a FAQs DB
about common hardware/software problems and solutions,
– submission of problem descriptions via forms,
– requests for status on previous claims.

998 Menascé & Almeida. All Rights Reserved. 20
Intranet Performance Example
• 10% of employees submit requests to the help desk application every day
• 70% of these requests fall in the 10:00AM 12:00PM period and from 2:00PM to 4:00PM.
• arrival rate =
(60,000 * 0.1 * 0.7) / (4 * 3,600) = 0.29 request/sec.

998 Menascé & Almeida. All Rights Reserved. 21
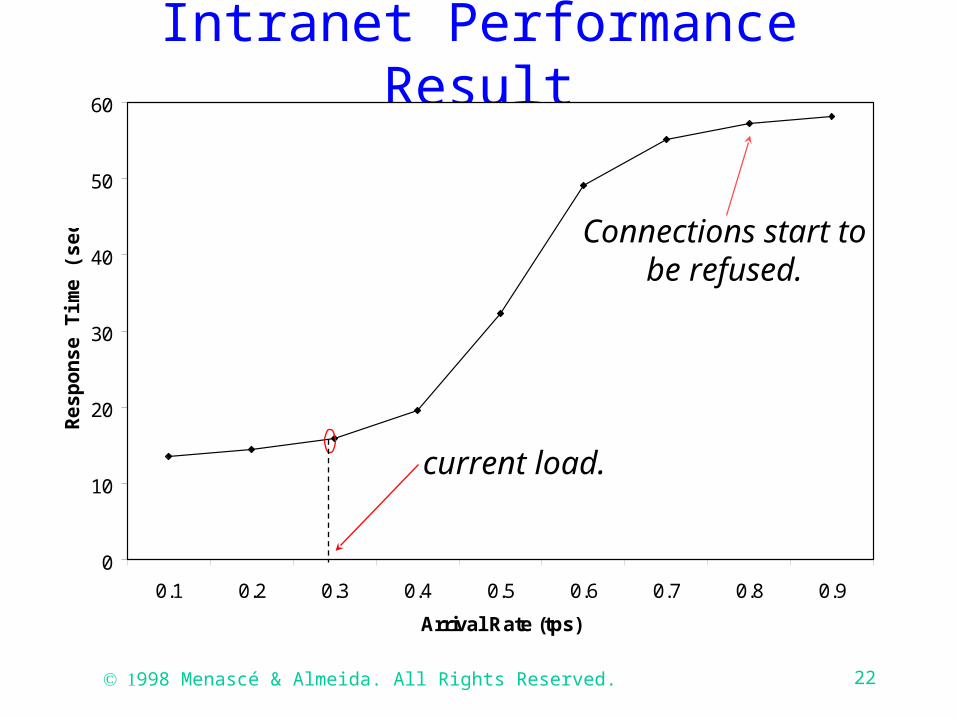
Intranet Performance Example
• The OS on all clients will be changed:– likely to create big surge in number of
requests to the help desk application.
• Management question:– how will the help desk application response
time vary with the arrival rate?
998 Menascé & Almeida. All Rights Reserved. 22
Intranet Performance Result
0
10
20
30
40
50
60
0.1 0.2 0.3 0.4 0.5 0.6 0.7 0.8 0.9
Arrival Rate (tps)
Res
po
nse
Tim
e (s
ec) Connections start to
be refused.
current load.
998 Menascé & Almeida. All Rights Reserved. 23
Part II
Web and Intranet Performance Issues

998 Menascé & Almeida. All Rights Reserved. 24
Web Server Performance Problems
Unpredictable nature of information retrieval and service request over the
World-Wide web
• load spikes: 4 to 10 greater than avg.
• high variability of document sizes: from 103 to 107 bytes

998 Menascé & Almeida. All Rights Reserved. 25
Unpredictable nature of service request over the Web
• “ Online investors shout while being shut out”
(TechWeb, 11/03/97) reporting long waiting times
during the market crash in October 27, 1997.
• “Hurricane-watchers clog wheather web sites”, ( NY
Times, 08/26/98), “…we are getting right now, per
day, what we typically get in a seven-day period”
• “24.7 million people read the Starr Report online by
late Saturday” (RelevantKnowledge, 09/15/98)
998 Menascé & Almeida. All Rights Reserved.
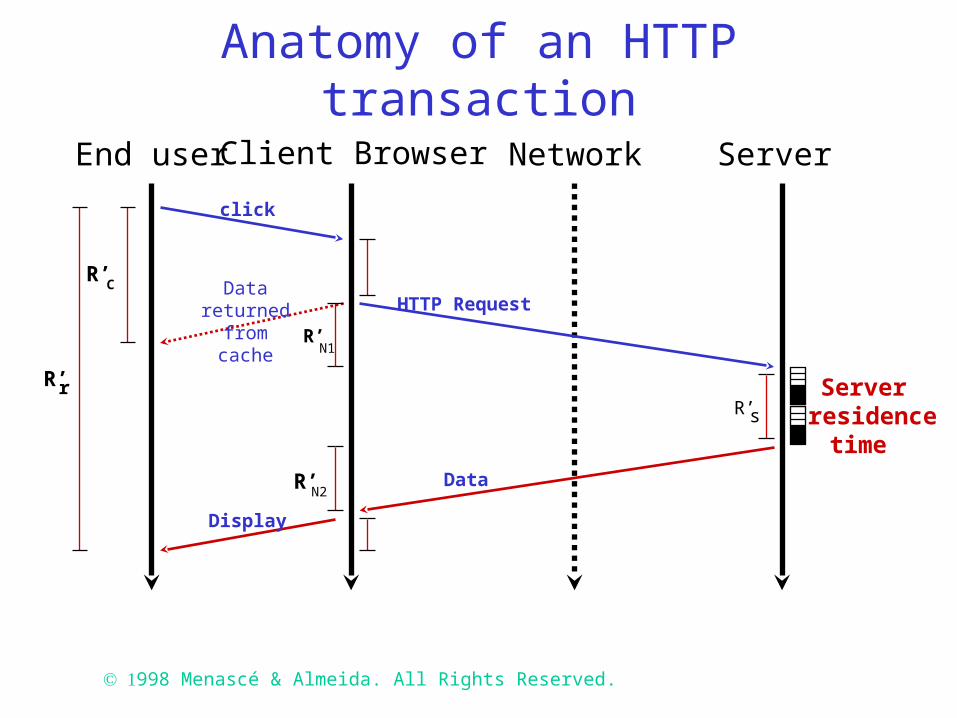
Anatomy of an HTTP transaction
End user Client Browser Network Server
click
Data returnedfrom cache
Display
HTTP Request
Data
R’s
CR’
R’r
R’N1
R’N2
Server residence
time
998 Menascé & Almeida. All Rights Reserved. 29
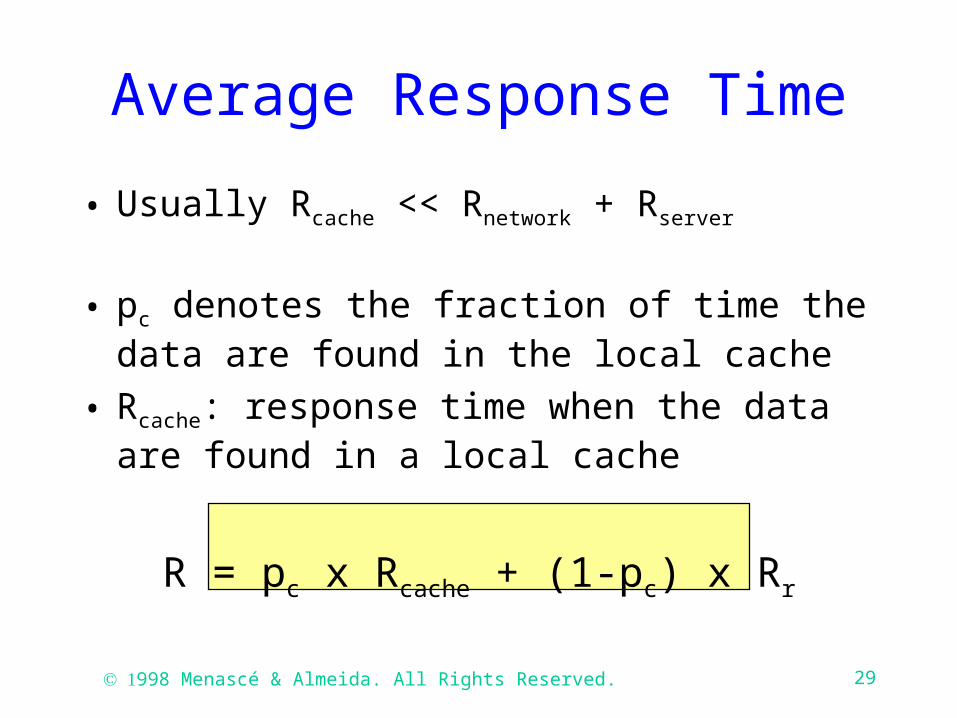
• Usually Rcache << Rnetwork + Rserver
• pc denotes the fraction of time the data are found in the local cache
• Rcache: response time when the data are found in a local cache
R = pc x Rcache + (1-pc) x Rr
Average Response Time
998 Menascé & Almeida. All Rights Reserved. 30
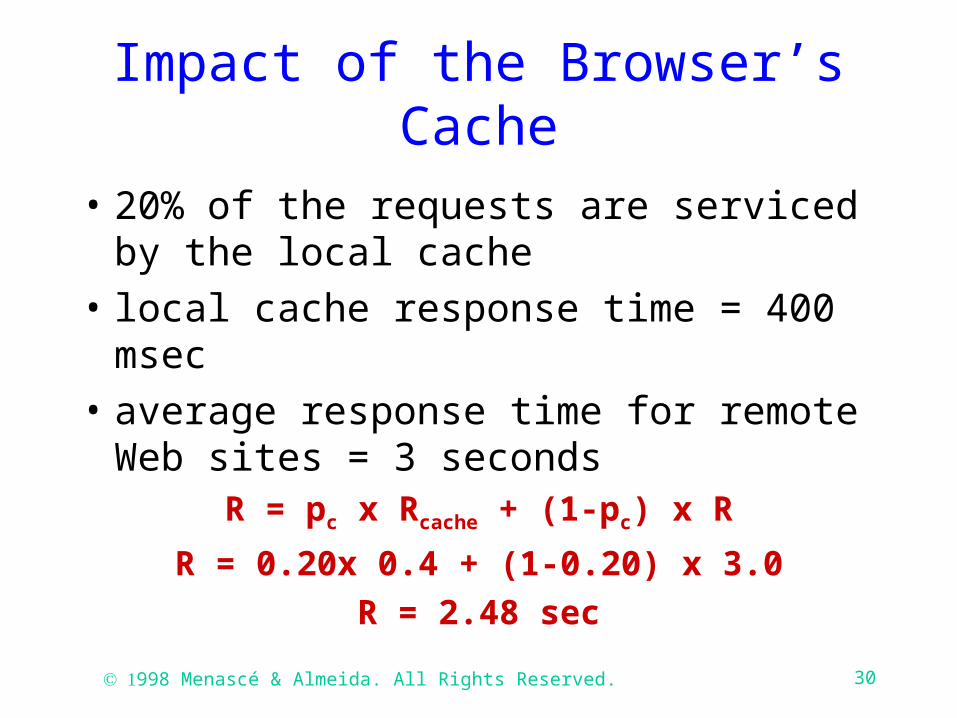
Impact of the Browser’s Cache
• 20% of the requests are serviced by the local cache
• local cache response time = 400 msec
• average response time for remote Web sites = 3 seconds
R = pc x Rcache + (1-pc) x R
R = 0.20x 0.4 + (1-0.20) x 3.0
R = 2.48 sec

998 Menascé & Almeida. All Rights Reserved. 31
Impact of the Browser’s Cache
• What if we increase the size of the local cache?
• Previous experiments show that tripling the cache size would raise the hit ratio to 45%. Thus,
R = pc x Rcache + (1-pc) x R
R = 0.45x 0.4 + (1-0.45) x 3.0
R = 1.83 sec
998 Menascé & Almeida. All Rights Reserved. 32
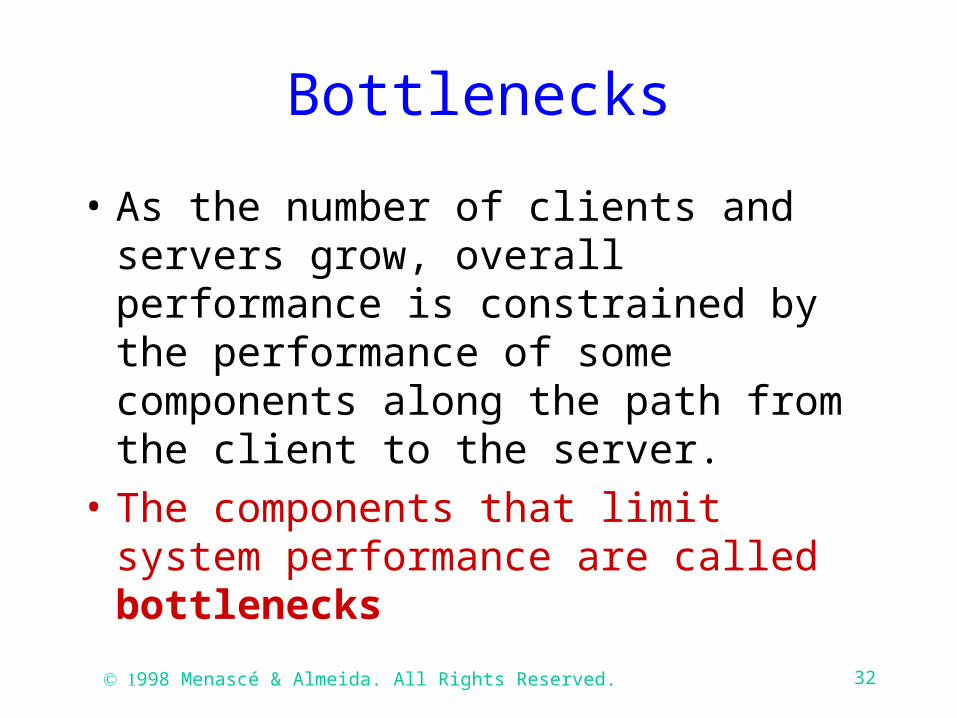
Bottlenecks
• As the number of clients and servers grow, overall performance is constrained by the performance of some components along the path from the client to the server.
• The components that limit system performance are called bottlenecks

998 Menascé & Almeida. All Rights Reserved. 33
Perception of Performance
• WWW user:• fast response time• no connection refused
• Web administrators:• high throughput• high availability
Need for quantitative measurements

998 Menascé & Almeida. All Rights Reserved. 34
WWW Performance Metrics
• connections/second
• Mbits/second
• response time• user side
• server side
• errors/second

998 Menascé & Almeida. All Rights Reserved. 35
WWW Performance Metrics (II)
Web site activity indicators• Visit: a series of consecutive Web page requests
from a visitor within a given period of time.• Hit: any connection to a Web site, including in-line
requests, and errors.
• Metrics• hits/day• visits/day• unique visitors/day• page views
998 Menascé & Almeida. All Rights Reserved. 36
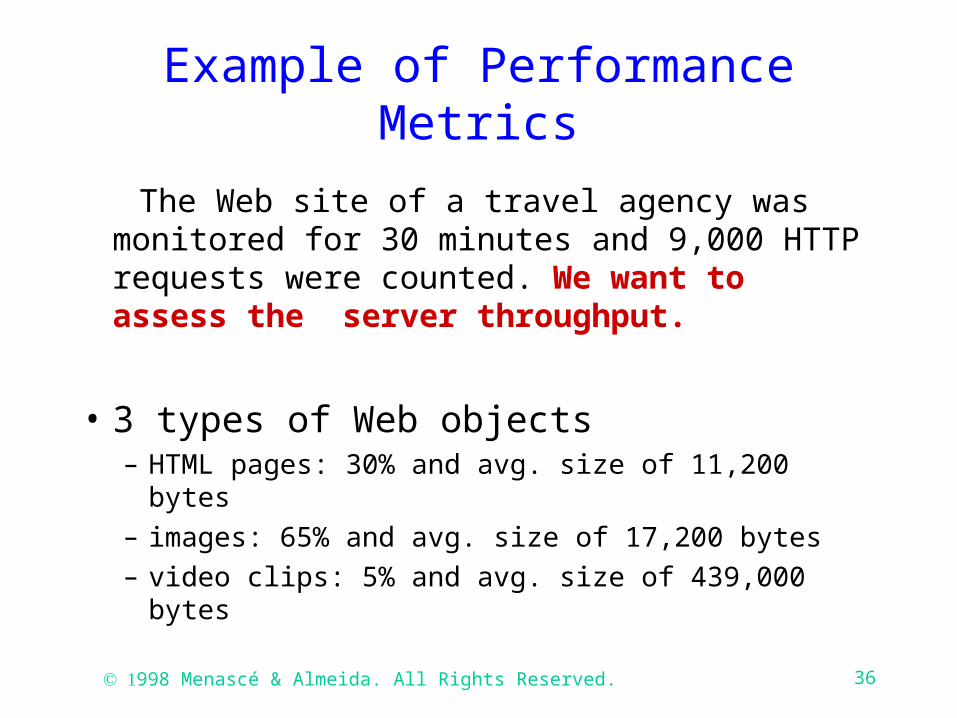
Example of Performance Metrics
The Web site of a travel agency was monitored for 30 minutes and 9,000 HTTP requests were counted. We want to assess the server throughput.
• 3 types of Web objects– HTML pages: 30% and avg. size of 11,200 bytes– images: 65% and avg. size of 17,200 bytes– video clips: 5% and avg. size of 439,000 bytes
998 Menascé & Almeida. All Rights Reserved. 37
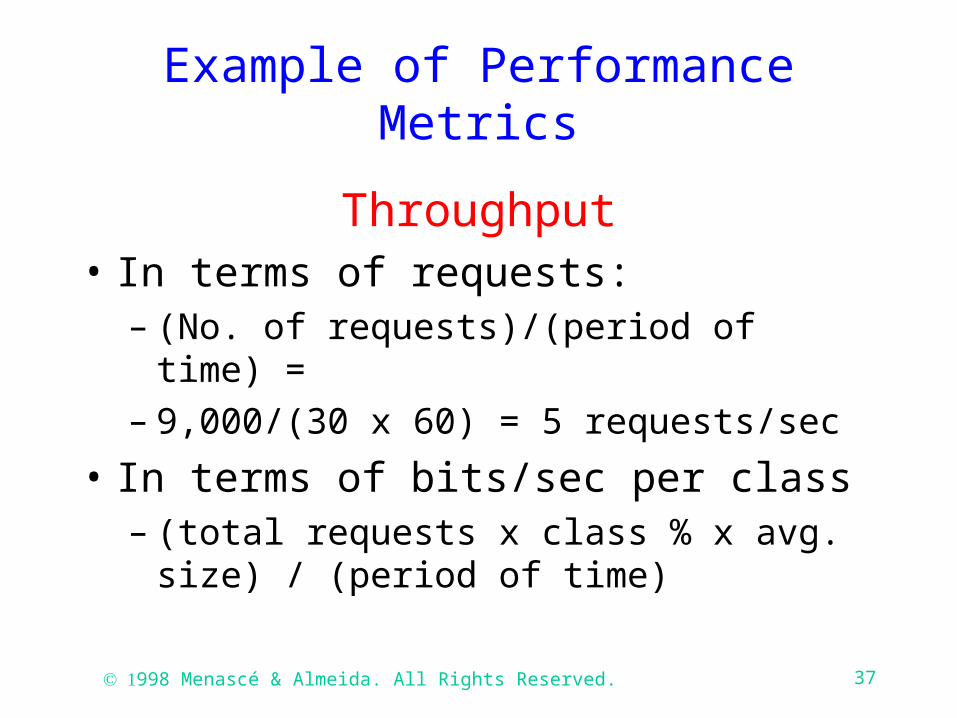
Example of Performance Metrics
Throughput• In terms of requests:
– (No. of requests)/(period of time) =– 9,000/(30 x 60) = 5 requests/sec
• In terms of bits/sec per class– (total requests x class % x avg. size) /
(period of time)
998 Menascé & Almeida. All Rights Reserved. 38
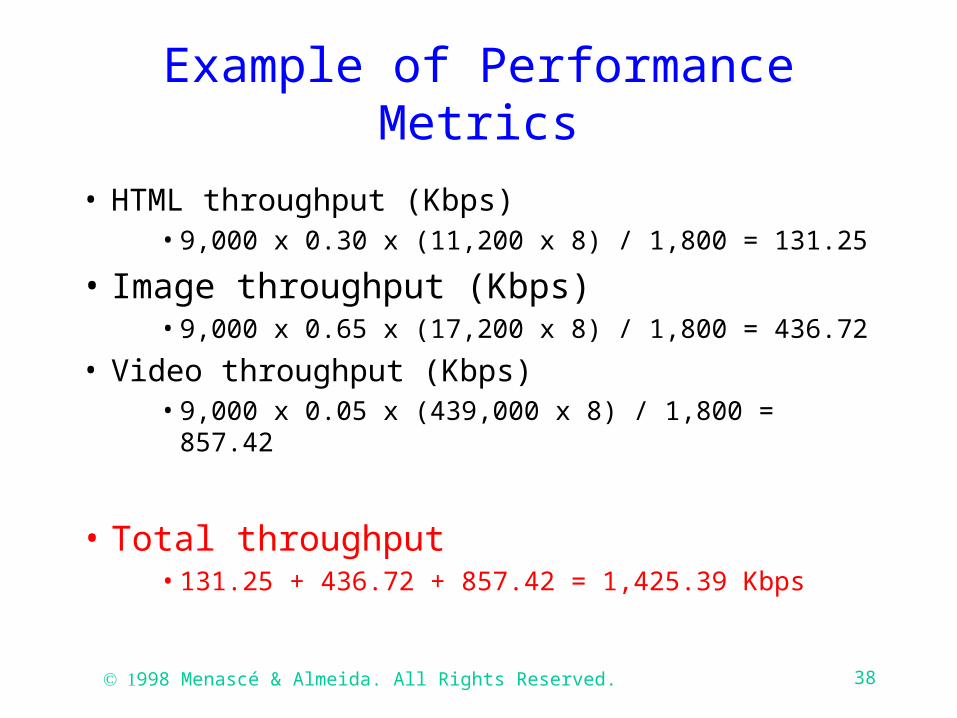
Example of Performance Metrics
• HTML throughput (Kbps)• 9,000 x 0.30 x (11,200 x 8) / 1,800 = 131.25
• Image throughput (Kbps)• 9,000 x 0.65 x (17,200 x 8) / 1,800 = 436.72
• Video throughput (Kbps)• 9,000 x 0.05 x (439,000 x 8) / 1,800 = 857.42
• Total throughput• 131.25 + 436.72 + 857.42 = 1,425.39 Kbps

998 Menascé & Almeida. All Rights Reserved. 39
Quality of Service• As Web sites become a fundamental component of
businesses, quality of service will be one of the top management concerns.
• Performance is a key issue for e-commerce
• The quality in the services provided by a Web environment is indicated by the service levels, namely:
• response time• availability and predictability

998 Menascé & Almeida. All Rights Reserved. 40
Quality of Service
• Typical questions to help establish the service level of a Web service:
– Is the objective of the Web site to provide information to external customers?
– Do your mission-critical business operations depend on the World Wide Web?
– Do you have high-end business needs for which 24 hours-a-day, 7 days-a-week uptime and high performance are critical, or can you live with the possibility of Web downtime?
998 Menascé & Almeida. All Rights Reserved. 41
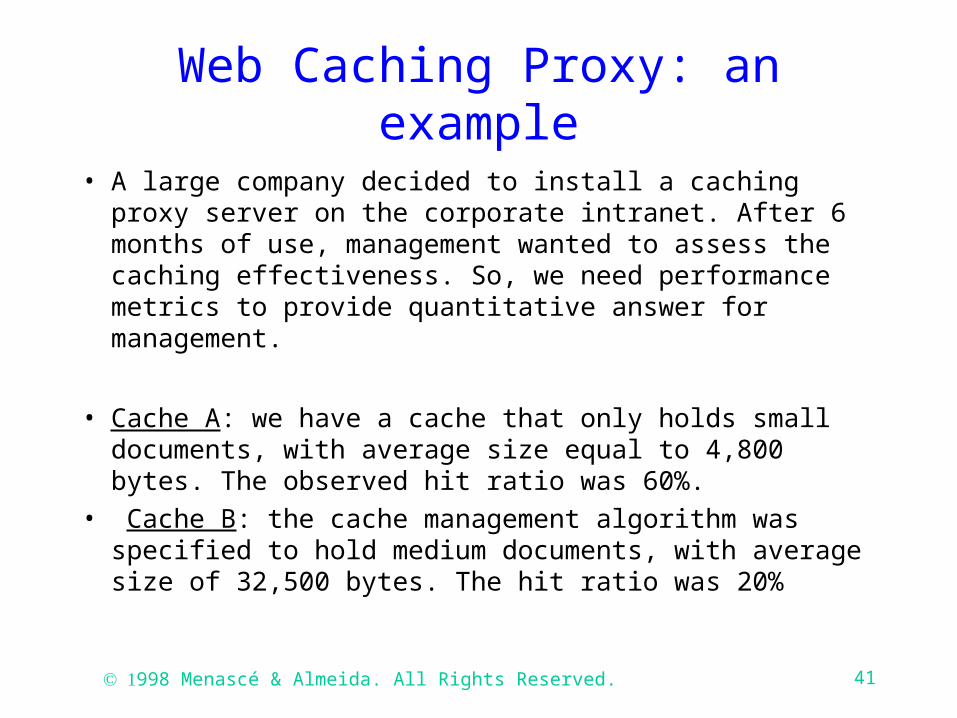
Web Caching Proxy: an example
• A large company decided to install a caching proxy server on the corporate intranet. After 6 months of use, management wanted to assess the caching effectiveness. So, we need performance metrics to provide quantitative answer for management.
• Cache A: we have a cache that only holds small documents, with average size equal to 4,800 bytes. The observed hit ratio was 60%.
• Cache B: the cache management algorithm was specified to hold medium documents, with average size of 32,500 bytes. The hit ratio was 20%

998 Menascé & Almeida. All Rights Reserved. 42
Web Caching Proxy: an example
• The proxy was monitored during 1 hour and 28,800 requests were handled in that interval.
• Let us compare the efficiency of the two cache strategies by the amount of saved bandwidth
• SavedBandwidth = (No-of-Req.Hit-Ratio Size)/Int.
• SavedBandwidth-A = (28,800 0.64,800 8)/3,600
= 180 Kbps• SavedBandwidth-B = (28,800 0.232,500 8)/3,600
= 406.3 Kbps

998 Menascé & Almeida. All Rights Reserved. 43
Novel Features in the WWW
• The Web exhibits extreme variability in workload characteristics:
– Web document sizes vary in the range of 102 to 106 bytes
– The distribution of file sizes in the Web exhibits heavy tails. In practical terms, heavy-tailed distributions indicate that very large values are possible with non-negligible probability.

998 Menascé & Almeida. All Rights Reserved. 44
Novel Features in Web Traffic heavy tailed distributions
Class File Size Range (KB) Percent of Requests
1 size < 5 252 5 size < 50 403 50 size < 100 204 100 size < 500 105 size 500 5
998 Menascé & Almeida. All Rights Reserved. 45
Novel Features in the WWW
• Web traffic exhibits a bursty behavior
– Traffic is bursty in several time scales.
– It is difficulty to size server capacity and bandwidth to support demand created by load spikes.

998 Menascé & Almeida. All Rights Reserved. 46
Traffic Burstiness on the Web• a: ratio between the maximum
observed request rate and the average request rate during an observation period.
• b: fraction of time during which the instantaneous arrival rate exceeds the average arrival rate.
Menascé, D. A.. All Rights Reserved.

998 Menascé & Almeida. All Rights Reserved. 47
Effects of Burstiness on Performance
0
10
20
30
40
50
60
Burstiness factor
Max
imu
m. T
hro
ug
hp
ut
0.30.10.0 0.2

998 Menascé & Almeida. All Rights Reserved. 48
Novel Features in the WWW
• The manager of the Web site of a large publishing company is planning the capacity of the network connection.
• 1 million HTTP operations per day• average document requested was 10 KB• The required bandwidth (Kbps) is:
HTTP op/sec average size of documents (KB)
11.6 HTTP ops/sec 10 KB/HTTP op = 928 Kbps
• Assume that protocol overhead is 20%

998 Menascé & Almeida. All Rights Reserved. 49
Novel Features in the WWW
• The actual throughput required is
928 1.20 = 1.114 Mbps
that can be provided by a T1 connection.
• Let us assume that management decided to plan for peak load. The hourly peak traffic ratio observed was 5 for some big news event. Then the required bandwidth is:
1.114 5 = 5.57 Mbps
that requires four T1 connections.

998 Menascé & Almeida. All Rights Reserved. 50
Part III
Capacity Planning Methodology

998 Menascé & Almeida. All Rights Reserved. 51
What is Adequate Capacity?
We say that a Web service has adequate capacity if the service-level agreements are continuously met for a specified technology and standards, and if the services are provided within cost constraints.

998 Menascé & Almeida. All Rights Reserved. 52
Service-Level Agreements (SLA)
• SLAs outline what a user of an application can expect in terms of response time, throughput, system availability, and reliability
– focus on metrics that users can understand– set easy-to-measure goals– tie IT costs to your SLAs

998 Menascé & Almeida. All Rights Reserved. 53
Service Level Agreements: examples
• Response time for Web transactions on the e-commerce site should not exceed 2 sec.
• ISP services should be available 24 hours a day seven days a week with negligible connection refusal rates.
• The goal for Web services is 99% of availability and less than one second for 90% of the HTTP requests for small documents.

998 Menascé & Almeida. All Rights Reserved. 54
Adequate Capacity
Users
Mgmt
SLAs
SpecifiedTechnology& Standards
CostConstraints
AdequateCapacity
AdequateCapacity
e.g.: NT and T3
e.g.: response time < 2 sec.
e.g.: startup cost < 100K $

998 Menascé & Almeida. All Rights Reserved. 55
ConfigurationPlan
InvestmentPlan
PersonnelPlan
Understanding the Environment
Workload Characterization
WorkloadModel
Validation and Calibration
Workload Forecasting
Performance PredictionCost PredictionValidModel
Cost Model
Developing a Cost Model
PerformanceModel
Cost/Performance Analysis
Methodology
998 Menascé & Almeida. All Rights Reserved. 56
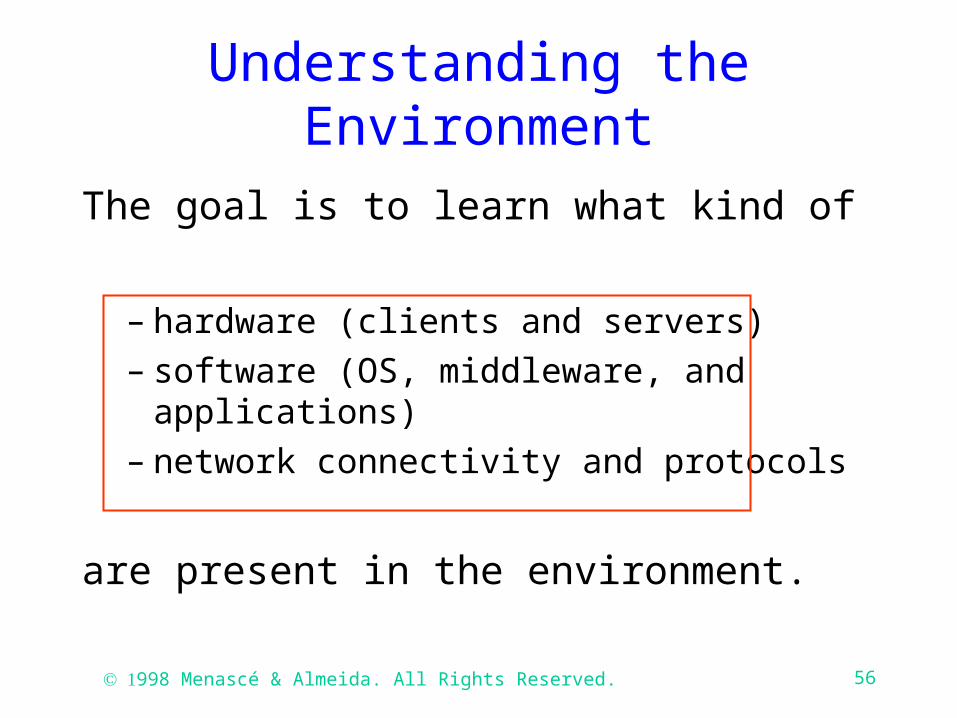
Understanding the Environment
The goal is to learn what kind of
– hardware (clients and servers)– software (OS, middleware, and
applications)– network connectivity and protocols
are present in the environment.

998 Menascé & Almeida. All Rights Reserved. 57
Elements in Understanding the Environment
Client platform Quantity and type
Server platform Quantity, type, configuration andfunctions
Middleware Type (e.g. TP monitors)
DBMS Type
Application Main types of applications, criticality,etc.
Networkconnectivity
Network diagrams with LANs, WANs,routers, servers, etc.
SLAs Existing SLAs per application
Procurementprocedures
Elements of the procurement process,expenditure limits, justificationprocedures for acquisitions.

998 Menascé & Almeida. All Rights Reserved. 58
Workload Characterization
Workload characterization is the process of precisely describing the system’s global workload in terms of its main components.
The basic components are then characterized by intensity and service demand parameters at each resource of the system.

998 Menascé & Almeida. All Rights Reserved. 59
WWW Traffic Characteristics Unpredictable in nature. Self-similar, i.e., bursty over several time scales. Load spikes can be many times higher than average
traffic. Workload characterization studies done at:
client side proxy cache server Web
• see http://www.parc.xerox.com/istl/projects/http-ng/web-characterization-reading.html

998 Menascé & Almeida. All Rights Reserved. 60
Workload Characterization at the Client Side
Cunha, Bestavros, and Crovella (1995) Half a million requests from instrumented
Mosaic in an academic setting. The distribution of document sizes,
popularity of documents as a function of size, distribution of user requests for documents, and number of references to documents as a function of overall rank in popularity can be modeled by power-law distributions.
998 Menascé & Almeida. All Rights Reserved. 61
Workload Characterization at the Client Side
Cunha, Bestavros, and Crovella (1995)
22% of the requests generated by the browser were cache misses.
96% of the total requests were for html files and only 1% for CGI bin requests.
Current studies show dynamically generated pages ranging from 2 to 6% (Almeida98)
998 Menascé & Almeida. All Rights Reserved. 62
Workload Characterization at the Client Side
Cunha, Bestavros, and Crovella (1995)
79% of requests were for external servers
Less than 10% of requests were for unique URLs, i.e., URLs not previously referenced.
9.6% of accesses were to html files with an average size of 6.4 KB and 69% to images with an average size of 14KB.

998 Menascé & Almeida. All Rights Reserved. 63
Workload Characterization at the Client Side
Tauscher and Greenberg (1997)
Six weeks of WWW usage by 23 users. 58% of pages visited are revisits. Users tend to visit pages just visited more
often than pages visited less recently.

998 Menascé & Almeida. All Rights Reserved. 64
Workload Characterization at the Proxy Server
Abrams, Standrige, Abdulla, Williams, and Fox (1995)
Six months of data from 3 educational sites. Trace-driven simulation of a cache proxy
server. The maximum cache hit rate was between
30 and 50% for infinite size caches regardless of cache design.

998 Menascé & Almeida. All Rights Reserved. 65
Workload Characterization at the Server
Arlitt and Williamson (1996)
Six WWW servers: academic and commercial.
Number of requests ranged from 188K to 3.5M per site.
Search for invariants.
998 Menascé & Almeida. All Rights Reserved. 66
Workload Characterization at the Server
Arlitt and Williamson (1996)
� HTML and image files account for 90-100% of requests
� The average size of a transferred document does not exceed 21KB
� Less than 3% of the requests are for distinct files.
� The file size distribution is Pareto with 0.40 < < 0.63. I.e., this distribution is heavy-tailed.

998 Menascé & Almeida. All Rights Reserved. 67
Workload Characterization at the Server
Arlitt and Williamson (1996)
� Ten percent of the files accessed account for 90% of server requests and 90% of the bytes transferred.
� File inter-reference times are exponentially distributed and independent.
� At least 70% of the requests come from remote sites. These requests account for at least 60% of the bytes transferred.

998 Menascé & Almeida. All Rights Reserved. 68
Workload Characterization at the Server
Crovella and Bestravos (1996)
� Traces of users using Mosaic reflecting requests to over half a million documents.
� Purpose: show the presence of self-similarity in Web traffic and explain it through the underlying characteristics of the WWW workload.

998 Menascé & Almeida. All Rights Reserved. 69
Workload Characterization at the Server
Crovella and Bestravos (1996)
� File sizes have a heavy-tailed distribution.
� This distribution may explain the fact that transmission time distributions are also heavy-tailed.
Menascé, D. A.. All Rights Reserved.
998 Menascé & Almeida. All Rights Reserved. 70
Workload Characterization at the Server
Almeida and Oliveira (1996)
� Used fractal models to study the document reference pattern at Web servers.
� Used an LRU stack model to study references to documents stored in two Web sites.
� Found strong evidence of self-similarity in the document reference pattern.
Menascé, D. A.. All Rights Reserved.
998 Menascé & Almeida. All Rights Reserved. 71
Web Traffic Workload Characterization
Bray (1996)
� Over 11 million Web pages were analyzed in 1995.
The average page size was 6,518 bytes with a standard deviation of 31,678 bytes.
About 50% of the pages were found to have at least one embedded image and 15% were found to have exactly one image.
Menascé, D. A.. All Rights Reserved.

998 Menascé & Almeida. All Rights Reserved. 72
Web Traffic Workload Characterization
Bray (1996)
Over 80% of the sites are pointed by a few (between 1 and 10) other sites.
Almost 80% of the sites contain no links to off-site URLs.
Around 45% of the files had no extension and 37% were html files. Then .gif and .txt files were the next most popular with 2.5% each.
998 Menascé & Almeida. All Rights Reserved. 73
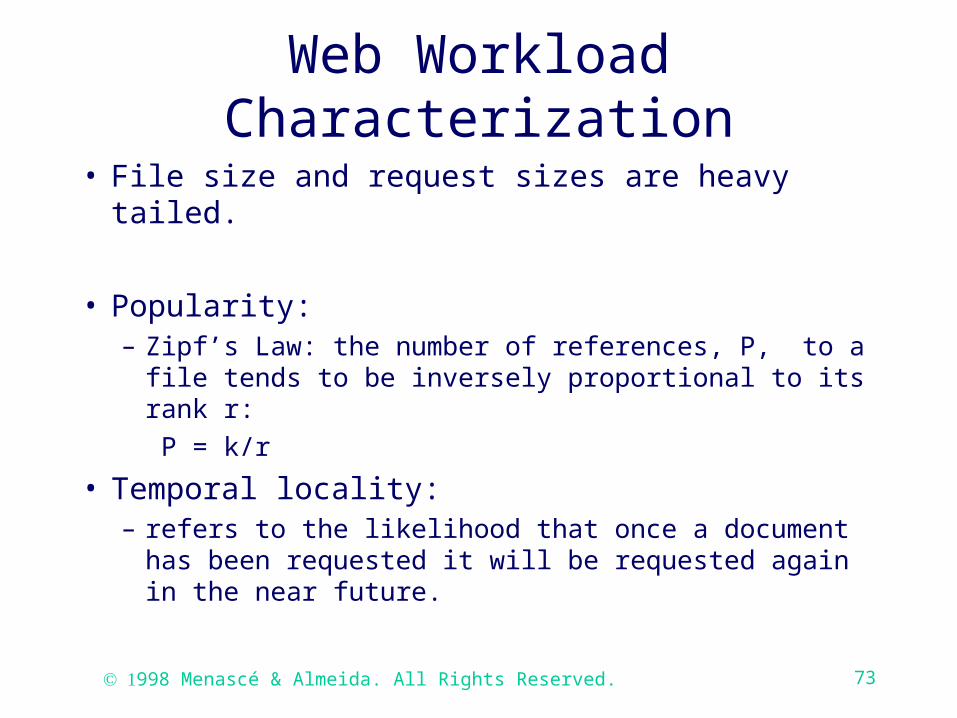
Web Workload Characterization
• File size and request sizes are heavy tailed.
• Popularity:– Zipf’s Law: the number of references, P, to a
file tends to be inversely proportional to its rank r:
P = k/r
• Temporal locality:– refers to the likelihood that once a document
has been requested it will be requested again in the near future.

998 Menascé & Almeida. All Rights Reserved. 74
Web Workload Characterization
• SURGE (Barford and Crovella, ACM Sigmetrics 1998): workload generator that mimics real Web users.
• SURGE exercises Web servers quite differently from most commonly used benchmarks (i.e., SPECweb96)– maintains a higher number of open
connections– results in much higher CPU load
998 Menascé & Almeida. All Rights Reserved. 75
Workload Forecasting
• How will the number of e-mail messages handled per day by the server vary over the next 6 months?
• How will the traffic of the ISP increase over the next year?
• How will the number of hits to the corporate intranet’s Web server vary over time?
998 Menascé & Almeida. All Rights Reserved. 76
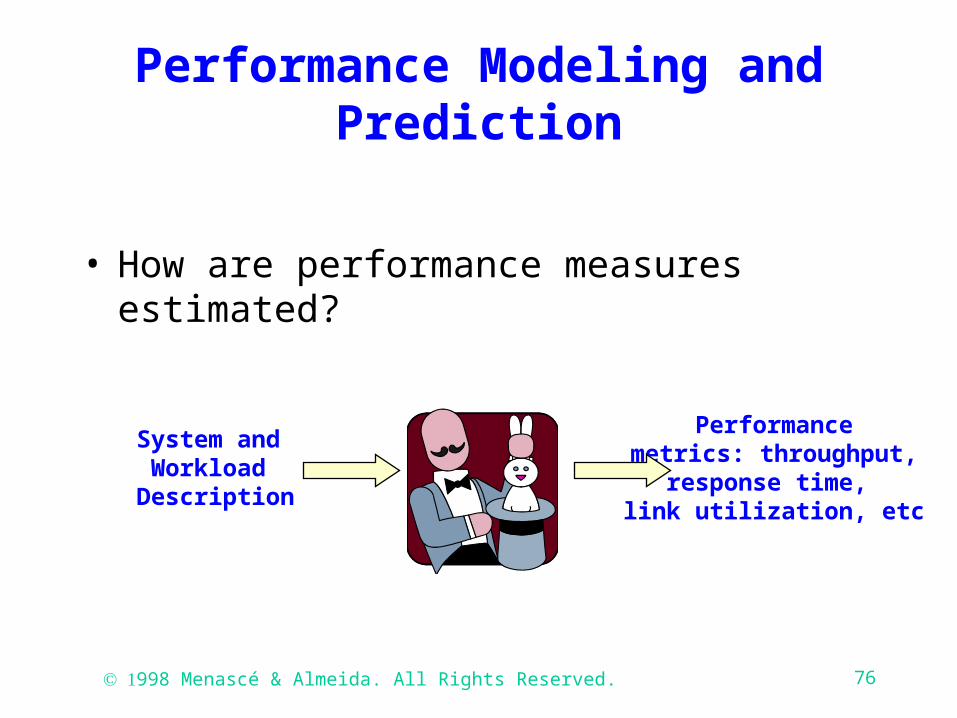
Performance Modeling and Prediction
• How are performance measures estimated?
System and Workload
Description
Performancemetrics: throughput,
response time, link utilization, etc

998 Menascé & Almeida. All Rights Reserved. 77
Estimating performance measures
QueuingNetwork Model
System Description
PerformanceMeasures
• Response time• Throughput• Utilization
• Queue length
• System parameters
• Resources parameters
• Workload parameters•service demands•workload intensity
MODEL
998 Menascé & Almeida. All Rights Reserved. 78
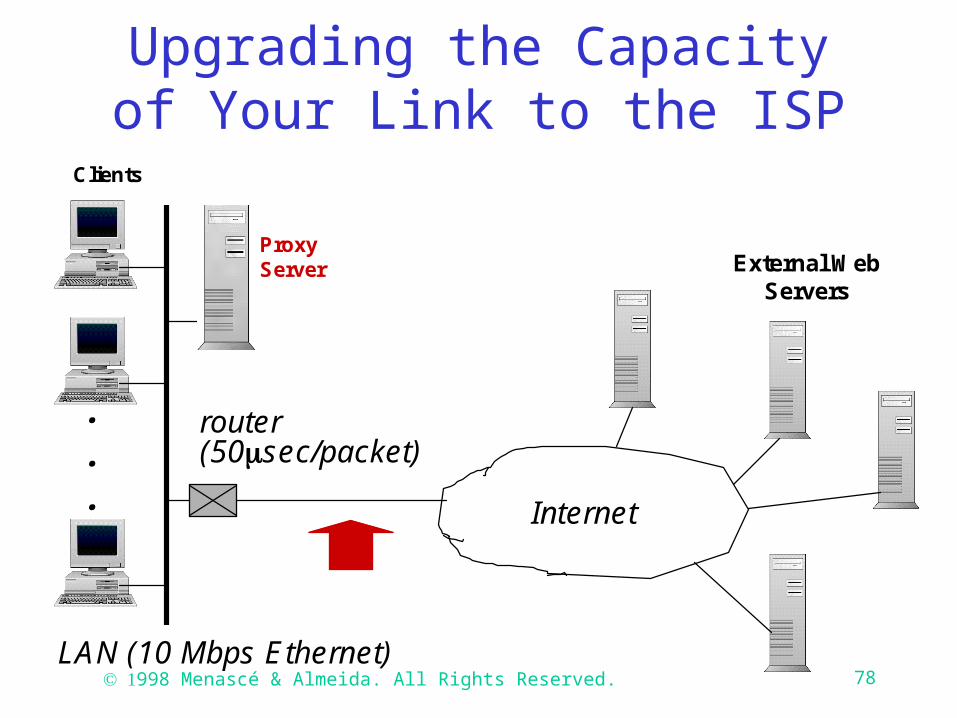
Upgrading the Capacity of Your Link to the ISP
Clients
ProxyServer External Web
Servers
router(50sec/packet)
Internet
LAN (10 Mbps Ethernet)
.
.
.
998 Menascé & Almeida. All Rights Reserved. 79
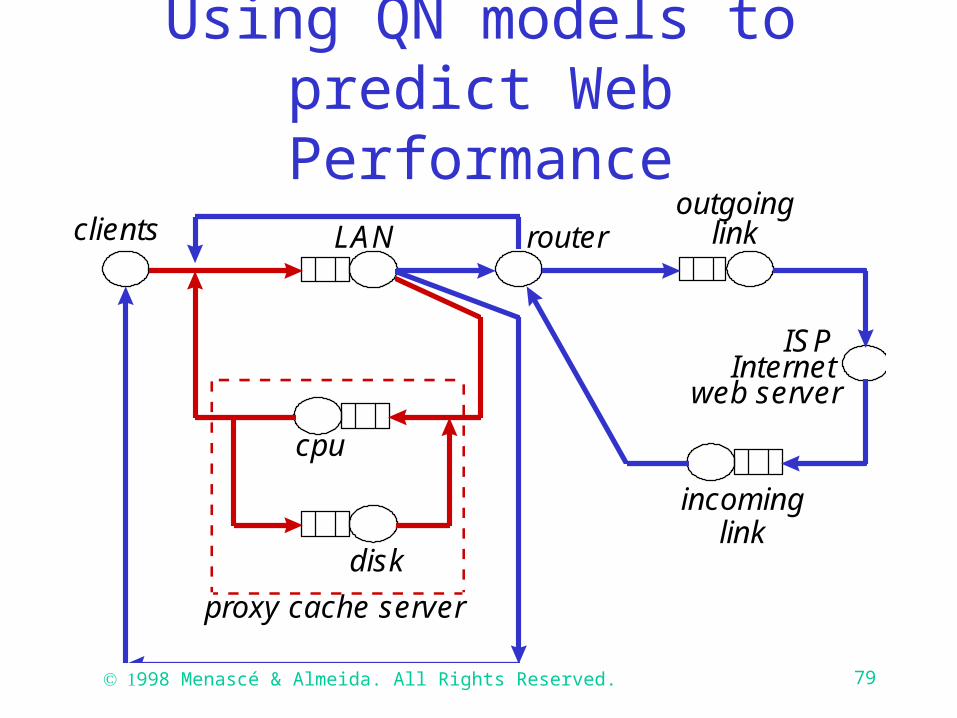
Using QN models to predict Web Performance
routerLAN
cpu
disk
proxy cache server
incominglink
outgoinglink
ISP Internet web server
clients

998 Menascé & Almeida. All Rights Reserved. 80
Results of QN Model
Link Bandwidth
(Kbps)
Throughput (HTTP
req/sec)
Resp. Time (sec) Bottleneck
56 1.125 9.996 Link to ISP128 2.393 2.935 ISP+Internet+External Web Server256 3.475 0.984 ISP+Internet+External Web Server
1500 3.883 0.530 ISP+Internet+External Web Server

998 Menascé & Almeida. All Rights Reserved. 81
Capacity Planning of Web Services
• Can be used to avoid some of the obvious and most common pitfalls: site congestion and lack of bandwidth.– Typical capacity planning questions:– Is the ISP network able to sustain the increase in
traffic?– Will Web server performance continue to be
acceptable when twice as many people visit the site?
– Are servers and network capacity adequate to handle load spikes?

998 Menascé & Almeida. All Rights Reserved. 82
Bibliography
• Capacity Planning and for Web Performance: metrics, models and methods, Daniel Menascé and Virgilio Almeida, Prentice Hall, Upper Saddle River, 1998.
• Capacity Planning and Performance Modeling: from mainframes to client/server systems, Daniel Menascé, Virgilio Almeida, and Larry Dowdy, Prentice Hall, Upper Saddle River, 1994.
• Web Server Technology, N. Yeager and R. McGrath, Morgan Kaufmann, San Francisco, 1996.
• “Web Workload Characterization”, M. Arlitt and G. Williamson, Proc. of the 1996 SIGMETRICS Conf. Measurement Comput. Syst., ACM, Philadelphia, May 1996.