NZ Aviation Overvie · NEW ZEALAND AVIATION OVERVIEW ... Trends - The graph below shows NZ’s...
23
Aviation sector v6sector v5 NEW ZEALAND AVIATION OVERVIEW Flights, passengers and related statistics November 2008 | www.tourismresearch.govt.nz This report outlines aviation and related statistical information from existing data sources. The analysis provides an overview of international air travel to and from New Zealand as well as domestic air travel, using statistical information such as flights and passengers, international and domestic travel, overseas and New Zealand travellers, overseas and New Zealand airports and air routes.
Transcript of NZ Aviation Overvie · NEW ZEALAND AVIATION OVERVIEW ... Trends - The graph below shows NZ’s...
Aviation sector v6sector v5
NEW ZEALAND AVIATION OVERVIEW Flights, passengers and related statistics
November 2008 | www.tourismresearch.govt.nz
This report outlines aviation and related statistical information from existing data sources. The analysis provides an overview of international air travel to and from New Zealand as well as domestic air travel, using statistical information such as flights and passengers, international and domestic travel, overseas and New Zealand travellers, overseas and New Zealand airports and air routes.
New Zealand Aviation Overview, Ministry of Tourism 1
Contents
1. Introduction............................................................................................................................................. 2 2. Key Facts................................................................................................................................................. 2 3. Aviation Trends......................................................................................................................................... 3 3.1 International Flight Arrivals..................................................................................................................... 4 3.2 International Air Passenger Arrivals ....................................................................................................... 5 3.3 Share of NZ and Overseas Air Passengers ........................................................................................... 5 3.4 Average Number of Passengers per Flight ............................................................................................ 6 3.5 Indices of International Flight Arrivals, Passengers and Passengers per Flight .................................... 6 3.6 Airports in New Zealand ......................................................................................................................... 7 3.7 International Flights via NZ Airports ....................................................................................................... 8 3.8 Weekly International Flights via NZ Airports .......................................................................................... 8 3.9 International Passengers via NZ Airports............................................................................................... 8 3.10 NZ International Flights via Overseas Airports..................................................................................... 9 3.11 Weekly NZ International Flights via Overseas Airports...................................................................... 10 3.12 International Passengers via Overseas Airports ................................................................................ 11 3.13 Domestic Flights and Passengers via Major NZ Airports................................................................... 12 3.15 Exchange Rates ................................................................................................................................. 13 4. Data Tables ........................................................................................................................................... 15 Appendices................................................................................................................................................. 22 A. International Airlines Servicing New Zealand, Nov 2008....................................................................... 22 B. Tourism and Aviation Information Websites .......................................................................................... 22
Ministry of Tourism PO Box 5640 Wellington New Zealand Ph: +64 4 498 7440 Fax: +64 4 498 7445 Email: [email protected] Website: www.tourismresearch.govt.nz Image Credits:
Fern – Rebecca Davis, www.moxie.co.nz
Mt Taranaki from the Pouakai Range - Iain Guilliard, www.iainguilliard.com
New Zealand Aviation Overview, Ministry of Tourism 2
1. Introduction This analysis has been undertaken to set out key information on the New Zealand aviation sector. It has been prepared given the importance of the aviation sector as a driver of tourism demand. Aviation provides the vital ‘pipeline’ through which tourists flow, including inbound and outbound travellers, and travellers within New Zealand.
A number of currently available data sources have been used in this analysis. Given the constraints of current data, not all the factors that influence the sector can be reported on at present, but over time it is anticipated that further data can be accessed to supplement the analysis contained in this report, which will be built upon and updated annually as part of the Ministry of Tourism’s analysis programme. 2. Key Facts Total international air traffic - In 2007, New Zealand’s international air travel sector was served
by around 17 international airlines (some of these also operated on a code-share basis with 15 other airlines). They flew 56,200 flights (arrivals and departures) and carried 8,971,000 passengers.
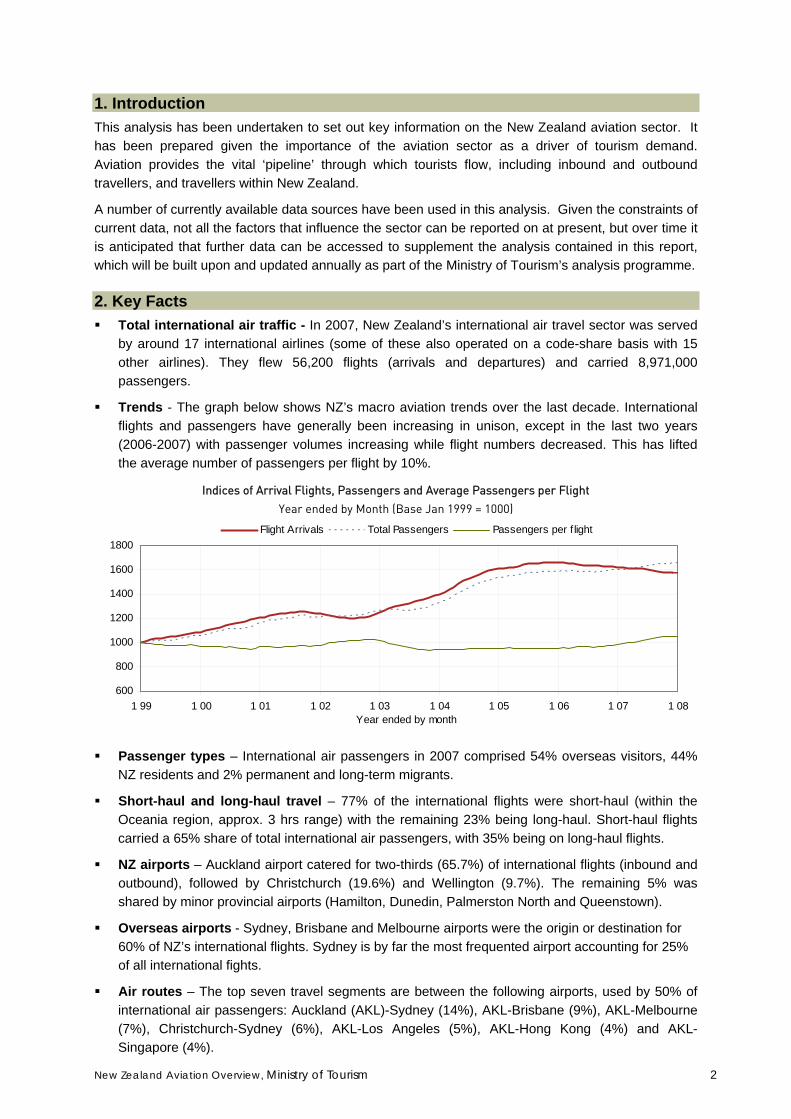
Trends - The graph below shows NZ’s macro aviation trends over the last decade. International flights and passengers have generally been increasing in unison, except in the last two years (2006-2007) with passenger volumes increasing while flight numbers decreased. This has lifted the average number of passengers per flight by 10%.
Indices of Arrival Flights, Passengers and Average Passengers per Flight Year ended by Month (Base Jan 1999 = 1000)
600
800
1000
1200
1400
1600
1800
1 99 1 00 1 01 1 02 1 03 1 04 1 05 1 06 1 07 1 08
Flight Arrivals Total Passengers Passengers per f light
Year ended by month
Passenger types – International air passengers in 2007 comprised 54% overseas visitors, 44% NZ residents and 2% permanent and long-term migrants.
Short-haul and long-haul travel – 77% of the international flights were short-haul (within the Oceania region, approx. 3 hrs range) with the remaining 23% being long-haul. Short-haul flights carried a 65% share of total international air passengers, with 35% being on long-haul flights.
NZ airports – Auckland airport catered for two-thirds (65.7%) of international flights (inbound and outbound), followed by Christchurch (19.6%) and Wellington (9.7%). The remaining 5% was shared by minor provincial airports (Hamilton, Dunedin, Palmerston North and Queenstown).
Overseas airports - Sydney, Brisbane and Melbourne airports were the origin or destination for 60% of NZ’s international flights. Sydney is by far the most frequented airport accounting for 25% of all international fights.
Air routes – The top seven travel segments are between the following airports, used by 50% of international air passengers: Auckland (AKL)-Sydney (14%), AKL-Brisbane (9%), AKL-Melbourne (7%), Christchurch-Sydney (6%), AKL-Los Angeles (5%), AKL-Hong Kong (4%) and AKL-Singapore (4%).
New Zealand Aviation Overview, Ministry of Tourism 3
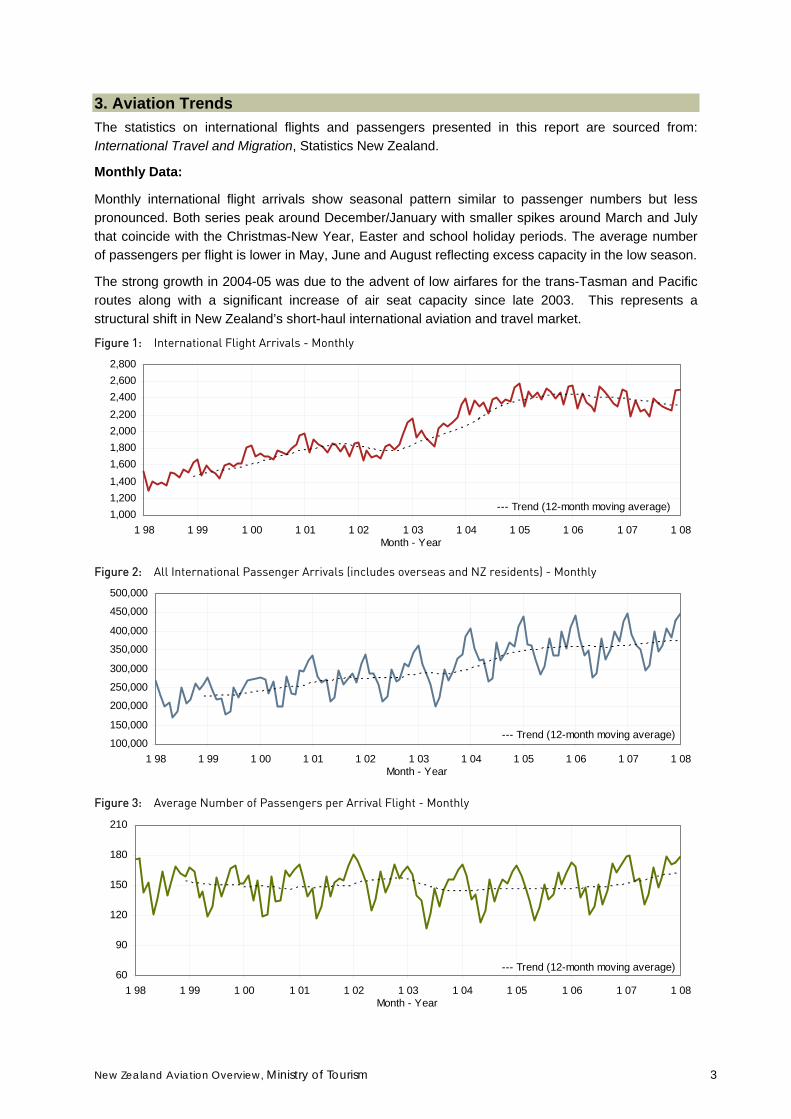
3. Aviation Trends The statistics on international flights and passengers presented in this report are sourced from: International Travel and Migration, Statistics New Zealand. Monthly Data: Monthly international flight arrivals show seasonal pattern similar to passenger numbers but less pronounced. Both series peak around December/January with smaller spikes around March and July that coincide with the Christmas-New Year, Easter and school holiday periods. The average number of passengers per flight is lower in May, June and August reflecting excess capacity in the low season.
The strong growth in 2004-05 was due to the advent of low airfares for the trans-Tasman and Pacific routes along with a significant increase of air seat capacity since late 2003. This represents a structural shift in New Zealand’s short-haul international aviation and travel market.
Figure 1: International Flight Arrivals - Monthly
1,0001,2001,4001,6001,8002,0002,2002,4002,6002,800
1 98 1 99 1 00 1 01 1 02 1 03 1 04 1 05 1 06 1 07 1 08Month - Year
--- Trend (12-month moving average)
Figure 2: All International Passenger Arrivals (includes overseas and NZ residents) - Monthly
100,000
150,000
200,000
250,000
300,000
350,000
400,000
450,000
500,000
1 98 1 99 1 00 1 01 1 02 1 03 1 04 1 05 1 06 1 07 1 08Month - Year
--- Trend (12-month moving average)
Figure 3: Average Number of Passengers per Arrival Flight - Monthly
60
90
120
150
180
210
1 98 1 99 1 00 1 01 1 02 1 03 1 04 1 05 1 06 1 07 1 08Month - Year
--- Trend (12-month moving average)
New Zealand Aviation Overview, Ministry of Tourism 4
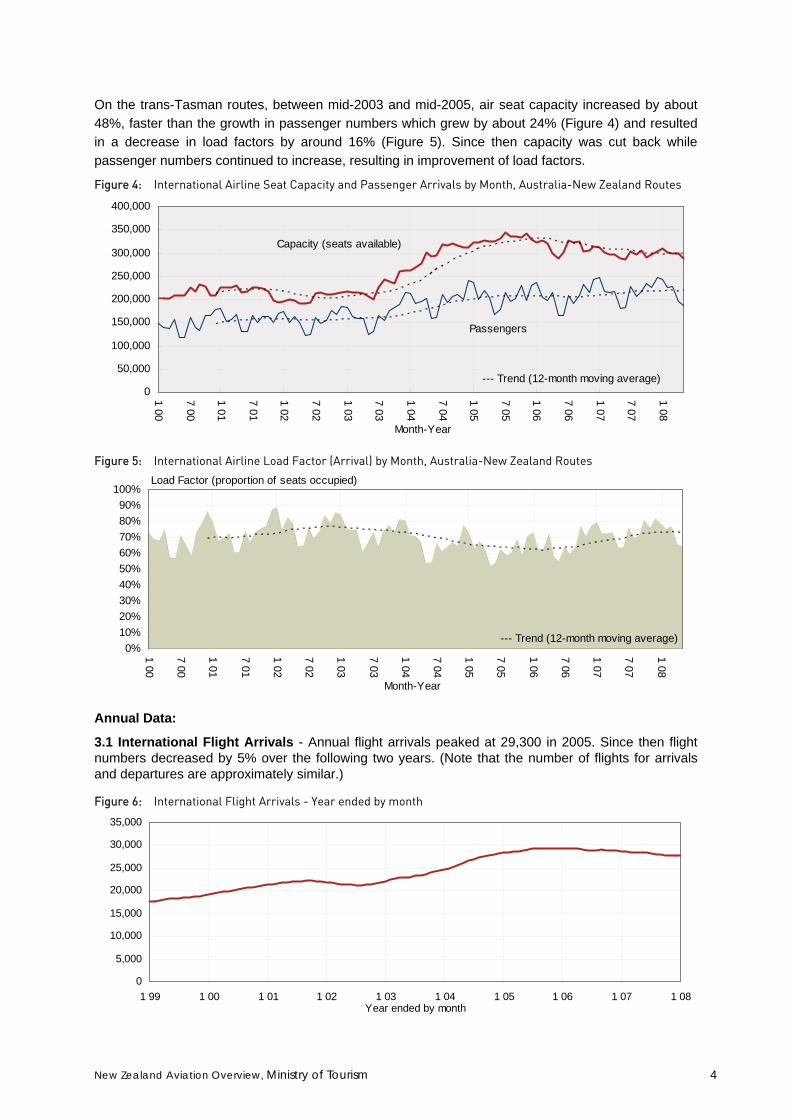
On the trans-Tasman routes, between mid-2003 and mid-2005, air seat capacity increased by about 48%, faster than the growth in passenger numbers which grew by about 24% (Figure 4) and resulted in a decrease in load factors by around 16% (Figure 5). Since then capacity was cut back while passenger numbers continued to increase, resulting in improvement of load factors. Figure 4: International Airline Seat Capacity and Passenger Arrivals by Month, Australia-New Zealand Routes
0
50,000
100,000
150,000
200,000
250,000
300,000
350,000
400,000
1 00
7 00
1 01
7 01
1 02
7 02
1 03
7 03
1 04
7 04
1 05
7 05
1 06
7 06
1 07
7 07
1 08
Month-Year
Passengers
--- Trend (12-month moving average)
Capacity (seats available)
Figure 5: International Airline Load Factor (Arrival) by Month, Australia-New Zealand Routes
0%10%20%30%40%50%60%70%80%90%
100%
1 00
7 00
1 01
7 01
1 02
7 02
1 03
7 03
1 04
7 04
1 05
7 05
1 06
7 06
1 07
7 07
1 08
--- Trend (12-month moving average)
Load Factor (proportion of seats occupied)
Month-Year
Annual Data: 3.1 International Flight Arrivals - Annual flight arrivals peaked at 29,300 in 2005. Since then flight numbers decreased by 5% over the following two years. (Note that the number of flights for arrivals and departures are approximately similar.)
Figure 6: International Flight Arrivals - Year ended by month
0
5,000
10,000
15,000
20,000
25,000
30,000
35,000
1 99 1 00 1 01 1 02 1 03 1 04 1 05 1 06 1 07 1 08Year ended by month
New Zealand Aviation Overview, Ministry of Tourism 5
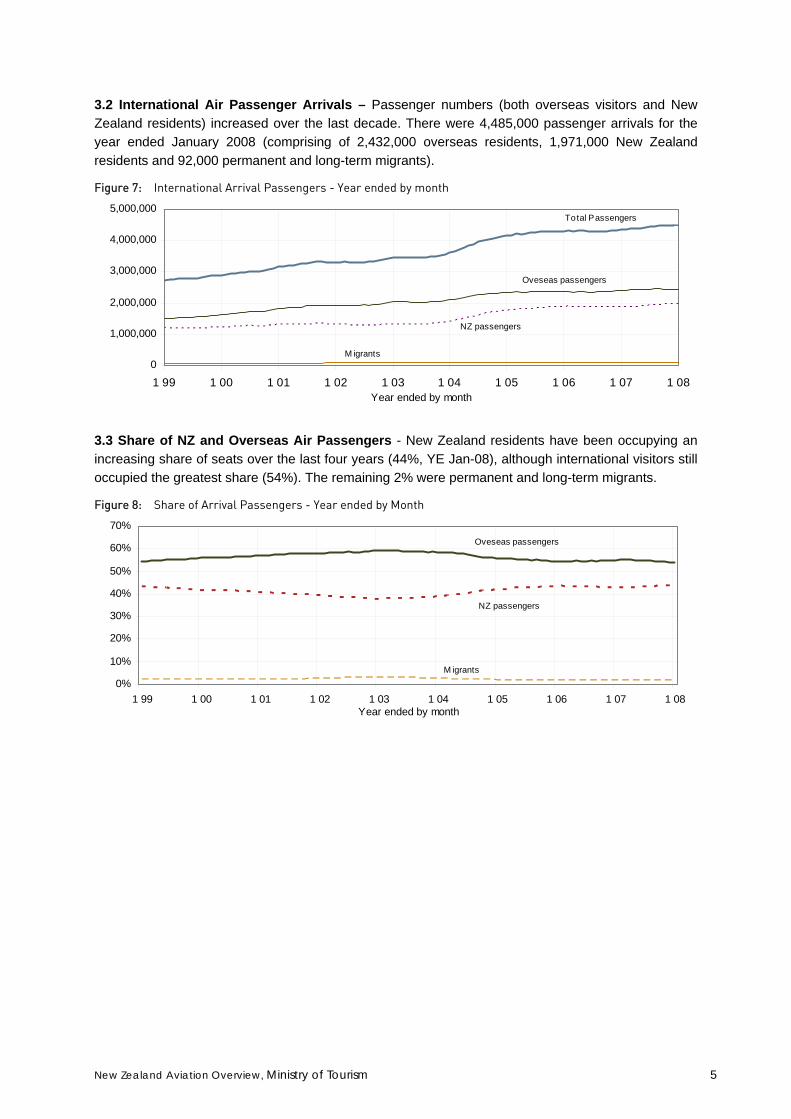
3.2 International Air Passenger Arrivals – Passenger numbers (both overseas visitors and New Zealand residents) increased over the last decade. There were 4,485,000 passenger arrivals for the year ended January 2008 (comprising of 2,432,000 overseas residents, 1,971,000 New Zealand residents and 92,000 permanent and long-term migrants).
Figure 7: International Arrival Passengers - Year ended by month
0
1,000,000
2,000,000
3,000,000
4,000,000
5,000,000
1 99 1 00 1 01 1 02 1 03 1 04 1 05 1 06 1 07 1 08Year ended by month
Oveseas passengers
NZ passengers
M igrants
Total Passengers
3.3 Share of NZ and Overseas Air Passengers - New Zealand residents have been occupying an increasing share of seats over the last four years (44%, YE Jan-08), although international visitors still occupied the greatest share (54%). The remaining 2% were permanent and long-term migrants.
Figure 8: Share of Arrival Passengers - Year ended by Month
0%
10%
20%
30%
40%
50%
60%
70%
1 99 1 00 1 01 1 02 1 03 1 04 1 05 1 06 1 07 1 08Year ended by month
Oveseas passengers
NZ passengers
M igrants
New Zealand Aviation Overview, Ministry of Tourism 6
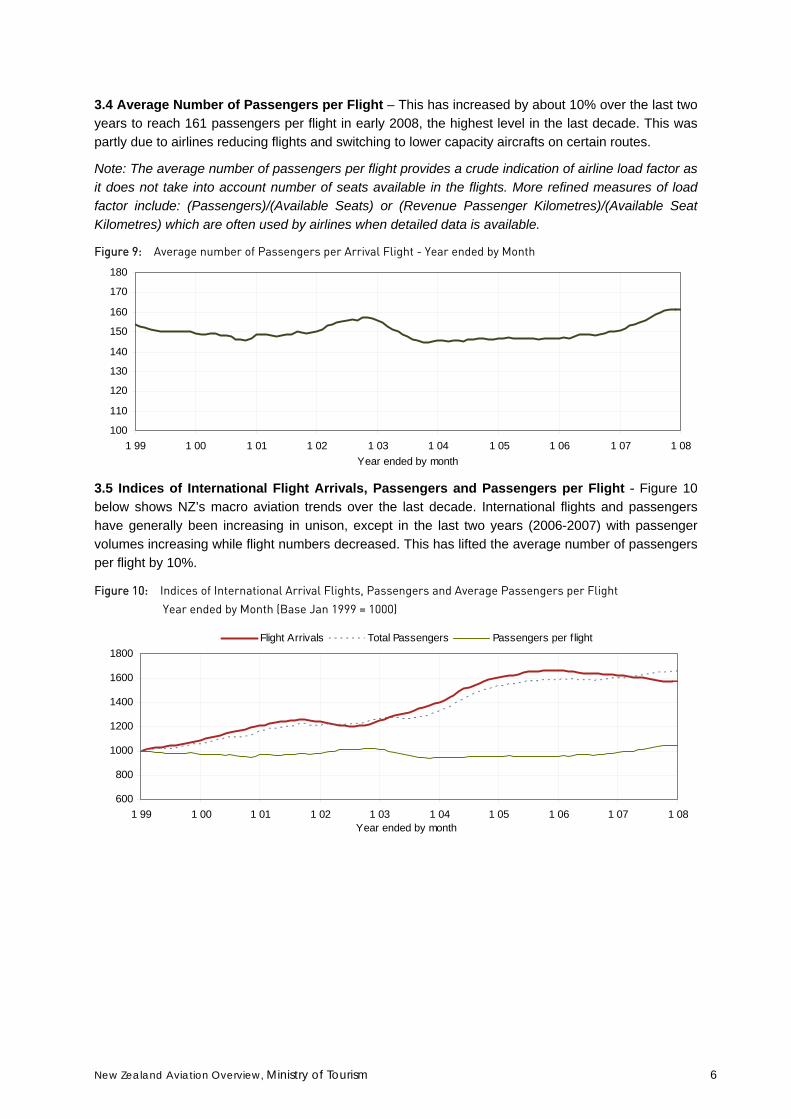
3.4 Average Number of Passengers per Flight – This has increased by about 10% over the last two years to reach 161 passengers per flight in early 2008, the highest level in the last decade. This was partly due to airlines reducing flights and switching to lower capacity aircrafts on certain routes.
Note: The average number of passengers per flight provides a crude indication of airline load factor as it does not take into account number of seats available in the flights. More refined measures of load factor include: (Passengers)/(Available Seats) or (Revenue Passenger Kilometres)/(Available Seat Kilometres) which are often used by airlines when detailed data is available.
Figure 9: Average number of Passengers per Arrival Flight - Year ended by Month
100
110
120
130
140
150
160
170
180
1 99 1 00 1 01 1 02 1 03 1 04 1 05 1 06 1 07 1 08Year ended by month
3.5 Indices of International Flight Arrivals, Passengers and Passengers per Flight ‐ Figure 10 below shows NZ’s macro aviation trends over the last decade. International flights and passengers have generally been increasing in unison, except in the last two years (2006-2007) with passenger volumes increasing while flight numbers decreased. This has lifted the average number of passengers per flight by 10%.
Figure 10: Indices of International Arrival Flights, Passengers and Average Passengers per Flight Year ended by Month (Base Jan 1999 = 1000)
600
800
1000
1200
1400
1600
1800
1 99 1 00 1 01 1 02 1 03 1 04 1 05 1 06 1 07 1 08
Flight Arrivals Total Passengers Passengers per f light
Year ended by month
New Zealand Aviation Overview, Ministry of Tourism 7
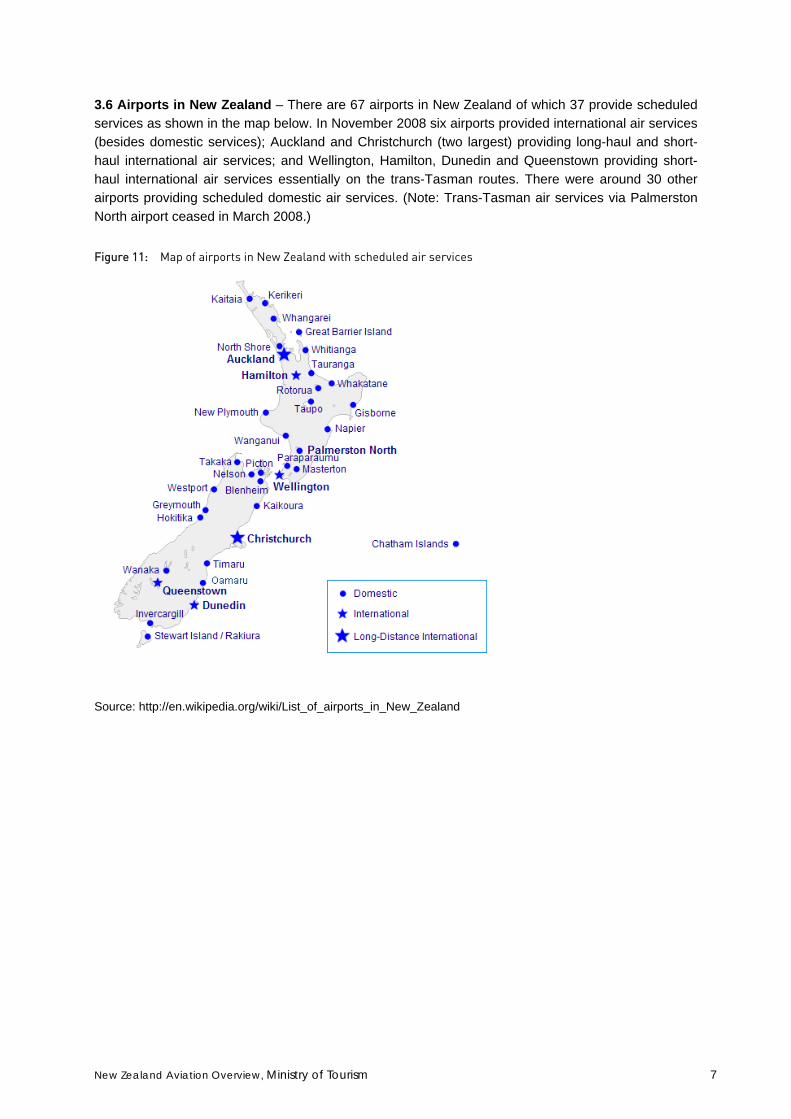
3.6 Airports in New Zealand – There are 67 airports in New Zealand of which 37 provide scheduled services as shown in the map below. In November 2008 six airports provided international air services (besides domestic services); Auckland and Christchurch (two largest) providing long-haul and short-haul international air services; and Wellington, Hamilton, Dunedin and Queenstown providing short-haul international air services essentially on the trans-Tasman routes. There were around 30 other airports providing scheduled domestic air services. (Note: Trans-Tasman air services via Palmerston North airport ceased in March 2008.)
Figure 11: Map of airports in New Zealand with scheduled air services Source: http://en.wikipedia.org/wiki/List_of_airports_in_New_Zealand
New Zealand Aviation Overview, Ministry of Tourism 8
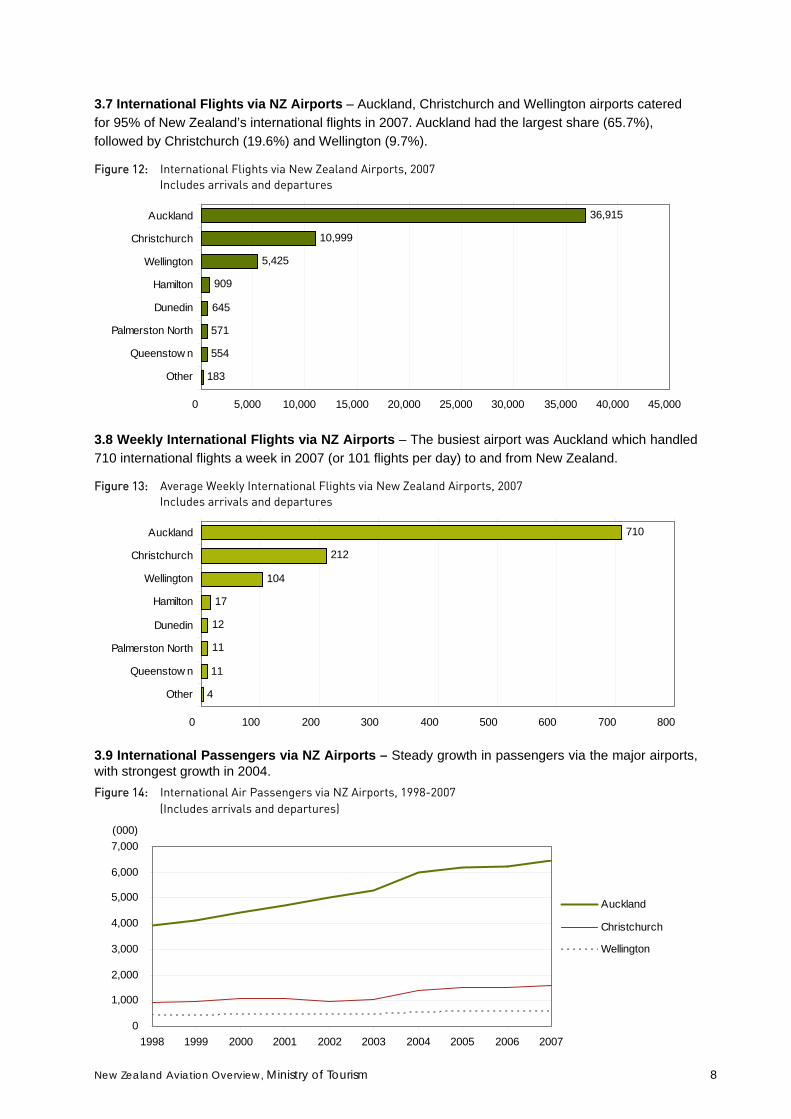
3.7 International Flights via NZ Airports – Auckland, Christchurch and Wellington airports catered for 95% of New Zealand’s international flights in 2007. Auckland had the largest share (65.7%), followed by Christchurch (19.6%) and Wellington (9.7%).
Figure 12: International Flights via New Zealand Airports, 2007 Includes arrivals and departures
36,915
10,999
5,425
909
645
571
554
183
0 5,000 10,000 15,000 20,000 25,000 30,000 35,000 40,000 45,000
Auckland
Christchurch
Wellington
Hamilton
Dunedin
Palmerston North
Queenstow n
Other
3.8 Weekly International Flights via NZ Airports – The busiest airport was Auckland which handled 710 international flights a week in 2007 (or 101 flights per day) to and from New Zealand.
Figure 13: Average Weekly International Flights via New Zealand Airports, 2007 Includes arrivals and departures
710
212
104
17
12
11
11
4
0 100 200 300 400 500 600 700 800
Auckland
Christchurch
Wellington
Hamilton
Dunedin
Palmerston North
Queenstow n
Other
3.9 International Passengers via NZ Airports – Steady growth in passengers via the major airports, with strongest growth in 2004. Figure 14: International Air Passengers via NZ Airports, 1998-2007
(Includes arrivals and departures)
0
1,000
2,000
3,000
4,000
5,000
6,000
7,000
1998 1999 2000 2001 2002 2003 2004 2005 2006 2007
Auckland
Christchurch
Wellington
(000)
New Zealand Aviation Overview, Ministry of Tourism 9
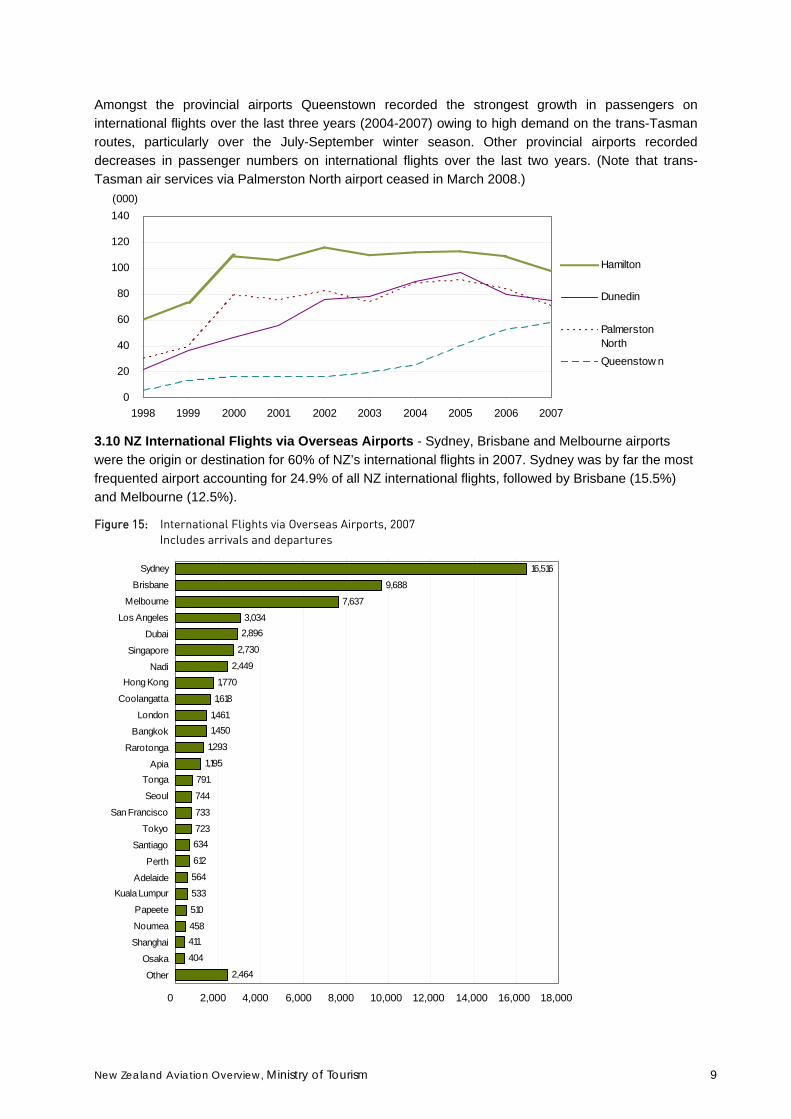
Amongst the provincial airports Queenstown recorded the strongest growth in passengers on international flights over the last three years (2004-2007) owing to high demand on the trans-Tasman routes, particularly over the July-September winter season. Other provincial airports recorded decreases in passenger numbers on international flights over the last two years. (Note that trans-Tasman air services via Palmerston North airport ceased in March 2008.)
0
20
40
60
80
100
120
140
1998 1999 2000 2001 2002 2003 2004 2005 2006 2007
Hamilton
Dunedin
PalmerstonNorthQueenstow n
(000)
3.10 NZ International Flights via Overseas Airports - Sydney, Brisbane and Melbourne airports were the origin or destination for 60% of NZ’s international flights in 2007. Sydney was by far the most frequented airport accounting for 24.9% of all NZ international flights, followed by Brisbane (15.5%) and Melbourne (12.5%).
Figure 15: International Flights via Overseas Airports, 2007 Includes arrivals and departures
16,516
9,688
7,637
3,034 2,896
2,730
2,449
1,770
1,618
1,461 1,450
1,293
1,195
791
744
733
723 634
612
564
533
510
458 411
404
2,464
0 2,000 4,000 6,000 8,000 10,000 12,000 14,000 16,000 18,000
Sydney
Brisbane
Melbourne
Los Angeles
Dubai
Singapore
NadiHong Kong
Coolangatta
London
Bangkok
Rarotonga
ApiaTonga
Seoul
San Francisco
Tokyo
Santiago
Perth
AdelaideKuala Lumpur
Papeete
Noumea
Shanghai
Osaka
Other
New Zealand Aviation Overview, Ministry of Tourism 10
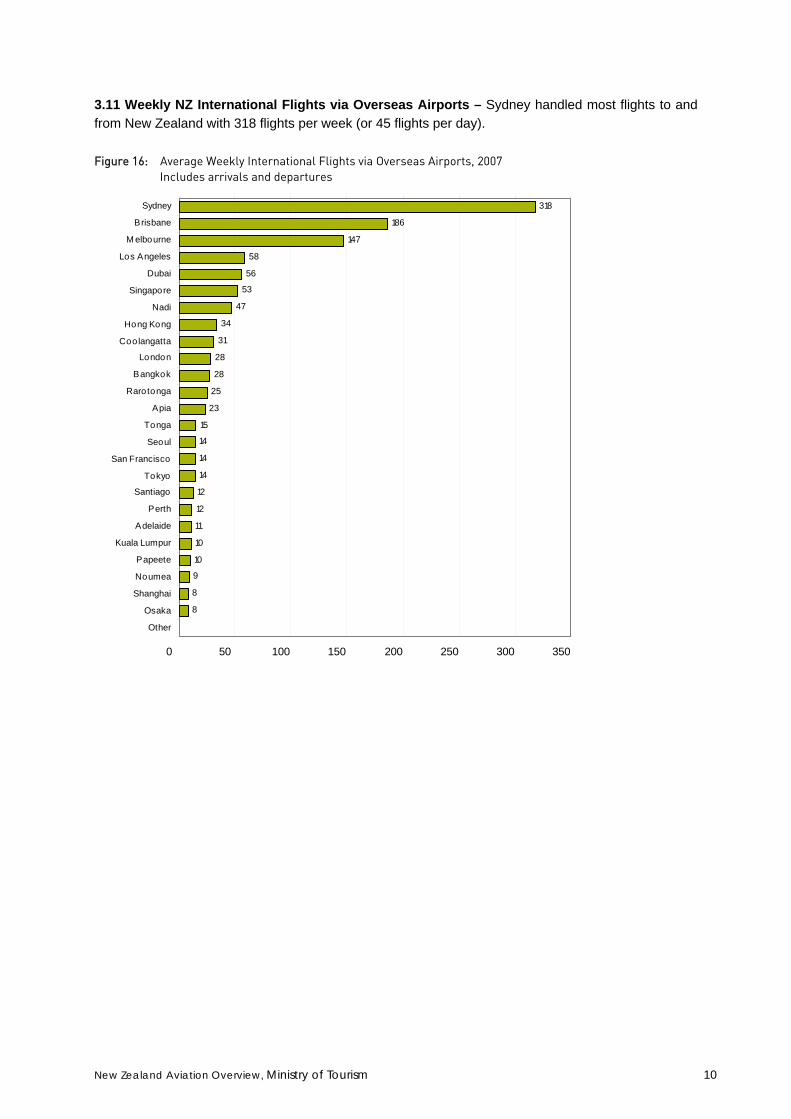
3.11 Weekly NZ International Flights via Overseas Airports – Sydney handled most flights to and from New Zealand with 318 flights per week (or 45 flights per day).
Figure 16: Average Weekly International Flights via Overseas Airports, 2007 Includes arrivals and departures
318
186
147
58
56
53
47
34
31
28
28
25
23
15
14
14
14
12
12
11
10
10
9
8
8
0 50 100 150 200 250 300 350
Sydney
Brisbane
M elbourne
Los Angeles
Dubai
Singapore
Nadi
Hong Kong
Coolangatta
London
Bangkok
Rarotonga
Apia
Tonga
Seoul
San Francisco
Tokyo
Santiago
Perth
Adelaide
Kuala Lumpur
Papeete
Noumea
Shanghai
Osaka
Other
New Zealand Aviation Overview, Ministry of Tourism 11
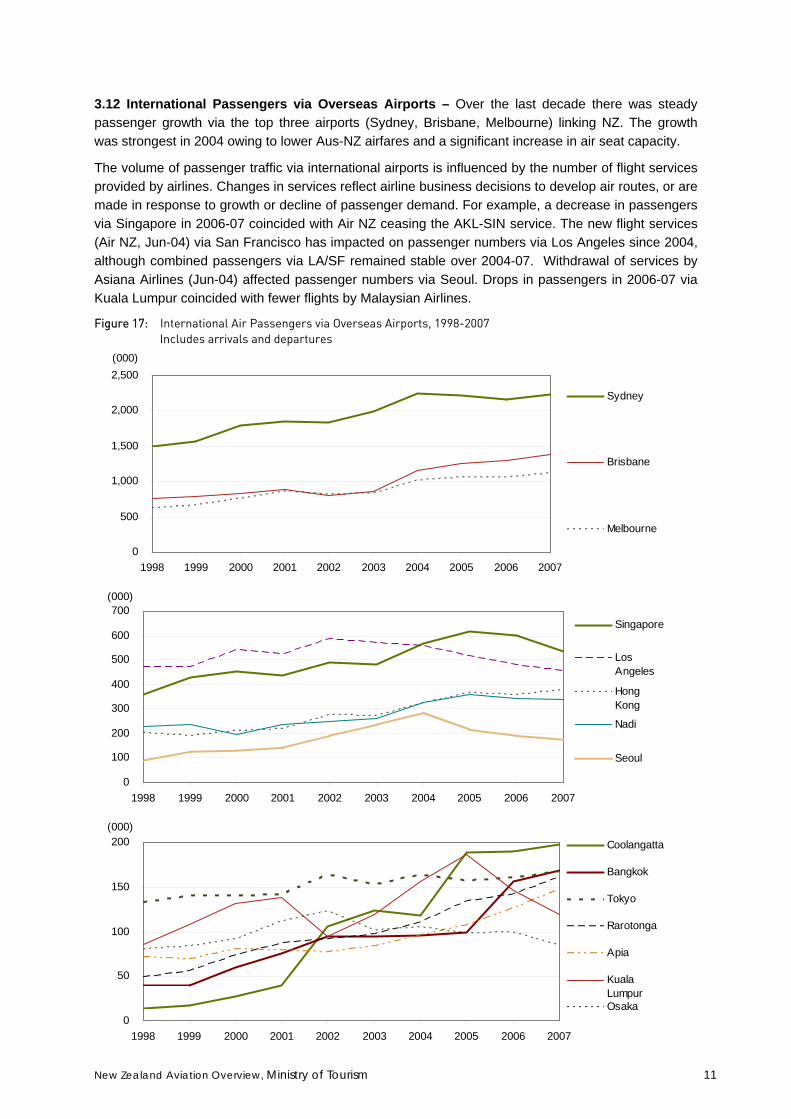
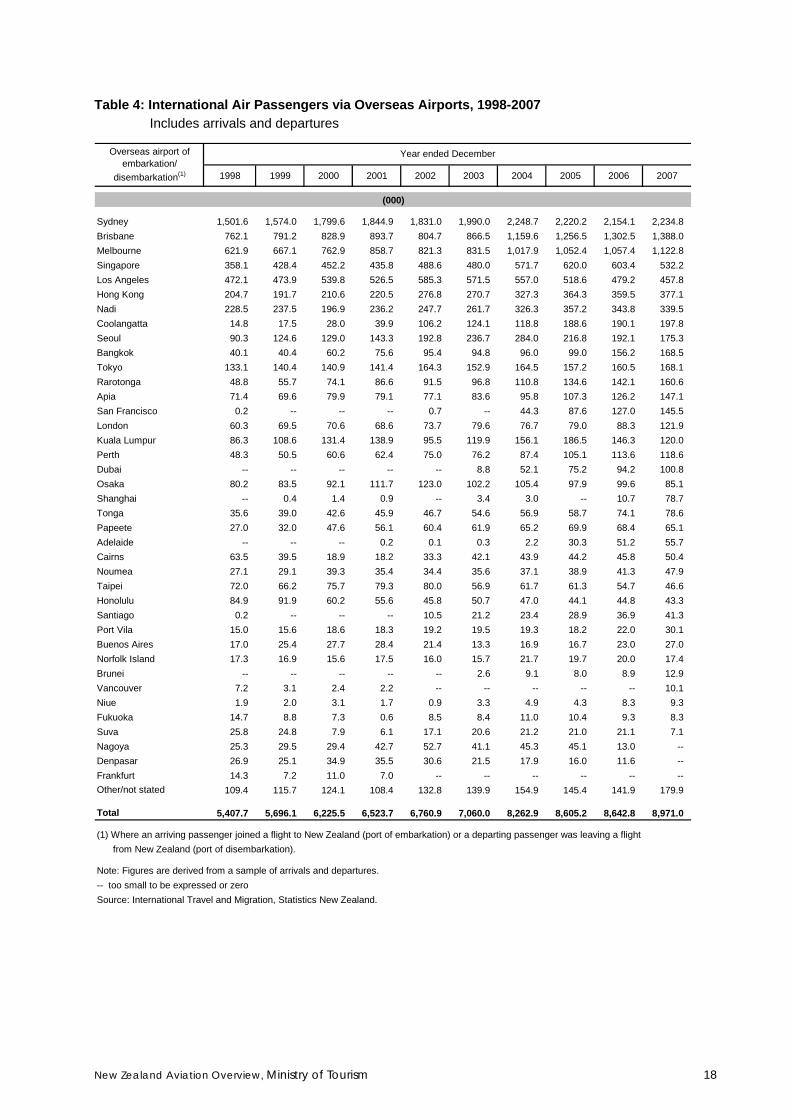
3.12 International Passengers via Overseas Airports – Over the last decade there was steady passenger growth via the top three airports (Sydney, Brisbane, Melbourne) linking NZ. The growth was strongest in 2004 owing to lower Aus-NZ airfares and a significant increase in air seat capacity.
The volume of passenger traffic via international airports is influenced by the number of flight services provided by airlines. Changes in services reflect airline business decisions to develop air routes, or are made in response to growth or decline of passenger demand. For example, a decrease in passengers via Singapore in 2006-07 coincided with Air NZ ceasing the AKL-SIN service. The new flight services (Air NZ, Jun-04) via San Francisco has impacted on passenger numbers via Los Angeles since 2004, although combined passengers via LA/SF remained stable over 2004-07. Withdrawal of services by Asiana Airlines (Jun-04) affected passenger numbers via Seoul. Drops in passengers in 2006-07 via Kuala Lumpur coincided with fewer flights by Malaysian Airlines.
Figure 17: International Air Passengers via Overseas Airports, 1998-2007 Includes arrivals and departures
0
500
1,000
1,500
2,000
2,500
1998 1999 2000 2001 2002 2003 2004 2005 2006 2007
Sydney
Brisbane
Melbourne
(000)
0
100
200
300
400
500
600
700
1998 1999 2000 2001 2002 2003 2004 2005 2006 2007
Singapore
LosAngeles
HongKong
Nadi
Seoul
(000)
0
50
100
150
200
1998 1999 2000 2001 2002 2003 2004 2005 2006 2007
Coolangatta
Bangkok
Tokyo
Rarotonga
Apia
KualaLumpurOsaka
(000)
New Zealand Aviation Overview, Ministry of Tourism 12
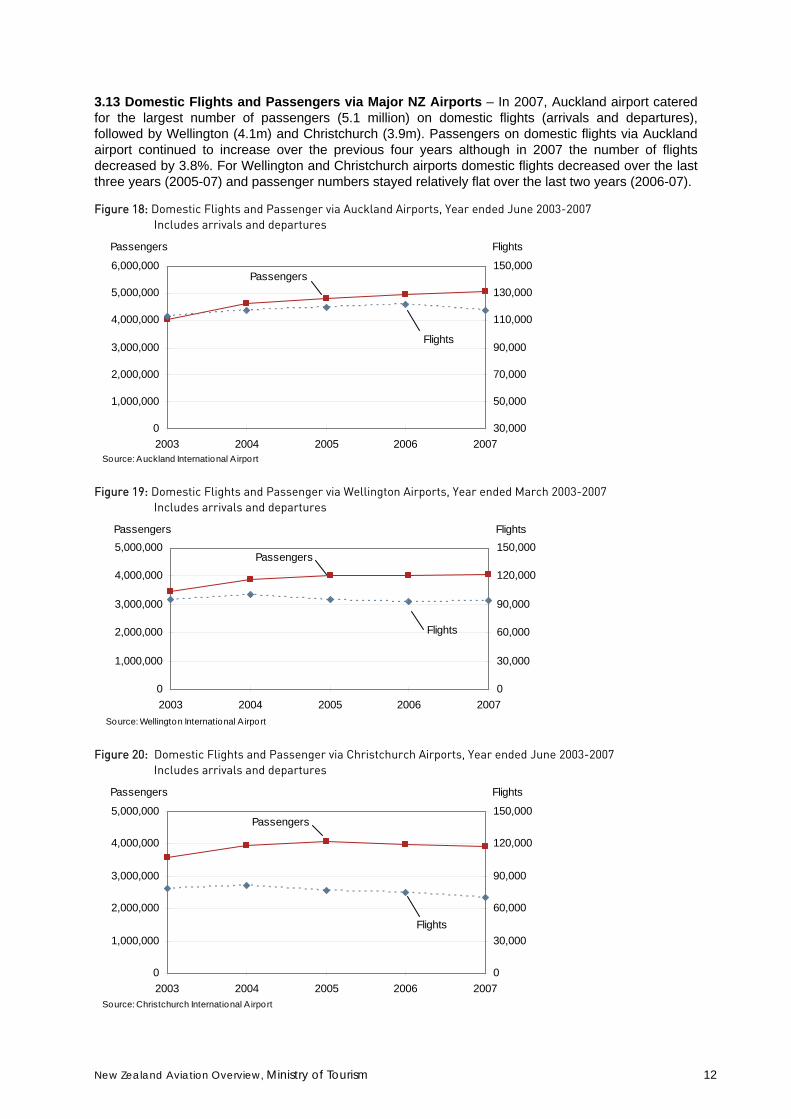
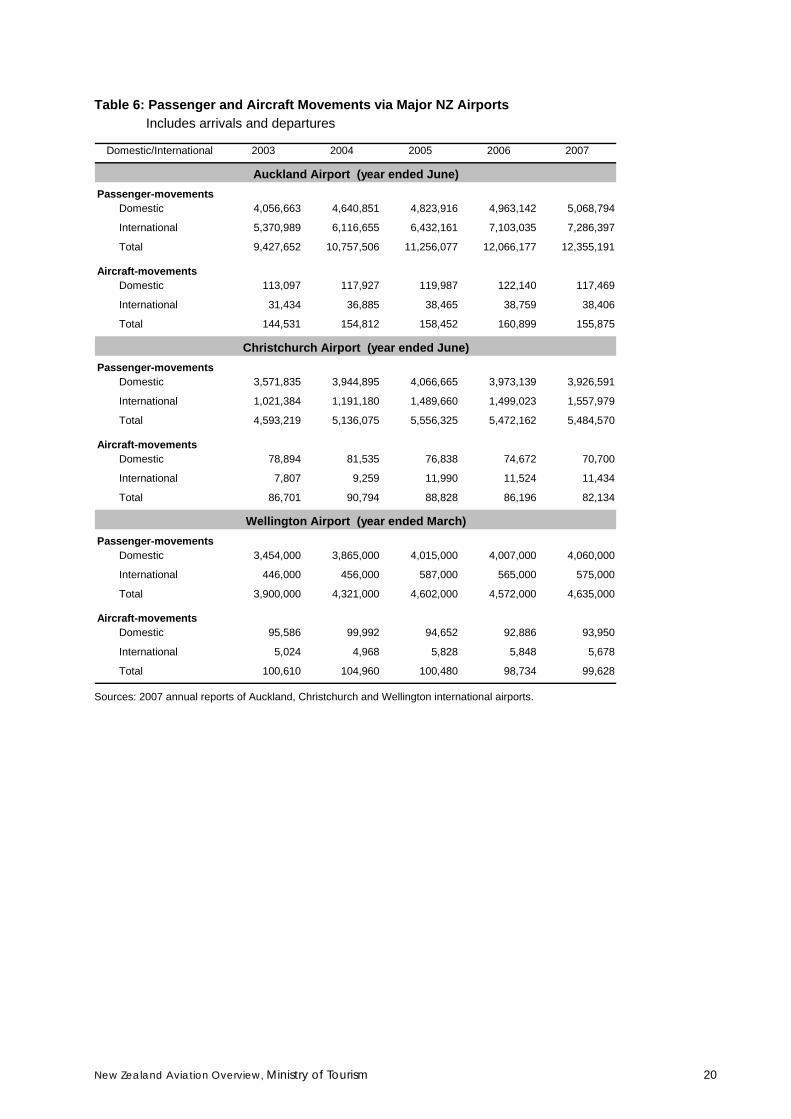
3.13 Domestic Flights and Passengers via Major NZ Airports – In 2007, Auckland airport catered for the largest number of passengers (5.1 million) on domestic flights (arrivals and departures), followed by Wellington (4.1m) and Christchurch (3.9m). Passengers on domestic flights via Auckland airport continued to increase over the previous four years although in 2007 the number of flights decreased by 3.8%. For Wellington and Christchurch airports domestic flights decreased over the last three years (2005-07) and passenger numbers stayed relatively flat over the last two years (2006-07).
Figure 18: Domestic Flights and Passenger via Auckland Airports, Year ended June 2003-2007 Includes arrivals and departures
0
1,000,000
2,000,000
3,000,000
4,000,000
5,000,000
6,000,000
2003 2004 2005 2006 200730,000
50,000
70,000
90,000
110,000
130,000
150,000
Passengers Flights
Flights
Passengers
Source: Auckland International Airport
Figure 19: Domestic Flights and Passenger via Wellington Airports, Year ended March 2003-2007 Includes arrivals and departures
0
1,000,000
2,000,000
3,000,000
4,000,000
5,000,000
2003 2004 2005 2006 20070
30,000
60,000
90,000
120,000
150,000Passengers Flights
Flights
Passengers
Source: Wellington International Airport
Figure 20: Domestic Flights and Passenger via Christchurch Airports, Year ended June 2003-2007 Includes arrivals and departures
0
1,000,000
2,000,000
3,000,000
4,000,000
5,000,000
2003 2004 2005 2006 20070
30,000
60,000
90,000
120,000
150,000
Passengers Flights
Flights
Passengers
Source: Christchurch International Airport

New Zealand Aviation Overview, Ministry of Tourism 13
3.14 International and Domestic Airfare Indices - International airfares purchased in New Zealand have generally increased at a similar pace to the overall Consumer Price Index (CPI) over the last decade, except in late 2003 when the introduction of low airfares on the trans-Tasman routes caused a structural shift in airfares, with a 21% drop between Jun-03 and Jun-04.
The cost of international air travel shows seasonal fluctuation, more so since 2004. In contrast, domestic airfares show no clear seasonal variation. The drops in 2003 and in 2008 appear to be influenced by competition, due to low trans-Tasman airfares and the entry of Pacific Blue airline respectively.
Over the four-year period (Jun-04-Jun-08), the average annual price increases was greater for domestic air transport (5.1%) than for international air transport (3.3%) and CPI (3.2%).
Figure 21: Quarterly Consumer Price Indices – International and Domestic Air Transport, and general CPI CPI (Base: Jun 2006 = 1000)
200
400
600
800
1000
1200
1400
1600
M ar-99
Sep-99
M ar-00
Sep-00
M ar-01
Sep-01
M ar-02
Sep-02
M ar-03
Sep-03
M ar-04
Sep-04
M ar-05
Sep-05
M ar-06
Sep-06
M ar-07
Sep-07
M ar-08
CPI All Groups Domestic air transport International air transport
QuarterSource: Consumers Price Index, Statistics NZ.
CPI (June 2006 Base = 1000)
3.15 Exchange Rates – The general exchange rate of the New Zealand dollar, expressed in Trade Weighted Index (TWI), was at a cyclical low during 2000-01. It appreciated by 35% over the period 2002-04 and remained at a relatively high level albeit a temporary drop in first half of 2006. However, since early 2008 TWI has been dropping by 17% between Feb-Oct 2008.
Figure 22: Exchange Rates – Trade Weighted Index (TWI) (Base: Jun 1979 = 100)
20
30
40
50
60
70
80
90
1 98 1 99 1 00 1 01 1 02 1 03 1 04 1 05 1 06 1 07 1 08Month -YearSource: Reserve Bank o f New Zealand

New Zealand Aviation Overview, Ministry of Tourism 14
Generally, a low New Zealand dollar stimulates inbound travel by overseas visitors but softens outbound travel by New Zealand residents. In contrast, a high New Zealand dollar softens inbound travel of some markets but stimulates outbound travel by New Zealand residents.
Exchange rate movement affects various markets with different degrees of elasticity and lag effects. For more details see the report “Exchange Rates and Tourism Relationships in New Zealand” which is available on the Ministry of Tourism research website:
http://www.tourismresearch.govt.nz/Data--Analysis/Research-projects-reports-and-studies/Research-Reports/
New Zealand Aviation Overview, Ministry of Tourism 15
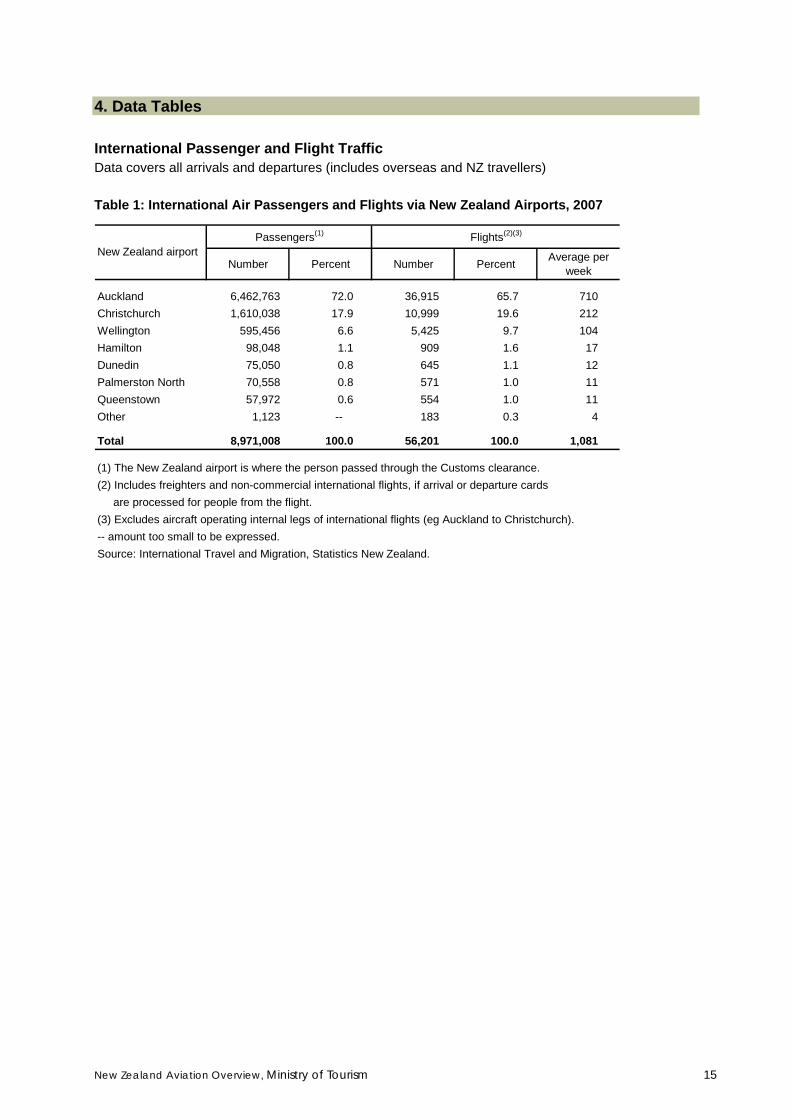
4. Data Tables International Passenger and Flight Traffic Data covers all arrivals and departures (includes overseas and NZ travellers) Table 1: International Air Passengers and Flights via New Zealand Airports, 2007
Number Percent Number Percent Average per week
Auckland 6,462,763 72.0 36,915 65.7 710 Christchurch 1,610,038 17.9 10,999 19.6 212 Wellington 595,456 6.6 5,425 9.7 104 Hamilton 98,048 1.1 909 1.6 17 Dunedin 75,050 0.8 645 1.1 12 Palmerston North 70,558 0.8 571 1.0 11 Queenstown 57,972 0.6 554 1.0 11 Other 1,123 -- 183 0.3 4
Total 8,971,008 100.0 56,201 100.0 1,081
(1) The New Zealand airport is where the person passed through the Customs clearance.(2) Includes freighters and non-commercial international flights, if arrival or departure cards are processed for people from the flight.(3) Excludes aircraft operating internal legs of international flights (eg Auckland to Christchurch).-- amount too small to be expressed.Source: International Travel and Migration, Statistics New Zealand.
New Zealand airportPassengers(1) Flights(2)(3)
New Zealand Aviation Overview, Ministry of Tourism 16
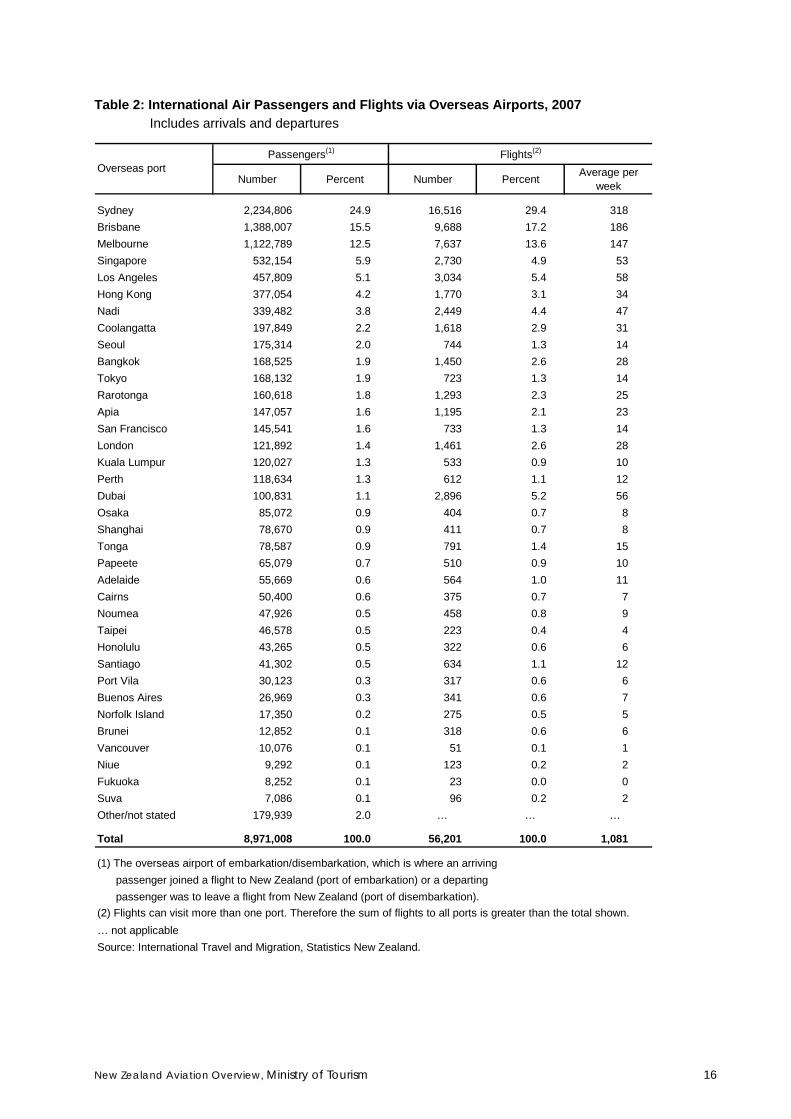
Table 2: International Air Passengers and Flights via Overseas Airports, 2007 Includes arrivals and departures
Number Percent Number Percent Average per week
Sydney 2,234,806 24.9 16,516 29.4 318 Brisbane 1,388,007 15.5 9,688 17.2 186 Melbourne 1,122,789 12.5 7,637 13.6 147 Singapore 532,154 5.9 2,730 4.9 53 Los Angeles 457,809 5.1 3,034 5.4 58 Hong Kong 377,054 4.2 1,770 3.1 34 Nadi 339,482 3.8 2,449 4.4 47 Coolangatta 197,849 2.2 1,618 2.9 31 Seoul 175,314 2.0 744 1.3 14 Bangkok 168,525 1.9 1,450 2.6 28 Tokyo 168,132 1.9 723 1.3 14 Rarotonga 160,618 1.8 1,293 2.3 25 Apia 147,057 1.6 1,195 2.1 23 San Francisco 145,541 1.6 733 1.3 14 London 121,892 1.4 1,461 2.6 28 Kuala Lumpur 120,027 1.3 533 0.9 10 Perth 118,634 1.3 612 1.1 12 Dubai 100,831 1.1 2,896 5.2 56 Osaka 85,072 0.9 404 0.7 8 Shanghai 78,670 0.9 411 0.7 8 Tonga 78,587 0.9 791 1.4 15 Papeete 65,079 0.7 510 0.9 10 Adelaide 55,669 0.6 564 1.0 11 Cairns 50,400 0.6 375 0.7 7 Noumea 47,926 0.5 458 0.8 9 Taipei 46,578 0.5 223 0.4 4 Honolulu 43,265 0.5 322 0.6 6 Santiago 41,302 0.5 634 1.1 12 Port Vila 30,123 0.3 317 0.6 6 Buenos Aires 26,969 0.3 341 0.6 7 Norfolk Island 17,350 0.2 275 0.5 5 Brunei 12,852 0.1 318 0.6 6 Vancouver 10,076 0.1 51 0.1 1 Niue 9,292 0.1 123 0.2 2 Fukuoka 8,252 0.1 23 0.0 0 Suva 7,086 0.1 96 0.2 2 Other/not stated 179,939 2.0 … … …
Total 8,971,008 100.0 56,201 100.0 1,081
(1) The overseas airport of embarkation/disembarkation, which is where an arriving passenger joined a flight to New Zealand (port of embarkation) or a departing passenger was to leave a flight from New Zealand (port of disembarkation).(2) Flights can visit more than one port. Therefore the sum of flights to all ports is greater than the total shown.… not applicableSource: International Travel and Migration, Statistics New Zealand.
Overseas portPassengers(1) Flights(2)
New Zealand Aviation Overview, Ministry of Tourism 17
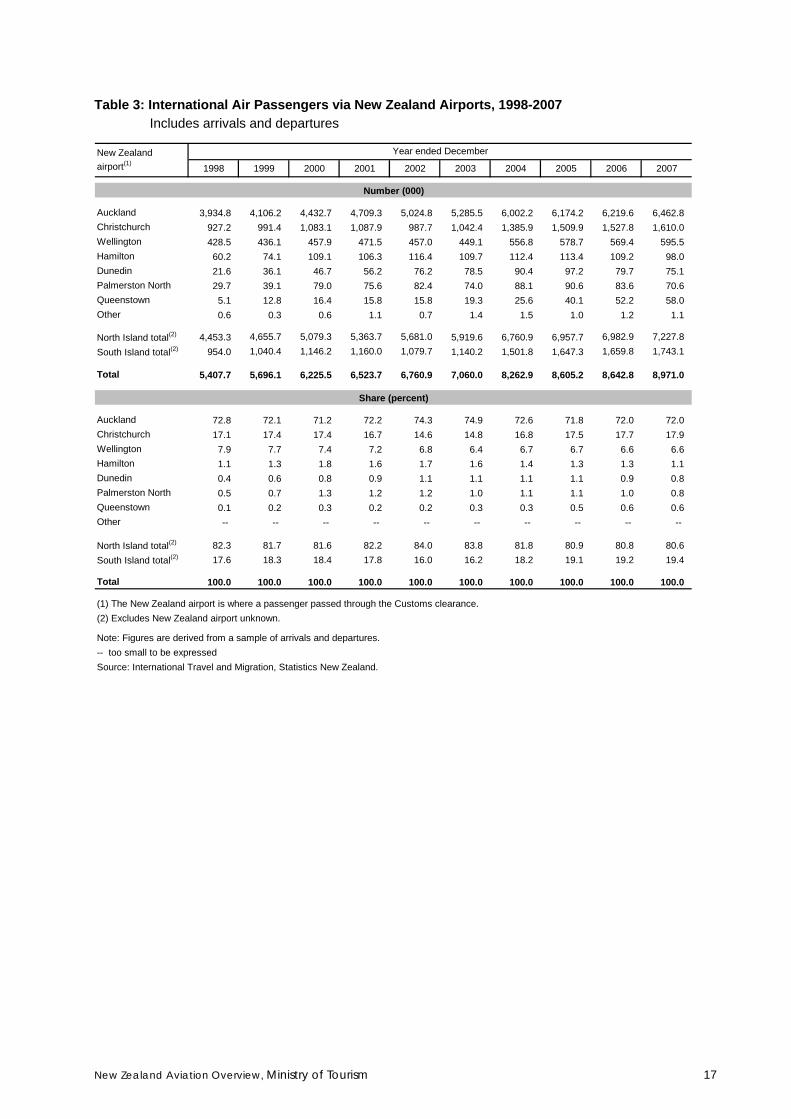
Table 3: International Air Passengers via New Zealand Airports, 1998-2007 Includes arrivals and departures
1998 1999 2000 2001 2002 2003 2004 2005 2006 2007
Auckland 3,934.8 4,106.2 4,432.7 4,709.3 5,024.8 5,285.5 6,002.2 6,174.2 6,219.6 6,462.8 Christchurch 927.2 991.4 1,083.1 1,087.9 987.7 1,042.4 1,385.9 1,509.9 1,527.8 1,610.0 Wellington 428.5 436.1 457.9 471.5 457.0 449.1 556.8 578.7 569.4 595.5 Hamilton 60.2 74.1 109.1 106.3 116.4 109.7 112.4 113.4 109.2 98.0 Dunedin 21.6 36.1 46.7 56.2 76.2 78.5 90.4 97.2 79.7 75.1 Palmerston North 29.7 39.1 79.0 75.6 82.4 74.0 88.1 90.6 83.6 70.6 Queenstown 5.1 12.8 16.4 15.8 15.8 19.3 25.6 40.1 52.2 58.0 Other 0.6 0.3 0.6 1.1 0.7 1.4 1.5 1.0 1.2 1.1
North Island total(2) 4,453.3 4,655.7 5,079.3 5,363.7 5,681.0 5,919.6 6,760.9 6,957.7 6,982.9 7,227.8 South Island total(2) 954.0 1,040.4 1,146.2 1,160.0 1,079.7 1,140.2 1,501.8 1,647.3 1,659.8 1,743.1
Total 5,407.7 5,696.1 6,225.5 6,523.7 6,760.9 7,060.0 8,262.9 8,605.2 8,642.8 8,971.0
Auckland 72.8 72.1 71.2 72.2 74.3 74.9 72.6 71.8 72.0 72.0 Christchurch 17.1 17.4 17.4 16.7 14.6 14.8 16.8 17.5 17.7 17.9 Wellington 7.9 7.7 7.4 7.2 6.8 6.4 6.7 6.7 6.6 6.6 Hamilton 1.1 1.3 1.8 1.6 1.7 1.6 1.4 1.3 1.3 1.1 Dunedin 0.4 0.6 0.8 0.9 1.1 1.1 1.1 1.1 0.9 0.8 Palmerston North 0.5 0.7 1.3 1.2 1.2 1.0 1.1 1.1 1.0 0.8 Queenstown 0.1 0.2 0.3 0.2 0.2 0.3 0.3 0.5 0.6 0.6 Other -- -- -- -- -- -- -- -- -- --
North Island total(2) 82.3 81.7 81.6 82.2 84.0 83.8 81.8 80.9 80.8 80.6 South Island total(2) 17.6 18.3 18.4 17.8 16.0 16.2 18.2 19.1 19.2 19.4
Total 100.0 100.0 100.0 100.0 100.0 100.0 100.0 100.0 100.0 100.0
(1) The New Zealand airport is where a passenger passed through the Customs clearance.(2) Excludes New Zealand airport unknown.
Note: Figures are derived from a sample of arrivals and departures.-- too small to be expressedSource: International Travel and Migration, Statistics New Zealand.
Share (percent)
Year ended December
Number (000)
New Zealand airport(1)
New Zealand Aviation Overview, Ministry of Tourism 18
Table 4: International Air Passengers via Overseas Airports, 1998-2007 Includes arrivals and departures
1998 1999 2000 2001 2002 2003 2004 2005 2006 2007
Sydney 1,501.6 1,574.0 1,799.6 1,844.9 1,831.0 1,990.0 2,248.7 2,220.2 2,154.1 2,234.8 Brisbane 762.1 791.2 828.9 893.7 804.7 866.5 1,159.6 1,256.5 1,302.5 1,388.0 Melbourne 621.9 667.1 762.9 858.7 821.3 831.5 1,017.9 1,052.4 1,057.4 1,122.8 Singapore 358.1 428.4 452.2 435.8 488.6 480.0 571.7 620.0 603.4 532.2 Los Angeles 472.1 473.9 539.8 526.5 585.3 571.5 557.0 518.6 479.2 457.8 Hong Kong 204.7 191.7 210.6 220.5 276.8 270.7 327.3 364.3 359.5 377.1 Nadi 228.5 237.5 196.9 236.2 247.7 261.7 326.3 357.2 343.8 339.5 Coolangatta 14.8 17.5 28.0 39.9 106.2 124.1 118.8 188.6 190.1 197.8 Seoul 90.3 124.6 129.0 143.3 192.8 236.7 284.0 216.8 192.1 175.3 Bangkok 40.1 40.4 60.2 75.6 95.4 94.8 96.0 99.0 156.2 168.5 Tokyo 133.1 140.4 140.9 141.4 164.3 152.9 164.5 157.2 160.5 168.1 Rarotonga 48.8 55.7 74.1 86.6 91.5 96.8 110.8 134.6 142.1 160.6 Apia 71.4 69.6 79.9 79.1 77.1 83.6 95.8 107.3 126.2 147.1 San Francisco 0.2 -- -- -- 0.7 -- 44.3 87.6 127.0 145.5 London 60.3 69.5 70.6 68.6 73.7 79.6 76.7 79.0 88.3 121.9 Kuala Lumpur 86.3 108.6 131.4 138.9 95.5 119.9 156.1 186.5 146.3 120.0 Perth 48.3 50.5 60.6 62.4 75.0 76.2 87.4 105.1 113.6 118.6 Dubai -- -- -- -- -- 8.8 52.1 75.2 94.2 100.8 Osaka 80.2 83.5 92.1 111.7 123.0 102.2 105.4 97.9 99.6 85.1 Shanghai -- 0.4 1.4 0.9 -- 3.4 3.0 -- 10.7 78.7 Tonga 35.6 39.0 42.6 45.9 46.7 54.6 56.9 58.7 74.1 78.6 Papeete 27.0 32.0 47.6 56.1 60.4 61.9 65.2 69.9 68.4 65.1 Adelaide -- -- -- 0.2 0.1 0.3 2.2 30.3 51.2 55.7 Cairns 63.5 39.5 18.9 18.2 33.3 42.1 43.9 44.2 45.8 50.4 Noumea 27.1 29.1 39.3 35.4 34.4 35.6 37.1 38.9 41.3 47.9 Taipei 72.0 66.2 75.7 79.3 80.0 56.9 61.7 61.3 54.7 46.6 Honolulu 84.9 91.9 60.2 55.6 45.8 50.7 47.0 44.1 44.8 43.3 Santiago 0.2 -- -- -- 10.5 21.2 23.4 28.9 36.9 41.3 Port Vila 15.0 15.6 18.6 18.3 19.2 19.5 19.3 18.2 22.0 30.1 Buenos Aires 17.0 25.4 27.7 28.4 21.4 13.3 16.9 16.7 23.0 27.0 Norfolk Island 17.3 16.9 15.6 17.5 16.0 15.7 21.7 19.7 20.0 17.4 Brunei -- -- -- -- -- 2.6 9.1 8.0 8.9 12.9 Vancouver 7.2 3.1 2.4 2.2 -- -- -- -- -- 10.1 Niue 1.9 2.0 3.1 1.7 0.9 3.3 4.9 4.3 8.3 9.3 Fukuoka 14.7 8.8 7.3 0.6 8.5 8.4 11.0 10.4 9.3 8.3 Suva 25.8 24.8 7.9 6.1 17.1 20.6 21.2 21.0 21.1 7.1 Nagoya 25.3 29.5 29.4 42.7 52.7 41.1 45.3 45.1 13.0 -- Denpasar 26.9 25.1 34.9 35.5 30.6 21.5 17.9 16.0 11.6 -- Frankfurt 14.3 7.2 11.0 7.0 -- -- -- -- -- -- Other/not stated 109.4 115.7 124.1 108.4 132.8 139.9 154.9 145.4 141.9 179.9
Total 5,407.7 5,696.1 6,225.5 6,523.7 6,760.9 7,060.0 8,262.9 8,605.2 8,642.8 8,971.0
(1) Where an arriving passenger joined a flight to New Zealand (port of embarkation) or a departing passenger was leaving a flight from New Zealand (port of disembarkation).
Note: Figures are derived from a sample of arrivals and departures.-- too small to be expressed or zeroSource: International Travel and Migration, Statistics New Zealand.
Year ended December
(000)
Overseas airport of embarkation/
disembarkation(1)
New Zealand Aviation Overview, Ministry of Tourism 19
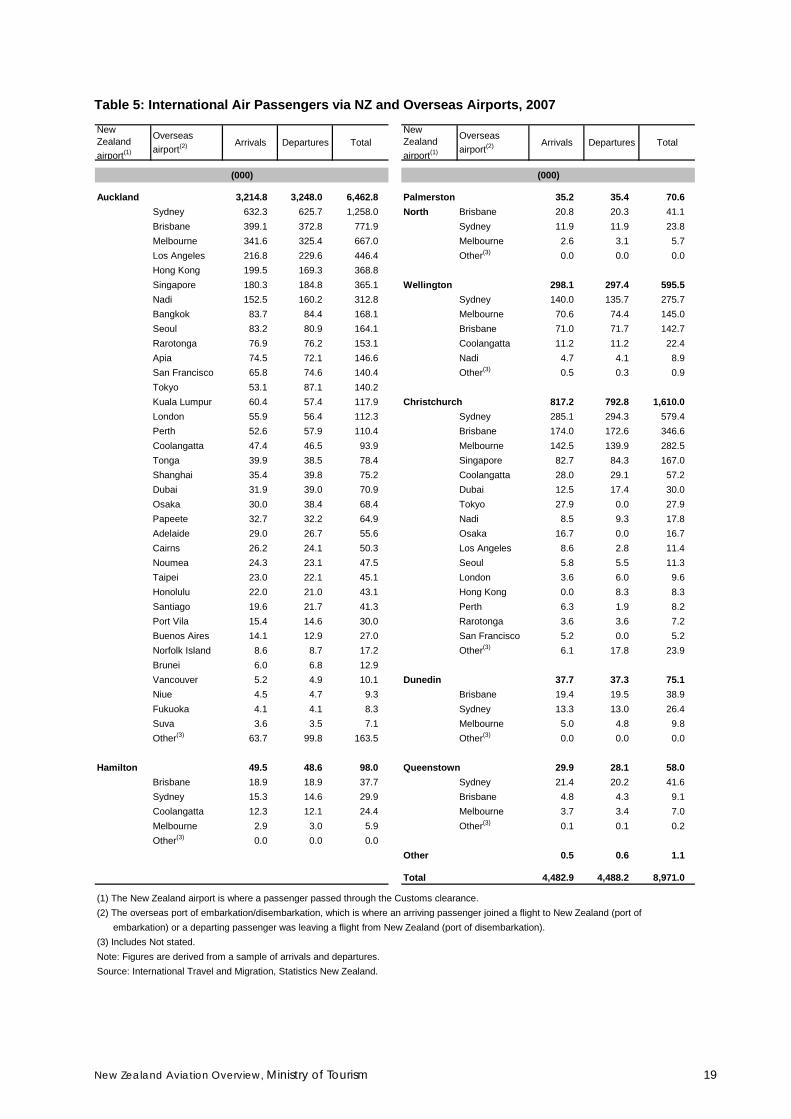
Table 5: International Air Passengers via NZ and Overseas Airports, 2007 New Zealand airport(1)
Overseas airport(2) Arrivals Departures Total
New Zealand airport(1)
Overseas airport(2) Arrivals Departures Total
(000) (000)
Auckland 3,214.8 3,248.0 6,462.8 Palmerston 35.2 35.4 70.6 Sydney 632.3 625.7 1,258.0 North Brisbane 20.8 20.3 41.1 Brisbane 399.1 372.8 771.9 Sydney 11.9 11.9 23.8 Melbourne 341.6 325.4 667.0 Melbourne 2.6 3.1 5.7 Los Angeles 216.8 229.6 446.4 Other(3) 0.0 0.0 0.0 Hong Kong 199.5 169.3 368.8 Singapore 180.3 184.8 365.1 Wellington 298.1 297.4 595.5 Nadi 152.5 160.2 312.8 Sydney 140.0 135.7 275.7 Bangkok 83.7 84.4 168.1 Melbourne 70.6 74.4 145.0 Seoul 83.2 80.9 164.1 Brisbane 71.0 71.7 142.7 Rarotonga 76.9 76.2 153.1 Coolangatta 11.2 11.2 22.4 Apia 74.5 72.1 146.6 Nadi 4.7 4.1 8.9 San Francisco 65.8 74.6 140.4 Other(3) 0.5 0.3 0.9 Tokyo 53.1 87.1 140.2 Kuala Lumpur 60.4 57.4 117.9 Christchurch 817.2 792.8 1,610.0 London 55.9 56.4 112.3 Sydney 285.1 294.3 579.4 Perth 52.6 57.9 110.4 Brisbane 174.0 172.6 346.6 Coolangatta 47.4 46.5 93.9 Melbourne 142.5 139.9 282.5 Tonga 39.9 38.5 78.4 Singapore 82.7 84.3 167.0 Shanghai 35.4 39.8 75.2 Coolangatta 28.0 29.1 57.2 Dubai 31.9 39.0 70.9 Dubai 12.5 17.4 30.0 Osaka 30.0 38.4 68.4 Tokyo 27.9 0.0 27.9 Papeete 32.7 32.2 64.9 Nadi 8.5 9.3 17.8 Adelaide 29.0 26.7 55.6 Osaka 16.7 0.0 16.7 Cairns 26.2 24.1 50.3 Los Angeles 8.6 2.8 11.4 Noumea 24.3 23.1 47.5 Seoul 5.8 5.5 11.3 Taipei 23.0 22.1 45.1 London 3.6 6.0 9.6 Honolulu 22.0 21.0 43.1 Hong Kong 0.0 8.3 8.3 Santiago 19.6 21.7 41.3 Perth 6.3 1.9 8.2 Port Vila 15.4 14.6 30.0 Rarotonga 3.6 3.6 7.2 Buenos Aires 14.1 12.9 27.0 San Francisco 5.2 0.0 5.2 Norfolk Island 8.6 8.7 17.2 Other(3) 6.1 17.8 23.9 Brunei 6.0 6.8 12.9 Vancouver 5.2 4.9 10.1 Dunedin 37.7 37.3 75.1 Niue 4.5 4.7 9.3 Brisbane 19.4 19.5 38.9 Fukuoka 4.1 4.1 8.3 Sydney 13.3 13.0 26.4 Suva 3.6 3.5 7.1 Melbourne 5.0 4.8 9.8 Other(3) 63.7 99.8 163.5 Other(3) 0.0 0.0 0.0
Hamilton 49.5 48.6 98.0 Queenstown 29.9 28.1 58.0 Brisbane 18.9 18.9 37.7 Sydney 21.4 20.2 41.6 Sydney 15.3 14.6 29.9 Brisbane 4.8 4.3 9.1 Coolangatta 12.3 12.1 24.4 Melbourne 3.7 3.4 7.0 Melbourne 2.9 3.0 5.9 Other(3) 0.1 0.1 0.2 Other(3) 0.0 0.0 0.0
Other 0.5 0.6 1.1
Total 4,482.9 4,488.2 8,971.0
(1) The New Zealand airport is where a passenger passed through the Customs clearance.(2) The overseas port of embarkation/disembarkation, which is where an arriving passenger joined a flight to New Zealand (port of embarkation) or a departing passenger was leaving a flight from New Zealand (port of disembarkation).(3) Includes Not stated.Note: Figures are derived from a sample of arrivals and departures.Source: International Travel and Migration, Statistics New Zealand.
New Zealand Aviation Overview, Ministry of Tourism 20
Table 6: Passenger and Aircraft Movements via Major NZ Airports Includes arrivals and departures
Domestic/International 2003 2004 2005 2006 2007
Passenger-movementsDomestic 4,056,663 4,640,851 4,823,916 4,963,142 5,068,794
International 5,370,989 6,116,655 6,432,161 7,103,035 7,286,397
Total 9,427,652 10,757,506 11,256,077 12,066,177 12,355,191
Aircraft-movementsDomestic 113,097 117,927 119,987 122,140 117,469
International 31,434 36,885 38,465 38,759 38,406
Total 144,531 154,812 158,452 160,899 155,875
Passenger-movementsDomestic 3,571,835 3,944,895 4,066,665 3,973,139 3,926,591
International 1,021,384 1,191,180 1,489,660 1,499,023 1,557,979
Total 4,593,219 5,136,075 5,556,325 5,472,162 5,484,570
Aircraft-movementsDomestic 78,894 81,535 76,838 74,672 70,700
International 7,807 9,259 11,990 11,524 11,434
Total 86,701 90,794 88,828 86,196 82,134
Passenger-movementsDomestic 3,454,000 3,865,000 4,015,000 4,007,000 4,060,000
International 446,000 456,000 587,000 565,000 575,000
Total 3,900,000 4,321,000 4,602,000 4,572,000 4,635,000
Aircraft-movementsDomestic 95,586 99,992 94,652 92,886 93,950
International 5,024 4,968 5,828 5,848 5,678
Total 100,610 104,960 100,480 98,734 99,628
Auckland Airport (year ended June)
Christchurch Airport (year ended June)
Wellington Airport (year ended March)
Sources: 2007 annual reports of Auckland, Christchurch and Wellington international airports.
New Zealand Aviation Overview, Ministry of Tourism 21
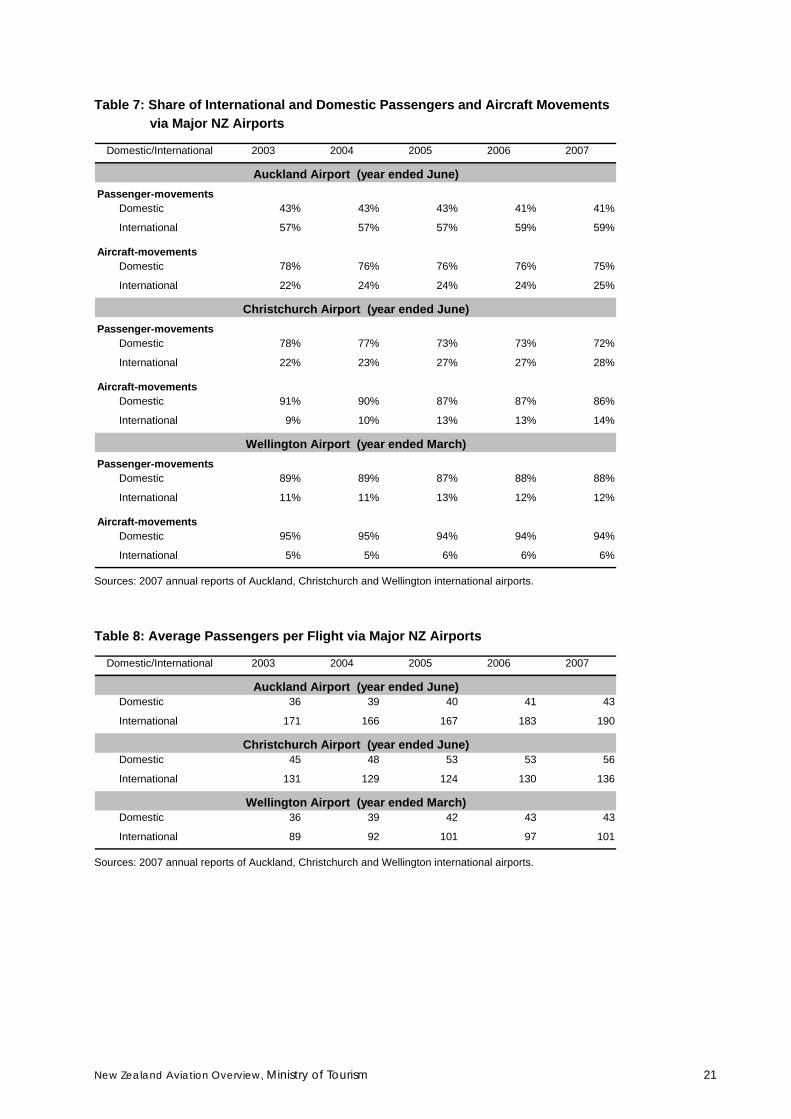
Table 7: Share of International and Domestic Passengers and Aircraft Movements via Major NZ Airports
Domestic/International 2003 2004 2005 2006 2007
Passenger-movementsDomestic 43% 43% 43% 41% 41%
International 57% 57% 57% 59% 59%
Aircraft-movementsDomestic 78% 76% 76% 76% 75%
International 22% 24% 24% 24% 25%
Passenger-movementsDomestic 78% 77% 73% 73% 72%
International 22% 23% 27% 27% 28%
Aircraft-movementsDomestic 91% 90% 87% 87% 86%
International 9% 10% 13% 13% 14%
Passenger-movementsDomestic 89% 89% 87% 88% 88%
International 11% 11% 13% 12% 12%
Aircraft-movementsDomestic 95% 95% 94% 94% 94%
International 5% 5% 6% 6% 6%
Christchurch Airport (year ended June)
Wellington Airport (year ended March)
Auckland Airport (year ended June)
Sources: 2007 annual reports of Auckland, Christchurch and Wellington international airports. Table 8: Average Passengers per Flight via Major NZ Airports
Domestic/International 2003 2004 2005 2006 2007
Domestic 36 39 40 41 43
International 171 166 167 183 190
Domestic 45 48 53 53 56
International 131 129 124 130 136
Domestic 36 39 42 43 43
International 89 92 101 97 101
Wellington Airport (year ended March)
Auckland Airport (year ended June)
Christchurch Airport (year ended June)
Sources: 2007 annual reports of Auckland, Christchurch and Wellington international airports.
New Zealand Aviation Overview, Ministry of Tourism 22
Appendices
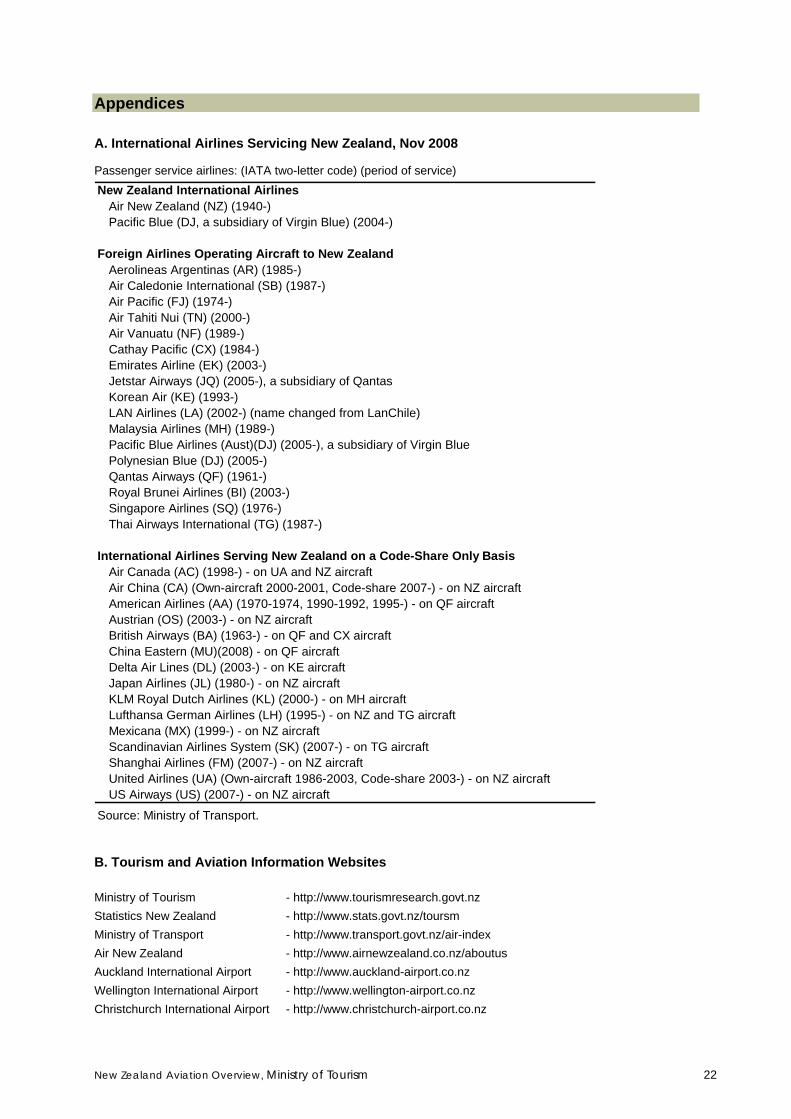
A. International Airlines Servicing New Zealand, Nov 2008
Passenger service airlines: (IATA two-letter code) (period of service)
New Zealand International Airlines Air New Zealand (NZ) (1940-)Pacific Blue (DJ, a subsidiary of Virgin Blue) (2004-)
Foreign Airlines Operating Aircraft to New Zealand Aerolineas Argentinas (AR) (1985-)Air Caledonie International (SB) (1987-) Air Pacific (FJ) (1974-) Air Tahiti Nui (TN) (2000-)Air Vanuatu (NF) (1989-) Cathay Pacific (CX) (1984-) Emirates Airline (EK) (2003-) Jetstar Airways (JQ) (2005-), a subsidiary of QantasKorean Air (KE) (1993-) LAN Airlines (LA) (2002-) (name changed from LanChile)Malaysia Airlines (MH) (1989-) Pacific Blue Airlines (Aust)(DJ) (2005-), a subsidiary of Virgin BluePolynesian Blue (DJ) (2005-) Qantas Airways (QF) (1961-) Royal Brunei Airlines (BI) (2003-)Singapore Airlines (SQ) (1976-)Thai Airways International (TG) (1987-)
International Airlines Serving New Zealand on a Code-Share Only Basis Air Canada (AC) (1998-) - on UA and NZ aircraftAir China (CA) (Own-aircraft 2000-2001, Code-share 2007-) - on NZ aircraftAmerican Airlines (AA) (1970-1974, 1990-1992, 1995-) - on QF aircraft Austrian (OS) (2003-) - on NZ aircraft British Airways (BA) (1963-) - on QF and CX aircraft China Eastern (MU)(2008) - on QF aircraft Delta Air Lines (DL) (2003-) - on KE aircraft Japan Airlines (JL) (1980-) - on NZ aircraftKLM Royal Dutch Airlines (KL) (2000-) - on MH aircraftLufthansa German Airlines (LH) (1995-) - on NZ and TG aircraftMexicana (MX) (1999-) - on NZ aircraftScandinavian Airlines System (SK) (2007-) - on TG aircraftShanghai Airlines (FM) (2007-) - on NZ aircraftUnited Airlines (UA) (Own-aircraft 1986-2003, Code-share 2003-) - on NZ aircraftUS Airways (US) (2007-) - on NZ aircraft
Source: Ministry of Transport.
B. Tourism and Aviation Information Websites
Ministry of Tourism - http://www.tourismresearch.govt.nz Statistics New Zealand - http://www.stats.govt.nz/toursm Ministry of Transport - http://www.transport.govt.nz/air-index Air New Zealand - http://www.airnewzealand.co.nz/aboutus Auckland International Airport - http://www.auckland-airport.co.nz Wellington International Airport - http://www.wellington-airport.co.nz Christchurch International Airport - http://www.christchurch-airport.co.nz