NYSE: CCC Investor Presentation
29
NYSE: CCC Investor Presentation June 1, 2020
Transcript of NYSE: CCC Investor Presentation

NYSE: CCCInvestor Presentation
June 1, 2020

Legal Disclaimer and Confidentiality Notice
This presentation and the information contained herein (including the verbal information and discussion related to these materials) is restricted and highly confidential and was prepared from information supplied byClarivate Plc (formerly known as Clarivate Analytics Plc, the “Company” or “Clarivate”), its advisors and outside sources, is informational in nature and is being furnished to you solely in connection with a potentialunderwritten public offering of the Company’s ordinary shares. You may not reproduce, distribute or disclose this information, in whole or in part, and you may not use any of the information for any purpose other thanevaluating such information in connection with a potential underwritten public offering of the Company’s ordinary shares. By accepting delivery of this information, you expressly agree to the foregoing and expressly agreeto maintain the information in confidence. No representation or warranty, express or implied, is made by the Company or any of its affiliates, or advisors or any underwriters involved in this offering as to the accuracy orcompleteness of the information contained herein or of any information derived from this analysis, and nothing contained herein or derived from this analysis is, or shall be relied upon as, a promise or representation,whether as to past or future performance.
Forward-Looking Statements
The accompanying materials contain certain forward-looking statements regarding Clarivate Plc, its financial condition and its results of operations, anticipated synergies and other future expectations. Forward-lookingstatements should not be read as a guarantee of future performance or results, and will not necessarily be accurate indications of the times at, or by which, if at all, such performance or results will be achieved. All of thesestatements particularly those relating to expected synergies and expected cost savings from the acquisition of DRG (as defined herein) are based on estimates and assumptions prepared by the Company’s management asof the date of this presentation that, although the Company believes to be reasonable as of such date, are inherently uncertain. These statements involve risks and uncertainties, including, but not limited to, statementsregarding our intentions, beliefs or current expectations concerning, among other things, the Company’s results of operations, financial condition, liquidity, prospects, growth, strategies and the markets in which theCompany operates. Important factors that could cause our actual results and financial condition to differ materially from those indicated in the forward-looking statements are more fully discussed under the caption “RiskFactors” in the prospectus Clarivate filed with the U.S. Securities and Exchange Commission (“SEC”) on June 1, 2020 (the “Prospectus”), along with our other filings with the SEC. However, those factors should not beconsidered to be a complete statement of all potential risks and uncertainties. Forward-looking statements speak only as of the date the statements are made. The Company undertakes no obligation to update or reviseany of the forward-looking statements contained herein, whether as a result of new information, future events or otherwise. If the Company does update one or more forward-looking statements, no inference should bedrawn that the Company will make any additional updates with respect thereto or with respect to any other forward-looking statements. The consolidated financial information presented herein was based on certainassumptions and estimates, and may not necessarily reflect the results of operations that would have occurred if the Company had been a separate, standalone entity during the periods presented or the Company’s futureresults of operations. In addition, the estimated costs and anticipated cost savings presented herein, are based on management’s expectations, beliefs and projections, are subject to change and there can be no assurancethat such expectations, beliefs or projections will be achieved.
Non-GAAP Financial Measures
This presentation contains financial measures which have not been calculated in accordance with United States generally accepted accounting principles (“GAAP”), including Adjusted Revenues, Adjusted EBITDA, AdjustedEBITDA Margin, and Standalone Adjusted EBITDA, because they are a basis upon which our management assesses our performance and we believe they reflect the underlying trends and indicators of our business.Although we believe these measures may be useful for investors for the same reasons, these financial measures should not be considered as an alternative to GAAP financial measures as a measure of the Company’sfinancial condition, profitability and performance or liquidity. In addition, these financial measures may not be comparable to similar measures used by other companies. At the Appendix to this presentation, we providefurther descriptions of these non-GAAP measures and reconciliations of these non-GAAP measures to the corresponding most closely related GAAP measures.
Required Reported Data
We are required to report Standalone Adjusted EBITDA, which is substantially similar to Consolidated EBITDA and EBITDA as such terms are defined under our credit agreement, and the indenture governing our seniorsecured notes due 2026, respectively, pursuant to the reporting covenants contained in such agreements. In addition, management of the Company uses Standalone Adjusted EBITDA to assess compliance with variousincurrence-based covenants in these agreements.
2

3
Key Management Presenters
Jerre Stead
Executive Chairman &Chief Executive Officer
Richard Hanks
Chief Financial Officer
Mark Donohue
VP, Investor Relations

Equity offering summary
4
(1) Share price of $22.89 as of 5/29/2020.
Summary terms
Issuer (exchange / ticker) Clarivate Plc (NYSE: CCC)
Offering size 40.0mm shares (14.0mm primary and 26.0mm secondary shares) or $916mm (based on current share price(1))
Greenshoe 6.0mm shares (15%) (100% Secondary)
Lock-up 60 days
Joint Bookrunners Citigroup and Goldman Sachs
Expected pricing date June 3, 2020
Use of proceedsOnex and Baring Private Equity Asia (“BPEA”) to partially sell their existing stake, additional participation by other shareholders. Primary proceeds used for general corporate purposes

Business Overview

Clarivate has world-leading assets serving large and stable end-markets
• Leading provider of intellectual property and scientific information, analytical tools & services
• Products support customers’ critical decisions in discovery, protection and commercialization of ideas and brands
• Global, diversified customer base
• Portfolio of curated proprietary databases deeply embedded in customers’ workflows
• Solutions to clients on digital basis and consumed anywhere
• Experienced management team with proven track record
• ~ 5,350 colleagues across 30+ countries6
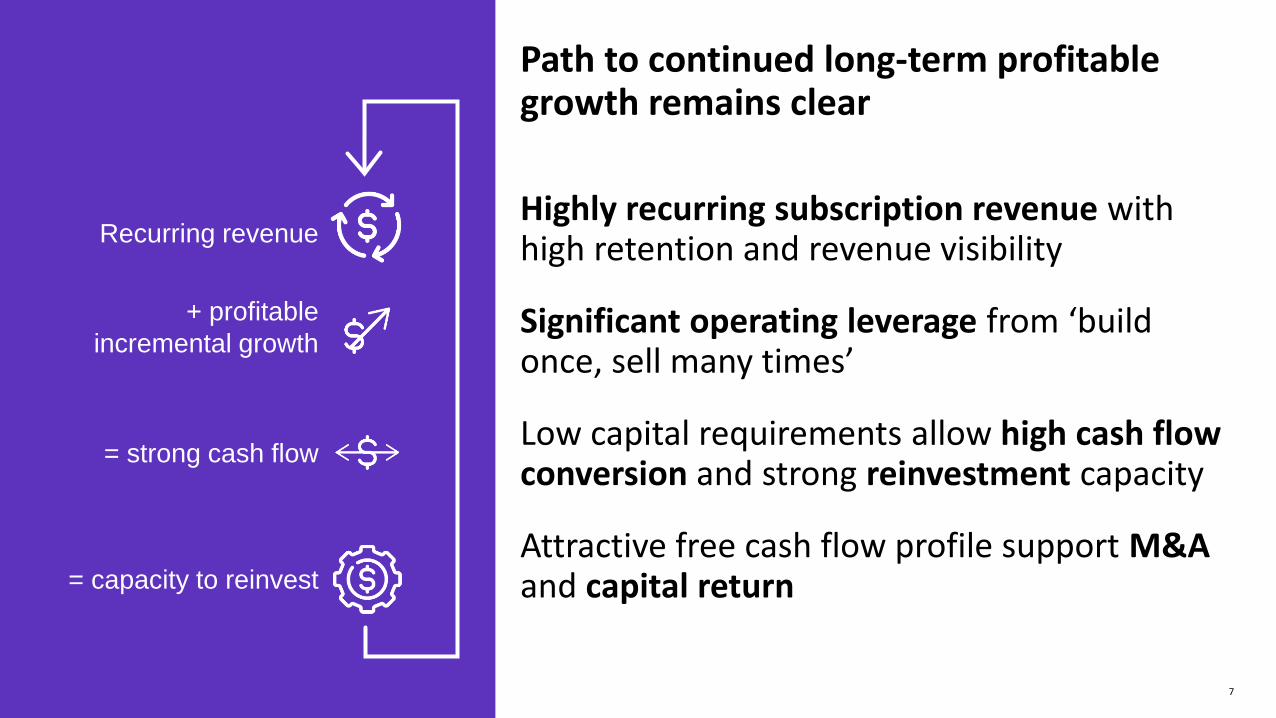
Path to continued long-term profitable growth remains clear
Highly recurring subscription revenue with high retention and revenue visibility
Significant operating leverage from ‘build once, sell many times’
Low capital requirements allow high cash flow conversion and strong reinvestment capacity
Attractive free cash flow profile support M&Aand capital return
= strong cash flow
= capacity to reinvest
+ profitable
incremental growth
Recurring revenue
7

A professor planning a research program accesses Web of Science {"WOS"} to evaluate the current state of research in her discipline, identifying trends within highly regarded and relevant academic journals
A university provost evaluating her university's chemistry department accesses lnCites to measure the strength of theuniversity's research output and benchmark it against comparable institutions
An analyst at a pharmaceutical firm evaluating several potential R&D programs will access Cortellis database to assesscompetitive products in the drug development pipeline, review clinical trial data and summarize regulatory information
An employee developing a new product or idea (e.g., a chemical engineer or a product designer) will access the Derwent lnnovation database of patents to evaluate the novelty and determine the patentability of the new product or idea
An attorney helps clear a trademark for a customer. First, they request a curated report from CompuMark Search toensure the availability of the proposed trademark; then they subscribe to CompuMark Watch's trademark watchingservices to ensure that none of the trademarks are infringedupon
An inhouse attorney can ensure the company’s domains are protected from security threats by using best-of-breed technology, security and expertise, and make smart registration decisions, maximize portfolio values and rein in costs
Innovation
Domain management
8
An employee at a pharmaceutical firm evaluating the most effective manner to bring a newly developed drug tomarket uses DRG’s data-driven resources and analytics solutions to better understand critical commercial challenges.
High quality products embedded with customer workflows

We have four strategic goals that will move us toward success
Continue to improve colleague engagement score
Further increase customer delight score
Focus on strong top-and-bottom-line growth
Provide superior investor returns
Sustainability
9

10
May ‘20 2019
Information & insights 90 85
Quality of products & services 85 86
Easy to do business with 59 55
Overall customer delight 79 76
Customer feedback tells us:• Insight into decision-making critical
• Products highly valued
• Offerings perceived as best-in-class
• Big opportunity to enhance user experience
Overall customer
delight = 79(Best Practice is 82)
2020 goal:
78
Customer Delight Surveys was conducted in May 2020 (2,500+ participants) and in June/July and October 2019 (10,000+ participants) by CustomerFirstNow. 10
Improving customer delight scorecard reflects our commitment on delivering high-value to our customers

Our recent colleague engagement survey had a response rate of 91%, up 10% from 2019
Engagement score = 76
2019 = 69 (Benchmark Average is
72)
2020 goal:
74
Company’s response to COVID-19 scored 93% favorable11

Technology has a very important role at Clarivate
Customer and company growth
Optimizingday-to-day
operations in a cost-effective
way
Protectingour systems, data and IP
Enablingproduct
innovation
Providing solutions to
drive value for our customers
People Process Technology
12

Revenue is balanced by category, offering steady, long-term growth potential
Last Twelve Months Ended March 31, 2020 Revenue by Category (1)
Americas48%
13
Americas
48%
EMEA
28%
APAC24%
Subscription
82%
Transactional and
Consulting Services18%
Science Product Group58%
Intellectual Property Product Group
42%
By product group By type By geography
(1) Revenue figures inclusive of DRG acquired in February 2020, Darts-ip acquired in November 2019 and excludes the divestiture of MarkMonitor Brand Protection, Antipiracy and Antifraud products disposed of on January 1, 2020.

$706 $710 $718 $716
$736 $744 $750
$820
Q2 '18 Q3 '18 Q4 '18 Q1 '19 Q2 '19 Q3 '19 Q4 '19 Q1 '20
Historical Annualized Contract Value (ACV)(1)
+$104mm YoY+15% constant F/X
Ongoing ACV +3%
(1) Annualized Contract Value (“ACV”) refers to the annualized value for a 12-month period following a given date of all subscription-based client license agreements, assuming that all license agreements that come up for renewal during that period are renewed. ACV is reported in constant currency.
14
• Q1 ’20 includes the acquisition of Decision Resources Group (“DRG”) completed on February 28, 2020• All periods exclude divested MarkMonitor Brand Protection product lines at actual F/X; divested on January 1, 2020
($ in millions)

Outward focus on customers expected to drive organic revenue
15
Improve product UI
and UX
Retention rate
Pricing
Inside sales and
global business centers
Consulting
Sales force expansion

Streamlining initiatives will help us to work smarter, scale quickly to achieve margin expansion
16
Headcount optimization
Facilities rationalization
Insource application
development Re-platform with AI and
machine learning Vendor
rationalization renegotiation

Efficiently Managing Cost Structure and Freeing Up Resources
17
Approximately $110 million in expected permanent cost reductions
($ in millions) Total Savings Permanent Savings Timing
New COVID Related $30 million $5 million Q1 – Q4 2020
Costs Savings 2019(1) $70-$75 million $70-$75 million$45 million in 2020; $70-75 million
run-rate exiting Q1 2021
DRG Synergies(2) $30 million $30 million$10 million in 2020; $30 million
run-rate within 18 months of close
Total Cost Savings $130-$135 million $105-$110 million
(1) See “Risk Factors – We may be unable to achieve some or all of the operational cost improvements and other benefits that we expect to realize” included in Clarivate’s registration statement on Form S-1 dated June 1, 2020.
(2) Decision Resources Group (“DRG”) acquisition completed February 28, 2020.
• Investing in:
– Business transformation
– Ongoing product and platform enhancements
• Cash allocated to reducing leverage
• Cash allocated to accretive M&A
– Tuck-in acquisitions focused on proprietary databases servicing global markets
– Scaled, well-timed strategic acquisitions
Clarivate philosophy – capital allocation and return
18

• Business model with strong financial attributes
• Fundamental assets are unmatched anywhere
• Embedded in customers’ critical core workflows
• Strong, purpose-based culture in place
• Multiple initiatives enabling us to continue to focus, simplify and execute
• Critical levers to drive growth and profitability
As we build on our solid foundation, there are very large opportunities ahead
The Clarivate way
19

Financial & Strategic Highlights

21
Enhanced Product Portfolio
Efficiently Managing Business
• Completed acquisition of Decision Resources Group (“DRG”) in February 2020; initiated integration activities
• Completed integration of Darts-ip within the CompuMark product suite• Completed divestiture of brand protection, anti piracy and anti fraud products• Science Group: Launched Cortellis Drug Discovery Intelligence, released Cortellis Generics
Intelligence, the new version of Newport• IP Group: Launched improved Derwent Patents database platform, SequenceBase
functionality integrated into Derwent
• Meeting or exceeding productivity and service level agreements despite COVID-19 customer workflow disruptions
• Implemented $30 million of cost savings initiatives to offset potential effect of COVID-19• Delivering savings form existing $70-75 million cost savings program; $45 million in 2020• Capturing expected DRG cost synergies of $30 million run-rate within 18 months of the
acquisition• Repaid $65 million outstanding revolver balance in Q1 2020 • Significant resources of $308 million cash and untapped revolver of $250 million to reinvest
in growth as of 3/31/2020
Well-positioned business model to weather current environment
Q1 Highlights

Q1 ResultsRevenue growth driven by acquisitions, new business and pricing; excluding divestitures adjusted revenue increased 11%(1)
$234 $241
Q1 '19 Q1 '20
$192 $193
$42 $49
$234 $242
Q1 '19 Q1 '20
$59
$78
Q1 '19 Q1 '20
Reported Revenue Adjusted Revenue(1)
+3% actual f/x+4% constant f/x
+4% actual f/x+4% constant f/x
Adjusted EBITDA(1)
Adjusted EBITDA Margin(2) 32.2% up
690 basis points
Subscription+slightly
Transactional+18% +32%
Excluding Divested Products at Constant F/X(3)
Adjusted revenue(1) actual f/x +10%
Adjusted revenue(1) constant f/x +11%
Adjusted subscription revenue(1) 8%
Adjusted transactional revenue(1) 21%
Note: Constant currency is calculated by converting the non-U.S. dollar income statement balances for the most current year to U.S. dollars by applying the average exchange rates of the preceding year.(1) See the Appendix for a reconciliation of GAAP to Non-GAAP measures.(2) Adjusted EBITDA Margin equals Adjusted EBITDA divided by Adjusted Revenue. See the Appendix for a reconciliation of GAAP to Non-GAAP measures.(3) In November 2019, Clarivate announced an agreement to sell the MarkMonitor brand protection, antipiracy and antifraud products, and completed such divestiture on January 1, 2020. Clarivate retained
the MarkMonitor Domain Management business.
($ in millions, actual F/X)
22

23
Business Model to Weather Current Environment
• “Must-have” products and services focused on B2B markets with unique content
• Sell into durable end markets including government, research institutions and life sciences
• Solutions to clients on digital basis and consumed anywhere
• Highly resilient with 80% recurring / re-occurring revenue streams
• Strong revenue retention rates
• Low levels of capital intensity and cash taxes

24
Appendix
25
Presentation of certain non-GAAP financial measuresThis presentation contains financial measures which have not been calculated in accordance with GAAP, including Adjusted Revenues and Adjusted EBITDA, because they are a basis upon which our management assesses our performance and we believe they reflectthe underlining trends and indicators of our business.
Adjusted Revenues
Adjusted Revenues excludes the impact of the deferred revenues purchase accounting adjustment (primarily recorded in connection with recent acquisitions). We present these measures because we believe they are useful to readers to better understand theunderlying trends in our operations.
Our presentation of Adjusted Revenues is presented for informational purposes only and is not necessarily indicative of our future results. You should compensate for these limitations by relying primarily on our GAAP results and only using Adjusted Revenues forsupplementary analysis.
Adjusted EBITDA
Adjusted EBITDA is calculated using net (loss) income before provision for income taxes, depreciation and amortization and interest income and expense adjusted to exclude acquisition or disposal-related transaction costs (such costs include net income fromcontinuing operations before provision for income taxes, depreciation and amortization and interest income),stock-based compensation, unrealized foreign currency gains/(losses), transition services agreement costs entered into with Thomson Reuters in 2016("Transition Services Agreement"), separation and integration costs, transformational and restructuring expenses, acquisition-related adjustments to deferred revenues, non-cash income/(loss) on equity and cost method investments, non-operating income or expense,the impact of certain non-cash and other items that are included in net income for the period that the Company does not consider indicative of its ongoing operating performance, and certain unusual items impacting results in a particular period.
In future periods, the Company will need to make additional capital expenditures in order to replicate capital expenditures associated with previously shared services on a stand-alone basis. You are encouraged to evaluate these adjustments and the reasons theCompany considers them appropriate for supplemental analysis. These measures are not measurements of the Company’s financial performance under GAAP and should not be considered in isolation or as alternatives to net income, net cash flows provided byoperating activities, total net cash flows or any other performance measures derived in accordance with GAAP or as alternatives to net cash flows from operating activities or total net cash flows as measures of the Company’s liquidity.
Reduction of ongoing standalone and Transition Services Agreement costs have been, and are expected to continue to be, a component of the Company’s strategy as it finalizes its transition to a standalone company following the 2016 Transaction (as defined herein).
Certain of the adjustments included to arrive at Adjusted EBITDA are related to the Company’s transition to an independent company. In evaluating Adjusted EBITDA you should be aware that in the future the Company may incur expenses that are the same as or similarto some of the included adjustments. The Company’s presentation of Adjusted EBITDA should not be construed as an inference that the Company’s future results will be unaffected by any of the adjusted items, or that the Company’s projections and estimates will berealized in their entirety or at all.
The use of Adjusted EBITDA instead of GAAP measures has limitations as an analytical tool, and you should not consider Adjusted EBITDA in isolation, or as a substitute for analysis of the Company’s results of operations and operating cash flows as reported under GAAP.For example, Adjusted EBITDA does not reflect:
• the Company’s cash expenditures or future requirements for capital expenditures
• changes in, or cash requirements for, the Company’s working capital needs
• interest expense, or the cash requirements necessary to service interest or principal payments, on the Company’s debt
• any cash income taxes that the Company may be required to pay
• any cash requirements for replacements of assets that are depreciated or amortized over their estimated useful lives and may have to be replaced in the future
• all non-cash income or expense items that are reflected in the Company’s statements of cash flows
The Company’s definition of and method of calculating Adjusted EBITDA may vary from the definitions and methods used by other companies when calculating adjusted EBITDA, which may limit their usefulness as comparative measures.
The Company prepared the information included in this presentation based upon available information and assumptions and estimates that it believes are reasonable. The Company cannot assure you that its estimates and assumptions will prove to be accurate.
Because the Company incurred transaction, transition, integration, transformation, restructuring, and Transition Services Agreement costs in connection with the 2016 Transaction and the transition, borrowed money in order to finance its operations, and used capitaland intangible assets in its business, and because the payment of income taxes is necessary if the Company generates taxable income after the utilization of its net operating loss carryforwards, any measure that excludes these items has material limitations. As a resultof these limitations, these measures should not be considered as a measure of discretionary cash available to the Company to invest in the growth of its business or as a measure of its liquidity.
Adjusted EBITDA Margin
Adjusted EBITDA Margin is defined as Adjusted EBITDA divided by Adjusted Revenues.
26
Presentation of certain non-GAAP financial measures (continued)Standalone Adjusted EBITDA
We are required to report Standalone Adjusted EBITDA pursuant to the reporting covenants contained in the Credit Agreement and the Indenture. Standalone Adjusted EBITDA is substantially similar to Consolidated EBITDA and EBITDA as such terms are defined underthe Credit Agreement and the Indenture, respectively. In addition, the Credit Agreement and the Indenture contain certain restrictive covenants that govern debt incurrence and the making of restricted payments, among other matters. These restrictive covenantsutilize Standalone Adjusted EBITDA as a primary component of the compliance metric governing our ability to undertake certain actions otherwise proscribed by such covenants. Standalone Adjusted EBITDA reflects further adjustments to Adjusted EBITDA for costsavings already implemented and excess standalone costs.
Because Standalone Adjusted EBITDA is required pursuant to the terms of the reporting covenants under the Credit Agreement and the Indenture and because this metric is relevant to lenders and noteholders, management considers Standalone Adjusted EBITDA to berelevant to the operation of its business. It is also utilized by management and the compensation committee of the Board as an input for determining incentive payments to employees.
Excess standalone costs are the difference between our actual standalone company infrastructure costs, and our estimated steady state standalone infrastructure costs. We make an adjustment for the difference because we have had to incur costs under the TransitionServices Agreement after we had implemented the infrastructure to replace the services provided pursuant to the Transition Services Agreement, after we had implemented the infrastructure to replace the services provided pursuant to the Transition ServicesAgreement, thereby incurring dual running costs. Furthermore, there has been a ramp up period for establishing and optimizing the necessary standalone infrastructure. Since our separation from Thomson Reuters, we have had to transition quickly to replace servicesprovided under the Transition Services Agreement, with optimization of the relevant standalone functions typically following thereafter. Cost savings reflect the annualized “run rate” expected cost savings, net of actual cost savings realized, related to restructuring andother cost savings initiatives undertaken during the relevant period.
Standalone Adjusted EBITDA is calculated under the credit facilities and the indenture by using our consolidated net loss for the trailing 12-month period (defined in the credit facilities and the indenture as our U.S. GAAP net income adjusted for certain items specifiedin the credit facilities and the indenture) adjusted for items including: taxes, interest expense, depreciation and amortization, non-cash charges, expenses related to capital markets transactions, acquisitions and dispositions, restructuring and business optimizationcharges and expenses, consulting and advisory fees, run-rate cost savings to be realized as a result of actions taken or to be taken in connection with an acquisition, disposition, restructuring or cost savings or similar initiatives, “run rate” expected cost savings,operating expense reductions, restructuring charges and expenses and synergies related to the transition projected by us, costs related to any management or equity stock plan, other adjustments that were presented in the offering memorandum used in connectionwith the issuance of the secured notes due 2026 and earnout obligations incurred in connection with an acquisition or investment. In addition, as permitted under the credit facilities and the indenture, we have calculated Standalone Adjusted EBITDA for the twelvemonths ended March 31, 2020 by giving effect to the DRG acquisition and our realization of certain cost synergies in respect thereof as if the DRG acquisition had been consummated at the beginning of such twelve month period.

27
Reconciliation of Non-GAAP Financial Measures and Required Reported Data
• The following tables present the amounts of our subscription and transactional revenues, including as a percentage of our total revenues, for the periods indicated, as well the drivers of the variances between periods.
Variance Increase / (Decrease) Percentage of Factors Increase / (Decrease)
Three Months Ended March 31,
Total Variance
(Dollars)
Total Variance
(Percentage)Acquisitive Disposal FX Impact
Ongoing
Business
($ in millions, except percentages) 2020 2019
Subscription revenues $193.2 $192.5 $0.7 0.4% 5.1% (7.3%) (0.7%) 3.3%
Transactional Revenues 49.2 41.7 7.5 18.1 23.0 (1.6) (0.8) (2.5)
Deferred Revenues Adjustment (1.9) (0.2) 1.7 NM NM -- -- 68.3
Revenues, Net $240.6 $234.0 $6.6 2.8% 7.5% (6.3%) (0.7%) 2.3%
Deferred Revenues Adjustment 1.9 0.2 1.7 NM NM -- -- 68.3
Adjusted Revenues, Net $242.5 $234.2 $8.3 3.5% 8.3% (6.3%) (0.7%) 2.2%
(1) Reflects the deferred revenues adjustment made as a result of purchase accounting.
1
1

28
Reconciliation of Non-GAAP Financial Measures and Required Reported Data
Descriptions
Adjusted Revenue and Adjusted EBITDA adjustments
1. In 2020, this is related to a new transition services agreement and offset by the reverse transition services agreement from the sale of MarkMonitor assets. In 2019, this includes payments to Thomson Reuters under the transition services agreement entered into in connection with our 2016 separation from Thomson Reuters.
2. Includes costs incurred in connection with and after our separation from Thomson Reuters in 2016 relating to the implementation of our standalone company infrastructure and related cost-savings initiatives. These costs include mainly transition consulting, technology infrastructure, personnel and severance expenses relating to our standalone company infrastructure, which are recorded in Transition, integration, and other line-item of our income statement, as well as expenses related to the restructuring and transformation of our business following our separation from Thomson Reuters in 2016, mainly related to the integration of separate business units into one functional organization and enhancements in our technology.
3. Reflects the deferred revenues adjustment as a result of purchase accounting.
4. Includes costs incurred to complete business combination transactions, including acquisitions and dispositions, and typically include advisory, legal and other professional and consulting costs.
5. Reflects costs incurred in connection with the initiative, following our merger with Churchill Capital Corp in 2019, to streamline our operations by simplifying our organization and focusing on two product groups.
6. Includes primarily the net impact of foreign exchange gains and losses related to the re-measurement of balances and other items that do not reflect our ongoing operating performance.
Reconciliation
($ in millions)March 31
QTD 2020 QTD 2019
Revenue, Net 240.6 234.0
(+) Deferred Revenue Adjustment 1.9 0.2
Adjusted Revenue $242.5 $234.2
Net (Loss) ($74.0) ($59.3)
(-) Provision for Income Taxes 14.8 0.2
(+) Depreciation and Amortization 51.4 58.2
(+) Interest Expense, Net 30.9 33.1
(+) Transition, Services Agreement Costs 1.6 5.3
(+) Transition, Transformation and Integration Expenses 2.2 2.5
(+) Deferred Revenue Adjustment 1.9 0.2
(+) Transaction Related Costs 26.7 10.3
(+) Stock-based Compensation Expense 17.5 3.2
(+) Restructuring 7.8 --
(+) Other (2.6) 5.5
Adjusted EBITDA $78.2 $59.2
1
2
3
4
5
6

29
Reconciliation of Non-GAAP Financial Measures and Required Reported Data
Descriptions
Adjusted revenue and Adjusted EBITDA adjustments
1. In 2020, this is related to a new transition services agreement and offset by the reverse transition services agreement from
the sale of MarkMonitor assets. In 2019, this includes payments to Thomson Reuters under the transition services agreement
entered into in connection with our 2016 separation from Thomson Reuters.
2. Includes cash payments in connection with and after our separation from Thomson Reuters in 2016 relating to the
implementation of our standalone company infrastructure and related cost-savings initiatives. These cash payments include
mainly transition consulting, technology infrastructure, personnel and severance expenses relating to our standalone
company infrastructure, which are recorded in Transition, integration, and other line-items of our income statement, as well
as cash payments related to the restructuring and transformation of our business following our separation from Thomson
Reuters in 2016 mainly related to the integration of separate business units into one functional organization and
enhancements in our technology. This also includes cash payments following our merger with Churchill Capital Corp in 2019,
to streamline our operations by simplifying our organization and focusing on two product groups.
3. Reflects the deferred revenues adjustment as a result of purchase accounting.
4. Includes costs incurred to complete business combination transactions, including acquisitions and dispositions, and typically
include advisory, legal and other professional and consulting costs.
5. Reflects costs incurred in connection with the initiative, following our merger with Churchill Capital Corp in 2019, to
streamline our operations by simplifying our organization and focusing on two product groups.
6. Includes primarily the net impact of foreign exchange gains and losses related to the re-measurement of balances and other
items that do not reflect our ongoing operating performance.
7. Represents DRG Adjusted EBITDA for the period beginning April 1, 2019 until the acquisition date of February 28, 2020 to
reflect our Standalone Adjusted EBITDA as though the DRG Acquisition occurred at the beginning of the presented period
8. Reflects the estimated annualized run-rate cost savings, net of actual cost savings realized, related to restructuring and other
cost savings initiatives undertaken during the period (exclusive of any cost reductions in our estimated standalone operating
costs).
9. Reflects the difference between our actual standalone company infrastructure costs, and our estimated steady state
standalone operating costs.
Reconciliation
($ in millions)Last Twelve Months
31-Mar-20
Net (Loss) ($225.7)
(-) Provision for Income Taxes 24.7
(+) Depreciation and Amortization 193.8
(+) Interest Expense, Net 155.5
(+) Transition, Services Agreement Costs 6.8
(+) Transition, Transformation and Integration Expenses 24.1
(+) Deferred Revenue Adjustment 2.2
(+) Transaction Related Costs 62.6
(+) Stock-based Compensation Expense 65.7
(+) Restructuring 23.4
(-) Legal Settlement (39.4)
(+) Impairment on Assets Held For Sale 18.4
(+) Other 0.9
Adjusted EBITDA $313.0
Adjusted EBITDA $313.0
(+) Realized Foreign Exchange Gain (5.5)
(+) DRG Adjusted EBITDA Impact 45.4
(+) Cost Savings 44.0
(+) Excess Standalone Costs 28.5
Standalone Adjusted EBITDA $425.5
Required Reported Data
1
2
3
4
5
6
7
8
9