NYISO DECISION SUPPORT SYSTEM · – DSS Training Offerings ... Individual data elements (for...
76
NYISO DECISION SUPPORT SYSTEM INTERMEDIATE TRAINING COURSE
-
Upload
trinhtuyen -
Category
Documents
-
view
214 -
download
0
Transcript of NYISO DECISION SUPPORT SYSTEM · – DSS Training Offerings ... Individual data elements (for...

NYISO DECISION SUPPORT SYSTEMINTERMEDIATE TRAINING COURSE
Training Agenda• Course Background
– DSS Training Offerings– Course Goals– Supporting Documentation
• Review of Introductory Topics• Conceptual Data Models• Universe Design Overview• Business Objects Features Overview
– Custom Querying– Custom Report Formatting
• Basics• Intermediates
• Web Intelligence– Custom Querying
• Case Studies (Hands-On Exercises) Throughout

Course Background
DSS Training Offerings• Introduction Training Course
– Instructor led online training course covering the basics of NYISO’s DSS (WebEx delivered).
• Intermediate Training Course– Instructor led classroom training course covering intermediate
topics such as custom report creation.• Self-Directed Introduction Training Course
– Download and view the DSS Introduction Training Course on NYISO’s DSS from the NYISO website (planned course).
• Third Party Offerings– Independent training organizations offer a wide variety of
training programs on Business Objects.

Course Goals and Objectives
• WILL PROVIDEA Re-Cap of the Introduction CourseAn Overview of the Data Elements Contained in the DSS (Business Objects Universes)A demonstration of the custom querying and reporting features of DSS ToolsetHands-On Experience using the DSS in Real Life Business Scenarios
• WILL NOT INCLUDE:⊗Advanced Business Objects training – available from
third parties.
Supporting Documentation
• The following documents should be used as supplementary documentation during this course:– NYISO DSS Users Guide– NYISO Billing and Accounting Manual– DSS Release Matrix– DSS Customer Settlements Billing Code
Mapping Document

Review of Introductory Topics

Review of Introduction Course• DSS Background Information
– What is a Data Warehouse/DSS?• DSS Data Scope
– Functional Summary– Versioning Strategy– Data Availability
• Corporate Reports– Summary / List of Reports– How to Access

Data Warehouse Definition
• Data Warehouse– Repository of integrated, non-volatile and time-
variant data, collected from heterogeneous transaction processing applications, and stored in a format optimal for reporting and strategic analysis for an enterprise -- Bill Inmon
For NYISO…- Data from BAS, MIS and Consolidated Invoice
applications is collected, formatted and stored in a single, centralized location for customer reporting and analysis.

Data Warehouse Components
DataDataWarehouseWarehouse
ExternalExternalDataData
OperationalOperationalDataData
Data PreparationData Preparation
StoreStoreFeedFeed UseUse
User Tools
(ETL)
(Business Objects)

Business Objects Introduction
MIS
BAS
WarehouseData
Power Suppliers
Load Serving Entities
Transaction Customers
Universe: View of a functional set of data within the warehouse
Classes/Sub-classes: Groups of objects
Objects: Individual data elements (for reporting and filtering)Example: Organization, Interval Start Time
Hierarchy
Data Prep & Transfer
Virtual Market Customers
Etc.
~1200 data elements
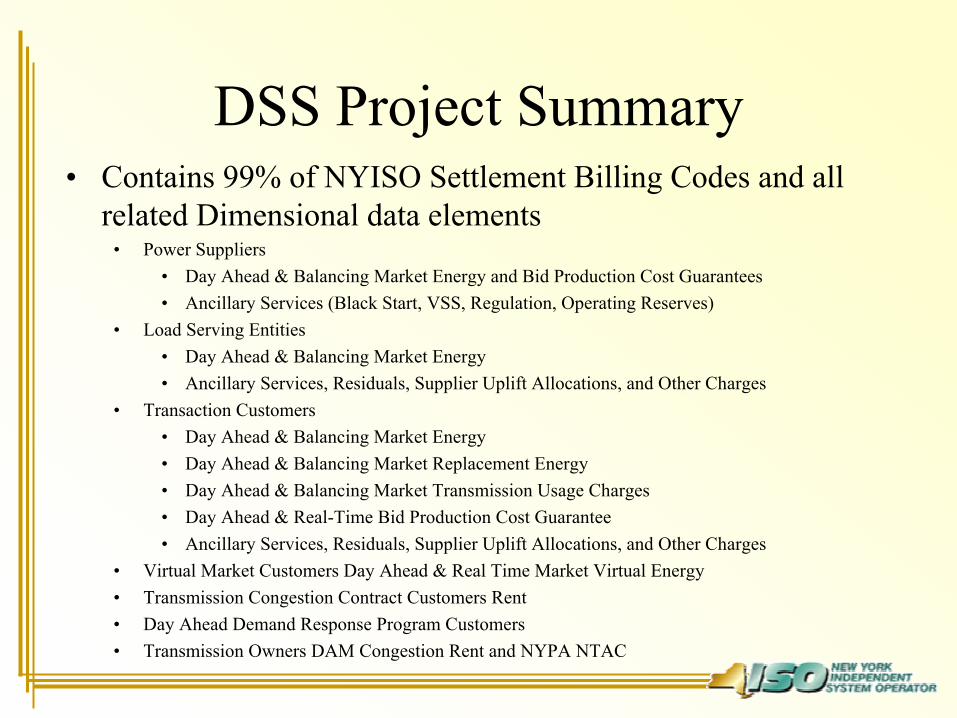
DSS Project Summary• Contains 99% of NYISO Settlement Billing Codes and all
related Dimensional data elements• Power Suppliers
• Day Ahead & Balancing Market Energy and Bid Production Cost Guarantees• Ancillary Services (Black Start, VSS, Regulation, Operating Reserves)
• Load Serving Entities • Day Ahead & Balancing Market Energy• Ancillary Services, Residuals, Supplier Uplift Allocations, and Other Charges
• Transaction Customers• Day Ahead & Balancing Market Energy• Day Ahead & Balancing Market Replacement Energy• Day Ahead & Balancing Market Transmission Usage Charges• Day Ahead & Real-Time Bid Production Cost Guarantee• Ancillary Services, Residuals, Supplier Uplift Allocations, and Other Charges
• Virtual Market Customers Day Ahead & Real Time Market Virtual Energy• Transmission Congestion Contract Customers Rent• Day Ahead Demand Response Program Customers• Transmission Owners DAM Congestion Rent and NYPA NTAC
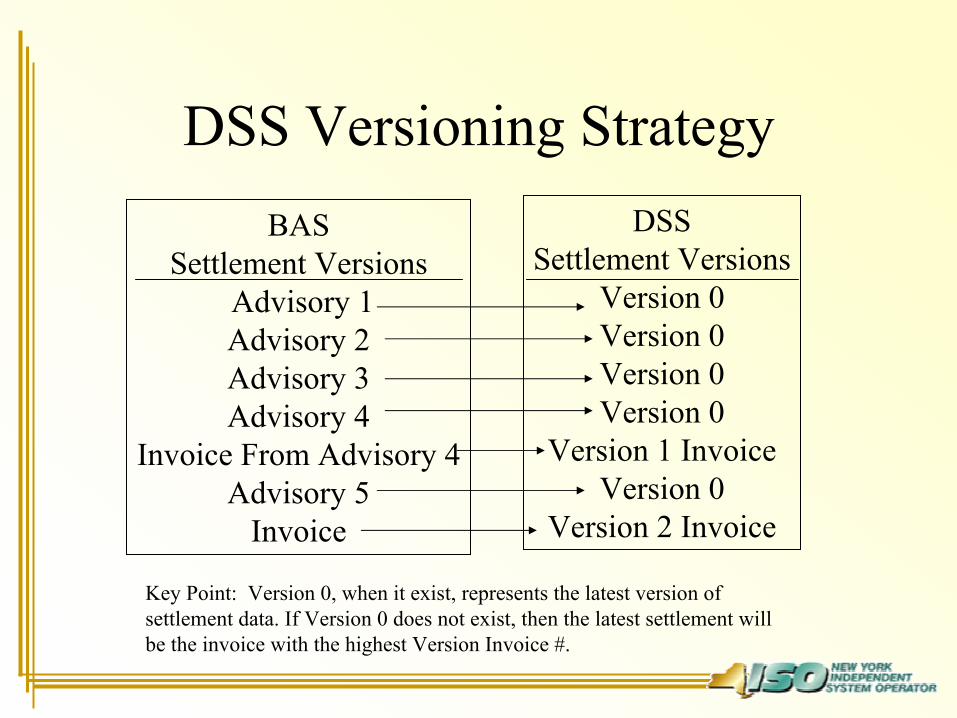
DSS Versioning StrategyBAS
Settlement VersionsAdvisory 1Advisory 2Advisory 3Advisory 4
Invoice From Advisory 4Advisory 5
Invoice
DSSSettlement Versions
Version 0Version 0Version 0Version 0
Version 1 InvoiceVersion 0
Version 2 Invoice
Key Point: Version 0, when it exist, represents the latest version of settlement data. If Version 0 does not exist, then the latest settlement will be the invoice with the highest Version Invoice #.
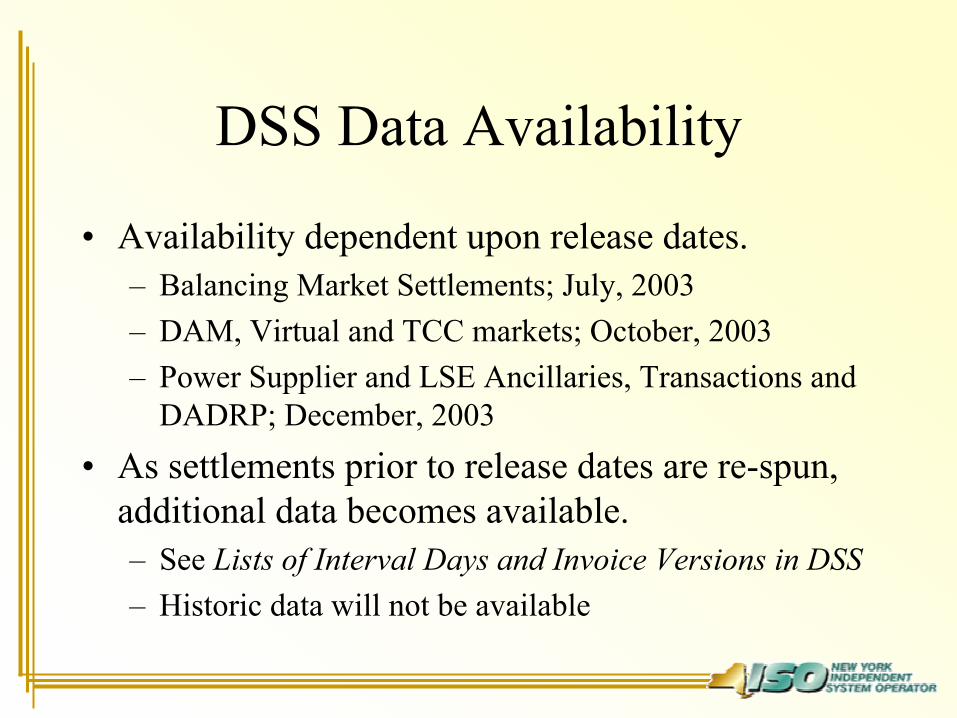
DSS Data Availability
• Availability dependent upon release dates.– Balancing Market Settlements; July, 2003– DAM, Virtual and TCC markets; October, 2003– Power Supplier and LSE Ancillaries, Transactions and
DADRP; December, 2003
• As settlements prior to release dates are re-spun, additional data becomes available.– See Lists of Interval Days and Invoice Versions in DSS– Historic data will not be available
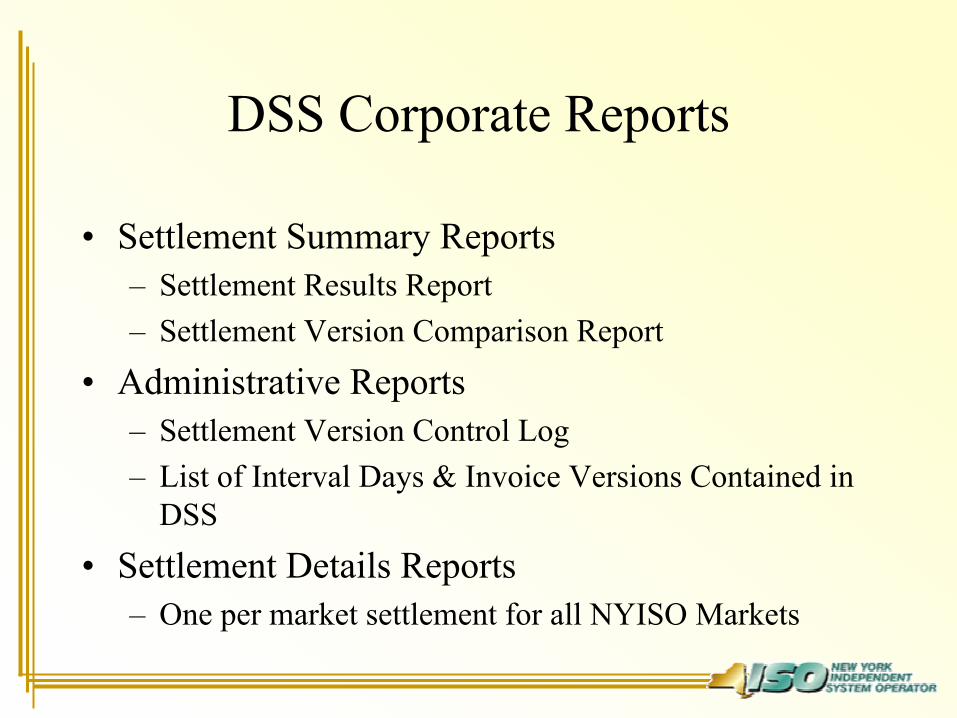
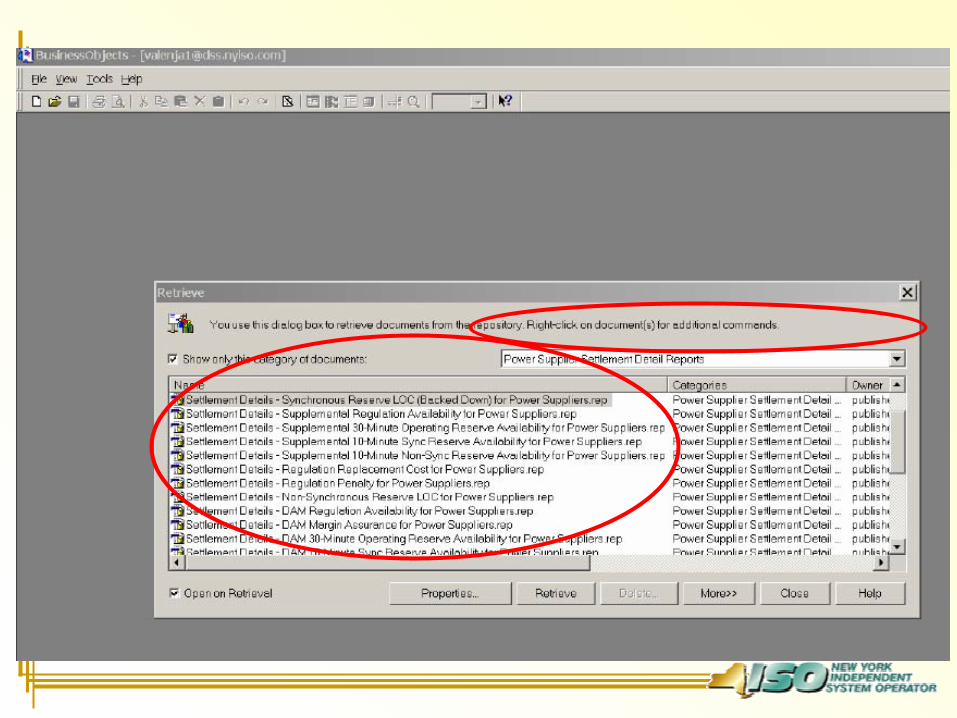
DSS Corporate Reports
• Settlement Summary Reports– Settlement Results Report– Settlement Version Comparison Report
• Administrative Reports– Settlement Version Control Log– List of Interval Days & Invoice Versions Contained in
DSS
• Settlement Details Reports– One per market settlement for all NYISO Markets

Business Scenarios Corporate Reports
• Scenario (#1A) - Review Settlement Results• Scenario (#1B) - Compare Invoice Versions• Scenario (#1C) - Review Power Supplier DAM Energy Settlement
Details
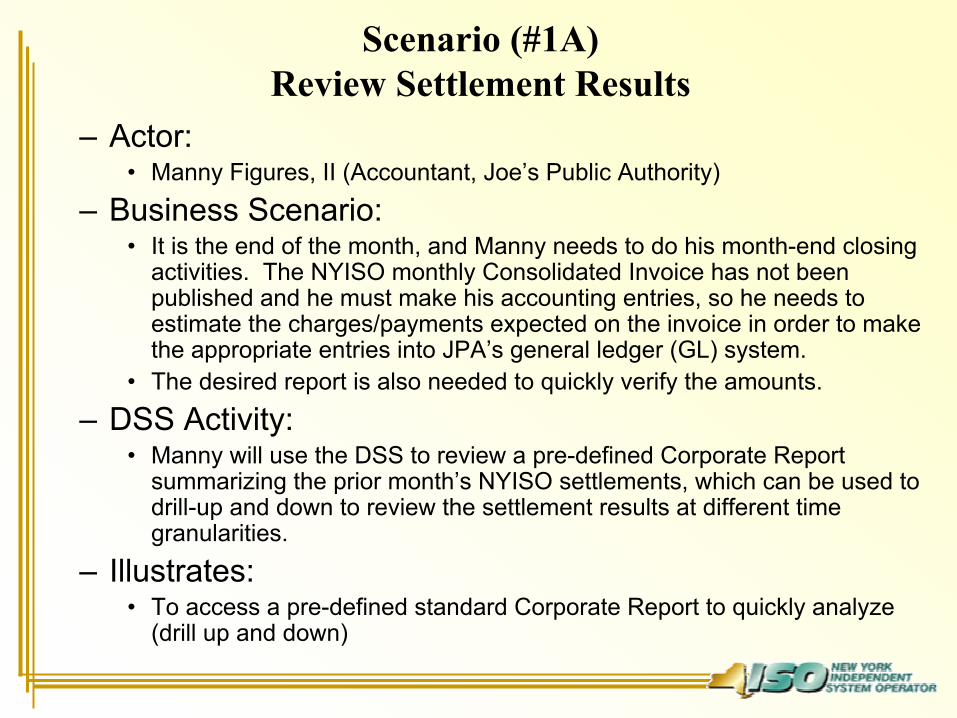
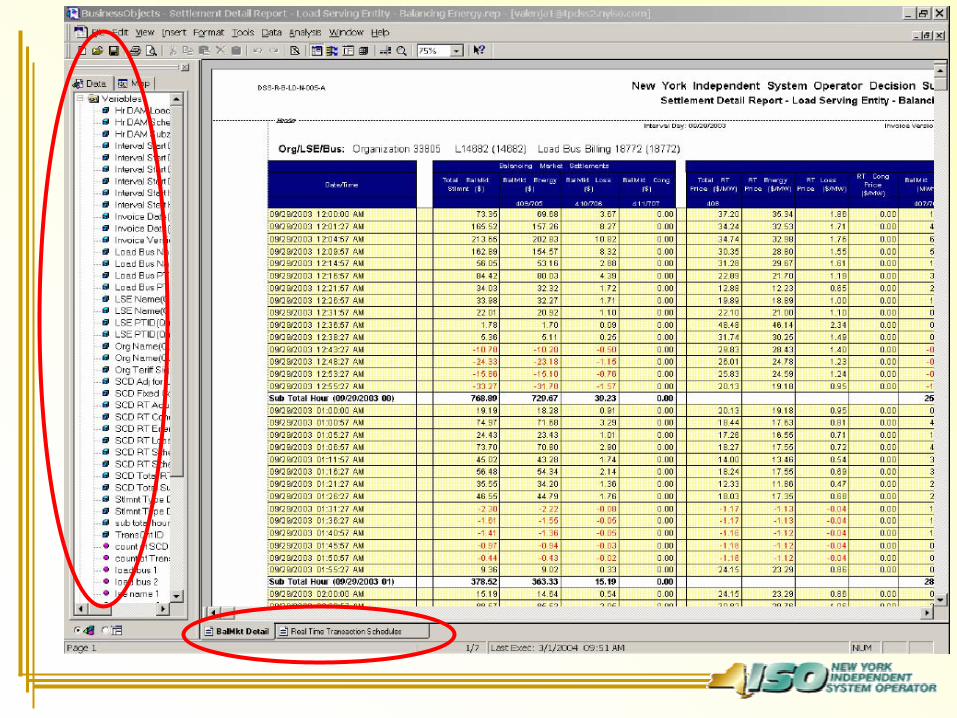
Scenario (#1A) Review Settlement Results
– Actor: • Manny Figures, II (Accountant, Joe’s Public Authority)
– Business Scenario: • It is the end of the month, and Manny needs to do his month-end closing
activities. The NYISO monthly Consolidated Invoice has not beenpublished and he must make his accounting entries, so he needs to estimate the charges/payments expected on the invoice in order to make the appropriate entries into JPA’s general ledger (GL) system.
• The desired report is also needed to quickly verify the amounts.– DSS Activity:
• Manny will use the DSS to review a pre-defined Corporate Report summarizing the prior month’s NYISO settlements, which can be used to drill-up and down to review the settlement results at different time granularities.
– Illustrates: • To access a pre-defined standard Corporate Report to quickly analyze
(drill up and down)
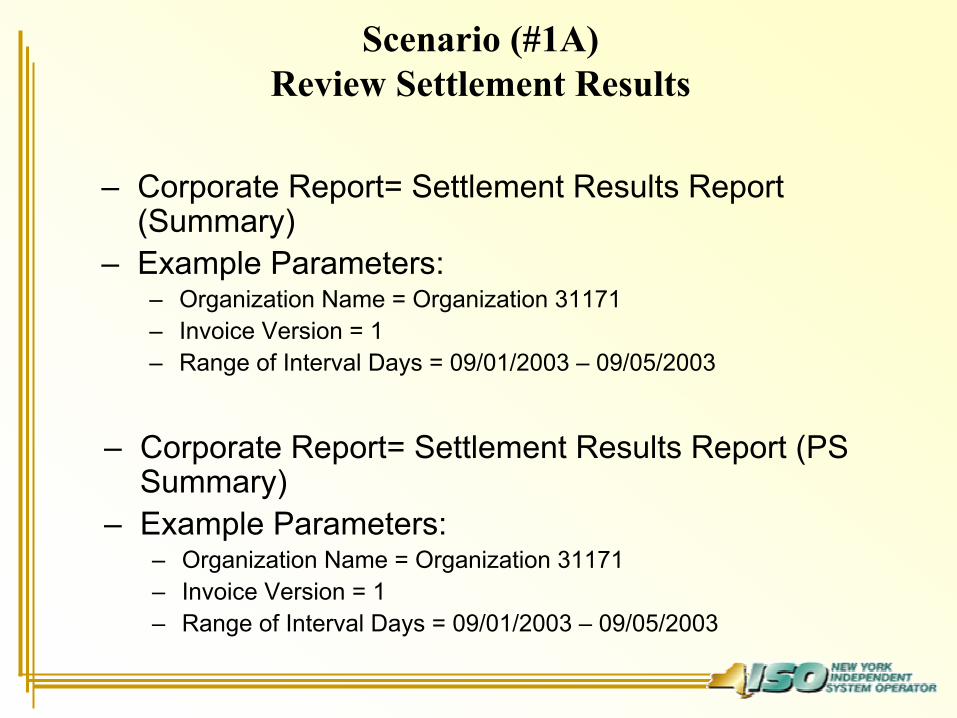
– Corporate Report= Settlement Results Report (Summary)
– Example Parameters:– Organization Name = Organization 31171– Invoice Version = 1– Range of Interval Days = 09/01/2003 – 09/05/2003
Scenario (#1A) Review Settlement Results
– Corporate Report= Settlement Results Report (PS Summary)
– Example Parameters:– Organization Name = Organization 31171– Invoice Version = 1– Range of Interval Days = 09/01/2003 – 09/05/2003
Scenario (#1B) Compare Invoice Versions
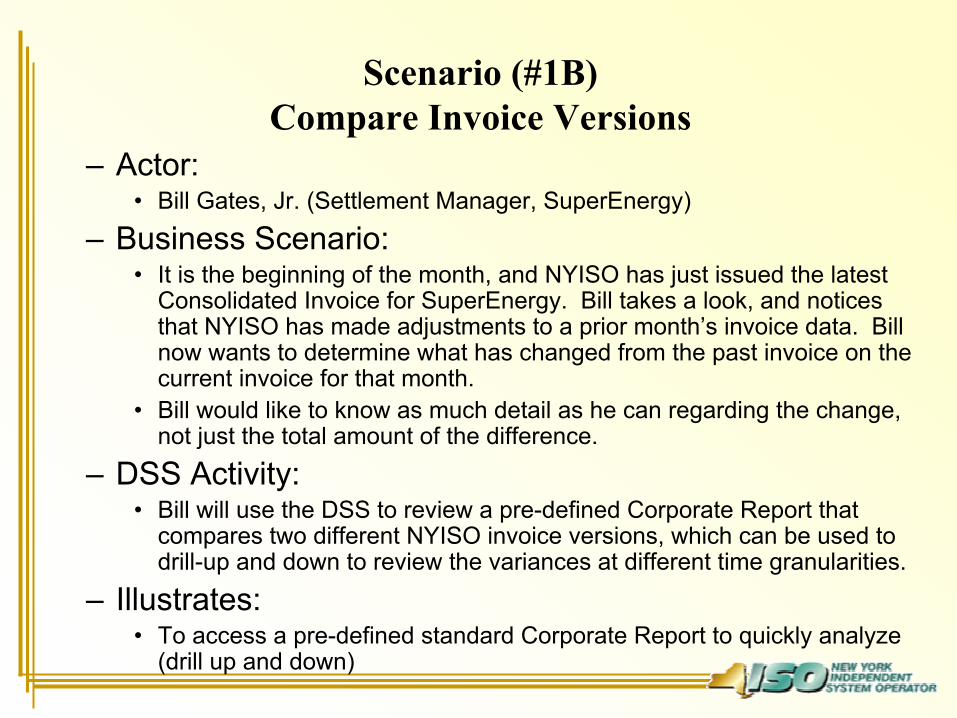
– Actor: • Bill Gates, Jr. (Settlement Manager, SuperEnergy)
– Business Scenario: • It is the beginning of the month, and NYISO has just issued the latest
Consolidated Invoice for SuperEnergy. Bill takes a look, and notices that NYISO has made adjustments to a prior month’s invoice data. Bill now wants to determine what has changed from the past invoice on the current invoice for that month.
• Bill would like to know as much detail as he can regarding the change, not just the total amount of the difference.
– DSS Activity: • Bill will use the DSS to review a pre-defined Corporate Report that
compares two different NYISO invoice versions, which can be used to drill-up and down to review the variances at different time granularities.
– Illustrates: • To access a pre-defined standard Corporate Report to quickly analyze
(drill up and down)
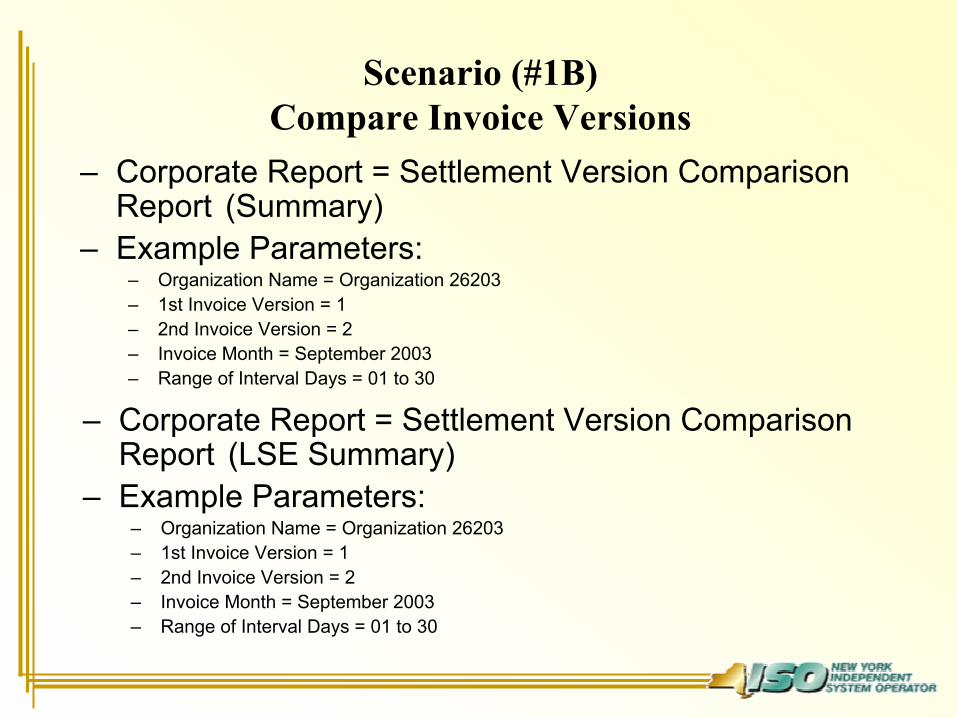
– Corporate Report = Settlement Version Comparison Report (Summary)
– Example Parameters:– Organization Name = Organization 26203– 1st Invoice Version = 1– 2nd Invoice Version = 2– Invoice Month = September 2003– Range of Interval Days = 01 to 30
Scenario (#1B) Compare Invoice Versions
– Corporate Report = Settlement Version Comparison Report (LSE Summary)
– Example Parameters:– Organization Name = Organization 26203– 1st Invoice Version = 1– 2nd Invoice Version = 2– Invoice Month = September 2003– Range of Interval Days = 01 to 30
Scenario (#1C)Review Power Supplier DAM Energy Settlement
Details– Actor:
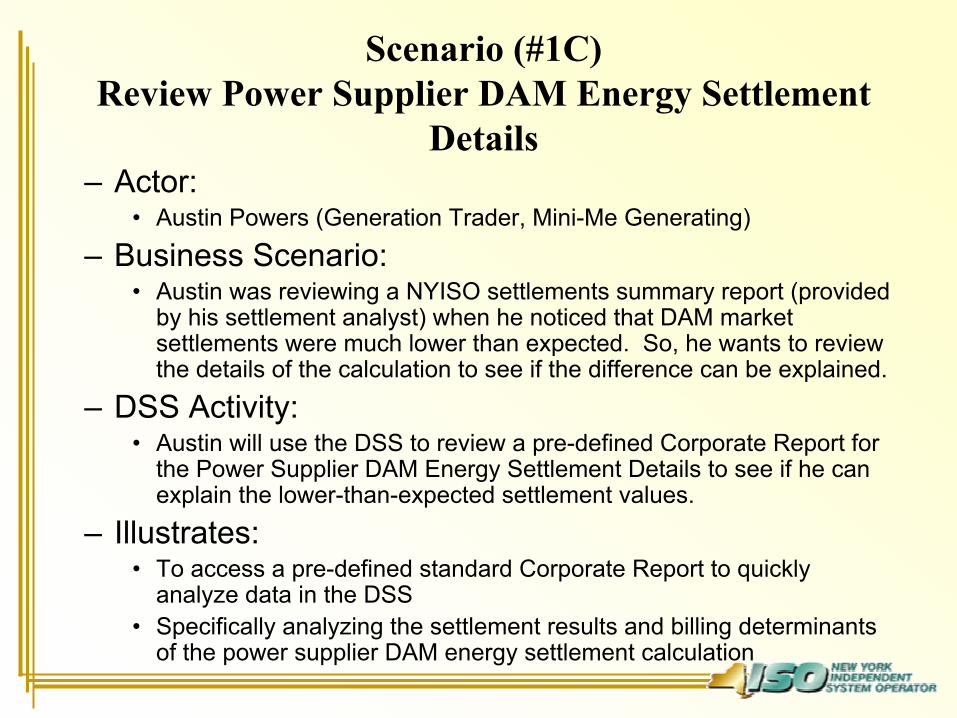
• Austin Powers (Generation Trader, Mini-Me Generating)– Business Scenario:
• Austin was reviewing a NYISO settlements summary report (provided by his settlement analyst) when he noticed that DAM market settlements were much lower than expected. So, he wants to review the details of the calculation to see if the difference can be explained.
– DSS Activity:• Austin will use the DSS to review a pre-defined Corporate Report for
the Power Supplier DAM Energy Settlement Details to see if he can explain the lower-than-expected settlement values.
– Illustrates: • To access a pre-defined standard Corporate Report to quickly
analyze data in the DSS• Specifically analyzing the settlement results and billing determinants
of the power supplier DAM energy settlement calculation
– Corporate Report = Power Supplier DAM Energy Settlement Details
– Example Parameters:– Organization Name = Organization 35551– Generator Name = *– Interval Day / Version = 09/24/2003 V2
Scenario (#1C)Review Power Supplier DAM Energy Settlement
Details
Conceptual Data Models
Conceptual Data Models
• Document the primary relationships between related data entities
• Can assist with identifying the causes of Cartesian Product error messages
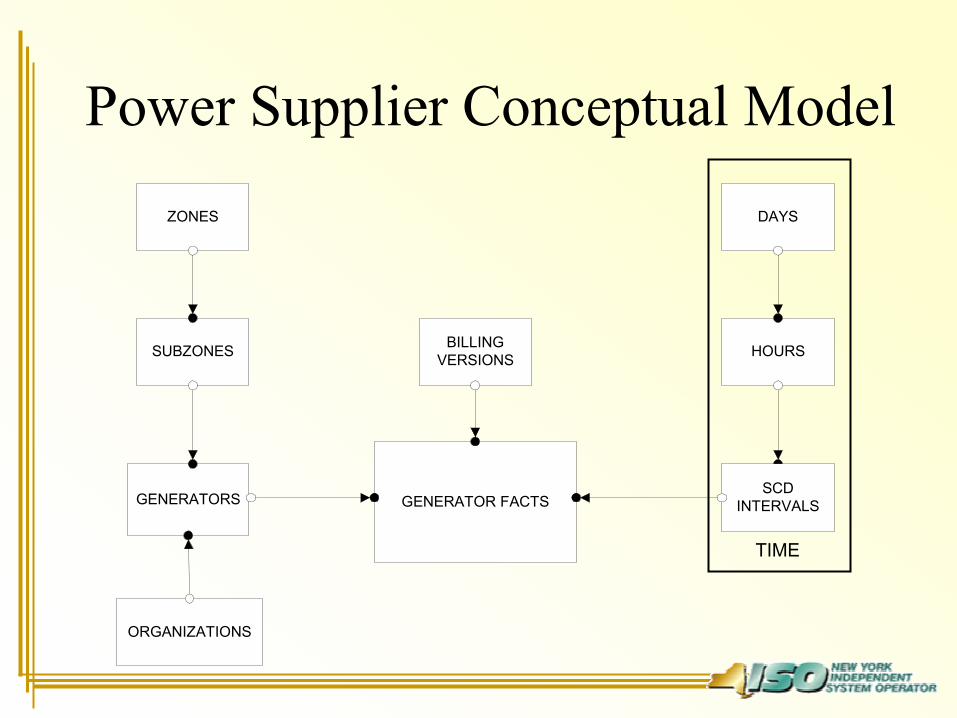
GENERATOR FACTSGENERATORS
HOURS
DAYS
SCDINTERVALS
SUBZONES
ZONES
BILLINGVERSIONS
ORGANIZATIONS
TIME
Power Supplier Conceptual Model
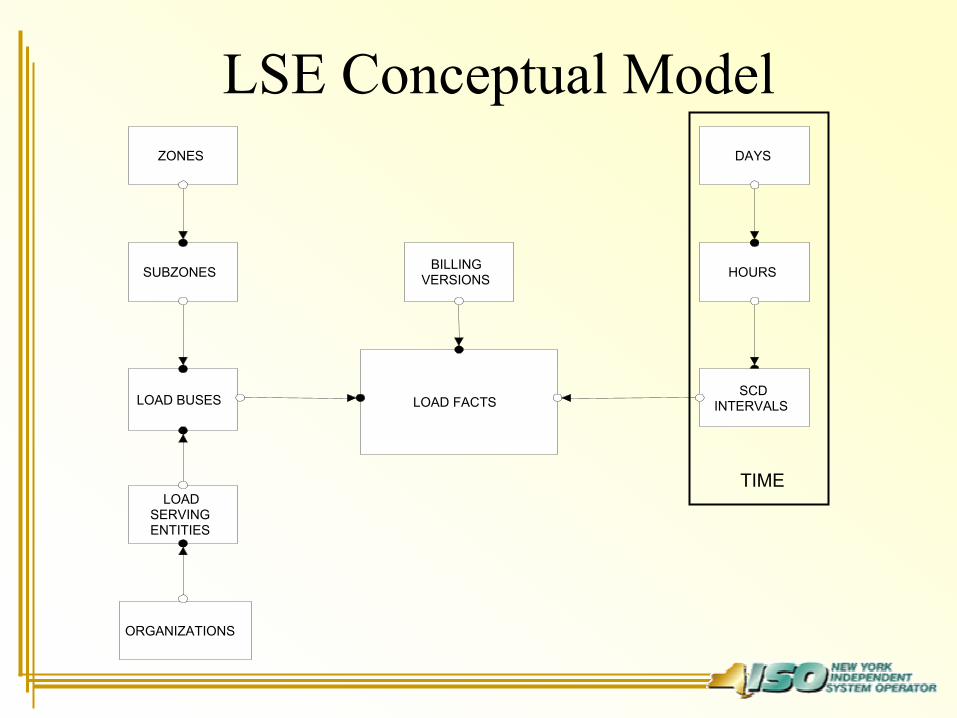
LSE Conceptual Model
TIME
LOAD FACTSLOAD BUSES
HOURS
DAYS
SCDINTERVALS
SUBZONES
ZONES
BILLINGVERSIONS
LOADSERVINGENTITIES
ORGANIZATIONS
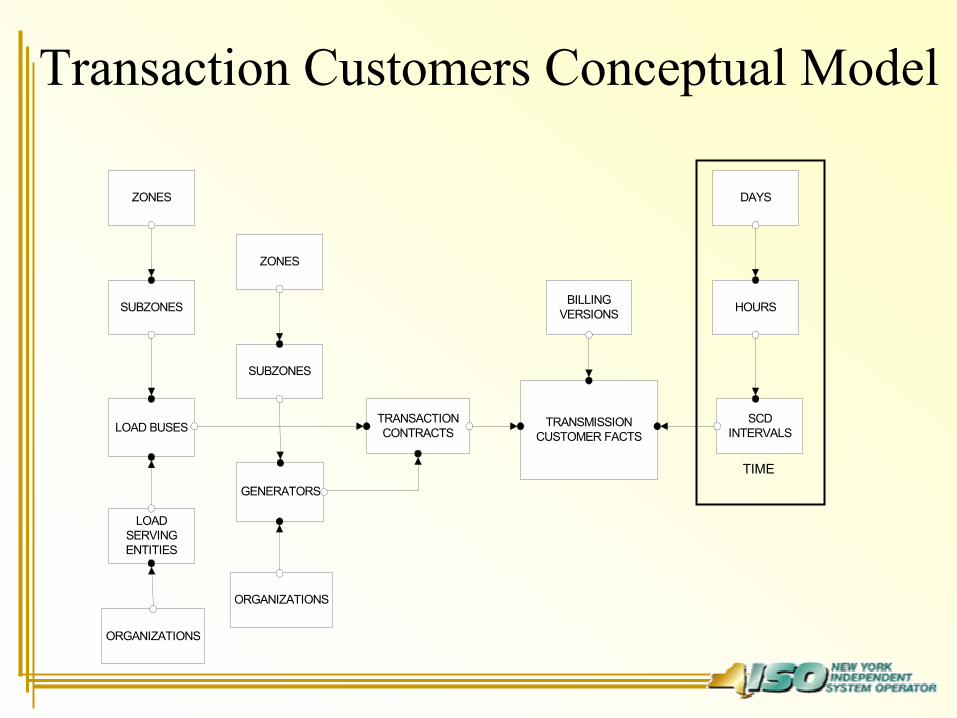
TRANSMISSIONCUSTOMER FACTS
LOAD BUSES
HOURS
DAYS
SCDINTERVALS
SUBZONES
ZONES
BILLINGVERSIONS
LOADSERVINGENTITIES
ORGANIZATIONS
GENERATORS
SUBZONES
ZONES
ORGANIZATIONS
TRANSACTIONCONTRACTS
TIME
Transaction Customers Conceptual Model
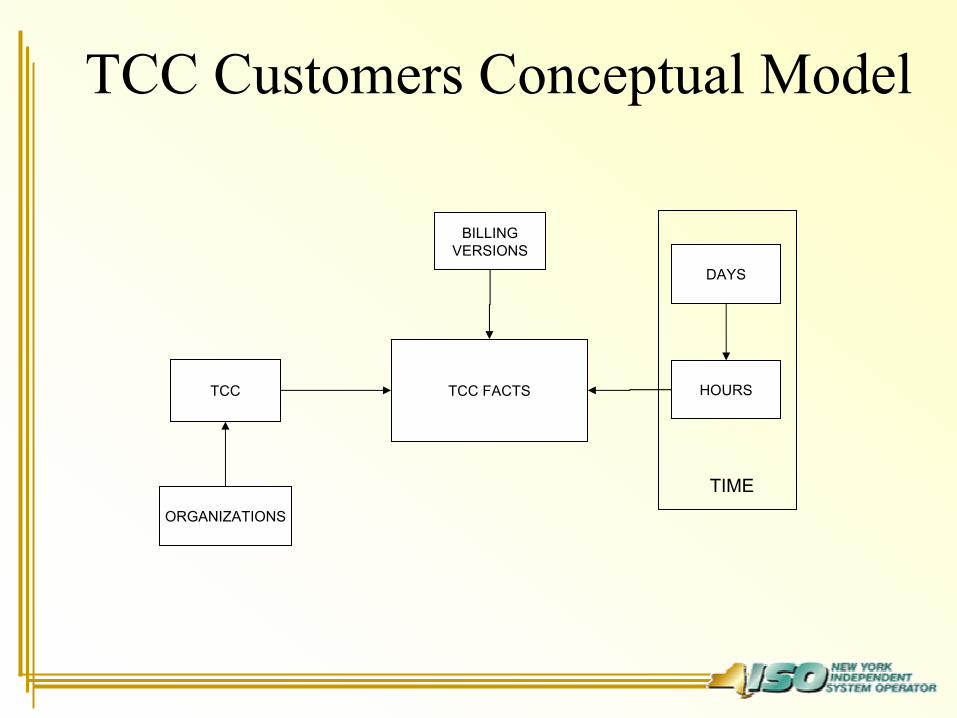
TCC Customers Conceptual Model
TIME
TCC FACTS
BILLINGVERSIONS
DAYS
HOURSTCC
ORGANIZATIONS

Virtual Market Customers Conceptual Model
TIME
VIRTUAL MARKET FACTS
BILLINGVERSIONS
HOURS
SCDINTERVALS
VIRTUALSUPPLY BUS
ORGANIZATIONS
DAYS
ZONE
VIRTUAL BIDENTITY
VIRTUALLOAD BUS
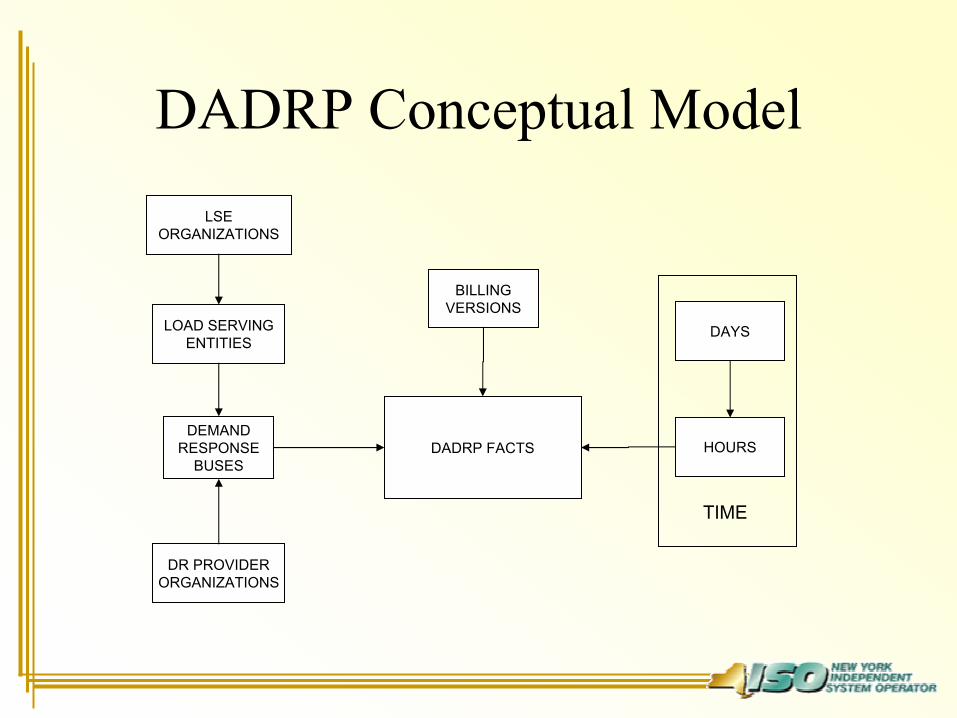
DADRP Conceptual Model
TIME
DADRP FACTS
BILLINGVERSIONS
DAYS
HOURSDEMAND
RESPONSE BUSES
DR PROVIDERORGANIZATIONS
LOAD SERVING ENTITIES
LSEORGANIZATIONS
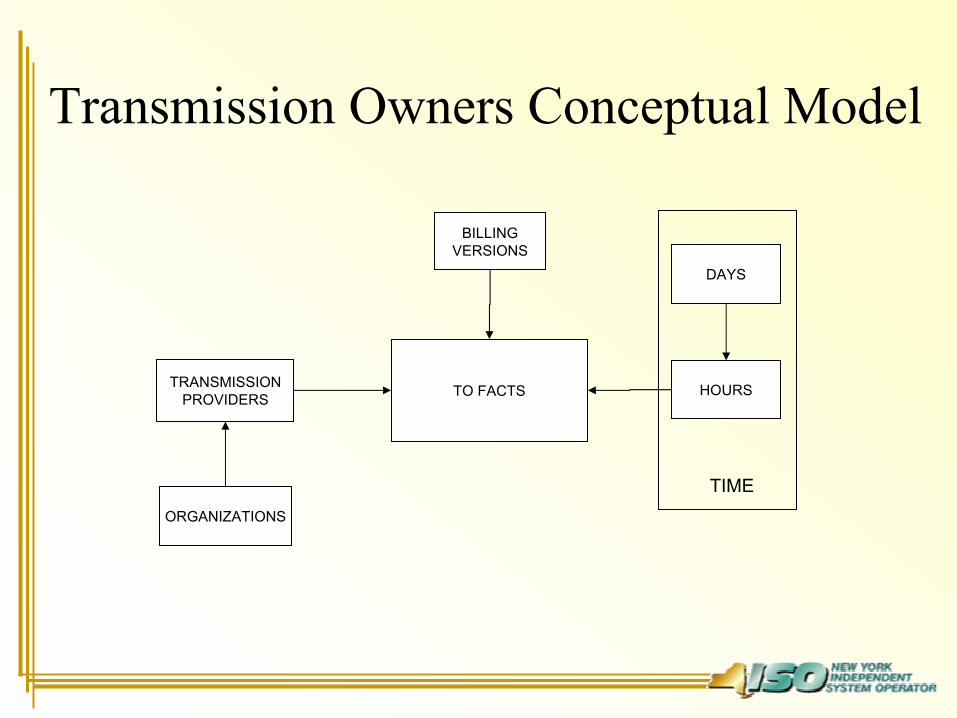
Transmission Owners Conceptual Model
TIME
TO FACTS
BILLINGVERSIONS
DAYS
HOURSTRANSMISSION PROVIDERS
ORGANIZATIONS

Business Objects Universe Overview
Business Objects Universe Overview
• What is a Universe?– The approach used to present the custom querying
and reporting environment to users in a simplified manner.
– Logical grouping of data elements to make custom querying quicker and easier
• Universes – High Level Organization • Classes / Sub-Classes– More focused but still high level
– Objects – detailed level of data (actual data elements)
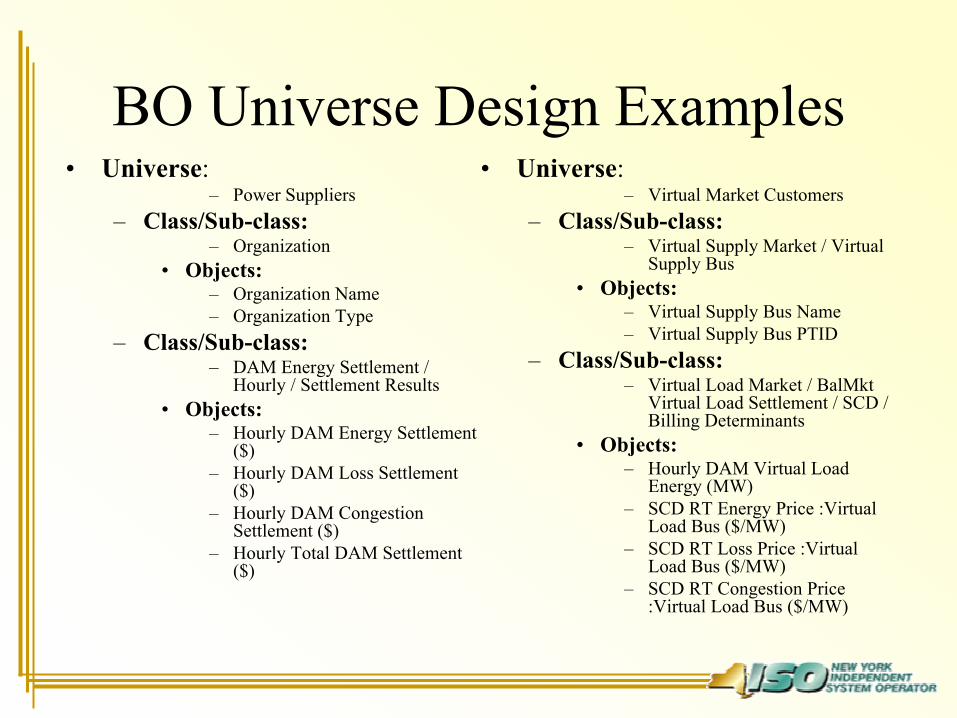
BO Universe Design Examples• Universe:
– Power Suppliers– Class/Sub-class:
– Organization• Objects:
– Organization Name– Organization Type
– Class/Sub-class:– DAM Energy Settlement /
Hourly / Settlement Results• Objects:
– Hourly DAM Energy Settlement ($)
– Hourly DAM Loss Settlement ($)
– Hourly DAM Congestion Settlement ($)
– Hourly Total DAM Settlement ($)
• Universe: – Virtual Market Customers
– Class/Sub-class:– Virtual Supply Market / Virtual
Supply Bus• Objects:
– Virtual Supply Bus Name– Virtual Supply Bus PTID
– Class/Sub-class:– Virtual Load Market / BalMkt
Virtual Load Settlement / SCD / Billing Determinants
• Objects:– Hourly DAM Virtual Load
Energy (MW)– SCD RT Energy Price :Virtual
Load Bus ($/MW) – SCD RT Loss Price :Virtual
Load Bus ($/MW) – SCD RT Congestion Price
:Virtual Load Bus ($/MW)

BO Universe High Level Design• Within the many DSS BO Universes, data elements are
initially broken down into 2 types:– Dimensions
• Data elements that describe the data– Common Dimensions (across Universe)
» Date/Time» Invoice Version» Etc.
– Universe Specific» Generators» Load Serving Entities» Transaction Contracts» TCCs
– Facts• Data elements containing desired values (actual values)
– For example: Scheduled Energy, Market Prices, Basepoints, Load Forecasts, etc.
• Factual data elements are organized in a manner to highlight the settlement algorithm– Initially they are identified by settlement
• DAM Energy for Power Suppliers• Balancing Market LBMP Energy for Transaction Customers• TCC Rent• Etc.
– Next they are broken down by time granularity (daily, hourly, SCD level)
– Then they are broken down into 4 categories based on purpose in the settlement
• Settlement Results• Intermediate Calculations• Billing Determinants• Other Related Data Elements
BO Universe High Level Design

Example & Exercises• Find:
– Load Universe• The SCD-level RT market prices ($/MW) used in the load settlement• A load bus’ SCD-level RT Actual Load (MW) used in the load settlement• A load bus’ NYISO PTID
– Power Supplier Universe• The daily BPCG Settlement ($) for a generator• A generator’s DAM Generation Bid• A generator’s NYISO PTID
– Transaction Universe• A Source Generator Name for a Transaction Contract• A Transaction Contract’s SCD-level RT Scheduled Energy (MW)
– TCC Universe• A TCC’s hourly TCC Capacity (MW)
– Virtual Market Universe• Hourly DAM Virtual Load Energy (MW)• Hourly DAM Virtual Supply Settlement ($)

Business Objects – Demo
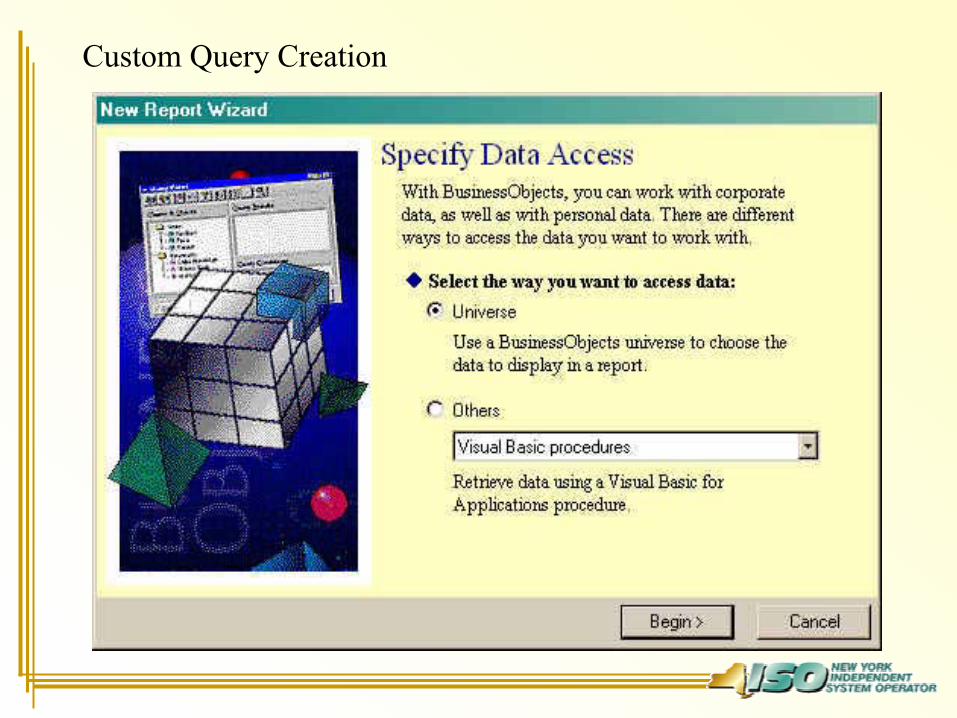
Custom Query Creation

Custom Query Creation

Custom Query Creation – Main Query Panel

Custom Query Creation – Defining the Result Set

Custom Query Creation – Defining the Query Conditions (data set)

Custom Query Creation – Initial Report Results

Custom Query Creation – Custom Report Formatting

Business Scenarios
Instructor Led and
Hands On Exercises

Training Environment Data
• Data has been masked to maintain confidentiality!
• Data available:– September 2003– Invoice Versions
• 1 & 2 (1 is a partial set)

Gotchas…– Here are a few scenarios to watch out for:
• In general:• Failure to define appropriate conditions• Failure to include the appropriate dimensional data
elements in your result set• Including mixed time-granularities in your result set• Building queries with incompatible objects (Cartesian
products)• Slow performing queries due to inefficient query design

Business Scenarios Basic Custom Queries & Reports
• Scenario (#2A) - Power Supplier Asset Management – Bid Strategy Analysis
• Scenario (#2B) - Load Serving Entity – Energy Procurement Strategy Analysis
• Scenario (#2C) - Transaction Customer – Management Reporting• Scenario (#2D) - Load Serving Entity - Ancillary Service Analysis• Scenario (#2E) – Power Supplier – Ancillary Service Summary
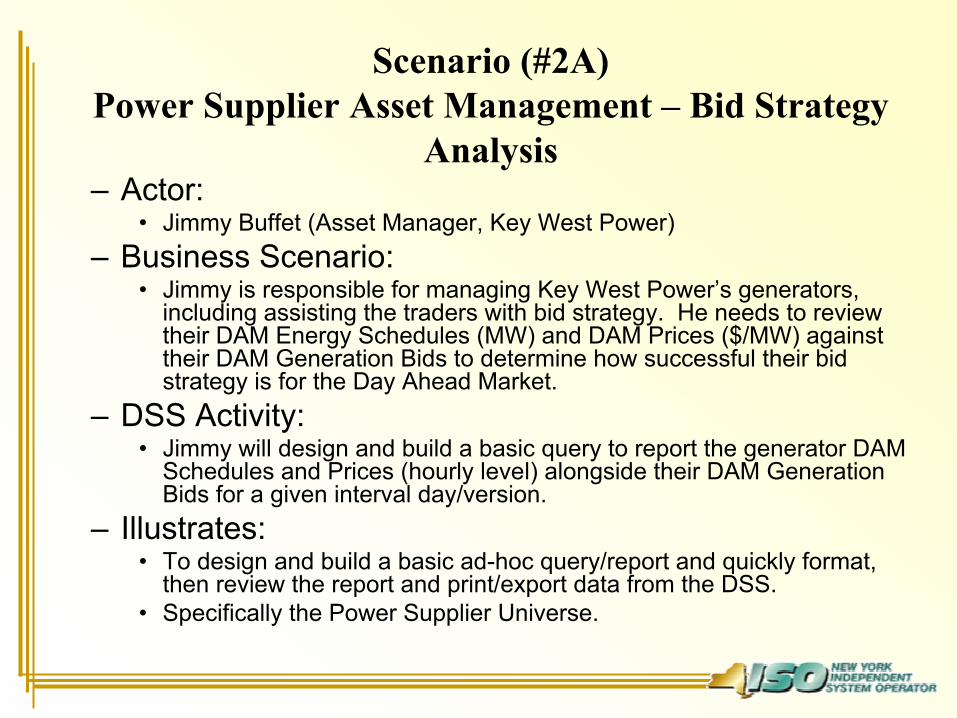
– Actor: • Jimmy Buffet (Asset Manager, Key West Power)
– Business Scenario: • Jimmy is responsible for managing Key West Power’s generators,
including assisting the traders with bid strategy. He needs to review their DAM Energy Schedules (MW) and DAM Prices ($/MW) against their DAM Generation Bids to determine how successful their bid strategy is for the Day Ahead Market.
– DSS Activity: • Jimmy will design and build a basic query to report the generator DAM
Schedules and Prices (hourly level) alongside their DAM Generation Bids for a given interval day/version.
– Illustrates: • To design and build a basic ad-hoc query/report and quickly format,
then review the report and print/export data from the DSS.• Specifically the Power Supplier Universe.
Scenario (#2A)Power Supplier Asset Management – Bid Strategy
Analysis

– Universe = Customer Settlements – Power Suppliers– Results Set =
– Org Name, Gen Name, Gen PTID– Interval Day-Version, Interval Start Hour (Eastern)– Hr DAM Sched Gen (MW)– DAM Total Price - Gen ($/MW)– Hr DAM Gen Bid Type Ind, DAM Gen Bid Dispatch Seg – Block, DAM Gen Bid Dispatch Seg - Curve– Hr DAM Gen Bid – Min Gen (MW)– Hr DAM Gen Bid – Min Gen Cost ($)– Hr DAM Gen Bid – Gen 1-6 (MW)– Hr DAM Gen Bid – Price 1-6 ($/MW)
– Conditions = – Interval Day-Version = 09/23/2003 V2– Organization Name = Organization 34601
– Formatting / Actions:– Rearrange column order– Expand column widths to show data– Apply wrap text feature to column headers & widen row to display text– Change report title to something like “DAM Schedule vs. DAM Gen Bid”– Change text characteristics on report title (font, centered, color, etc.)– Apply a section break to Org Name, Gen Name/PTID, and add a subtotal to the DAM Schedule (MW) column– Insert cell for literal text on Org Name and Gen Name/PTID, & re-arrange so that literal precedes values
Scenario (#2A)Power Supplier Asset Management – Bid Strategy
Analysis

– Actor: • Minnie Mouse (Energy Procurement, Imagination Land)
– Business Scenario: • Minnie is responsible for purchasing energy to meet Imagination Land’s
power demand. After real time consumption, she maintains a report that summarizes actual load vs. their forecasted load, with their load bids, by load bus. Minnie needs to obtain the data for the report for the past couple of days to update her report.
– DSS Activity: • Minnie will design and build a basic query to report the company’s real-time
actual load (MWh), forecasted load (MW) (from their bids), and their fixed and price capped load bids.
– Illustrates: • To design and build a basic ad-hoc query/report to quickly review, and
print/export data, in/from the DSS• Specifically the Load Serving Entity Universe, real-time actual load (MWh),
forecasted load (MW) (from their bids), and load bids.
Scenario (#2B)Load Serving Entity – Energy Procurement Strategy
Analysis

– Universe = Customer Settlements – Loads– Results Set =
– Org Name– LSE Name, LSE PTID– Load Bus Name, Load Bus PTID– Interval Day-Version, Interval Start Hour (Eastern)– Hr RT Actual Load (MWh)– Hr DAM Load Bid Frcst Load (MW)– Hr DAM Load Bid -Fix Load (MW)– Hr DAM Load Bid PrCap -Pr 1-3 ($/MW), Hr DAM Load Bid PrCap -Ld 1-3 (MW)
– Conditions = – Interval Day-Version = 09/10/2003 V2– Organization Name = Organization 31049
– Formatting / Actions:– Rearrange column order– Expand column widths to show data– Apply wrap text feature to column headers & widen row to display text– Change report title to something like “Load (Actual & Forecast) vs. Load Bid”– Change text characteristics on report title (font, centered, color, etc.)– Apply a section break to Org Name, LSE Name/PTID, Load Bus Name/PTID, Interval Day, & add a
subtotal to actual and forecast load– Insert cell for literal text on all section breaks, and re-arrange so that literal precedes values
Scenario (#2B)Load Serving Entity – Energy Procurement Strategy
Analysis

Scenario (#2C)Transaction Customer – Management Reporting
– Actor: • Bill Apprentice (Energy Purchasing Director, Trumpet Properties)
– Business Scenario: • Bill won the contest, and is now responsible for acquiring energy for
several major Trumpet-owned corporate buildings in NYC. He has decided to purchase the energy from the NYISO markets. His new boss Don is requesting a daily month-to-date report showing the total direct costs of the energy by Transaction Contract by day for the given month.
– DSS Activity: • Joe will design and build a basic query to report the company’s daily
Market Energy Exports (LBMP) settlements, including the Bid CostGuarantee settlement, if applicable.
– Illustrates: • To design and build a basic ad-hoc query/report to quickly review,
and print/export data, in/from the DSS• Specifically the Transaction Customer Universe, DAM & Balancing
Market Energy settlements, and Bid Cost Guarantee.

– Universe = Customer Settlements – Transactions– Results Set =
– TC Org Name– TransCnt ID– Interval Start Day (Eastern)– Day DAM Total LBMP Stlmnt ($)– Day BalMkt Total LBMP Stlmnt ($)– Day DAM Trans BPCG ($)– Day RT Trans BPCG ($)
– Conditions = – TransCnt Transaction Type = “LBMP”– TransCnt Transaction Category = “Export”– TC Org Name = Organization 31635– Month Year Tag = <PROMPT> - use September 2003– Latest Version Ind = “Y”
– Formatting / Actions:– Rearrange column order– Expand column widths to show data– Apply wrap text feature to column headers & widen row to display text– Change report title to something like “Trumpet Towers Daily Energy Report”– Change text characteristics on report title (font, centered, color, etc.)– Apply a section break to TC Org Name, & add a subtotal to all settlement columns– Insert cell for literal text on all section breaks, and re-arrange so that literal precedes values
Scenario (#2C)Transaction Customer – Management Reporting

Scenario (#2D)Load Serving Entity - Ancillary Service Analysis
– Actor: • Monica Friend (Settlement Analyst, Load.com)
– Business Scenario: • Monica’s company purchased load from NYISO during the given
month, and has been actively monitoring their direct energy costs. But at the end of the month, Monica is responsible for reportingand verifying the overhead costs (LSE Ancillary Services and other allocations/charges). So, she needs to create a report that shows all of their LSE AS allocations/charges for Load.com by day and by allocation/charge for the given month.
– DSS Activity: • Monica will design and build a report that shows all LSE AS
settlement results ($) by day by allocation/charge for the givenmonth.
– Illustrates: • To design and build a basic ad-hoc query/report to quickly review,
and print/export data, in/from the DSS• Specifically the Load Universe, LSE Ancillary Service settlements.
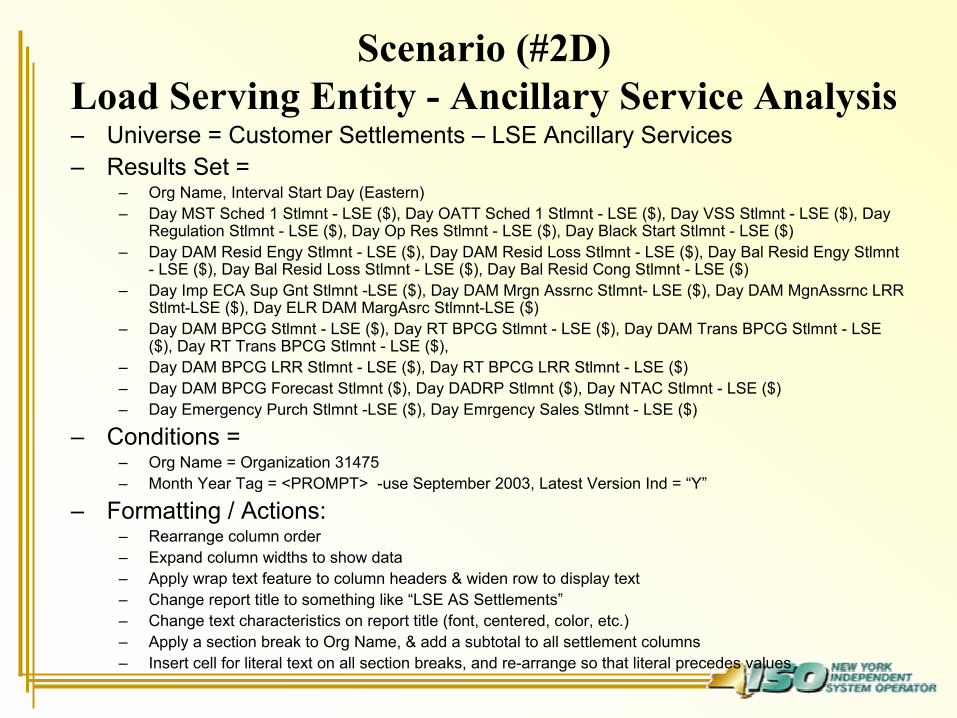
Scenario (#2D)Load Serving Entity - Ancillary Service Analysis– Universe = Customer Settlements – LSE Ancillary Services– Results Set =
– Org Name, Interval Start Day (Eastern)– Day MST Sched 1 Stlmnt - LSE ($), Day OATT Sched 1 Stlmnt - LSE ($), Day VSS Stlmnt - LSE ($), Day
Regulation Stlmnt - LSE ($), Day Op Res Stlmnt - LSE ($), Day Black Start Stlmnt - LSE ($)– Day DAM Resid Engy Stlmnt - LSE ($), Day DAM Resid Loss Stlmnt - LSE ($), Day Bal Resid Engy Stlmnt
- LSE ($), Day Bal Resid Loss Stlmnt - LSE ($), Day Bal Resid Cong Stlmnt - LSE ($)– Day Imp ECA Sup Gnt Stlmnt -LSE ($), Day DAM Mrgn Assrnc Stlmnt- LSE ($), Day DAM MgnAssrnc LRR
Stlmt-LSE ($), Day ELR DAM MargAsrc Stlmnt-LSE ($)– Day DAM BPCG Stlmnt - LSE ($), Day RT BPCG Stlmnt - LSE ($), Day DAM Trans BPCG Stlmnt - LSE
($), Day RT Trans BPCG Stlmnt - LSE ($), – Day DAM BPCG LRR Stlmnt - LSE ($), Day RT BPCG LRR Stlmnt - LSE ($)– Day DAM BPCG Forecast Stlmnt ($), Day DADRP Stlmnt ($), Day NTAC Stlmnt - LSE ($)– Day Emergency Purch Stlmnt -LSE ($), Day Emrgency Sales Stlmnt - LSE ($)
– Conditions = – Org Name = Organization 31475– Month Year Tag = <PROMPT> -use September 2003, Latest Version Ind = “Y”
– Formatting / Actions:– Rearrange column order– Expand column widths to show data– Apply wrap text feature to column headers & widen row to display text– Change report title to something like “LSE AS Settlements”– Change text characteristics on report title (font, centered, color, etc.)– Apply a section break to Org Name, & add a subtotal to all settlement columns– Insert cell for literal text on all section breaks, and re-arrange so that literal precedes values
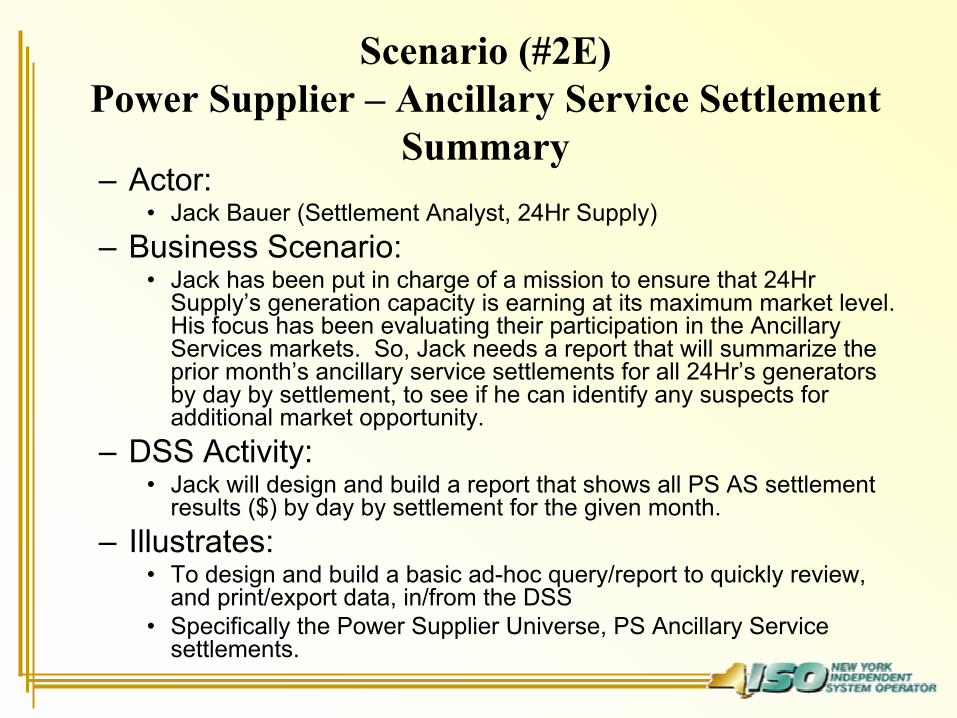
Scenario (#2E) Power Supplier – Ancillary Service Settlement
Summary– Actor:
• Jack Bauer (Settlement Analyst, 24Hr Supply)– Business Scenario:
• Jack has been put in charge of a mission to ensure that 24Hr Supply’s generation capacity is earning at its maximum market level. His focus has been evaluating their participation in the Ancillary Services markets. So, Jack needs a report that will summarize the prior month’s ancillary service settlements for all 24Hr’s generators by day by settlement, to see if he can identify any suspects foradditional market opportunity.
– DSS Activity: • Jack will design and build a report that shows all PS AS settlement
results ($) by day by settlement for the given month.– Illustrates:
• To design and build a basic ad-hoc query/report to quickly review, and print/export data, in/from the DSS
• Specifically the Power Supplier Universe, PS Ancillary Service settlements.

Scenario (#2E) Power Supplier – Ancillary Service Summary
– Universe = Customer Settlements – PS Ancillary Services– Results Set =
– Org Name, Gen Name, Interval Start Day (Eastern)– Day Black Start Stlmnt ($), Day VSS Stlmnt ($), Day VSS LOC Stlmnt ($)– Day DAM Reg Avail Stlmnt ($), Day SUP Reg Avail Stlmnt ($), Day Reg Replacement Cost ($), Day Reg
Penalty ($)– Day DAM 10Sync Avail Stlmnt ($), Day Sup 10Sync Avail Stlmnt ($), Day 10Sync Reduct Stlmnt ($)– Day DAM 10NSync Avail Stlmnt ($), Day Sup 10NSync Avail Stlmnt ($), Day 10NSync Reduct Stlmnt ($)– Day DAM 30Min Avail Stlmnt ($), Day Sup 30Min Avail Stlmnt ($), Day 30Min Reduct Stlmnt ($) – Day Op Res LOC Stlmnt ($), Day Adj 10NSync LOC Stlmnt ($), – Day 10Min Shortfall Stlmnt ($)
– Conditions = – Org Name = Organization 26201– Month Year Tag = <PROMPT> - use September 2003, Latest Version Ind = “Y”
– Formatting / Actions:– Rearrange column order– Expand column widths to show data– Apply wrap text feature to column headers & widen row to display text– Change report title to something like “PS AS Settlement Summary”– Change text characteristics on report title (font, centered, color, etc.)– Apply a section break to Org Name and Gen Name & add a subtotal to all settlement columns– Insert cell for literal text on all section breaks, and re-arrange so that literal precedes values

Saving, Printing, Exporting…
• Once a report has been created, it can be:– Saved as a Business Objects Report (template)– Saved As a report with data and formatting– Printed to hardcopy– Exported to other applications (i.e. Excel)
BO Automatic Summation Feature(“pink circles and blue boxes”)
• Business Objects will automatically roll-up data in your query to the lowest level of dimensional data granularity– So, if your data is from the SCD-level and the
lowest dimensional grain in your query is hourly, your SCD data will be summed and reported at the hour.

BO Automatic Summation Feature(“pink circles and blue boxes”)
• But, what is summed and what defines the lowest dimensional grain?– “Pink Circles” are the summable objects that
will be automatically rolled-up – “Blue Boxes” are the data elements that define
the lowest level dimensional grain• NOTE: Summable (pink circles) vs. Non-
summable (blue boxes) is not exactly the same as factual and dimensional
Business Scenarios Intermediate Custom Queries & Reports
• Scenario (#3A) - Summarize LSE Balancing Market Settlement Results
• Scenario (#3B) - Summarize Transaction Contracts• Scenario (#3C) - Summarize PS Energy Settlement Results
Scenario (#3A)Summarize LSE Balancing Market Settlement Results– Actor:
• Jennifer Load (Settlement Analyst, MicroLoad)– Business Scenario:
• Jennifer’s management team needs her to provide them a report summarizing how much balancing energy charges they incurred during TBD (given month). They asked to see it totaled for the month by load bus, but they also would like to see the daily result details.
• It might also be helpful for them to see it totaled by zone and subzone.– DSS Activity:
• So, Jennifer will use the DSS to create a set of custom reports:• BalMkt Load $ for a month by LSE/Load Bus• BalMkt Load $ for a month by Day/LSE/Load Bus• BalMkt Load $ for a month by Day/Zone/Subzone
– Illustrates: • To create a set of ad-hoc queries/reports which summarize NYISO
settlement results using several different dimensions• Specifically to review the LSE Universe, Balancing Market Settlement results,
and the DSS’s automatic summation feature.

– Universe = Customer Settlements – Loads– 1st Report Results Set =
– Org Name– LSE Name, Load Bus Name– Month Year Tag– Hr Total BalMkt Stlmnt - LSE ($)– Hr BalMkt Cong Stlmnt - LSE ($)– Hr BalMkt Energy Stlmnt - LSE ($)– Hr BalMkt Loss Stlmnt - LSE ($)
– 2nd Report– ADD = Interval Start Day (Eastern)
– 3rd Report – REMOVE:
– LSE Name– Load Bus Name
– ADD:– Subzone Name– Zone Name
– Conditions (all 3 reports) = – Month Year Tag = September 2003– Organization Name = Organization 31139– Invoice Version = 2
Scenario (#3A)Summarize LSE Balancing Market Settlement Results
Scenario (#3B)Summarize Transaction Contracts
– Actor: • Javier Lopez (Settlement Manager, PowerSchedulers)
– Business Scenario: • Javier wants to create a report which summarizes all of PowerSchedulers’
NYISO energy transactions for a given period of time. He’d like one report which shows total settlements for his Organization by day and Transaction Category, and a second report which provides the supporting details by Transaction Contract (including source & sink locations) by hour.
– DSS Activity: • So, Javier will use the DSS to create a set of custom reports:
• Transaction details and results for a range of days:• by organization/transaction category/day• by organization/transaction contract/hour
– Illustrates: • To create a set of ad-hoc queries/reports which summarize NYISO
settlement results using several different dimensions• Specifically to review the Transaction Customer Universe, DAM & Balancing
Market Settlement results, and the DSS’s automatic summation feature.
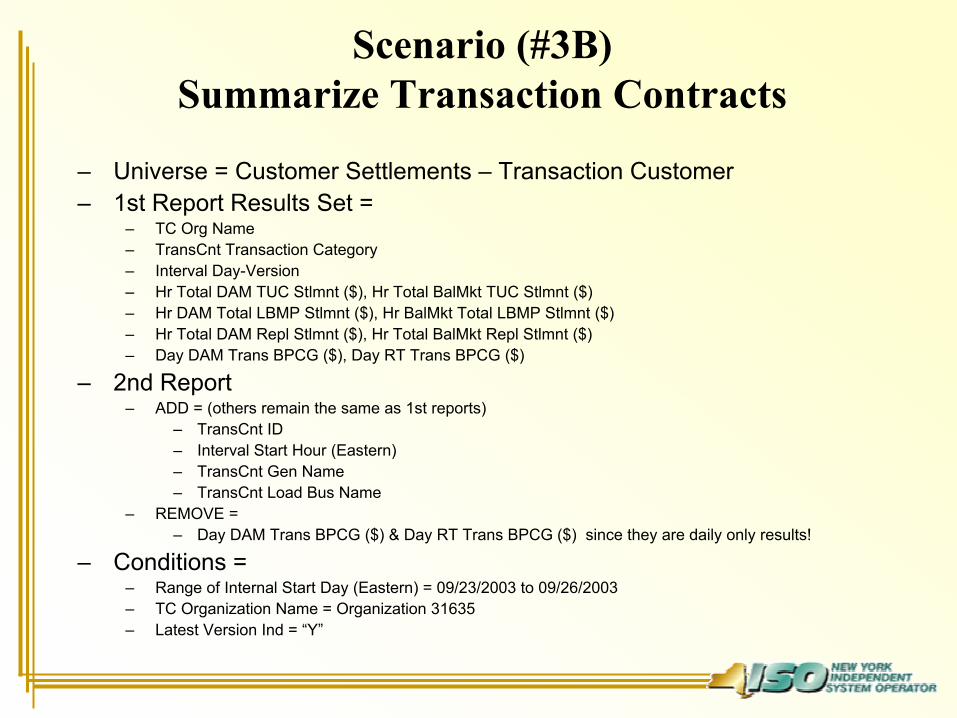
– Universe = Customer Settlements – Transaction Customer– 1st Report Results Set =
– TC Org Name– TransCnt Transaction Category– Interval Day-Version– Hr Total DAM TUC Stlmnt ($), Hr Total BalMkt TUC Stlmnt ($)– Hr DAM Total LBMP Stlmnt ($), Hr BalMkt Total LBMP Stlmnt ($) – Hr Total DAM Repl Stlmnt ($), Hr Total BalMkt Repl Stlmnt ($)– Day DAM Trans BPCG ($), Day RT Trans BPCG ($)
– 2nd Report– ADD = (others remain the same as 1st reports)
– TransCnt ID– Interval Start Hour (Eastern)– TransCnt Gen Name– TransCnt Load Bus Name
– REMOVE = – Day DAM Trans BPCG ($) & Day RT Trans BPCG ($) since they are daily only results!
– Conditions = – Range of Internal Start Day (Eastern) = 09/23/2003 to 09/26/2003– TC Organization Name = Organization 31635– Latest Version Ind = “Y”
Scenario (#3B)Summarize Transaction Contracts
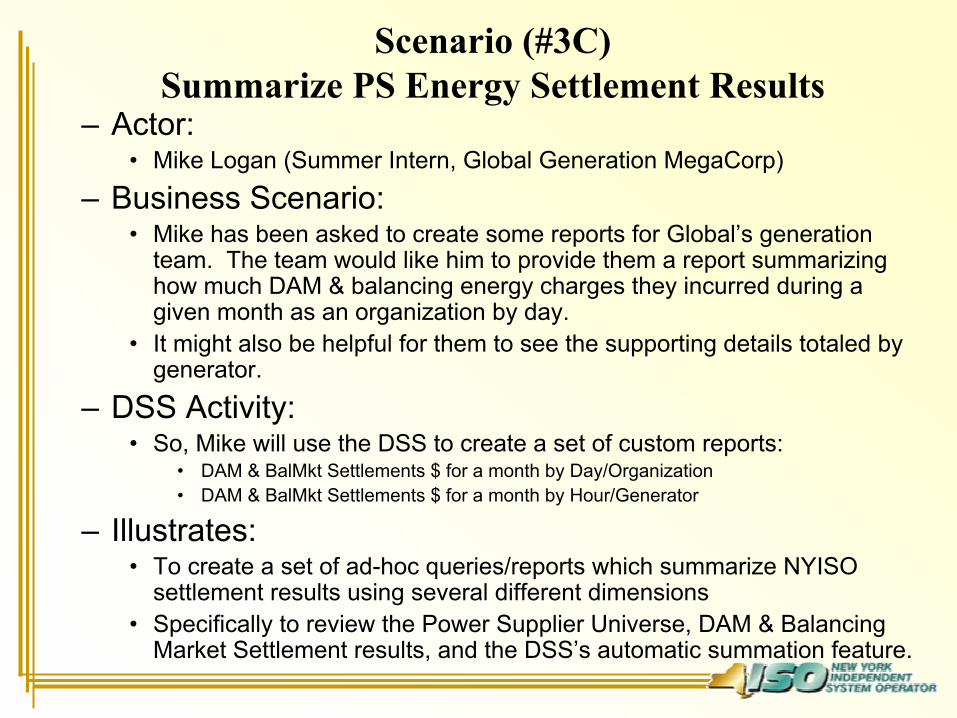
Scenario (#3C)Summarize PS Energy Settlement Results
– Actor: • Mike Logan (Summer Intern, Global Generation MegaCorp)
– Business Scenario: • Mike has been asked to create some reports for Global’s generation
team. The team would like him to provide them a report summarizing how much DAM & balancing energy charges they incurred during a given month as an organization by day.
• It might also be helpful for them to see the supporting details totaled by generator.
– DSS Activity: • So, Mike will use the DSS to create a set of custom reports:
• DAM & BalMkt Settlements $ for a month by Day/Organization• DAM & BalMkt Settlements $ for a month by Hour/Generator
– Illustrates: • To create a set of ad-hoc queries/reports which summarize NYISO
settlement results using several different dimensions• Specifically to review the Power Supplier Universe, DAM & Balancing
Market Settlement results, and the DSS’s automatic summation feature.
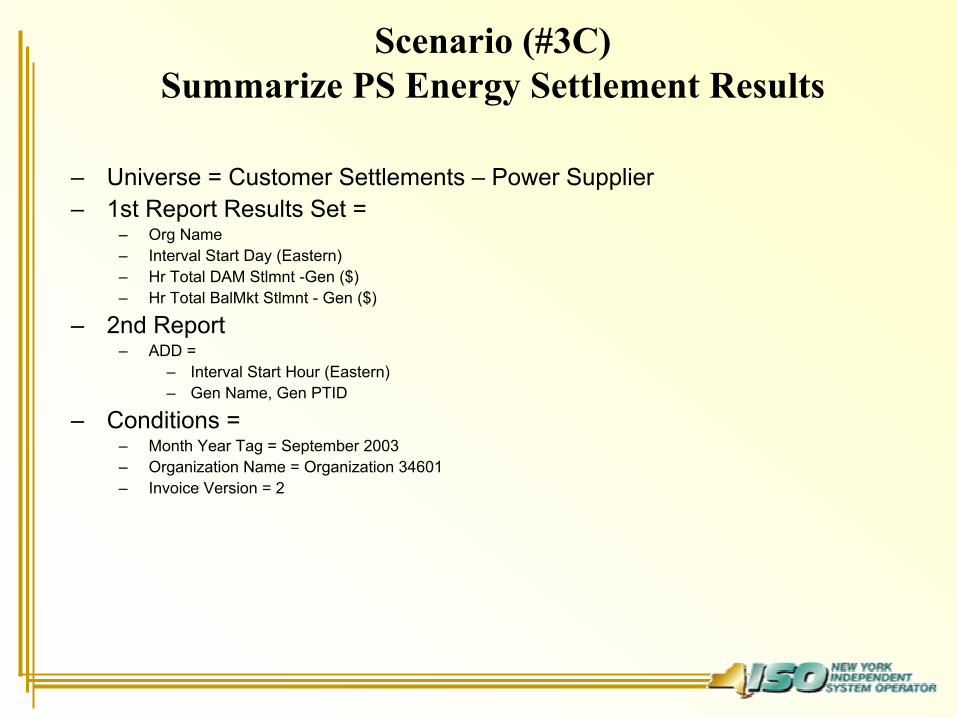
– Universe = Customer Settlements – Power Supplier– 1st Report Results Set =
– Org Name– Interval Start Day (Eastern)– Hr Total DAM Stlmnt -Gen ($)– Hr Total BalMkt Stlmnt - Gen ($)
– 2nd Report– ADD =
– Interval Start Hour (Eastern)– Gen Name, Gen PTID
– Conditions = – Month Year Tag = September 2003– Organization Name = Organization 34601– Invoice Version = 2
Scenario (#3C)Summarize PS Energy Settlement Results

Additional Intermediate Features(Time Permitting)
• Multiple tables and tabs in a single report.• Data can be presented graphically (charts
and graphs).• Reports can be created with data from
multiple universes.• Data can be calculated from the data
elements provided.
Using Web Intelligence
• Another alternative BO Toolset.• Recommended only for:
– Simple data queries, with limited analysis and formatting.
– Straightforward data collection.– Easy exports to MS Excel.
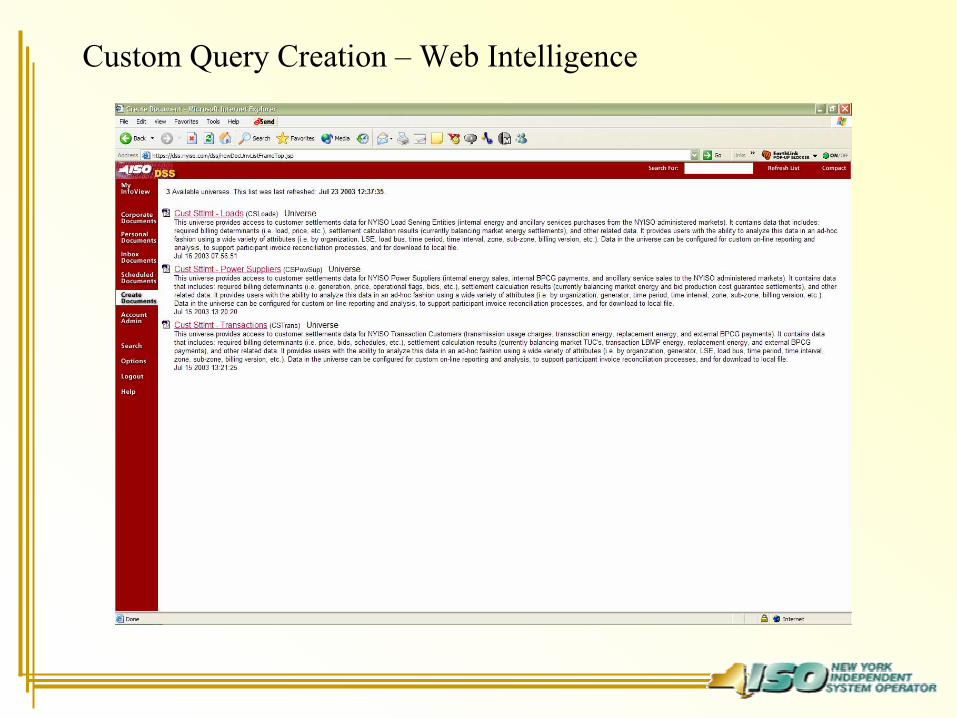
Custom Query Creation – Web Intelligence

Custom Query Creation – Web Intelligence (Main Panel)