NY-13-0658 2013 Assessing Tax Benchmarking Study
56
The Industrial Products & Services and Automotive. Tax Executive Roundtable 2011 Assessing tax 2013 tax rate benchmarking study for industrial products and automotive sectors Special report: Comprehensive tax reform
Transcript of NY-13-0658 2013 Assessing Tax Benchmarking Study

The Industrial Products & Services and Automotive. Tax Executive Roundtable 2011
Assessing tax2013 tax rate benchmarking study for industrial products and automotive sectors
Special report: Comprehensive tax reform

Welcome to the 2013 edition of Assessing tax, a benchmarking study for industrial products and automotive sectors. This year’s report provides a detailed analysis of tax rate metrics for 316 companies to highlight related trends overall and by each underlying sector. Tax rate benchmarking can give company executives valuable data and insight into their tax functions, helping them to evaluate departmental strategy and performance.
This year’s edition begins with a special report on comprehensive tax reform. Addressing multiple perspectives on the issue, the discussion delves into approaches to tax reform, recent tax reform developments, and the opportunities and potential impacts of business tax reform, both domestic and international. Additionally, the report outlines recent tax reform proposals, and how efforts such as the House Ways and Means Committee bipartisan working groups and the Senate Finance Committee bipartisan member meetings are helping to drive toward tax reform legislation.
We hope you find the special report and tax rate benchmarking analysis insightful, and that the information may serve as a useful tool for supporting your organization’s tax strategy.

Table of contents
Special report: 2
Comprehensive tax reform
Benchmarking overview: 15
Tax rate benchmarking for industrial products and automotive sectors
Benchmarking by sector: 24
Tax rate benchmarking overview for key sectorsAerospace & Defense sector 24 Automotive sector 28 Chemicals sector 33 Engineering & Construction sector 38 Industrial Manufacturing & Metals sector 43 Transportation & Logistics sector 47
Appendix: 52
Source of information and analysis
Contacts: 54

2 Assessing tax: 2013 tax rate benchmarking study
Introduction
President Obama, key members of Congress, and the American business community generally agree that substantive tax reform is needed. Some proponents see tax reform as an opportunity to improve the global competitiveness of American businesses, attract investment to the United States, and increase domestic job growth. Others _ eyeing projections of significant future deficits _ believe comprehensive tax reform also could be an important element of an overall deficit reduction package in which spending cuts are combined with revenue increases.
On the corporate side, the US tax system is viewed as out of line with the tax systems of other developed nations. The combined federal and state statutory corporate tax rate in the US is the highest among Organisation for Economic Co-operation and Development (OECD) countries. The US system of worldwide taxation also stands in contrast to the use by most other OECD countries of territorial tax systems, which generally exempt from tax the active business earnings of foreign subsidiaries.
Many analysts believe that the present US worldwide tax system reduces the ability of American companies to compete effectively in foreign markets. Others highlight that the present system imposes a substantial barrier to repatriation of earnings for use in the US economy, noting that foreign earnings held by foreign subsidiaries cannot be remitted to their US parents without incurring an additional layer of tax.
Designing a comprehensive tax reform proposal for full consideration by Congress will require considerable efforts. The groundwork for reform has included Administration proposals, Congressional hearings, the introduction of tax reform bills, the development of draft tax reform proposals by members of Congress and their staffs, and other tax reform related initiatives.
Approaches to tax reform
President Obama and Congressional leaders have put forth general tax reform principles in an effort to set the stage for an overhaul of US tax law. In general, the president, as well as House Republican leaders, have proposed a significant corporate rate reduction that would be offset by ‘base-broadening’ measures _ that is, by limiting or repealing certain tax deductions, exclusions, credits, or preferences.
Because businesses could be significantly affected by emerging tax reform efforts, many companies and trade associations are actively engaged in assessing the potential impacts of tax reform, and have been participating in ongoing Congressional hearings and meetings with members of Congress and their staffs.
Members of Congress differ as to whether tax reform should serve to raise revenue or be entirely revenue-neutral. The president and House Republicans both have called for revenue-neutral corporate tax reform; at the same time, the president has proposed tax increases on upper-income individuals to reduce federal budget deficits. Some Democratic lawmakers disagree with the president on business reform and argue that tax reform should contribute to deficit reduction. Allocating part of the revenue that could be raised from base-broadening measures to deficit reduction would
Special report:
Comprehensive tax reform

3 Assessing tax: 2013 tax rate benchmarking study
affect the extent to which corporate and individual tax rates could be reduced if the cost of rate reduction has to be fully offset.
Following enactment of H.R. 8, the American Taxpayer Relief Act, which prevented scheduled tax increases for many individuals, Republican Congressional leaders have said they will not consider any additional tax increases. In a floor speech, House Ways and Means Chairman Dave Camp (R-MI) said the fiscal cliff legislation “settles the level of revenue Washington should bring in,” adding that “by making Republican tax cuts permanent we are one step closer to comprehensive tax reform.” The House on March 22, 2013, adopted a fiscal year 2014 budget resolution (H. Con. Res 25) that would achieve a balanced budget over ten years through spending cuts only and no tax increases.
Senate Finance Chairman Max Baucus (D-MT) stated at an April 11, 2013 Finance Committee hearing on president Obama’s fiscal 2014 budget that some of the revenue from base broadening “should be used to cut taxes for America’s families and help our businesses create jobs, and some of the revenue raised in tax reform should also be used to reduce the deficit.” The Senate on March 23, 2013 adopted a fiscal year 2014 budget resolution (S. Con. Res. 8) that includes $975 billion in tax increases as part of a ten-year, $1.85 trillion deficit reduction plan.
Whether deficit reduction should be one goal of tax reform will continue to be a fundamental issue in the ongoing debate. As a result, some observers believe that enacting tax reform may require a broader, bipartisan agreement on the federal budget and deficit reduction.
Recent tax reform developments
The House Ways and Means and Senate Finance Committees during the last Congress held more than 50 hearings on tax reform issues. Many of those hearings focused on the fact that the US has one of the highest corporate tax rates in the world and that most of our major trading partners have adopted territorial tax systems. These hearings also examined a range of other business tax issues, including enhanced incentives for innovation, the tax treatment of debt and equity, and the tax treatment of financial products.
The Ways and Means and Finance Committees continue to move forward this year on developing comprehensive tax reform proposals. Chairman Camp established bipartisan tax reform ‘working groups’ to gather feedback on designated issues. In addition, Chairman Camp has said he intends that the Ways and Means Committee will hold a tax reform markup later this year. The Finance Committee has begun holding weekly bipartisan member meetings on tax reform
with the goal of developing a comprehensive tax reform plan.
Chairman Camp discussion drafts
As an important step in the tax reform process, Ways and Means Chairman Camp has issued three discussion drafts, described in more detail below, that could be components of a future Ways and Means tax reform bill.
In October 2011, Camp released for public comment an international tax reform discussion draft that proposes a 25 percent top corporate tax rate and a 95 percent dividends received deduction (DRD) for active foreign business earnings. That discussion draft marks a significant milestone in advancing tax reform because it is a detailed proposal to restructure the way the US taxes global business operations. The draft reflects an objective that international tax reform should be revenue-neutral.
On January 24, 2013, Camp released a discussion draft to reform the taxation of financial products. On March 12, 2013, he released a small business and pass-through discussion draft that includes two options to reform the tax treatment of S corporations and partnerships: (1) revisions to the existing tax rules, or (2) a new, unified pass-through regime.

4 Assessing tax: 2013 tax rate benchmarking study
Ways and Means tax reform working groups
The House Ways and Means Committee, on February 13, 2013, announced the formation of 11 bipartisan tax reform working groups to examine designated tax issues. These include international, manufacturing, pensions and retirement, energy, financial services, and debt, equity, and capital. The working groups engaged in fact finding and information gathering but were not directed to make any policy recommendations. The working groups generally completed their work on April 15, and the staff of the Joint Committee on Taxation (JCT) by May 6 was required to submit a final report summarizing current law, policy options, and public comments received by the working groups.
Senate Finance Committee member deliberations
Finance Chairman Baucus on March 14, 2013 outlined plans for the committee to develop tax reform legislation. Specifically, the Finance Committee has begun holding weekly bipartisan member meetings to discuss tax reform options and explore areas of common ground. Designated topics include international taxation, and business investment and innovation. An April 11, 2013 option paper on business investment and innovation discussed the research credit, depreciation, domestic manufacturing deduction, LIFO, and like-kind exchanges.
President’s FY 2014 budget
On April 10, 2013, the president submitted to Congress a fiscal year 2014 budget with a ten-year, $1.8 trillion deficit reduction plan that includes $583 billion in additional revenue from upper-income individuals. The president’s budget also ‘reserves’ more than $300 billion in international and other business tax increases for revenue-neutral corporate tax reform.
While not providing a specific tax reform plan, the president’s budget calls on Congress to work with the Administration on “corporate tax reform that will close loopholes, lower the corporate tax rate, encourage investment at home, and not add a dime to the deficit.” The budget does not propose a target corporate
tax rate, but does reference the president’s 2012 framework for business tax reform, which called for a 28 percent top corporate tax rate and reduced rates for certain domestic manufacturing activities.
Corporate tax reform
The dynamics of corporate tax reform principally revolve around how low the tax rate should be reduced in order to promote US investment, job creation, and competitiveness; the required trade-off in terms of base broadening to offset revenue losses from rate reduction and potentially provide for deficit reduction; and whether the US should adopt a territorial tax system or make other more limited reforms to its worldwide system of taxation.
20
25
30
35
40
45
50
2012
2011
2010
2009
2008
2007
2006
2005
2004
2003
2002
2001
2000
1999
1998
1997
1996
1995
1994
1993
1992
1991
1990
1989
1988
1987
1986
1985
1984
1983
1982
1981
Figure 1—International Competitiveness
OECD Avg (Excluding US)US
Since 1988, the average OECD statutory corporate tax rate (excl. US) has fallen by over 19 percentage points, while the US federal rate has increased by one percentage point.
Source: OECD Tax Database, 2012.The current U.S. rate is based on the 35-percent federal tax rate and average state taxes of 6.36 percent. Since state taxes are deductible from federal taxes, the net combined tax rate is 39.1 percent.
Com
bin
ed n
atio
nal a
nd s
ub-n
atio
nal
top
cor
por
ate
tax
rate
39.1
25.0

5 Assessing tax: 2013 tax rate benchmarking study
Corporate tax rate
Since Japan reduced its corporate tax rate in April 2012, the US has had the highest corporate tax rate among advanced nations. Including state taxes, the US combined statutory tax rate of 39.1 percent was more than 50 percent higher than the 25 percent average statutory corporate tax rate of other OECD countries in 2012. The average rate in the rest of the OECD, including national and local taxes, declined by 19 percentage points between 1988 and 2012; by contrast, the US rate increased slightly over this same period (see Figure 1).
A major bipartisan objective of corporate tax reform is to provide significant rate reduction to improve the attractiveness of the US for investment and job growth and the ability of US multinationals to compete in the global economy.
Ways and Means Chairman Camp’s proposal for a 25 percent federal corporate rate would result in a combined federal and state rate of just under 30 percent. This would move the US from having the highest tax rate in the 34-country OECD to the eighth-highest, and from the highest in the G-7 to the fourth highest.
The JCT estimates that, absent any offsetting provisions, each percentage point reduction in the US corporate tax rate would reduce tax collections by approximately $100 billion over the next ten years. Accordingly, the 10 percentage point reduction in the
corporate tax rate proposed by Chairman Camp would require approximately $1 trillion in offsetting base-broadening provisions for the rate reductions to be scored as revenue-neutral by JCT revenue estimators.
Among major developed countries recently reducing corporate tax rates, the United Kingdom last year announced an additional corporate rate reduction, lowering its rate to 23 percent effective April 1, 2013; to 21 percent effective April 1, 2014; and to 20 percent effective April 1, 2015. Japan lowered its corporate rate by approximately 2.5 percentage points in April 2012 and has scheduled an additional 2.5 percentage point reduction in 2015. Canada, the largest US trading partner, reduced its federal corporate tax rate to 15 percent in 2012. Including provincial taxes, the combined corporate rate in Canada is approximately 25 percent, roughly 15 percentage points lower than its rate in 2000.
High statutory and high effective rates of taxation
Although there is increasing recognition that the US has a higher statutory corporate tax rate than other OECD countries, it is less well known that the effective tax rate (ETR) of American corporations also is generally higher than that of companies headquartered outside the US.
Statutory tax rates are important for many business investment decisions because they govern the taxation of taxable income, after taking into consideration deductions, exclusions, credits, and preferences. Effective tax rates, in contrast, measure the rate of tax relative to alternative measures of income; “book” ETRs, for example, measure tax payments relative to financial statement income. Both statutory and ETRs are important for assessing the overall impact of the US corporate tax system on American companies.
According to a comprehensive cross-country study of financial statement information by academic researchers, American companies on a worldwide basis had the second-highest ETR among multinationals from all countries. The study estimates the ETR of US multinationals between 2005 and 2009 to be 30 percent, with Japan having the highest effective rate at 39 percent. Effective tax rates for multinationals based in other G-7 countries were 26 percent for Canada, 28 percent for France, 29 percent for Germany, and 26 percent for the UK.
Some argue that the US effective corporate tax rate is lower than that of other advanced economies, citing the fact that the amount of corporate income tax revenue in the US as a percentage of gross domestic product (GDP) is below the OECD average.

6 Assessing tax: 2013 tax rate benchmarking study
For example, between 2005 and 2007, corporate taxes as a share of GDP averaged about 3.2 percent in the US, compared with about 3.8 percent in the rest of the OECD.
However, the US has a substantially greater share of businesses, including larger businesses, that operate in forms not subject to corporate-level taxation, including sole proprietorships, partnerships, and S corporations, than do other OECD countries, as shown in Figure 2 below. In total, more than half of business income in the US is earned by businesses that are taxed directly under the individual income tax system rather than through the corporate tax system. As a result, comparisons of corporate tax collections in the US with other countries that have a smaller share of business income outside the corporate tax system can be misleading.
Corporate base broadening
To offset the revenue loss from a rate reduction, reform proposals that seek to be revenue-neutral are expected to broaden the corporate tax base by repealing or limiting deductions, exclusions, and credits. Base broadening proposals are likely to focus on tax expenditures which JCT defines as “revenue losses attributable to provisions of the federal tax laws which allow a special exclusion, exemption, or deduction from gross
income or which provide a special credit, a preferential rate of tax, or a deferral of tax liability.”
Potential revenue resulting from eliminating various business tax expenditures can be seen in a JCT analysis prepared in October 2011 at the request of Ways and Means Ranking member Sander Levin (D-MI). In that analysis, JCT estimated that elimination of approximately 40 corporate tax expenditures _ accounting for most of the major corporate tax expenditures _ would raise sufficient revenue to
reduce the corporate tax rate to 28 percent in a revenue-neutral manner.
Seven corporate tax expenditures account for 95 percent of the base broadening achieved in the JCT analysis: accelerated depreciation, expensing of research and experimental expenditures, the Section 199 domestic production activities deduction, the last-in first-out (LIFO) inventory accounting method, the tax credit for low-income housing, deferral of gain on like-kind exchanges, and the completed contract method. A ‘very preliminary’ JCT estimate of the ten-year revenue
0%
20%
40%
60%
80%
100%
Figure 2—The US has the largest unincorporated business sectors withinthe OECD
% businesses with taxable profits of $1 million or more% all businesses
Note: Although they are flow-through businesses, S corporations are counted here with other corporations because they are incorporated.Source: US Department of the Treasury, “Treasury Conference on Business Taxation and Global Competitiveness, Background Paper,” July 23, 2007
Mex
ico
Uni
ted
Sta
tes
Italy
Gre
ece
Aus
tria
Uni
ted
Kin
gdom
Slo
vak
Rep
ublic
Ger
man
y
Sw
eden
Nor
way
Aus
tral
ia
Sp
ain
New
Zea
land
Jap
an
Den
mar
k

7 Assessing tax: 2013 tax rate benchmarking study
gain from the repeal of these seven provisions is shown in Figure 3.
While tax reform sometimes is described as repealing loopholes in exchange for rate reduction, this listing of major tax expenditures shows that the bulk of potential revenue offsets are attributable to widely used tax incentives explicitly provided by Congress in the tax code.
The JCT also estimates that approximately $300 billion in additional revenue would be raised over the ten-year budget period if the business tax expenditures were repealed for entities operating in pass-through form (sole proprietorships, partnerships, and S corporations).
How pass-through entities would be treated under tax reform remains to be determined. Some state that corporate tax reform cannot proceed independently of individual tax reform because of
the potential adverse impact on pass-through entities if the business tax base is broadened but there is no rate reduction for the owners of these businesses. Ways and Means Chairman Camp, for example, has stated that comprehensive reform is needed for both individuals and corporations in part for this reason.
As noted below, the Obama Administration has suggested that ‘greater parity’ between large corporations and large pass-through businesses should be considered as part of tax reform. Figure 4, below, illustrates the portion of business income that is earned by corporate and non-corporate entities.
Offsetting the cost of a significant rate reduction could require that base broadening expand beyond provisions specifically identified as tax expenditures by JCT and the Administration. For example, the Administration’s framework for business tax reform, as discussed below, identifies the deductibility of interest for corporations, which is not classified as a tax expenditure, as an issue that should be reviewed as part of tax reform.
Figure 3: Estimated revenue increase from repealing largest tax expenditures attributable to C corporations (2012 – 2021)
Provision 10-Year Amount ($ billions)
Repeal MACRS and apply Alternative Depreciation System 506.8
Repeal expensing of research and experimental expenditures 152.2
Repeal Section 199 domestic production activities deduction 127.0
Repeal LIFO 62.7
Repeal credit for low-income housing 33.0
Repeal deferral of gain on like-kind exchanges 16.0
Repeal completed contract method 13.9
Note: Various effective dates. The JCT staff also reports that estimates currently are unavailable for numerous other tax provisions. Source: Joint Committee on Taxation (October 27, 2011 letter to Rep. Levin)
$0
$500
$1,000
$1,500
$2,000
$2,500
$3,000
2010
2009
2008
2007
2006
2005
2004
2003
2002
2001
2000
1999
1998
1997
1996
1995
1994
1993
1992
1991
1990
1989
1988
1987
1986
1985
1984
1983
1982
1981
1980
Figure 4—Business income subject to tax by entity type, 1980–2010(billions of dollars, excludes RICs and REITs)
C-Corp Share=40%
C-Corp Share=78%
Source: PwC tabulations based on IRS integrated tax database. Passthrough income includes portion flowing to corporate shareholders.
Passthroughs, not RIC/REITC-corporations

8 Assessing tax: 2013 tax rate benchmarking study
International tax reform
Many analysts believe the US international tax system is in urgent need of reform. Some, stressing global competitiveness, believe the present US worldwide system reduces the ability of American companies to compete effectively in foreign markets. Others maintain that the present system imposes a substantial tax barrier to repatriation of earnings for use in the US economy. Some note that the current system results in a relatively small amount of tax collections by the US relative to the foreign income of US companies.
As noted above, the US is one of the few developed countries to tax foreign earnings under a worldwide tax system. All other G-7 countries and 28 of the 34 OECD countries use territorial tax systems (see Figure 5). The UK and Japan are two of the most recent OECD countries to adopt territorial tax systems, with each switching from worldwide systems in 2009. The other countries within the OECD using a worldwide system have low corporate tax rates, averaging 22.3 percent in 2012.
Recent tax reform proposals
President Obama’s international tax proposals
The Obama Administration has continued to demonstrate a strong interest in modifying international provisions of US federal tax law. According to White House officials, the president continues to oppose a ‘pure’ territorial system and supports a minimum tax on overseas profits and reforms intended to reduce shifting income and assets overseas. In Congressional testimony, Treasury Secretary Jack Lew has noted that the United States has a hybrid international tax system and said the Administration is “ready to talk about how to set the dial in our hybrid system in the right place.”
The president’s budget reaffirms the Administration’s support for a minimum tax on foreign earnings but does not specify a proposal to achieve this objective. The president’s budget includes various international revenue-raising tax proposals, many of which are re-proposed from previous Administration budgets. They include the following proposals:
Defer interest expense deduction allocable to deferred foreign earnings
Under this proposal, deductions for interest expense allocable to foreign assets are allowed only to the extent that a US taxpayer earns foreign-source income (FSI). Any such deduction that
Figure 5: 28 of 34 OECD countries have territorial tax systems
Home country tax treatment of foreign-source divided income received by resident corporations
Exemption Foreign tax credit
Australia Greece Portugal Chile
Austria Hungary Slovak Republic Ireland
Belgium Iceland Slovenia Israel
Canada Italy Spain Korea
Czech Republic Japan Sweden Mexico
Denmark Luxembourg Switzerland United States
Estonia Netherlands Turkey
Finland New Zealand United Kingdom
France Norway
Germany Poland
Source: PwC Worldwide Tax Summaries, http://www.pwc.com/gx/en/worldwide-tax-summaries/index.jhtml
Note: Some countries limit dividend exemption to substantial shareholders (e.g., 5 percent or 10 percent owners). In some cases, dividend exemption is limited to treaty countries that impose corporate income tax above a minimum rate. A few countries (e.g., France, Germany, Belgium, and Japan) exempt 95 percent rather than 100 percent of foreign divi-dends. Poland and Greece exempt dividends received only from other EU countries.

9 Assessing tax: 2013 tax rate benchmarking study
is properly allocable or apportionable to FSI not currently taxed in the US would be deferred until an equivalent amount of deferred FSI becomes taxable in the US.
Determine deemed-paid foreign tax credits on a pooling basis
This proposal restricts deemed-paid foreign tax credits (FTCs) of a US-based multinational corporation to the average rate of total foreign income tax actually paid on total foreign earnings. The Administration’s blended foreign tax pool approach would fundamentally change the existing rules, which treat each foreign subsidiary of a US taxpayer as having its own pool of earnings and taxes. The US parent can claim an indirect FTC for foreign taxes paid by those subsidiaries. If each subsidiary has its own pool, the US parent is able to choose when to claim the credits for the respective high- or low-tax foreign income. Under the Administration proposal, taxpayers lose that flexibility with respect to these deemed-paid FTCs for taxes paid by foreign subsidiaries. The proposal does not apply to foreign taxes paid directly by a US taxpayer.
Currently tax excess returns associated with transfers of IP offshore
This proposal reflects concern in the Administration and by some in Congress about the taxation of intangible property (IP) transferred offshore from a US person to a
related foreign person. Specifically, the Administration has proposed a new category of Subpart F income associated with certain outbound IP transfers to low-taxed controlled foreign corporations (CFCs).
Under the proposal, if a US person has transferred IP from the US to a related CFC that is subject to a low foreign ETR in circumstances that are deemed to evidence ‘excessive’ income shifting, then an amount equal to the excessive return is treated as Subpart F income and taxed currently in a separate FTC limitation basket.
Limit income-shifting through IP transfers
This proposal is aimed at preventing what the Administration considers inappropriate shifting of income outside the US through certain IP transfers. It “clarifies” the definition of IP subject to an outbound toll tax, specifically including workforce-in-place, goodwill, and going concern value as subject to potential tax on an outbound transfer. The proposal also authorizes the Internal Revenue Service to value IP on an aggregate basis in the case of the transfer of multiple intangibles, and provides that IP must be valued at its highest and best use.
Limit earnings-stripping by expatriated entities
This proposal further limits the deductibility of related-party interest
expense by expatriated entities. The proposal defines an expatriated entity so as to govern inversions occurring after July 10, 1989.
Tax gain from the sale of a partnership interest on a look-through basis
This proposal provides that gain or loss from the sale or exchange of a partnership interest would be considered effectively connected income (ECI), and therefore subject to US federal income tax, to the extent attributable to the transferor partner’s distributive share of the partnership’s unrealized gain or loss that is, in turn, attributable to ECI property.
Prevent use of leveraged distributions from related foreign corporations to avoid dividend treatment
This proposal is aimed at transactions under which a foreign corporation (funding corporation) funds a second, related foreign corporation (foreign distributing corporation). Specifically, the proposal targets transactions with a principal purpose of avoiding dividend treatment on distributions to a US shareholder. In those situations, the proposal would not take into account the US shareholder’s basis in the stock of the distributing corporation for the purpose of determining the treatment of the distribution under Section 301.
Like the Administration’s proposal to repeal the Section 356 boot-within-gain limitation, this proposal

10 Assessing tax: 2013 tax rate benchmarking study
apparently aims at the monetization of foreign assets without the generation of US income. In essence, the proposal treats asset value that has been converted to cash as though it were income, even when the taxpayer recognizes no income from the transaction.
Other Administration international tax proposals from the FY 2014 budget
The Administration’s FY 2014 budget also included other international tax proposals that:
• disallow deductions for excess non-taxed reinsurance premiums paid to affiliates
• modify the tax rules for dual-capacity taxpayers
• extend Section 338(h)(16) to certain asset acquisitions
• remove foreign taxes from a Section 902 corporation’s tax pool when earnings associated with those taxes are eliminated
Chairman Camp’s international tax reform discussion draft
The most detailed proposal to date for a US territorial system has been provided by Ways and Means Chairman Camp in his international tax reform discussion draft. As noted above, Chairman Camp’s proposed international reforms are intended to be revenue-neutral over the ten-year budget period.
Chairman Camp’s proposed territorial system provides a 95 percent DRD for qualified foreign-source dividends received by a corporate 10 percent US shareholder from a CFC, provided the stock of the CFC has been held for at least one year. Given the 25 percent corporate tax rate assumed in the discussion draft, for which no FTC could be used to offset, the tax rate on qualifying foreign-source dividends would be 1.25 percent (25 percent of five percent).
As part of a transition to the new territorial system, previously untaxed earnings and profits of foreign subsidiaries would be included in the current income of 10 percent-or-greater US shareholders. An 85 percent DRD would be allowed, and credits for a corresponding portion of indirect foreign taxes would be allowed. Thus, the maximum tax rate on pre-enactment income would be 5.25 percent (35 percent of 15 percent). A taxpayer could elect to spread the tax owed over a period of up to eight years with an interest charge.
The international tax reform discussion draft has three alternative options that would expand Subpart F to address concerns that increased income shifting may occur under a territorial tax system, particularly with respect to IP:
•Excess returns proposal. The first option is based on the Administration’s ‘excess returns’ budget proposal, which would
create a new Subpart F category of foreign base company excess intangible income for income relating to transferred IP earning a high rate of return and subject to a low foreign ETR. The discussion draft version of the proposal is the same as the Administration’s proposed change to current law except that the discussion draft option would not create a separate FTC basket for this income.
•Subpart F inclusion of all low-taxed cross-border income proposal. CFC income subject to a foreign ETR (based on US principles) of 10 percent or less (determined on a country-by-country basis) would be treated as Subpart F income, with an exception for same-country active income. This proposal has been likened to Japan’s CFC rules, although it does not provide for the broader active business income exception included in the Japanese rule.
•“Carrot and stick” approach to intangible income. This option creates a new category of Subpart F income for low-taxed worldwide income derived by a CFC from intangibles (the ‘stick’) and provides a 40 percent deduction to the domestic corporation for income attributable solely to the foreign exploitation of intangibles (the ‘carrot’).
The new category of Subpart F income, foreign base company intangible income (FBCII), would be defined as all intangible income earned by a CFC from the sale, lease,

11 Assessing tax: 2013 tax rate benchmarking study
or license of property in which IP is used directly or indirectly, or the provision of services related to IP without regard to where the intangibles are exploited. FBCII would be eligible for a modified Subpart F high-tax exception that would apply where the ETR of the income exceeds 13.5 percent. The 40 percent deduction provided under the “carrot” (resulting in a 15 percent ETR) applies only to foreign intangible income earned directly by a domestic corporation and indirectly through a CFC in which it is a shareholder.
Limitation on net interest deductions
The international tax reform discussion draft also addresses US base erosion concerns by limiting deductions for net interest expense of a US corporation that is a US shareholder with respect to a CFC if both the US corporation and the CFC are members of a worldwide affiliated group. The limitation would apply if US net interest expense exceeds an unspecified percentage of adjusted taxable income and the domestic debt-to-equity ratio is higher than the debt-to-equity ratio of the taxpayer’s entire worldwide group. The lesser of the amounts determined under the percentage of taxable income test and the relative leverage test is the amount by which deductible interest is reduced.
Additional Obama Administration business tax reform proposals
The president’s FY 2014 budget reserves international and other business tax increases as offsets for a revenue-neutral business tax reform that also would lower the corporate tax rate. In addition to the international tax proposals discussed above, other business tax increases reserved for tax reform would:
• repeal the last-in, first-out (LIFO) and lower-of-cost-or-market (LCM) inventory accounting methods
• eliminate certain tax preferences for oil, natural gas, coal and other hard mineral fossil fuels
• modify the tax treatment of insur-ance companies and products
• require that derivatives contracts be marked-to-market with the resulting gain or loss treated as ordinary income
• modify depreciation rules for non-commercial general aircraft
• repeal gain limitation for divi-dends received in reorganization exchanges
• expand the definition of built-in loss for purposes of partnership loss transfers
• extend partnership basis limi-tation rules to non-deductible expenditures
• limit the importation of losses under related-party loss limitation rules
• deny deductions for punitive damages
The president’s FY 2014 budget does not propose a target corporate tax rate, but does reference the president’s 2012 framework for business tax reform, which called for a 28 percent top corporate tax rate and reduced rates for certain domestic manufacturing activities. The president’s FY 2014 budget does not include a proposal from last year’s budget to provide an enhanced domestic manufacturing deduction.
Although not discussed in the Administration’s FY 2014 budget, the president’s 2012 framework for business tax reform sets forth a menu of options for base broadening that include:
• reduce the benefits of accelerated depreciation on capital investment
• reduce the “bias toward debt financing”
• establish greater parity between large corporations and large busi-nesses that are taxed at the indi-vidual level (e.g., partnerships and S corporations)
The framework does not detail specific proposals in these areas. Instead, the framework states, for example, that “steps like reducing the deductibility of interest for corporations should be considered” and cites past options to modify the tax treatment of large pass-through businesses.

12 Assessing tax: 2013 tax rate benchmarking study
Chairman Camp’s financial products discussion draft
Chairman Camp’s financial products discussion draft, released on January 24, 2013, would significantly impact taxpayers that execute financial transactions as part of a trading or investment strategy, such as hedge funds, mutual funds, and individual investors/traders. Specifically, the discussion draft provides that:
• An investor would be required to mark-to-market on an annual basis all derivatives (broadly defined) in the taxpayer’s portfolio. The resulting income or loss would be ordinary.
• A taxpayer no longer could specifi-cally identify by ‘lot’ the security that it sells for purposes of deter-mining cost basis. Instead, the proposal requires that cost basis be computed under an ‘average cost’ methodology.
• Taxpayers would be required to accrue market discount into interest income on a current basis.
The discussion draft includes a proposal applicable to businesses that use financial products to hedge their ordinary business operations. The mark-to-market proposal – although clearly designed to impact investors/traders – also could impact businesses that use derivatives to manage currency, interest rate, and price risk. However,
the proposal provides an exception to the mark-to-market regime for transactions that qualify as tax hedges.
In defining this hedging exception, the proposal provides some relief from the current-law requirements for making tax-specific identifications of hedges. Specifically, the proposal effectively deems a tax hedge identification to have been made in situations where the transaction is properly treated as a hedging transaction in a taxpayer’s audited financial statements.
Chairman Camp’s small business and pass-through discussion draft
Chairman Camp’s small business and pass-through discussion draft features proposals affecting partnerships and S corporations. The discussion draft includes a proposal to limit the use of the cash method of accounting to businesses with gross receipts of $10 million or less. As noted above, the discussion draft offers two options to modernize the tax treatment of partnerships and S corporations.
Option 1 – revisions to Subchapter K and Subchapter S – incorporates a number of proposals from the S Corporation Modernization Act (H.R. 892), introduced earlier this year, intended to provide “greater flexibility” to S corporations in their day-to-day operations. Option 1 also
includes proposals to eliminate certain perceived tax abuses in Subchapter K, to clarify certain partnership rules, and to align certain partnership rules with S corporation rules.
Option 2 – a new, unified pass-through regime – would repeal current law Subchapter K and Subchapter S and provide a “simple, uniform set of rules” that would apply to non-publicly traded businesses for federal tax purposes, regardless of how the business is organized.
Other tax reform proposals
• On April 19, 2013, Erskine Bowles and Alan Simpson, the co-chairs of President Obama’s 2010 fiscal commission, issued A Bipartisan Path Forward to Securing America’s Future, a new proposal outlining $2.5 trillion in compre-hensive deficit reduction. Bowles, a former White House chief of staff during the Clinton Administration, and Simpson, a former Republican senator from Wyoming, led the 18-member National Commission on Fiscal Responsibility and Reform in 2010, which was tasked with developing a deficit reduction proposal to be sent to Congress. The bipartisan co-chairs devel-oped a plan that failed to win the commission’s approval, but that has since, for some policymakers, served as a benchmark for subse-quent deficit reduction efforts.

13 Assessing tax: 2013 tax rate benchmarking study
• The new Bowles-Simpson plan would enact comprehensive tax reform that would eliminate or scale back most tax expenditures. Almost $600 billion of the revenue raised from those reforms would be used to lower the deficit, while the rest would provide for reduced marginal income tax rates. The plan would achieve additional savings from healthcare reform, cuts in mandatory spending, and stronger limitations on discre-tionary spending.
• The Joint Select Committee on Deficit Reduction – the “super committee” established by the Budget Control Act of 2011 agreement increasing the federal government’s borrowing authority – also considered corporate tax reform proposals in the fall of 2011 as part of a comprehensive deficit reduction plan. Ultimately, the committee failed to agree on a deficit reduction plan. Senator Rob Portman (R-OH), one of the 12 members of the Select Committee and a new member of the Senate Finance Committee, at that time said that a conceptual corporate tax reform proposal, featuring a 25 percent corporate rate and a territorial system, had been scored as deficit neutral by the JCT.
• During the last Congress, Senate Finance Committee member Ron Wyden (D-OR), on April 5, 2011
introduced a revised version of his comprehensive tax reform plan, the Bipartisan Tax Fairness and Simplification Act of 2011 (S. 727), co-sponsored by Senators Dan Coats (R-IN) and Mark Begich (D-AK). For corporations, the top rate would be lowered to 24 percent and would be offset by significant base broad-ening. Senator Wyden’s plan would repeal deferral of active foreign business income and tax all foreign income on a current basis, with a per-country limitation on FTCs. The plan also would limit depre-ciation to the straight-line method over an extended recovery period and cut back deductions for gross interest expense.
• Also during the last Congress, Senate Finance Committee member Mike Enzi (R-WY), on February 9, 2012 introduced the Job Creation and International Tax Reform Act of 2012 (S. 2091), which proposed a territorial tax system with a 95 percent DRD similar to that under Chairman Camp’s international tax reform discussion draft. However, Senator Enzi’s bill differed from Camp’s discussion draft in several aspects, including an anti-base erosion measure that would treat as Subpart F income overseas earn-ings on a per-country basis that are taxed at an ETR of less than half the maximum US corporate
statutory rate (i.e., 17.5 percent based on a 35 percent statutory rate).
• Senator Carl Levin (D-MI), on February 11, 2013 introduced the Cutting Unjustified Tax (CUT) Loopholes Act, an extensive and wide-ranging anti-abuse bill. In the international area, this bill (S. 268) includes new provisions for elimi-nating CFC look-through treatment and entity status electivity for certain foreign entities. In addition, it treats CFC loans to US share-holders as dividends to the extent of aggregate CFC earnings. The bill also includes provisions drawn from previous bills on deferral of foreign expenses, pooling of FTCs, limits on outbound transfers of IP, and limits on earnings-stripping by inverted companies.
• Senator Bernie Sanders (I-VT), on February 7, 2013 introduced the Corporate Tax Fairness Act (S. 250), which would repeal deferral for active income of CFCs, reinstate per-country FTC rules, limit FTCs for integrated oil companies that are dual-capacity taxpayers, and treat foreign companies managed and controlled in the US. US Representative Janice Schakowsky (D-IL) intro-duced a companion bill (H. 694) in the House of Representatives on February 13, 2013.

Assessing tax: 2013 tax rate benchmarking study14 Assessing tax: 2012 tax rate benchmarking study
New OECD report on base erosion and profit-shifting
In recent years, tax authorities in various countries have expressed concern about losing tax revenue as a result of corporate planning that they believe erodes tax bases and shifts profits to lower-tax jurisdictions. In response, the OECD is conducting a project to address base erosion and profit shifting (BEPS) issues. The OECD on February 12, 2013 issued its initial report, Addressing Base Erosion and Profit Shifting, which analyzes the key tax principles and opportunities for BEPS.
The report concludes that current international taxation regimes provide opportunities for multinational entities to reduce the share of profits associated with substantive operations. The report notes that most tax rules are still grounded in an economic environment characterized by a lower degree of economic integration across borders. Therefore, the report states, revisiting fundamental tax policies is pertinent given the rise of the global economy, which allows multinational corporations to conduct business with customers in countries where the company has no physical presence.
Although the report calls into question the ability of current international principles to prevent BEPS, it does not support unilateral actions by affected countries. Rather, it recommends that nations work together to develop plans
to address BEPS in a comprehensive manner. It is unclear whether collaborative initiatives such as this will affect tax reform efforts in the US.
It is anticipated that a follow-up report and action plan is to be developed by June 2013. The plan will identify actions that are required to address BEPS, set deadlines for actions, and identify the resources and methodology needed to implement the proposed solutions.
The BEPS report states that the action plan may include proposals to develop:
• instruments to put an end to or neutralize the effects of hybrid mismatch arrangements and arbitrage
• improvements or clarifications to transfer pricing rules to address specific areas where the current rules produce undesirable results from a policy perspective
• updated solutions to the issues related to jurisdiction to tax, particu-larly in the areas of digital goods and services
• more effective anti-avoidance measures as a complement to previous items
• rules on the treatment of intra-group financial transactions
• solutions to counter harmful regimes more effectively, taking into account factors such as transparency and substance

15 Assessing tax: 2013 tax rate benchmarking study
Benchmarking overview:
Tax rate benchmarking for industrial products and automotive sectors
In this section, we report on the findings from our analysis of key tax ratios of 316 global industrial products and automotive companies. The analysis provides insight into the ETR reported by these companies in 2012, the trend in ETR over the last three years and the drivers of the ETR. The report covers six sectors and includes detailed analysis and commentary for each sector: A&D, automotive, chemicals, E&C, IM&M, and T&L.
Public interest in how much tax is paid by large corporations and whether this is the right amount of tax is growing as the need to repair public finances around the world intensifies. Governments are concerned about a possible loss in revenue from cross-border tax planning and, as mentioned in the previous section, the OECD has set up a project to address this issue (BEPS).
In the current environment, where for some companies, tax is becoming a reputation issue, it is more important than ever to know what the ETR of your peer group is, to assess whether your ETR is higher or lower than the peer group and how the trend
in your ETR compares with other companies. A customized report based on the publicly available data in this study can be prepared for any company. Companies use tax rate benchmarking data to compare their performance in a particular year and over a period of time. This can be useful when writing and reviewing tax strategy and communicating with the board.
As emerging economies take the driver's seat of global growth, companies represented in this report are seeing that global growth and commodity prices are starting to be driven by developments in China and India rather than the US and EU. In 2013, developing economies are expected to be bigger (in terms of purchasing power parity adjusted GDP) than advanced economies, the first time since reliable record-keeping began.1 Companies must adapt because business as usual is changing. Expenditure in emerging markets is no longer speculative investment but core to sustainable growth and, as globalization increases, tax departments will be challenged to maintain control over taxes in new and sometimes unfamiliar territories.
This study uses publicly available data for the past three years, up to and including the year ended December 31, 2012. Data was sourced from data providers and from individual companies.
This study shows a high-level analysis of key tax ratios, with no adjustment for one-time distorting items or losses. While losses, tax refunds, and exceptional items can serve as drivers of an individual company’s tax ratios, our use of a statistically trimmed sample minimizes the impact of these drivers.
Effective tax rate for all companies
The ETR is the tax provision as a percentage of profit before tax, as taken from the face of the income statement. It provides a basic view of the impact of tax on results.
We calculated a trimmed average ETR, excluding extreme values from both the top and bottom of the data set. The upper and lower quartiles represent the resulting ratios for which 75 percent and 25 percent of companies fall below that point, respectively (see Appendix for further explanation).
1 PwC Global economy watch 2013

16 Assessing tax: 2013 tax rate benchmarking study
Figure 1 shows that the average three-year ETR of companies in this study is 27.2 percent. There has been a steady upward trend in average ETR from 2010 (26.1 percent) to 2012 (28.3 percent), which is perhaps surprising given the reduction in statutory rates of corporate income tax around the world. This is due in part to a greater number of companies with losses in 2010 than in 2012, reducing ETRs in 2010. In 2009, one in four companies in the study was in a loss making position; by 2012 the ratio was much smaller, one in ten. Thirty-five companies had tax losses in 2010 compared with 28 in 2012.
ETR—Profitable companies
Figure 2 shows the ETR trend when all companies that incurred losses or have been in a tax benefit position in any of the last three years are removed. There is a consistent upward trend in quartile one from 2010 to 2012, and increases in the ETR in the average and quartile three from 2011 to 2012. Having removed losses from the picture, this trend cannot be explained by losses and reducing global statutory rates since these would reduce the ETR. The trend is a function of the fact that almost 50 percent of companies in the sample are based in the US and there has been an increase of 1.2 percentage points in the average US
0%
10%
20%
30%
40%
201220112010
Figure 1—Effective tax rate for all companies
26.1%
16.4%20.4%20.7%
28.3%
33.7%34.1%
27.3%
35.2%
Average
Quartile 1
Quartile 3
0%
10%
20%
30%
40%
201220112010
Figure 2—ETR for profitable companies
29.1%
23.0% 23.7%23.3%
29.8%
33.7%35.8%
28.4%
35.3%
Average
Quartile 1
Quartile 3
ETR for profitable companies over the two years.
Statutory corporate income tax rate and ETR by country
Where we have sufficient numbers of companies, we are able to look at the ETR by country (averaged over all

17 Assessing tax: 2013 tax rate benchmarking study
0%
10%
20%
30%
40%
Figure 3—Statutory corporate income tax rate and ETRs for the study
16.5% 16.7%
30.2%
25.0%
24.0%
16.5%
2012 ETR
StatutoryRate—2012
26.1%
25.3% 26.7%
30.2%
23.2% 24.6%
34.4%
38.0%
30.9%
36.7%
39.1%
30.4%26.3%
32.5%
Hon
g K
ong
(7)
Uni
ted
Kin
gdom
(12)
Net
herla
nds
(6)
Can
ada
(8)
Sw
eden
(6)
Ger
man
y (1
7)
Ind
ia (7
)
Fran
ce (1
6)
Uni
ted
Sta
tes
(149
)
Jap
an (3
4)
Figure 4—Trend in ETRs by country
0%
5%
10%
15%
20%
25%
30%
35%
40%
20102011 2012 Average
Hon
g K
ong
(7)
Uni
ted
Kin
gdom
(12)
Can
ada
(8)
Ger
man
y (1
7)
Ind
ia (7
)
Sw
eden
(6)
Net
herla
nds
(6)
Fran
ce (1
6)
Uni
ted
Sta
tes
(149
)
Jap
an (3
4)
companies in the country), and Figure 3 shows a comparison of statutory and effective rate by country.2 The number of companies included in each average is indicated on the chart after the country name.
Hong Kong, Canada, and Sweden have statutory rates in the lower half of the peer group and ETRs that are very similar to statutory rates in those countries, implying that adjustments between the accounting and taxable bases are limited.
Companies headquartered in countries with statutory rates in the upper half of the peer group on average have ETRs below the statutory rate. This may be the result of a narrower tax base in these countries. In addition, a portion of these companies’ worldwide income is earned outside of their home country and is taxed at lower statutory rates. Four countries have effective rates around the 25 percent level, four around the 30 percent level, and two around the 16 percent level.
Looking at the trend since 2010 (Figure 4), there have been reductions in ETR in three countries, the UK, Germany, and India, but increases in ETR in the remaining seven countries. As noted earlier, the time trend is affected by a larger number of companies having losses in 2010 than in 2012.
taken into account when making investment decisions.
2 Source: OECD and PWC
Companies pay many other taxes in addition to corporate income tax, but there is little visibility over these other taxes and they are often not

18 Assessing tax: 2013 tax rate benchmarking study
Figure 5—Profit and income tax trends
0%
5%
10%
15%
20%
25%
30%
35%
ProfitsIncome tax
Trend in 2010-2011 Trend in 2011-2012
Mo
vem
ent
ove
r th
e 2
year
s
Figure 6—Profit and income tax trends by sector
-30%-20%-10%
0%10%20%30%40%50%
Trend in profit [2011-2012]Trend in income tax [2011-2012]
A&D Auto Chemicals E&C IM&M T&L
Mo
vem
ent
ove
r th
e 2
year
s
PwC carries out an annual comprehensive study of all the taxes paid by a model manufacturing company in 183 countries around the world, “Paying Taxes,”3 and provides similar analyses as part of its Total Tax Contribution framework. The Total Tax Contribution framework provides a methodology for measuring all the taxes that companies remit to government. The analysis can be performed at the country, industry, or company level. The Total Tax Contribution framework makes a distinction between taxes borne and taxes collected. Taxes borne are taxes that are a charge to the company, such as corporate income and property taxes. By contrast, taxes collected are taxes such as employer’s withholding of individual income taxes that the company collects and administers on behalf of government, where the company is not the intended object of taxation. This framework can assist in providing a clear understanding of a company’s or industry’s total tax contribution, demonstrate its wider social and economic impact, add to the information available to making informed business decisions, and better monitor and manage tax risk.
Industry picture
Looking at the industry picture, while profits for this group of companies
3 Paying Taxes – The Global picture: PwC
(averaged over each company) increased compared with 2011 (5.9 percent), the increase seen in 2010/11 was much greater at 29.8 percent (Figure 5).
Drilling down by sector, the recovery has been uneven. Figure 6 shows that A&D, E&C and T&L have seen growth in profits; chemicals and IM&M have seen the opposite trend.

19 Assessing tax: 2013 tax rate benchmarking study
The disparity between income growth and taxes seen in the E&C sector is a result of losses in this sector. Figure 7 shows that 46 percent of E&C companies included in the study were profitable and tax-paying all three years. This results in a low three-year average ETR for all companies when compared with other sectors but a higher three year average ETR for profitable companies. By contrast, the A&D sector and chemical sectors, with less than 20 percent loss making companies, have ETRs that change only minimally when loss making companies are removed.
Figure 8—Drivers of the ETR in 2012
Average impact of driversNumber of companies reporting driver
Change in tax rate
Non taxable income and nondeductible expenses
Other—company description
Various other adjustments
Tax losses and change in thevaluation allowance
Tax reserve adjustments
Impact of foreign operations
Tax incentive
-5.0% -4.0% -3.0% -2.0% -1.0% 0.0% 1.0% 2.0% 3.0% 4.0% 5.0%
131
226
111
135
85
208
146
66
-3.3%
-2.0%
-0.8%
-0.1%
0.2%
0.3%
1.1%
1.8%
0%
5%
10%
15%
20%
25%
30%
35%
Figure 7—ETR for profitable companies
ETR for profitable companies
ETR for all companies
% of all companies that are profitable
3 ye
ar a
vera
ge
ET
R
% o
f al
l co
mp
anie
s w
hich
are
pro
fitab
le
0%
10%
20%
30%
40%
50%
60%
70%
80%
90%
E&C T&L Auto IM&M A&D Chemicals

20 Assessing tax: 2013 tax rate benchmarking study
Drivers of the effective tax rate of industrial products and automotive companies
A number of factors drive the ETR. These can be both structural and recurring, such as lower tax rates resulting from overseas operations, tax incentives, or a result of items such as losses which may not necessarily recur.
We have analyzed and summarized common drivers and their impact on the ETR. The reconciling items, as disclosed in the statutory/ effective rate reconciliation, were analyzed, collated, and averaged over the study companies. Figure 8 illustrates some drivers of the effective rate and shows how frequently they appear in companies’ statutory reconciliations for 2012. The bars on the left of the chart show the number of companies reporting the driver. The 0 percent line represents the statutory rate and the bars on this line show the impact of the driver, both favorable and unfavorable. The impact of foreign operations, for example, reduces the ETR of study companies on average by 2.0 percent, whereas non-taxable income and non-deductible expenses increase the ETR by 1.1 percent. Single outlying ratios in excess of 50 percent have been excluded.
Tax incentives are the largest favorable driver, reported by 131 companies in the study and giving a benefit of 3.3 percent. The impact of international operations follows, with an average benefit of 2 percent. Tax losses and change in valuation allowance have a much smaller
impact than in previous years, a 0.1 percent favorable driver compared with -1.4 percent in 2011.
Tax incentives
Tax credits and incentives gave an average benefit to companies in the study of 3.3 percentage points. Although in the US, several tax incentives temporarily expired in 2012, this picture is similar to 2011 (-3.2 percent), a result of continued focus on research as companies seek to differentiate themselves and drive their businesses. Descriptions included domestic manufacturing deduction, production-related deductions, research and development credits, and general business credits.
Impact of foreign operations
This is usually a structural, recurring driver that was reported by the majority of companies in the study. This reconciling item reduced companies’ ETR by 2.0 percentage points on average compared with a reduction of 1.6 percent for this driver in 2011.
Tax reserve adjustments
Included in this heading are contingent liabilities, changes in prior year estimates, reduction in tax reserve, and audit settlements. The average benefit was to reduce the ETR by 0.8 percent. In contrast to foreign operations, these adjustments are not likely to be structural or recurring.
Tax losses and change in valuation allowance
Tax losses and change in valuation allowance represented a favorable driver overall to companies during the study. Descriptions included losses not available to carry forward, effect of non-recognition of deferred tax assets, change in valuation allowance, recognition of previously unrecognized deferred tax assets, and tax losses utilized. Although there were reconciling items going in both directions, the net of these items overall is a decrease of 0.1 percentage points in the year.
Various other adjustments
This category included descriptions such as acquired IP research and development, stock options, and equity adjustments, which are consolidated under one heading to avoid excessive detail.
“Other” in company descriptions
This category is for the line described as “other” in company reconciliation. No further detail was available.
Non-taxable income and non-deductible expenses
An unfavorable driver with an average impact of 1.1 percentage points, this reconciling item frequently had broad descriptions such as ‘permanent differences’, ‘non taxable income.’ Individual reconciling items were both favorable and unfavorable, netting off to give an unfavorable driver.

21 Assessing tax: 2013 tax rate benchmarking study
Figure 9—Impact of foreign operations in 2012
Impact of foreign operationsNumber of companies reporting driver
Auto
IM&M
-10.0% -5.0% 0.0% 5.0% 10.0%
33
36
38
43
42
34
Chemicals
E&C
A&D
T&L
-4.2%
-3.3%
-2.5%
-1.4%
-1.2%
0.6%
Change in rate
Rate reduction results in a revaluation of deferred tax assets and deferred tax liabilities. The effect was particularly marked in Japan, where the introduction of a corporation tax rate reduction from April 2012 decreased the benefit of net deferred tax assets and consequently increased income tax expense for year to March 2012.
Significant drivers by sector
Comparing by sector (Figure 9), Automotive takes the greatest benefit from foreign operations, but this is partly due to the profile of the sector, which has a number of Japanese and American companies where the statutory rate is the highest in the peer group.
Figure 10 shows that the A&D sector has the largest number of companies benefiting from tax incentives, reducing the ETR by 4.1 percent. While the impact for E&C is greater at -4.2 percent, this is reported by only 17 companies and so has less impact on the sector.
Tax disclosures
The tax environment is changing and tax is moving up the boardroom agenda. Different groups and organizations are focusing on tax policies to a greater extent than in the past and, as a result, a company’s disclosure of its tax affairs is coming under increasing scrutiny. We reviewed two different areas of companies’ disclosures on tax to provide us with insights into trends.

22 Assessing tax: 2013 tax rate benchmarking study
E&C
Figure 10—Impact of tax incentives in 2012
Number of companies reporting driver Tax incentive
Auto
IM&M
-5.0% 0.0% 5.0% 10.0%
Chemicals
A&D
T&L9
17
37
25
21
22
-4.2%
-4.1%
-4.0%
-3.5%
-2.5%
-1.4%
Unrecognized tax benefits
Accounting for uncertainty in income taxes can be complex, and criteria exist in the US for the recognition and measurement of unrecognized tax benefits resulting from uncertain tax benefits. There is a two-step approach of evaluating tax positions and determining if they should be recognized in the financial statements. Tax positions that are ‘more likely than not’ to be sustained upon examination must be measured using specified criteria.
The average unrecognized tax benefit for those companies reporting this item under US disclosure requirements in the study was $240 million, an increase of 8.8 percent between 2011 and 2012. Overall, all sectors saw a drop in unrecognized tax benefits apart from the chemical sector, which saw an overall increase (Figure 11).
0
2,000
4,000
6,000
8,000
10,000
12,000
14,000
Figure 11—Unrecognized tax benefits
2011 UTB Balance
2012 UTB Balance
2010 UTB Balance
Mill
ion
$
A&D(29)
Auto(18)
Chemicals(27)
E&C(38)
IM&M(16)
T&L(21)

23 Assessing tax: 2013 tax rate benchmarking study
Unrepatriated earnings
US-based multinationals doing business outside of the US are required to account for the tax effects (deferred tax liability) associated with remitting such earnings to the US, unless those unremitted earnings are permanently reinvested outside the US. The amount of undistributed non-US earnings has grown in recent years. We analyzed the level of unrepatriated earnings reported by the US study companies and the movement compared with last year.
The average increase in unrepatriated earnings between 2011 and 2012 as a percentage of the income before tax in 2012 amounts to 48.0 percent (median 15.4 percent) for the companies reporting this item.

24 Assessing tax: 2013 tax rate benchmarking study
Benchmarking by sector:
Tax rate benchmarking for the Aerospace & Defense sector
In 2012, the A&D sector faced challenging conditions, with continued global economic weakness, declining government defense budgets, high fuel costs, and deferral of maintenance by EU and US airlines. There was continued pressure to cut costs and to strengthen balance sheets by paying down debt.
Given the fragile growth in the US and stagnation in EU, companies sought to focus on growth opportunities in developing economies, such as China, the rest of Asia, and Brazil, although there have been challenges even in Asia. Companies have also responded by focusing on their service and maintenance operations, as this proved to be the most recession-proof area, as airlines seek to cut costs. Over the longer term, there are opportunities from aging military fleets and airline maintenance and upgrades to more fuel-efficient alternatives to remain competitive. Companies in the A&D sector are looking to the developing world for long-term growth as the commercial fleet expands in these countries. Research and development continues to be crucial to ensure the future pipeline, though certain companies have continued to seek growth via M&A.
The A&D Tax Rate Benchmarking study for 2013 incorporates company data for 50 companies for accounting periods ending in 2012. Thirty-three companies in the study had calendar year-ends; there were five companies with March year-ends, and the remainder at other times during the year. The data for 2012 were not available for two companies at the time of finalizing the study. The companies included in the study are detailed at the end of this section.
ETR of the A&D sector—all companies
Figure 1 shows that the average three-year ETR for the A&D sector was 27.9 percent. Since 2010, there has been steady increase in the ETR for all quartiles. As a result of recovery
in the sector, the range between quartiles one and three narrowed to 9.9 percentage points in 2012 from 12.8 percentage points in 2010.
In the study, profits increased by 22.3 percent on average, with 48 companies showing profits in 2012 and only one firm in a tax benefit position. This compares with three companies incurring losses in 2011, and three companies in a tax benefit position. There were three companies where ETR fell by more than 10 percentage points, and six companies’ ETR increased by more than 10 percentage points.
0%
10%
20%
30%
40%
201220112010
Figure 1—Effective tax rate for A&D sector—all companies
26.5%
19.5%
24.0%23.6%
29.3%32.4%32.3%
27.9%
33.9%
Average
Quartile 1
Quartile 3

25 Assessing tax: 2013 tax rate benchmarking study
ETR of the A&D sector – profitable companies only
Figure 2 shows the ETR trend when all companies that have had losses or been in a tax benefit position in any of the last three years are removed. After calculation, 39 companies remained in the analysis.
While the quartile one trend was consistent over the three years, the average and quartile three lines experienced a sharp increase after 2011. Income taxes increased by 24.0 percent after 2011, while profits increased by 14.8 percent. There were three companies where ETR increased by more than 10 percentage points and one company for which ETR fell by more than 10 percentage points between 2011 and 2012.
Drivers of the effective tax rate in the A&D sector
Forty-six companies in the study disclosed reconciliation between their statutory and effective rates in their company accounts, and it was possible to gain some insight into the drivers of the effective rate in the A&D sector by reviewing this analysis.
Figure 3—Drivers of the effective tax rate in the A&D sector in 2012
Average impact of driversNumber of companies reporting driver
Tax incentive
Change in tax rate
-10.0% -5.0% 0.0% 5.0% 10.0%
-3.3%
-2.5%
-1.5%
37
10
42
38
8
17
18
23
-4.1%
-1.3%
Impact of foreign operations-1.2%
Other—company description-0.3%
Various other adjustments0.4%
Tax losses and change in thevaluation allowance 0.5%
Non taxable income and nondeductible expenses1.9%
Tax reserve adjustments 2.1%
The effective rate for 37 companies was below the statutory rate, and for nine companies, it was above the statutory rate. The reconciling items as disclosed in the statutory/effective rate reconciliation were analyzed, collated, and averaged over the sample.
Figure 3 shows how frequently the drivers appear in statutory/effective
0%
10%
20%
30%
40%
201220112010
Figure 2—Effective tax rate for A&D sector—profitable companies only
28.2%
22.8% 23.6%23.4%
28.9%31.2%32.5%
27.1%
33.4%
Average
Quartile 1
Quartile 3

26 Assessing tax: 2013 tax rate benchmarking study
rate reconciliations and the impact they have on the ETR. The bars on the left of the chart show the number of companies reporting the driver. The 0 percent line represents the statutory rate, and the bars on this line show the impact of the driver, both favorable and unfavorable, excluding single outlying ratios in excess of +50 percent or -50 percent.
For the A&D industry, 80 percent of companies benefited from tax incentives during 2012; this resulted in the 4.1 percent favorable driver shown in Figure 3 for tax incentives in this sector.
Forty-two companies disclosed foreign operations as having an impact on their ETR. This has decreased the ETR by 1.2 percent, on average.
Unrecognized tax benefits
Accounting for uncertainty in income taxes can be complex and criteria exist in the US for the recognition and measurement of unrecognized tax benefits resulting from uncertain tax benefits. There is a two-step approach to evaluating tax positions and determining if they should be recognized in the financial statements. Tax positions that are ‘more likely than not’ to be sustained upon examination must be measured using specified criteria.
Figure 4 shows that total uncertain tax benefits (UTB) balances in the 29 companies reporting this US
disclosure requirement increased by 7.6 percentage points between 2011 and 2012, using the 2010 UTB balance as the baseline (100 percent). The maximum increase was 461 percent and minimum decrease was -58 percent. Total UTBs for all companies at the end of 2012 amounted to $4.1 billion. On an individual company basis, the average UTB was $141 million.
Unrepatriated earnings
US-based multinationals doing business outside of the US are required to account for the tax effects (deferred tax liability) associated with remitting such earnings to the US, unless those unremitted earnings are permanently reinvested outside the US. The amount of undistributed non-US earnings has grown in recent years. We analyzed the level
0
500
1,000
1,500
2,000
2,500
3,000
3,500
4,000
4,500
Figure 4—Closing UTB total balance
Closing balances
Trend
Mill
ion
$
0%
20.0%
40.0%
60.0%
80.0%
100.0%
120.0%100%
93.5%101.1%
2010 2011 2012
of unrepatriated earnings reported by the study companies and the movement compared with last year.
Fifteen US-based multinationals in the study disclosed the cumulative amount of undistributed earnings from their foreign subsidiaries on which the parent company had not recognized income tax. Three companies state that, for various reasons, their overseas earnings could not be permanently reinvested and provision had been made for the repatriation.
The average increase in unrepatriated earnings between 2011 to 2012 as a percentage of the income before tax in 2012 amounts to 35.4 percent (median 15.9) for the companies reporting this item.

27 Assessing tax: 2013 tax rate benchmarking study
Companies included in the A&D sector
AAR Corp.Aerosonic Corp.AeroVironment, Inc.Alliant Techsystems, Inc.Babcock International Group PLCBAE Systems PlcBBA Aviation PlcBE AerospaceBombardier, Inc.Breeze-Eastern Corp.Cobham PlcCurtiss-Wright Corp.Dassault Aviation S.A.Ducommun IncorporatedEDAC Technologies Corp.Elbit Systems Ltd.Embraer S.A.Esterline Technologies Corp.Exelis Inc.Finmeccanica SPAFLIR Systems, Inc.Gencorp IncGeneral Dynamics Corp.HEICO Corp.Hexcel Corp.
Honeywell International, Inc.L-3 Communications Holdings, Inc.LMI Aerospace, Inc.Lockheed Martin Corp.Meggitt PlcMoog IncNorthrop Grumman Corp.Orbital Sciences CorpPrecision Castparts Corp.QinetiQ Group PlcRaytheon Co.Rockwell Collins, Inc.Rolls-Royce Group PlcSafran S.A.SAIC, Inc.Smith & Wesson Holding Corp.Spirit AeroSystems Holdings, Inc.TASER International, Inc.Teledyne Technologies IncorporatedTextron, Inc.Thales S.A.The Boeing Co.Triumph Group IncUnited Technologies Corp.Zodiac Aerospace S.A.

28 Assessing tax: 2013 tax rate benchmarking study
The global automotive industry continued its recovery in 2012. Light vehicle assembly came in at 78.9 million units, an increase of 5.8 percent from 2011 and the third consecutive year of growth since the global economic downturn drove assembly volumes to 57.7 million in 2009. Despite this continued top line growth, distinct regional trends provided the main story lines in 2012.
The automotive world continued to focus on when the EU would begin its long-awaited recovery during 2012. Continuously deteriorating economic conditions, austerity measures, and increasingly low consumer confidence drove regional assembly to 15.9 million units for the year. A number of plant closures, layoffs, and strategic partnerships were also announced during 2012 with the hopes of turning the market around. However, 2013 is likely to see a further decline, with a turnaround now not expected until at least 2014.
Despite mixed economic news throughout the year, North America saw strong assembly growth, with 2012 assembly of 15.4 million units, up from 13.1 million units in 2011. Much of this increased assembly was
driven by consumer demand for new vehicles in the US, where new vehicle sales reached 14.5 million units. The availability of credit (particularly subprime), increases in scrappage rates, and consumer confidence were also contributing factors.
Driven by inventory and export recovery from the earthquake and tsunami that ravaged the country and global automotive supply chain in 2011, Japanese assembly rebounded strongly in 2012 with light vehicle production of 9.1 million units. While the recent weakening of the yen, along with the strong possibility of further currency-related action by the central government, has been a positive development for Japanese automakers, the long-term trend of assembly localization to current export markets is expected to continue.
Meanwhile, the outlook in China remains positive. Light vehicle assembly reached 16.6 million units in 2012, representing a year over year growth rate of 7.9 percent, with China easily holding onto its title as the world’s largest vehicle market. Uncertainties leading up to the country’s decennial leadership
Tax rate benchmarking for the Automotive sector
changeover, as well as unrest amid anti-Japanese protests due to an island dispute, also had major impacts on the country’s automotive landscape in 2012.
The automotive industry continues to advance, particularly in terms of safety, design, quality, efficiency, and technological innovation. With this evolution comes a host of market drivers and issues, including:
• impact of driverless vehicles
• rare earth & conflict minerals
• attracting talent
• global regulation & compliance
The Automotive tax rate benchmarking study for 2013 incorporates data for 59 companies for accounting periods ending in 2012. Thirty-seven companies in the study had calendar year ends, 17 companies had March year ends, and the remainder were at other times during the year. The data were not available for eight companies at the time of finalizing the study. The companies included in the study are detailed at the end of this section.

29 Assessing tax: 2013 tax rate benchmarking study
Effective tax rate of the Automotive sector—all companies
The average ETR for the Automotive sector has been constant over the last three years, an average of 26.5 percent, moving by only 0.4 percent (Figure 1). Between 2011 and 2012, there has been an increase in quartile three and a decrease in quartile one. In 2011, no companies were in a loss making position, whereas in 2012, three companies incurred losses. The increase in range between quartile one and quartile three from 2011 and 2012 reflects the distorting effect of these losses on the ETR, with seven firms reporting that their ETRs fell by more than 10 percentage points, and five companies showing increases of more than 10 percentage points.
Effective tax rate of the Automotive sector—profitable companies only
Figure 2 shows the ETR trend when all companies that have been loss making or in a tax benefit position in any of the last three years are removed. Forty-one companies remain in the analysis.
The three-year ETR is 28.1 percent, 1.6 percentage points higher than for all companies at 26.5 percent. While quartile three increased from 32.5 percent in 2011 to 34.5 percent in 2012, there is a fall in quartile one from 22.7 percent in 2011 to 20.0 percent in 2012, with companies in
this quartile range reporting profits falling by 13.7 percent and income tax charges decreasing 16.2 percent.
Drivers of the effective tax rate in the Automotive sector
Thirty-five companies in the study disclosed reconciliation between their statutory and effective rates in their company accounts, and it was possible to gain some insight into the drivers of the effective rate in the Automotive sector by reviewing this analysis.
The effective rate for 24 companies was below the statutory rate, and
for 11 companies, it was above the statutory rate. The reconciling items as disclosed in the statutory/effective rate reconciliation were analyzed, collated, and averaged over the sample.
Figure 3 shows how frequently the drivers appear in statutory/effective rate reconciliations and the impact they have on the ETR. The bars on the left of the chart show the number of companies reporting the driver. The 0 percent line represents the statutory rate, and the bars on this line show the impact of the driver, both favorable and unfavorable, excluding single outlying ratios in excess of +50 percent or -50 percent.
0%
10%
20%
30%
40%
201220112010
Figure 1—Effective tax rate for Automotive sector—all companies
26.4%
16.1%18.4%20.2%
26.3%
32.6%35.5%
26.7%
34.4%
Average
Quartile 1
Quartile 3
0%
10%
20%
30%
40%
201220112010
Figure 2—Effective tax rate for Automotive sector—profitable companies only
29.9%
20.6% 20.0%22.7%
27.3%
32.5%
37.6%
27.1%
34.5%
Average
Quartile 1
Quartile 3

30 Assessing tax: 2013 tax rate benchmarking study
Figure 3—Drivers of the effective tax rate in the Automotive sector in 2012
Average impact of driversNumber of companies reporting driver
Impact of foreign operations
Tax losses and change in thevaluation allowance
-10.0% -5.0% 0.0% 5.0% 10.0%
-0.2%
-4.2%
-3.7%
Tax incentive-1.4%
Tax reserve adjustments -0.8%
Non taxable income and nondeductible expenses
Other—company description0%
Various other adjustments0.7%
Change in tax rate2.6%
33
25
22
18
18
30
14
14
For the Automotive sector, the impact of foreign operations has been greater than in other sectors, with 33 companies reporting it as a favorable driver on their ETR. In particular, tax differentials on foreign earnings have been a significant catalyst in lowering companies’ tax liabilities. Tax incentives also contributed to lowering the ETRs of firms in the Automotive sector, with companies claiming research and development credits, tax benefits, and domestic manufacturing deductions this year, although in the US, the research and development credits temporarily expired in 2012 and were retroactively reinstated in 2013. Even so, the benefit gained from this driver by the Automotive industry
was significantly lower compared with other sectors, with the ETR only falling on average by 1.4 percent. The effect of tax losses also appears to be consistent with trends seen in other sectors, with 75 percent of the 25 companies reporting movements in the valuation allowance as having a favorable impact on the ETR.
Figure 3 shows that changes in the tax rate increased the ETR. In the study, Japanese companies constitute a high proportion of the Automotive sector companies. The introduction of a corporation tax rate reduction from April 2012 decreased the net benefit of deferred tax assets and consequently increased income tax expense for year to March 2012.
Further analysis indicates that seven Japanese companies reported an average rise of 5.1 percent from this factor.
Unrecognized tax benefits
Accounting for uncertainty in income taxes can be complex, and criteria exist in the US for the recognition and measurement of unrecognized tax benefits resulting from uncertain tax benefits. There is a two-step approach to evaluating tax positions and determining if they should be recognized in the financial statements. Tax positions that are ‘more likely than not’ to be sustained upon examination must be measured using specified criteria.
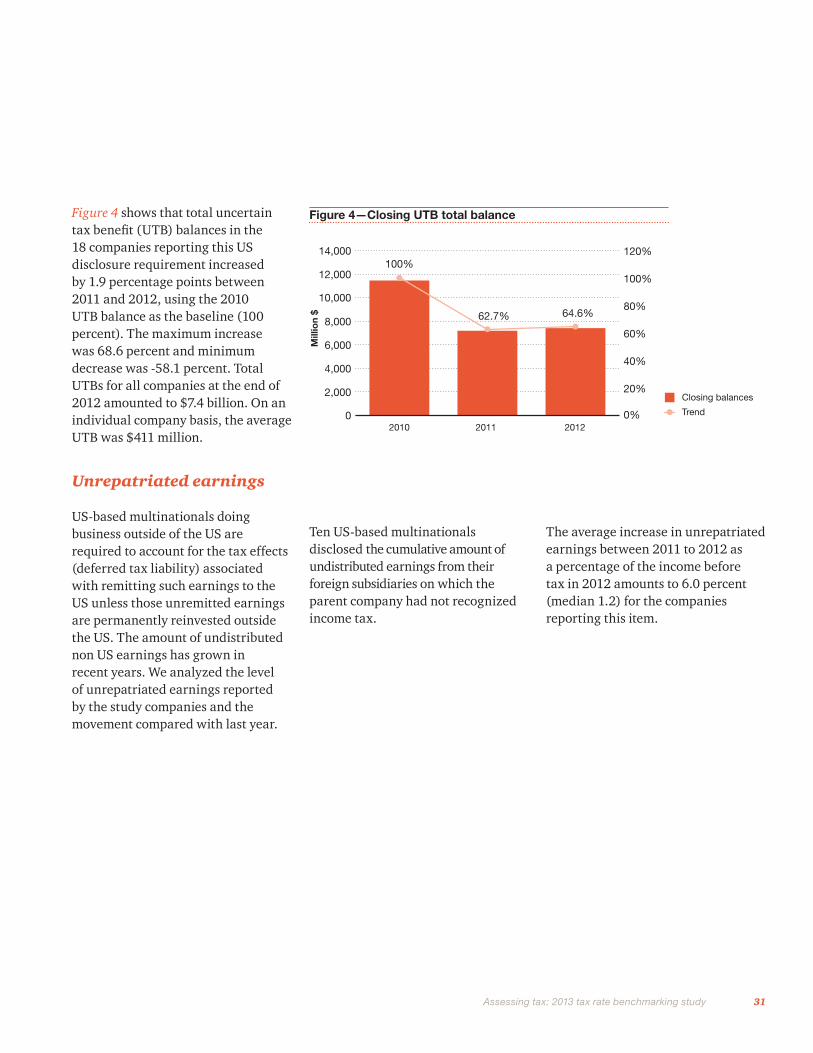
31 Assessing tax: 2013 tax rate benchmarking study
Figure 4 shows that total uncertain tax benefit (UTB) balances in the 18 companies reporting this US disclosure requirement increased by 1.9 percentage points between 2011 and 2012, using the 2010 UTB balance as the baseline (100 percent). The maximum increase was 68.6 percent and minimum decrease was -58.1 percent. Total UTBs for all companies at the end of 2012 amounted to $7.4 billion. On an individual company basis, the average UTB was $411 million.
Unrepatriated earnings
US-based multinationals doing business outside of the US are required to account for the tax effects (deferred tax liability) associated with remitting such earnings to the US unless those unremitted earnings are permanently reinvested outside the US. The amount of undistributed non US earnings has grown in recent years. We analyzed the level of unrepatriated earnings reported by the study companies and the movement compared with last year.
Ten US-based multinationals disclosed the cumulative amount of undistributed earnings from their foreign subsidiaries on which the parent company had not recognized income tax.
0
2,000
4,000
6,000
8,000
10,000
12,000
14,000
Figure 4—Closing UTB total balance
Closing balances
Trend
Mill
ion
$
0%
20%
40%
60%
80%
100%
120%100%
62.7% 64.6%
2010 2011 2012
The average increase in unrepatriated earnings between 2011 to 2012 as a percentage of the income before tax in 2012 amounts to 6.0 percent (median 1.2) for the companies reporting this item.

32 Assessing tax: 2013 tax rate benchmarking study
Companies included in the Automotive sector
Aisin Seiki Co., Ltd.AB VolvoAudi AGAutoliv, Inc.Bajaj Auto Ltd.Bayerische Motoren Werke AGBorgWarner, Inc.Brilliance China Automotive Holdings Ltd.Caterpillar, Inc.Cheng Shin Rubber Ind., Co., Ltd.ChryslerCummins, Inc.Daihatsu Motor Co., Ltd.Daimler AGDelphi Automotive PlcDenso Corp.Dongfeng Motor Group Co. Ltd.Exor S.P.A.Fiat S.P.A.Ford Motor Co.Fuji Heavy Industries Ltd.General Motors Co.Genuine Parts Co.Gkn PlcGreat Wall Motor Co. Ltd.Harley-Davidson, Inc.Hero MotoCorp Ltd.Honda Motor Co., Ltd.Hyundai Mobis Co.,LtdHyundai Motor CoIsuzu Motors Ltd.
Jardine Cycle & Carriage Ltd.Johnson Controls, Inc.Kia Motors Corp.LKQ Corp.Magna International, Inc.Mahindra & Mahindra Ltd.Maruti Suzuki India Ltd.Mazda Motor Corp.Meritor, Inc.Mitsubishi Motors Corp.Navistar InternationalNissan Motor Co., Ltd.Oshkosh Corp.PACCAR, Inc.Pirelli & C. S.P.A.Porsche Automobile Holding SEPT Astra International TbkRenault S.A.Robert Bosch GmbhSAIC Motor Corp. Ltd.Sumitomo Electric Industries, Ltd.Suzuki Motor Corp.Tenneco, Inc.Toyota Industries Corp.Toyota Motor Corp.TRW Automotive Holdings Corp.Volkswagen AGWeichai Power Co., Ltd.

33 Assessing tax: 2013 tax rate benchmarking study
In 2012, many chemicals companies were affected by high fuel and raw material costs, combined with sluggish US growth and the European debt crisis. In addition, national disasters such as the Thailand floods and the Japan earthquake had an impact for companies operating in this area. By contrast, North America saw drops in energy and raw material costs due to shale gas opportunities. There was continued focus on BRIC countries (Brazil, Russia, India and China).
Key growth areas included life sciences (agriculture and pharma) and environmentally friendly products. Growing populations and greater individual wealth led to demand for better nutrition and healthcare, sectors which traditionally are more resilient in a recession. Adverse weather conditions in the year presented challenges to farmers and drove up crop prices. This, combined with increased weed and insect resistance to agrochemicals, underlined the importance of new agricultural chemicals.
There is greater focus on supplying chemicals with a lower environmental impact, such as improved car catalysts and crop protection products, to invest in cleaner and sustainable fuel sources and to increase energy efficiency. Pharma companies have found conditions in EU challenging with health system reforms and government cost cutting, and more generally with generic competition and the patent cliff.
The 2013 Chemicals sector benchmarking study was conducted for 47 companies for accounting periods ending in 2012. In the study, there were 36 companies with December year ends, six companies with March year ends and the rest of the companies had variable accounting periods in 2012. The data for two companies were not available by time of finalizing the study. The companies included in the study are listed at the end of this section.
Tax rate benchmarking for the Chemicals sector

34 Assessing tax: 2013 tax rate benchmarking study
Effective tax rate of the Chemicals sector—all companies
The average ETR for the period between 2010 and 2012 was 27.1 percent, which is slightly higher than the 26.3 percent recorded in last year’s study.
Figure 1 shows that the range between quartile three and quartile one increased from 8.5 percentage points in 2011 to 10.9 percentage points in 2012. When analyzing the data for 2011 and 2012, there has been a decrease in profits by 6.7 percent, but only a 0.1 percent decrease in the income tax. The minimum ETR in 2012 was -41.5 percent and the maximum was 371.4 percent.
There were three companies recording losses and three companies in tax benefit positions in 2012. ETRs of five companies in the study fell by more than 10 percentage points in 2012, and eight companies had an increase in their ETR of more than 10 percentage points.
Effective tax rate of the Chemicals sector – profitable companies only
Figure 2 shows the ETR trend when all companies that have incurred losses or been in a tax benefit position in any of the last three years are removed. After this calculation, 39 companies remained in the analysis.
The average ETR for the profitable companies over the three years was 27.6 percent. Quartile one maintained a stable level with a total movement of only 0.3 percentage points between 2010 and 2012. During the same
period, the range between quartile three and quartile one decreased from 9.4 percentage points to 8.2 percentage points. There were five companies for which their ETR increased by more than 10 percentage points and three companies with a reduction in ETR of more than 10 percentage points between 2011 and 2012.
In the study, there were 22 US-based profitable companies for three years, and the average ETR of these US companies increased by an average of 0.7 percentage points between 2011 and 2012, contributing to the overall increase.
Figure 1—Effective tax rate for Chemicals sector—all companies
26.4%
20.8%23%22.6%
28.5%
31.1%32.1%
26.5%
33.9%
Average
Quartile 1
Quartile 3
0%
10%
20%
30%
40%
201220112010
Figure 2—Effective tax rate for Chemicals sector— profitable companies only
27.5%
23.2% 23.5%22.9%
28.4%
31.5%32.6%
27%
31.7%
Average
Quartile 1
Quartile 3
0%
10%
20%
30%
40%
201220112010

35 Assessing tax: 2013 tax rate benchmarking study
Figure 3—Drivers of the effective tax rate in the Chemicals sector in 2012
Average impact of driversNumber of companies reporting driver
Change in tax rate
Various other adjustments
Other—company description
Tax reserve adjustments
Non taxable income and nondeductible expenses
Impact of foreign operations
Tax losses and change in thevaluation allowance
Tax incentive
-5.0% -4.0% -3.0% -2.0% -1.0% 0.0% 1.0% 2.0% 3.0% 4.0% 5.0%
25
21
38
27
19
35
22
9
-3.5%
-3.0%
-2.5%
-1.5%
-0.8%
-0.2%
0.1%
2.6%
Drivers of the effective tax rate in the Chemicals sector
Forty-three companies in the study disclosed reconciliation between their statutory and effective rate in their company accounts, and it was possible to gain some insight into the drivers of the effective rate in the Chemicals sector by reviewing this analysis.
The effective rate for 34 companies was below the statutory rate, and for nine companies it was above the statutory rate. The reconciling items as disclosed in the statutory/effective rate reconciliation were analyzed, collated, and averaged over the sample.
Figure 3 shows how frequently the drivers appear in statutory/effective rate reconciliations and the impact they have on the ETR. The bars on the left of the chart show the number of companies reporting the driver. The 0 percent line represents the statutory rate, and the bars on this line show the impact of the driver, both favorable and unfavorable, excluding single outlying ratios in excess of +50 percent or -50 percent.
The benefit of the lower tax rates in other jurisdictions was clearly reflected in the reconciliations of companies in the Chemicals sector, with 38 experiencing an average favorable impact of -2.5 percent in 2012. Tax incentives have also
lowered average ETRs by 3.5 percent, due to the domestic manufacturing and R&D activities undertaken in the Chemicals sector, although in the US, the research and development credits temporarily expired in 2012.
Changes in tax rate have increased the ETR on average by 2.6 percent in the nine companies that disclosed this reconciling item. Japanese companies were a significant factor in increasing the average rate as the introduction of a corporation tax rate reduction from April 2012 decreased the net benefit of deferred tax assets and consequently increased income tax expense for the year to March 2012.

36 Assessing tax: 2013 tax rate benchmarking study
Figure 4—Closing UTB total balance
Mill
ion
$
0
2,000
4,000
6,000
8,000
10,000
12,000
14,000
201220112010
Closing balances
Trend
0%
20%
40%
60%
80%
100%
120%
140%
160%
180%
100.0%113.4%
152.8%
Unrecognized tax benefits
Accounting for uncertainty in income taxes can be complex, and criteria exist in the US for the recognition and measurement of unrecognized tax benefits resulting from uncertain tax benefits. There is a two-step approach to evaluating tax positions and determining if they should be recognized in the financial statements. Tax positions that are ‘more likely than not’ to be sustained upon examination must be measured using specified criteria.
Figure 4 shows that total balances in the 27 companies reporting this US disclosure requirement increased by 39.4 percentage points between 2011 and 2012, using the 2010 UTB balance as the baseline (100 percent). The maximum increase was 550 percent and minimum decrease was -39 percent. Total UTBs for all companies at the end of 2012 amounted to $11.5 billion. On an individual company basis, the average UTB was $428 million.
Unrepatriated earnings
US-based multinationals doing business outside of the US are required to account for the tax effects (deferred tax liability) associated with remitting such earnings to the US unless those unremitted earnings are permanently reinvested outside the US. The amount of undistributed non US earnings has grown in recent years. We analyzed the level of unrepatriated earnings reported by the study companies and the movement compared with last year.
Twenty-six US-based multinationals in the study disclosed the cumulative amount of undistributed earnings from their foreign subsidiaries on which the parent company had not recognized income tax.
The average increase in unrepatriated earnings between 2011 to 2012 as a percentage of the income before tax in 2012 amounts to 64.6 percent (median 19.0) for the companies reporting this item.

37 Assessing tax: 2013 tax rate benchmarking study
Air Products & Chemicals, Inc.Akzo Nobel N.V.Albemarle Corp.Arkema S.A.Ashland, Inc.BASF SEBayer AGCelanese Corp.CF Industries Holdings, Inc.Chemtura CorpChina Petroleum & Chemical Corp(The) Clorox CoCytec Industries, Inc.DIC Corp(The) Dow Chemical Co. E. I. DuPont De Nemours And Co.Eastman Chemical Co.Ecolab IncExxonMobil CorpFerro CorpFMC Corp.Huntsman Corp.Innophos Holdings IncInternational Flavors & Fragrances Inc
Kuraray Co.,Ltd.L’Air Liquide S.A.Lanxess AGLinde AGLyondellbasell Industries N.V.Methanex Corp.Mitsubishi Chemical Holdings Corp.Mitsui Chemicals,Inc.Monsanto Co.(The) Mosaic Co.Newmarket Corp.N L Industries IncPotash Corporation of Saskatchewan Inc.PPG Industries, Inc.Praxair, Inc.Reliance Industries LtdRockwood Holdings, Inc.Royal DSM N.V.Sigma-Aldrich Corp.Sinopec Shanghai Petrochemical Co. Ltd.Sumitomo Chemical Co., Ltd.Syngenta LtdWestlake Chemical Corp.
Companies included in the Chemicals sector

38 Assessing tax: 2013 tax rate benchmarking study
In 2012, US construction saw a modest recovery due to underlying demand resulting from growing consumer confidence, lower house prices, and rising rental costs. There was also the benefit of low mortgage rates and fewer existing homes for sale. The construction sector responded to aging public infrastructure, a greater focus on energy saving, environmental concerns, and storm repairs in some countries. The long-term outlook is expected to be positive due to projected US population growth, although the US property recovery is threatened by tight mortgage conditions. In contrast, Asian house sales declined over the period.
Mining and construction equipment companies saw opportunities in China and India, building factories and services centers in emerging markets. US shale gas development offered opportunities for engineering firms specializing in mining. Japanese engineering firms were affected by Yen appreciation, the economic slowdown in the US and UK, and natural disasters (Japan quake, Thailand floods). However, these firms saw growth in environmentally friendly technology such as LED lighting and energy-efficient air conditioners. Engineering firms may benefit from the low price of natural gas, and the increase in domestic oil and gas output may spur on modification of heavy industrial facilities.
The E&C Tax Rate Benchmarking study for 2013 incorporates company data for 53 companies for accounting periods ending in 2012. Thirty-seven companies in the study had calendar year ends, seven companies had September year ends, and the remainder were at other times during the year. The data for three companies were not available at the time of finalizing this study. The companies included in the study are detailed at the end of this section.
Effective tax rate of the E&C sector—all companies
The average thre-year ETR of the E&C sector is 21.3 percent (Figure 1). The rate has remained constant over three years, moving only 0.4 percent between 2010 and 2012. Companies have been returning to profit in this
sector, with 27 of the companies surveyed seeing their pre-tax income increase from 2011. The ETR has been volatile during this period, which has been reflected in the range between the quartiles over the past three years. The range was 29.6 percentage points in 2010, 27.0 percentage points in 2011, and 28.8 in 2012, which is wider than all other sectors, which have an average inter-quartile range of around 10 percent. This volatility in the inter-quartile range can be explained by low profitability – especially in quartile one – where continuing economic weakness has helped to distort the ETR. In 2010 and 2011, 18 companies were loss-making compared with 13 in 2012. Many individual companies saw fluctuations in ETR; the ETR fell by more than 10 percentage points in 12 companies, and increased by more than 10 percentage points in 12 companies.
Tax rate benchmarking for the Engineering & Construction sector
Figure 1—Effective tax rate for E&C sector—all companies
21.5%
5.6% 5.8%6.4%
21.1%
33.4%35.2%
21.4%
34.6%
Average
Quartile 1
Quartile 3
0%
10%
20%
30%
40%
201220112010

39 Assessing tax: 2013 tax rate benchmarking study
Effective tax rate of the E&C sector—profitable companies only
With many companies in a loss making position, ETRs can be distorted. Figure 2 shows the ETR trend when all companies that have been loss making or in a tax benefit position in any of the last three years are removed. Twenty-five companies remain in the analysis.
Quartile one has seen a slower increase in ETR than the average and quartile three. The ETR fell by more than 10 percentage points for one company in our analysis and increased by more than 10 percentage points for five companies.
Figure 2—Effective tax rate for E&C sector—profitablecompanies only
23.9%
28.4%30.5%28.1%
24.8%
33.7%32.9%
24.4%
34.9%
Average
Quartile 1
Quartile 3
0%
10%
20%
30%
40%
201220112010
Figure 3—Drivers of the effective tax rate in the E&C sector in 2012
Average impact of driversNumber of companies reporting driver
Tax losses and change in thevaluation allowance
Non taxable income and nondeductible expenses
Change in tax rate
Other—company description
Impact of foreign operations
Various other adjustments
Tax incentive
Tax reserve adjustments
-10.0% -8.0% -6.0% -4.0% -2.0% 0.0% 2.0% 4.0% 6.0% 8.0% 10.0%
21
17
16
43
39
8
29
31
-5.6%
-4.2%
-3.6%
-1.4%
1.1%
2.7%
4.5%
5.0%
Drivers of the effective tax rate in the E&C sector
Forty-seven companies in the study disclosed a reconciliation between their statutory and effective rates in their company accounts, and it was
possible to gain some insight into the drivers of the effective rate in the E&C sector by reviewing this analysis.
The effective rate for 30 companies was below the statutory rate, and for 17 companies it was above the

40 Assessing tax: 2013 tax rate benchmarking study
statutory rate. The reconciling items as disclosed in the statutory/effective rate reconciliation were analyzed, collated, and averaged over the sample.
Figure 3 shows how frequently the drivers appear in statutory/effective rate reconciliations and the impact they have on the ETR. The bars on the left of the chart show the number of companies reporting the driver. The 0 percent line represents the statutory rate and the bars on this line show the impact of the drivers, both favorable and unfavorable, excluding single outlying ratios in excess of +50 percent or -50 percent.
Tax incentives have been a significant factor in driving down tax liabilities, particularly such factors as domestic manufacturing deductions and general business credits. Various other adjustments, including depletion, the effect of associates, and net tax benefits of non-controlling interests share of income, have also been a contributing factor.
By contrast, changes in tax rates have had the opposite influence on the ETR, causing it to rise by 2.7 percent on average due to the influence of Japanese companies. The introduction of a corporation tax rate reduction in Japan in April 2012 decreased the net benefit of deferred tax assets and consequently increased income tax expense for the year to March 2012.
This factor has affected only a small number of companies in this sector. However, tax losses and changes in the valuation allowance have been more significant, driving the ETR up by 5.0 percent on average. Tax losses and changes in the valuation allowance can be a favorable driver when previously unrecognized losses are used or unfavorable when a view is taken that losses will not be able to be used. This year they were an unfavorable driver, principally due to movements in the valuation allowance.
Unrecognized tax benefits
Accounting for uncertainty in income taxes can be complex, and criteria exist in the US for the recognition and measurement of unrecognized tax benefits resulting from uncertain
tax benefits. There is a two-step approach to evaluating tax positions and determining if they should be recognized in the financial statements. Tax positions that are ‘more likely than not’ to be sustained upon examination must be measured using specified criteria.
Figure 4 shows that total UTB balances in the 38 companies reporting this US disclosure requirement decreased by 22.2 percentage points between 2011 and 2012, using the 2010 UTB balance as the baseline (100 percent). The maximum increase was 625 percent and minimum decrease was -99 percent. Total UTBs for all companies at the end of 2012 amounted to $1.2 billion. On an individual company basis, the average UTB was $32 million.
Figure 4—Closing UTB total balance
Mill
ion
$
0
400
800
1,200
1,600
2,000
201220112010
Closing balances
Trend
0%
20%
40%
60%
80%
100%
120%100.0%
93.0%
70.8%

41 Assessing tax: 2013 tax rate benchmarking study
Unrepatriated earnings
US-based multinationals doing business outside of the US are required to account for the tax effects (deferred tax liability) associated with remitting such earnings to the US unless those unremitted earnings are permanently reinvested outside the US. The amount of undistributed non US earnings has grown in recent years. We analyzed the level of unrepatriated earnings reported by the study companies and the movement compared with last year.
Twelve US-based multinationals disclosed the cumulative amount of undistributed earnings from their foreign subsidiaries on which the parent company had not recognized income tax.
The average increase in unrepatriated earnings between 2011 to 2012 as a percentage of the income before tax in 2012 amounts to 81.9 percent (median 7.1) for the companies reporting this item.

42 Assessing tax: 2013 tax rate benchmarking study
Companies included in the E&C sector
Abertis Infraestructuras S.AACS Actividades De Construccion Y Servicios S.A.AECOM Technology Corp.Armstrong World Industries, Inc.Balfour Beatty PlcBeacon Roofing Supply, Inc.Beazer Homes USA, Inc.Bouygues S.A.Builders FirstSource, Inc.Cascade Corp.CEMEX, S.A.B. de C.V.Chicago Bridge & Iron Co. N.V.COLAS S.A.CRH Plc.D.R. Horton, Inc.EMCOR Group, Inc.FERROVIAL, S.A.Fluor Corp.Foster WheelerGranite Construction, Inc.HeidelbergCement AGHolcim LtdHovnanian Enterprises, Inc.Integrated Electrical Services, Inc.Jacobs Engineering Group, Inc.James Hardie Industries SEJoy Global, Inc.
KB Home KBR, Inc.Lafarge S.A.Lennar Corp.Martin MariettaMeritage Homes Corp.NACCO Industries, Inc.NCI Building Systems, Inc.NVR, Inc.Owens CorningPulteGroup, Inc.Quanta Services, Inc.Ryland Group, Inc.Samsung Engineering Co.,LtdSkanska ABStandard Pacific Corp.Tel.Pacific Ltd.Tetra Tech, Inc.Toll Brothers, Inc.Toshiba/WestinghouseURS Corp.US ConcreteUSG Corp.VINCIVulcan Materials Co.Willbros

43 Assessing tax: 2013 tax rate benchmarking study
In 2012, metals companies were struggling globally due to economic uncertainty (e.g., debt crisis in the UK, the fiscal cliff in the US, a slow rebound in end-use markets, etc.), which has manifested in soft pricing for both aluminum and steel. On the cost side, raw material costs, including energy, have been high and/or volatile, which has made managing costs difficult. There is cautious optimism as certain markets are slowly coming back (e.g. automotive, A&D).
The IM&M tax rate benchmarking study for 2013 was carried out for 52 companies on their 2012 accounting periods. Thirty-six companies in the study had calendar year ends, nine companies had March year ends, and the remainder were at other times during the year. Data for four were not available at the time the study was finalized. The companies included in the study are detailed at the end of this section.
Effective tax rate of the IM&M sector—all companies
In 2012 the average ETR was 30.5 percent, representing the highest average ETR for all sectors. This is consistent with our understanding of the sector historically, as its overall three year average of 29.2 percent is higher than other sectors, a result of the fact that metals companies are often subject to sector-specific taxes that raise the ETR (Figure 1). The recent upward trend in the ETR after 2011 has also seen an increase in the range between the quartiles from 10.3 percentage points in 2011 to 11.9 in 2012. This has partly been driven by seven companies reporting a fall in ETR by more than 10 percentage points between 2011-2012 and five firms reporting an increase of over 10 percentage points.
Tax rate benchmarking for the Industrial Manufacturing & Metals (IM&M) sector
Figure 1—Effective tax rate for IM&M sector—all companies
28.5%
22.9% 24.1%23.3%
30.5%
33.6% 33.6%
28.7%
36.0%
Average
Quartile 1
Quartile 3
0%
10%
20%
30%
40%
35%
25%
15%
5%
201220112010
Effective tax rate of the IM&M sector—profitable companies only
Figure 2 shows the ETR trend when all companies that have been loss making or in a tax benefit position in any of the last three years are removed. Forty-one companies remain in the analysis.
ETRs dropped in 2011 from their 2010 levels but increased in 2012. Quartile three dropped from 33.9 percent in 2010 to 32.5 percent in 2011, before rising again to 35.8 percent. A similar pattern is evident in quartile one, where the 2011 figure of 23.4 percent was lower than in 2010, but then rose to 24.9 percent in 2012.
Drivers of the effective tax rate in the IM&M sectorThirty-nine companies in the study disclosed reconciliation between their statutory and effective rates in their company accounts and it was possible to gain some insight into the drivers of the effective rate in the E&C sector by reviewing this analysis.The effective rate for 20 companies was below the statutory rate, and for 19 companies it was above the statutory rate. The reconciling items as disclosed in the statutory/effective rate reconciliation were analyzed, collated, and averaged over the sample.

44 Assessing tax: 2013 tax rate benchmarking study
Figure 3 shows how frequently the drivers appear in statutory/effective rate reconciliations and the impact they have on the ETR. The bars on the left of the chart show the number of companies reporting the driver. The 0 percent line represents the statutory rate, and the bars on this line show the impact of the drivers, both favorable and unfavorable, excluding single outlying ratios in excess of +50 percent or -50 percent.
Traditionally, the most commonly reported favorable driver in IM&M is the impact of foreign operations. This is consistent with our results in Figure 3, where over 36 companies disclosed this factor as being beneficial to their ETRs. Tax incentives also had a noticeable effect on the ETR, most significantly the impact of research
and development credits in reducing companies’ tax burdens, although in the US, the research and development credits temporarily expired in 2012. By contrast, changes in the tax rate have increased ETR by 2.1 percent on average, specifically those countries with falling statutory rates, such
Figure 2—Effective tax rate for IM&M sector—profitablecompanies only
25.5%
29.8% 30.7%28.4%
24.9%
32.5%33.9%
23.4%
35.8%
Average
Quartile 1
Quartile 3
0%
10%
20%
30%
40%
201220112010
as Japan, where the introduction of corporation tax rate reductions from April 2012 decreased the net benefit of deferred tax assets and consequently increased income tax expense for the year to March 2012. Even so, when analyzing drivers in the sector as a whole, it
Figure 3—Drivers of the effective tax rate in the IM&M sector in 2012
Average impact of driversNumber of companies reporting driver
Change in tax rate
Other - company description
Non taxable income and nondeductible expenses
Tax losses and change in thevaluation allowance
Various other adjustments
Tax reserve adjustments
Tax incentive
Impact of foreign operations
-5.0% -4.0% -3.0% -2.0% -1.0% 0.0% 1.0% 2.0% 3.0% 4.0% 5.0%
36
21
19
17
25
28
32
14
-3.3%
-2.5%
-0.6%
-0.1%
0.4%
0.5%
0.5%
2.1%

45 Assessing tax: 2013 tax rate benchmarking study
Figure 4—Closing UTB total balance
Mill
ion
$
0
2,000
4,000
6,000
8,000
10,000
12,000
201220112010
Closing balances
Trend
0%
20%
40%
60%
80%
100%
120%
100.0%
89.8% 88.6%
is clear that this driver has affected only 14 companies in the sector. A more frequent driver is tax losses and valuation allowance, although the average impact of +0.4 percent is smaller.
Unrecognized tax benefits
Accounting for uncertainty in income taxes can be complex, and criteria exist in the US for the recognition and measurement of unrecognized tax benefits resulting from uncertain tax benefits. There is a two-step approach to evaluating tax positions and determining if they should be recognized in the financial statements. Tax positions that are ‘more likely than not’ to be sustained upon examination must be measured using specified criteria.
Figure 4 shows that total UTB balances in the 16 companies reporting this US disclosure requirement decreased by 1.2 percentage points between 2011 and 2012, using the 2010 UTB balance as the baseline (100 percent). The maximum increase was 34 percent and minimum decrease was -43 percent. Total UTBs for all companies at the end of 2012 amounted to $9.7 billion. On an individual company basis, the average UTB was $609 million.
Unrepatriated earnings
US-based multinationals doing business outside of the US are required to account for the tax effects (deferred tax liability) associated with remitting such earnings to the US unless those unremitted earnings are permanently reinvested outside the US. The amount of undistributed non US earnings has grown in recent years. However, if profits are unrepatriated, tax can be deferred. We analyzed the level of unrepatriated earnings reported by the study companies and the movement compared with last year.
Eleven companies in the study disclosed the cumulative amount of undistributed earnings from their foreign subsidiaries on which the parent company had not recognized income tax.
The average increase in unrepatriated earnings between 2011 to 2012 as a percentage of the income before tax in 2012 amounts to 38.8 percent (median 32.2) for the companies reporting this item.

46 Assessing tax: 2013 tax rate benchmarking study
Companies included in the IM&M sector
3M Co.ABB Ltd.AB VolvoAlcoa Inc.Arcelormittal S.A.Atlas Copco ABBaoshan Iron & Steel Co., Ltd.BHP Billiton PlcBridgestone Corp.Canon IncCaterpillar, Inc.Cie De Saint-Gobain SAContinental AGCorning IncDanaher Corp.Deere & Co.E.On AGEaton Corp.Emerson Electric Co.Fanuc Corp.Fortescue Metals Group Ltd.General Electric Co.Hutchison Whampoa Ltd.Hyundai Heavy Industries Co LtdIllinois Tool Works, Inc.Ingersoll-Rand Public Ltd. Co.
Itochu CorpJardine Matheson Holdings LtdJardine Strategic Holdings LtdKomatsu Ltd.Kone OyjLarsen & Toubro LtdMAN SeMichelin S.C.A.Mitsubishi Corp.Mitsubishi Electric Corp.Mitsubishi Heavy Industries, Ltd.Mitsui & Co LtdNippon Steel & Sumitomo Metal Corp.Nucor Corp.PACCAR IncPOSCORio Tinto PlcSandvik ABSchneider Electric SASiemens AGTata MotorTeck Resources Ltd.Tenaris SATyco International Ltd.US Steel Vale S.A.

47 Assessing tax: 2013 tax rate benchmarking study
Tax rate benchmarking for the Transportation & Logistics sector
In 2012, logistics companies saw continued price pressure, with a switch to economy products. Challenges included volatile fuel prices and the need to enhance the speed of freight routes, with the main opportunity coming from the growing freight requirements of online sales.
In 2012 there were significant challenges for airline and shipping groups. Airline groups saw demand growth in China and for low-cost flights, but depressed sales in Japan due to the Japanese earthquake. Fuel prices rose, causing airlines to acquire more fuel-efficient planes. Shipping groups were challenged by lower freight rates, the vessel supply glut (a result of additional deliveries ordered in better economic times), and lower seaborne transport of cars due to the Japanese earthquake. Shipping companies have responded
by reducing the number of tankers and the number of vessels on spot contracts, and by focusing on liquid natural gas vessels. In the longer term, there should be a steady increase in airborne and seaborne trade due to growing populations.
The T&L tax rate benchmarking study for 2013 was carried out for 55 companies with accounting periods ending in 2012. Forty-four companies in the study had calendar year ends, nine companies had March year ends, and the remainder were at other times during the year. Data for eight were not available at the time the study was finalized. The companies included in the study are detailed at the end of this section.
Effective tax rate of the T&L sector—all companies
Figure 1 shows that the average three year ETR for the T&L sector is 29.0 percent, which is the second highest average rate within the six sectors analyzed. The average ETR increased after 2010 and the range between quartile three and one has fluctuated (23.0, 18.0, and 29.6 percentage points in 2012, 2011, and 2010, respectively).
The maximum ETR in 2012 was 272.3 percent and the minimum was -126.5 percent. ETR for eight companies increased more than 10 percentage points and eight companies saw a reduction of more than 10 percentage points between 2011 and 2012.
In the 2012 study for the T&L sector, there were seven companies in a loss position and four companies in a tax benefit position, which is similar to the seven loss companies and three firms in a tax benefit position in 2011.
Figure 1—Effective tax rate for T&L sector—all companies
8.7%
15.5%
20%
38%38.3%
27.6%29.8%
38.5%
29.6%
Average
Quartile 1
Quartile 3
0%
10%
20%
30%
40%
201220112010

48 Assessing tax: 2013 tax rate benchmarking study
Effective tax rate of the T&L sector—profitable companies only
Figure 2 shows the ETR trend when all companies that have been loss making or in a tax benefit position in any of the last three years are removed. After this calculation, 33 companies remained in the analysis.
The average ETR for the three years was 32.6 percent, which was the highest rate compared with the other sectors in the study for profitable companies. There has been a steady trend for each quartile between 2010 and 2012. The ETR fell by more than 10 percentage points for four companies and increased by more than 10 percentage points for three companies.
Drivers of the effective tax rate in the T&L sector
Forty companies in the study disclosed a reconciliation between their statutory and effective rates in their company accounts, and it was possible to gain some insight into the drivers of the effective rate in the T&L sector by reviewing this analysis.
Figure 2—Effective tax rate for T&L sector—profitablecompanies only
25.3%
33.1%
23.9%
32.9%
38.7%38.4%
31.8%
24.4%
38.5%
Average
Quartile 1
Quartile 3
0%
10%
20%
30%
40%
201220112010
The effective rate for 27 companies was below the statutory rate, and for 13 companies, it was above the statutory rate. The reconciling items as disclosed in the statutory/effective rate reconciliation were analyzed, collated, and averaged over the sample.

49 Assessing tax: 2013 tax rate benchmarking study
Figure 3—Drivers of the effective tax rate in the T&L sector in 2012
Average impact of driversNumber of companies reporting driver
Various other adjustments
Tax reserve adjustments
Change in tax rate
Non taxable income and nondeductible expenses
Impact of foreign operations
Other—company description
Tax losses and change in thevaluation allowance
Tax incentive
-10.0% -8.0% -6.0% -4.0% -2.0% 0.0% 2.0% 4.0% 6.0% 8.0% 10.0%
9
16
34
34
26
11
11
8
-4.0%
-2.5%
0.3%
0.6%
1.2%
1.5%
2.2%
7.8%
Figure 3 shows how frequently the drivers appear in statutory/effective rate reconciliations and the impact they have on the ETR. The bars on the left of the chart show the number of companies reporting the driver. The 0 percent line represents the statutory rate, and the bars on this line show the impact of the drivers, both favorable and unfavorable, excluding single outlying ratios in excess of +50 percent or -50 percent.
For the T&L sector, the most common reconciling item, reported by 34
companies, was the impact of foreign operations, which increased the ETR by 0.6 percent. Interestingly, this driver had a favorable impact on ETR for the other five sectors.
Although the average impact of tax incentives was -4.0 percent for this sector, this reconciling item was reported by only nine companies in the study. The other factor having a favorable -2.5 percent impact on the ETR was “tax losses and change in valuation allowance,” which was reported by 16 companies.
“Various other adjustments” were a large unfavorable driver for the T&L sector. The average rate for this item mainly increased as a consequence of “additional tax in the oil segment” and the “tax effect of acquisitions/divestitures.”
Unrecognized tax benefits
Accounting for uncertainty in income taxes can be complex, and criteria exist in the US for the recognition and measurement of unrecognized tax benefits resulting from uncertain
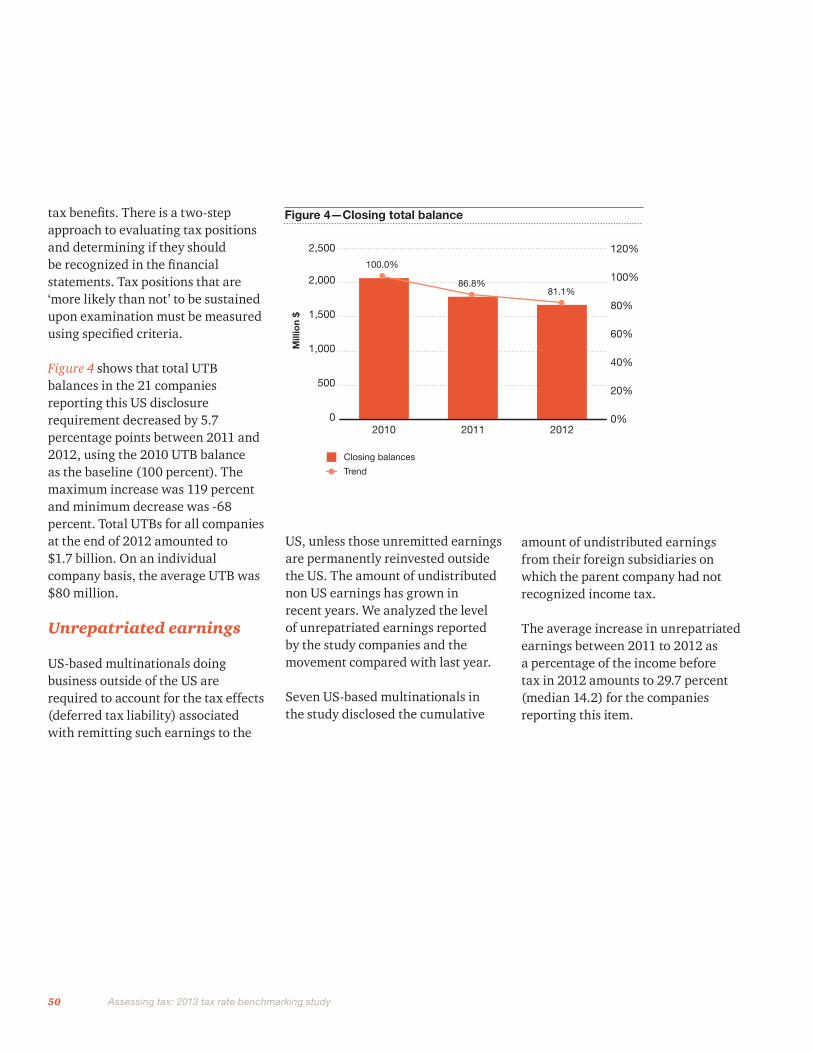
50 Assessing tax: 2013 tax rate benchmarking study
tax benefits. There is a two-step approach to evaluating tax positions and determining if they should be recognized in the financial statements. Tax positions that are ‘more likely than not’ to be sustained upon examination must be measured using specified criteria.
Figure 4 shows that total UTB balances in the 21 companies reporting this US disclosure requirement decreased by 5.7 percentage points between 2011 and 2012, using the 2010 UTB balance as the baseline (100 percent). The maximum increase was 119 percent and minimum decrease was -68 percent. Total UTBs for all companies at the end of 2012 amounted to $1.7 billion. On an individual company basis, the average UTB was $80 million.
Unrepatriated earnings
US-based multinationals doing business outside of the US are required to account for the tax effects (deferred tax liability) associated with remitting such earnings to the
US, unless those unremitted earnings are permanently reinvested outside the US. The amount of undistributed non US earnings has grown in recent years. We analyzed the level of unrepatriated earnings reported by the study companies and the movement compared with last year.
Seven US-based multinationals in the study disclosed the cumulative
Figure 4—Closing total balance
Mill
ion
$
0
500
1,000
1,500
2,000
2,500
201220112010
Closing balances
Trend
0%
20%
40%
60%
80%
100%
120%100.0%
86.8%81.1%
amount of undistributed earnings from their foreign subsidiaries on which the parent company had not recognized income tax.
The average increase in unrepatriated earnings between 2011 to 2012 as a percentage of the income before tax in 2012 amounts to 29.7 percent (median 14.2) for the companies reporting this item.

51 Assessing tax: 2013 tax rate benchmarking study
Companies included in the T&L sector
A.P. Moeller - Maersk A/SAeroports De Paris SaAir CanadaAir China LtdAir France Klm SaAir Methods CorpAlaska Air Group IncAll Nippon Airways Co LtdAtlas Air Worldwide Holdings Inc.Berkshire Hathaway IncBrisa Auto Estradas De Portugal SaC.H. Robinson Worldwide Inc.Canadian National Railway Co.Canadian Pacific Railway Ltd.Cathay Pacific Airways LtdChina Cosco Holdings Co LtdChina Merchants Holdings (International) Co LtdChina Shipping Container Lines Co LtdChina Shipping Development Co LtdChina Southern Airlines Co LtdCon-Way Inc.CSX Corp.Delta Air Lines IncDeutsche Lufthansa AGDeutsche Post AGExpeditors International of Washington Inc.FedEx Corp.Fraport Frankfurt Airport Services Worldwide AGGenesee & Wyoming Inc.Hyundai Merchant Marine Co LtdJ. B. Hunt Transport Services Inc.
JetBlue Airways CorpKansas City SouthernKuehne & Nagel International AGLandstar System Inc.Macquarie Infrastructure Co. LLC.MISC BhdMitsui O.S.K. Lines LtdNippon Express Co., Ltd.Nippon Yusen KkNorfolk Southern Corp.Orient Overseas (International) LtdQantas Airways LtdRyanair Holdings PlcRyder System Inc.Shanghai International Airport Co LtdShanghai International Port (Group) Co LtdSingapore Airlines LtdSouthwest Airlines CoTNT Express N.V.Union Pacific CorpUnited Continental Holdings IncUnited Parcel Service Inc.US Airways Group IncYamato Holdings Co Ltd

52 Assessing tax: 2013 tax rate benchmarking study
Appendix:
Source of information and analysis
Source of informationOur financial analysis was based on a number of ratios derived from publicly available information. This allowed for a large sample size of 316 companies without the need to contact each company, giving us a dependable overview from which to draw our conclusions.
Statistical analysis
Trimmed averageOur conclusions are based on a statistical analysis of the ratios. In a tax benchmarking exercise of this nature, particular ratios may be distorted because of one-off, nonrecurring items. Exceptional items, for example, often attract associated tax at rates far from the statutory rate.
It was necessary to exclude these extreme values, and this was done consistently by taking a trimmed average of a particular sample. The trimmed average is the average result of the data, derived by excluding 15 percent of the data points from both the top and bottom of the data set. It is a robust estimate of the location of a sample, excluding outlying data points.
QuartilesThese record the ratio where 75 percent (upper quartile) and 25 percent (lower quartile) of the sample companies lie below these points. By displaying results in this manner, it is possible to identify the range in which the results of the majority of companies fall.

Notes:

This publication has been prepared for general guidance on matters of interest only, and does not constitute professional advice. You should not act upon the information contained in this publication without obtaining specific professional advice. No representation or warranty (express or implied) is given as to the accuracy or completeness of the information contained in this publication, and, to the extent permitted by law, PricewaterhouseCoopers LLP, its members, employees and agents do not accept or assume any liability, responsibility or duty of care for any consequences of you or anyone else acting, or refraining to act, in reliance on the information contained in this publication or for any decision based on it.
© 2013 PwC. All rights reserved. “PwC” and “PwC US” refer to PricewaterhouseCoopers LLP, a Delaware limited liability partnership which is a member firm of PricewaterhouseCoopers International Limited, each member firm of which is a separate legal entity. This document is for general information purposes only, and should not be used as a substitute for consultation with professional advisors.. NY-13-0658
www.pwc.com/us/industrialproductstax
Michael W. Burak US & Global Industrial Products Tax Leader +1.973.236.4459 [email protected]
Don Longano Principal, Washington National Tax Services +1.202.414.1647 [email protected]
Drew Lyon Partner, National Economics and Statistics +1.202.414.3865 [email protected]
Brian Meighan Partner, Washington National Tax Services +1.202.414.1790 [email protected]
Janet Kerr/Duygu Turkoglu Tax Rate Benchmarking +44.20.7804.7134 [email protected] [email protected]
Neil G. Bristol US Automotive Industry Tax Leader +1.313.394.3915 [email protected]
Jamie B. Grow US Aerospace & Defense Tax Leader +1.703.918.3458 [email protected]
Matthew H. Bruhn US Chemicals Tax Leader +1.973.236.5588 [email protected]
Allen Pryor US Engineering & Construction Tax Leader +1.214.754.4570 [email protected]
Keith Rymer US Industrial Manufacturing Tax Leader +1.267.330.3481 [email protected]
Michael Tomera US Metals Tax Leader +1. 412.355.6095 [email protected]
Michael J. Muldoon US Transportation & Logistics Tax Leader +1.904.366.3658 [email protected]
Andrew Prior Managing Director, Legislative & Regulatory Services +1.202.414.4572 [email protected]
Phillip Galbreath Director, Tax Knowledge Management +1.202.414.1496 [email protected]
John Stell Director, National Economics and Statistics +1.202.312.7583 [email protected]
Kristin Ritter Marketing Director, US & Global Automotive Industry +1.313.394.6349 [email protected]
Diana Garsia Marketing Manager, US Industrial Products +1.973.236.7624 [email protected]
Contacts
To have a deeper conversation about how these subjects may affect your business, please contact: