NWTC Wind Integration: What Have We Learned? Michael Milligan Consultant National Renewable Energy...
34
NWTC Wind Integration: What Have We Learned? Michael Milligan Consultant National Renewable Energy Laboratory Planning for Wind Workshop NW Power & Conservation Council Portland, OR Dec 5, 2003
-
Upload
jasmin-booth -
Category
Documents
-
view
214 -
download
0
Transcript of NWTC Wind Integration: What Have We Learned? Michael Milligan Consultant National Renewable Energy...

NWTC
Wind Integration: What Have We
Learned?
Michael Milligan
Consultant
National Renewable Energy Laboratory
Planning for Wind Workshop
NW Power & Conservation Council
Portland, OR
Dec 5, 2003

NWTC
Utility Wind Interest Group
• Interest in UWIG has surged as more utilities have evaluated/adopted wind
• “Clearing house” for operational issues, solutions, etc.
• www.uwig.org
NWTC
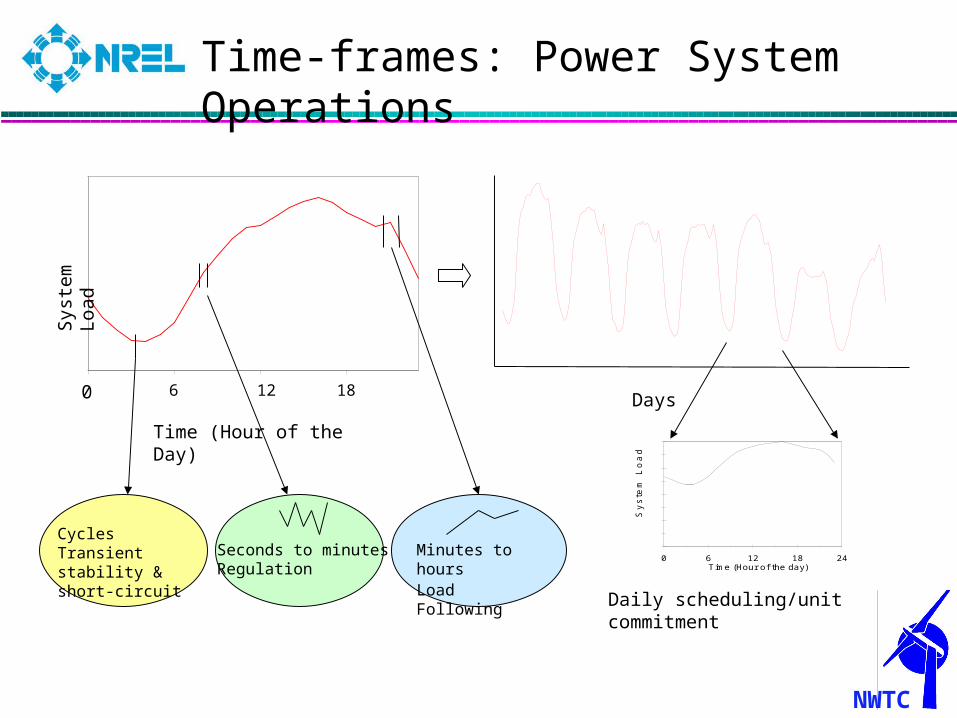
2000
3600
0 6 12 180 6 12 18
Time (Hour of the Day)
Sys
tem
Loa
d
Seconds to minutesRegulation
Minutes to hoursLoad Following
Days
0
25
50
75
100
Sy
ste
m L
oa
d
0 6 12 18 24Time (Hour of the day)
Daily scheduling/unit commitment
Time-frames: Power System Operations
CyclesTransient stability & short-circuit

NWTC
Brief Outline
• Planning horizon– Geographic
benefit/reliability
• Operational horizons– Load following– Reserve allocation based on
reliability modeling
• Overview of CA Renewable Portfolio Standard Integration Study– Capacity value– Regulation– Load following
• Summary of Operations Studies

NWTC
Geographically Disperse Wind Development
• Two projects:– Joint project
with Minnesota Department of Public Service (Commerce)
– Joint project with Iowa Wind Energy Institute

-30
-20
-10
0
10
20
30
1-H
our
MW
Diffe
rence
AlgonaAlta
ArlingtCedar
EstherForest
InwoodRadclif
RedoakSibley
SutherlTurin
Combine
Site
Iowa First-Order Difference RangesSimulated Power Production 7/97
Maximum, Minimum, Mean+stdev, Mean-stdev
Iowa One-Hour Delta Hourly Output

-20
-10
0
10
20
30
MW
Diffe
rence (
1-h
our)
AlbertaBrewster
CrookstonCurrie
LuverneCombined
Site
1st Difference in Hourly MW OutputMinnesota Wind Sites, July '96
Maximum hourly difference Minimum hourly difference
25 -MW Clusters
One-Hour Delta Hourly Output

NWTC
Modeling Methods
• Minnesota: Dynamic fuzzy search to maximize system reliability
• Iowa: Dynamic fuzzy search to maximize two separate objective functions– Economic benefit– System reliability– Corroboration of the
economic benefit results with a genetic algorithm

Genetic Algorithm and Fuzzy Search Results: Economic Sites
0
5
10
15
20
25
30
35
# o
f 50-M
W C
luste
rs
12
34
56
78
910
1112
1314
1516
1718
1920
Solution Rank
Alg Alt Est For Rad Sib
G G G G G G G G

Tradeoff: Reliability vs. Economics
93
94
95
96
97
98
99
100
Pe
rce
nt
of
Op
tim
al C
ap
acity C
red
it
97.5 98.0 98.5 99.0 99.5 100.0 Percent of Optimal Economic Value
Best-fit Simulated

NWTC
Iowa Load Following Study
• 8 wind scenarios• Wind capacity
– 800 MW– 1,600 MW (22.7% of
peak load)
• Scenario 1– 1,300 MW at one site
• All other scenarios– Geographic spread
based on optimal locations

NWTC
Wind/No Wind Load Following
-600
-400
-200
0
200
400
600
800
1 25 49 73 97 121 145
Hour of Week
Lo
ad
Fo
llo
win
g
Re
qu
ire
me
nt
(MW
)
No Wind 1600 MW/wind 800 MW/wind
How Does Wind Affect 1-Hour Load Following?
NWTC
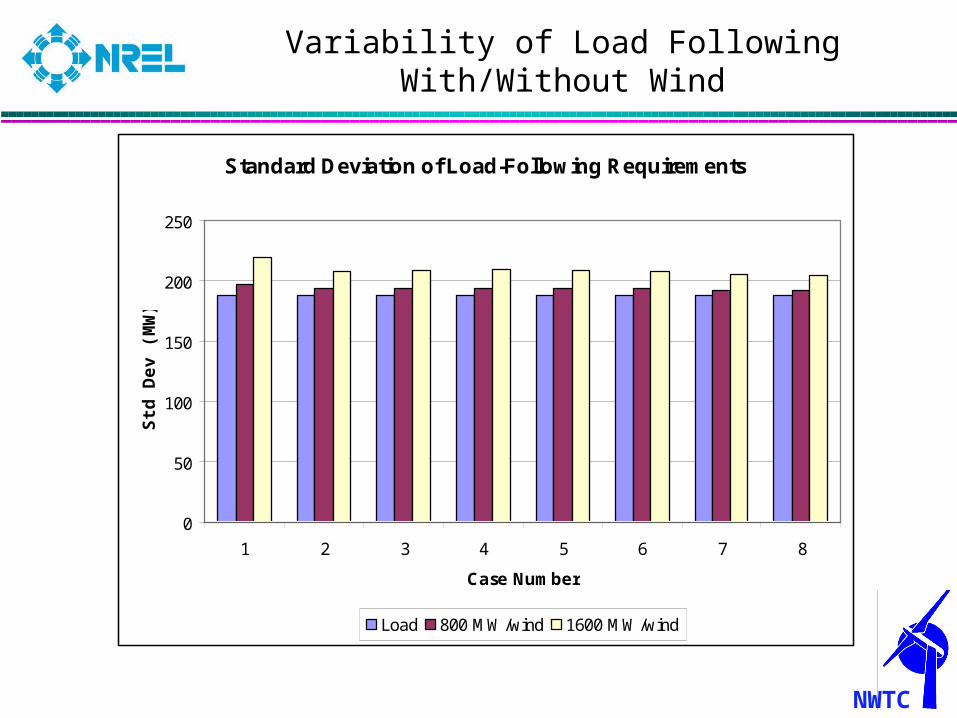
Standard Deviation of Load-Following Requirements
0
50
100
150
200
250
1 2 3 4 5 6 7 8
Case Number
Std
Dev
(M
W)
Load 800 MW/wind 1600 MW/wind
Variability of Load Following With/Without Wind

NWTC
800 MW Wind: Max/Min Change in 1-hr Ramp Requirements
-80 -60 -40 -20 0 20 40
1
2
3
4
5
6
7
8
Case
MW Change from No-wind
Down-ramp
Up-ramp
Largest Single-hour Difference at 800 MW Penetration

NWTC
Largest Single-hour Difference at 1600 MW Penetration
1600 MW Wind: Max/Min Change in 1-hr Ramp Requirements
-500 -400 -300 -200 -100 0 100 200 300
1
2
3
4
5
6
7
8
Case
MW Change from No-wind
Down-ramp
Up-ramp

NWTC
Load-Following Allocation: No Forecast Errors
0.0
0.5
1.0
1.5
2.0
2.5
3.0
3.5
4.0
0 200 400 600 800 1000 1200 1400 1600 1800
Wind Capacity
Win
d I
mp
act
on
Lo
ad F
oll
ow
ing
(P
erce
nt
of
Rat
ed)
Case 1 Max(Cases2:8)
Load Following Allocated to Wind
Difference due to geographic dispersion

NWTC
Allocation of Variation to Wind: Improvements to Wind Persistence Forecast: Good Load Forecast
0
10
20
30
40
50
60
70
400 600 800 1000 1200 1400 1600
Wind Plant Capacity
Std
Dev
(M
W)
Wind/Persistence 20% Improvement 40% Improvement
Imbalance Impact of Wind Increases with Penetration

NWTC
Iowa Load Following Conclusions
• Geographically disperse wind causes an increase in the standard deviation of load following requirements of about 2.5% of rated capacity at 22.7% penetration rate with a backward-looking analysis
• Geographically disperse wind causes an increase in the standard deviation of imbalances of about 4% of rated capacity with a simple wind forecast at 22.7% penetration rate
• Results will depend on wind regime, loads, and would be expected to differ in other situations

NWTC
Reliability-based Reserve Allocation
• Examine how much of the fraction of operating reserve that should fall on a wind power plant
• Method should be based on reliability theory and practice, and take probability of various system failures into account
• Should provide market signals that encourage reliability and accurate wind forecasts
• Strbac/Kirschen (Electricity Journal, October 2000) model fulfills these goals, except doesn’t consider wind – Milligan (AWEA/EWEA 2001) adapts to wind
• I use 1-hour wind forecast errors as “outage” rates for system reliability calculations
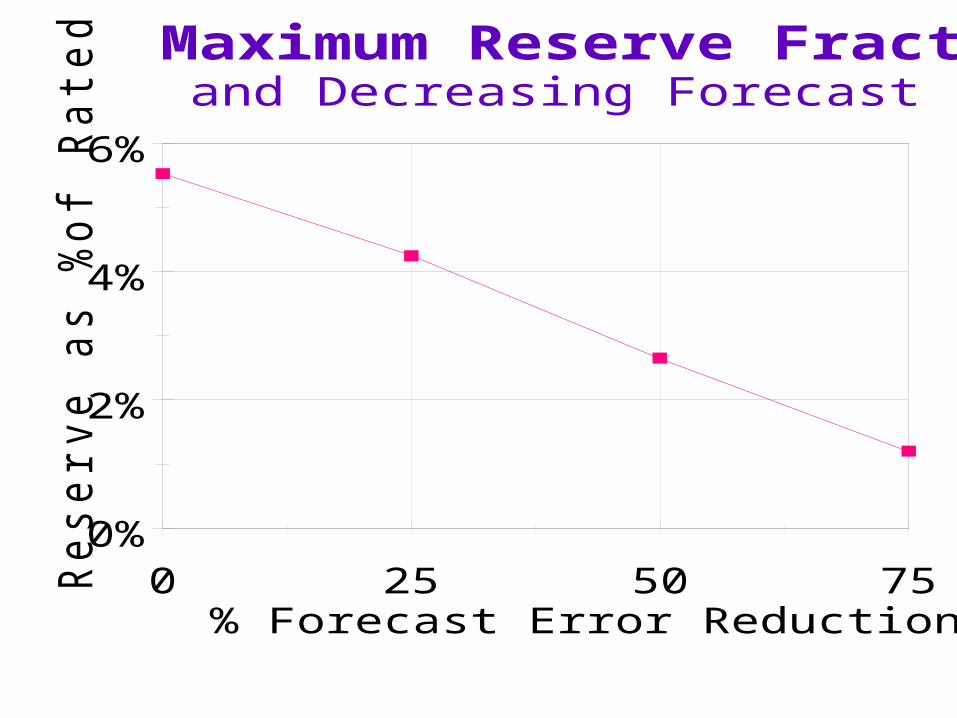
0%
2%
4%
6%
Reserv
e a
s %
of R
ate
d C
apacity
0 25 50 75% Forecast Error Reduction (from base)
Maximum Reserve Fractionand Decreasing Forecast Errors

NWTC
Effect of Geographic Diversity
0.00
0.01
0.02
0.03
0.04
0.05
0.06
Fra
ctio
n:
Re
se
rve
s t
o R
ate
d C
ap
acity
1 3 5 7 9 11 13 15Day Window Size
Estherville 1600 MW Wind Plant
0.00
0.01
0.02
0.03
0.04
0.05
0.06
Fra
ctio
n:
Re
se
rve
s t
o R
ate
d C
ap
acity1 3 5 7 9 11 13 15
Day Window Size
Combined 1600 MW Wind Plant
Geographic diversity is roughly equivalent to the 50% forecast reduction case.

NWTC
Implications
• Worse-case scenario analyzed shows the reserve allocation at about 5.5% of rated capacity of the wind plant
• Average is less than 1% of wind capacity• Improvements in forecast will reduce wind’s risk• Wind does contribute to EUE (risk)• …but at a very low rate relative to rated capacity• Geographic dispersion reduces composite forecast
error and reserve allocation

NWTC
California RPS Integration Study Project Team
• Primary investigators in Methods Group:– David Hawkins, California ISO – Brendan Kirby, ORNL– Yuri Makarov, California ISO– Michael Milligan, NREL
• California Wind Energy Collaborative– Kevin Jackson– Henry Shiu

NWTC
Transmission investments
Indirect costs
Remarketing costs
Integration costs
Total cost
Bid price
Direct cost
These are the costs incurred to incorporate the electricity from a generation source into a real-time electricity supply.

NWTC
• Identify significant characteristics of California’s load and installed renewable and conventional generators.
• Define and implement methodologies for evaluating the capacity credit for renewables.
• Provide a comparison of the capacity credit between various renewable and conventional generators.
• Define and implement methodologies for evaluating integration costs.
• Provide a comparison of the magnitude of load following and regulation services for various renewable and conventional technologies.
• The final report documenting the one year analysis results of existing generation resources has been released for public comment.
Analysis of Existing Generation
Phase I

NWTC
Data Processing
• OASIS: Open Access Same-Time Information System
• CAISO Power Information (PI) system
• Error removal
• Data storage error– Results from PI system data compression– The standard deviation of data storage error is
160 MW or ±0.6% of the average annual load.

NWTC
ELCC Results
0.0
20.0
40.0
60.0
80.0
100.0
120.0
Wind-A Wind-G Wind-T Biomass Solar Geo (1) Geo (2)
Renewable Technology
Per
cen
t o
f R
ated
C
apac
ity/
Ref
eren
ce U
nit
Capacity Credit Relative to Gas Reference Unit

Regulation Cost Results
• Used ORNL method, CA regulation prices
• A negative price means there is a cost imposed on the system.
• A positive price means there is a benefit provided to the system.
• The baseline for comparison is a generator with constant output and a regulation price of zero.
• Caution: regulation is a capacity service; cost in $/MWh as a convenience
Regulation Cost ($/MWh)
Total Load -0.42
Medium Gas 0.08
Biomass 0.00
Geothermal -0.10
Solar 0.04
Wind (Altamont) 0.00
Wind (San Gorgonio)
-0.46
Wind (Tehachapi) -0.17
Wind (Total) -0.17

NWTC
Load Following Analysis
• Deviations between the scheduled generation and the actual load requirements are compensated through purchases from the CAISO supplemental energy market.
• The system operator must compensate for aggregate scheduling error, individual errors must be viewed in the context of the full system.
• Market participants provide CAISO with bids for the hour ahead energy market and create the “stack” of available generators.
• The purpose of the load following analysis was to determine if the renewable generators affected the size or composition of the “stack” and therefore changed the cost for the load following service.

NWTC
Scheduled Hour Ahead Load

COMBINED FORECAST ERROR AND RENEWABLE SCHEDULING ERROR
Average Minimum Average Maximum
RESOURCE MW
Compared to forecast error w/out renewables
(%) MW
Compared to forecast error w/out renewables
(%)
Forecast error without renewables
-1909 100% 2220 100%
Biomass -1897 99% 2218 100%
Geothermal -1878 98% 2221 100%
Solar -1870 98% 2220 100%
Wind (Altamont) -1909 100% 2272 102%
Wind (San Gorgonio) -1898 99% 2226 100%
Wind (Tehachapi) -1884 99% 2281 103%
Wind (total) -1870 98% 2377 107%
Scheduling bias -5076 266% 1747 79%

NWTC
California Preliminary Conclusions
• Capacity credit for wind is low but non-zero– Phase II will examine higher penetration, newer
technology, and different locations
• Regulation impact of wind is small– Because of data storage error these results are not
precise, but the regulation cost adders should be used until more accurate results can be obtained in Phase II
– Will examine this issue in Phase II
• Load following impact has negligible impact on supplemental energy stack at this penetration– No cost adders for wind can be justified at this time

NWTC
Other Results
Study (Penetration) Time-Scale Cost ($/MWh)
Hirst PJM (0.06-0.12%) Reg, Imb 0.05-0.30
Electrotek Xcel (3.5%) Reg, LF, Res, UC
1.85
PacifiCorp (20%) Imb, Res 5.50
Hirst BPA (6%) Reg, LF, Imb, DA
1.47-2.27
WE Energies (4%-29%) Reg, LF, UC 1.90-2.92
CA RPS Integration (4%) (Preliminary Phase I)
Reg, LF 0.17
Reg=regulation, IMB=imbalance, LF=load following,Res=reserves, UC=unit commitment, DA=day ahead market