NWT Labour Supply Bureau of Statistics July 5, 2006.
39
NWT Labour Supply Bureau of Statistics July 5, 2006
-
Upload
junior-higgins -
Category
Documents
-
view
222 -
download
2
Transcript of NWT Labour Supply Bureau of Statistics July 5, 2006.

NWT Labour Supply
Bureau of StatisticsJuly 5, 2006
NWT Bureau of Statistics 2
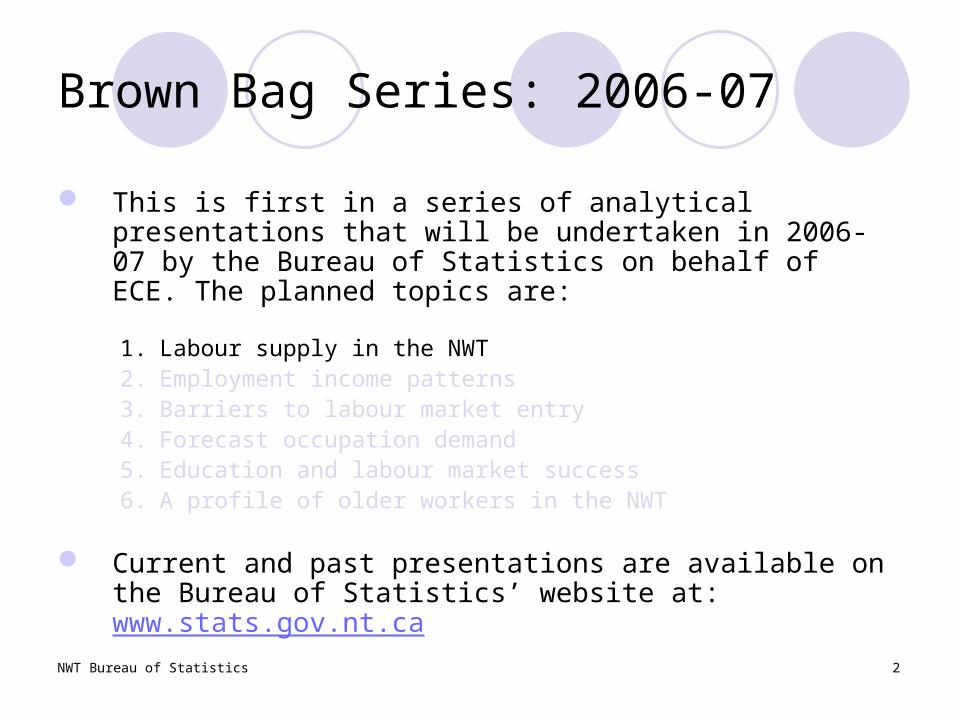
Brown Bag Series: 2006-07
This is first in a series of analytical presentations that will be undertaken in 2006-07 by the Bureau of Statistics on behalf of ECE. The planned topics are:
1. Labour supply in the NWT2. Employment income patterns3. Barriers to labour market entry4. Forecast occupation demand5. Education and labour market success6. A profile of older workers in the NWT
Current and past presentations are available on the Bureau of Statistics’ website at: www.stats.gov.nt.ca
NWT Bureau of Statistics 3
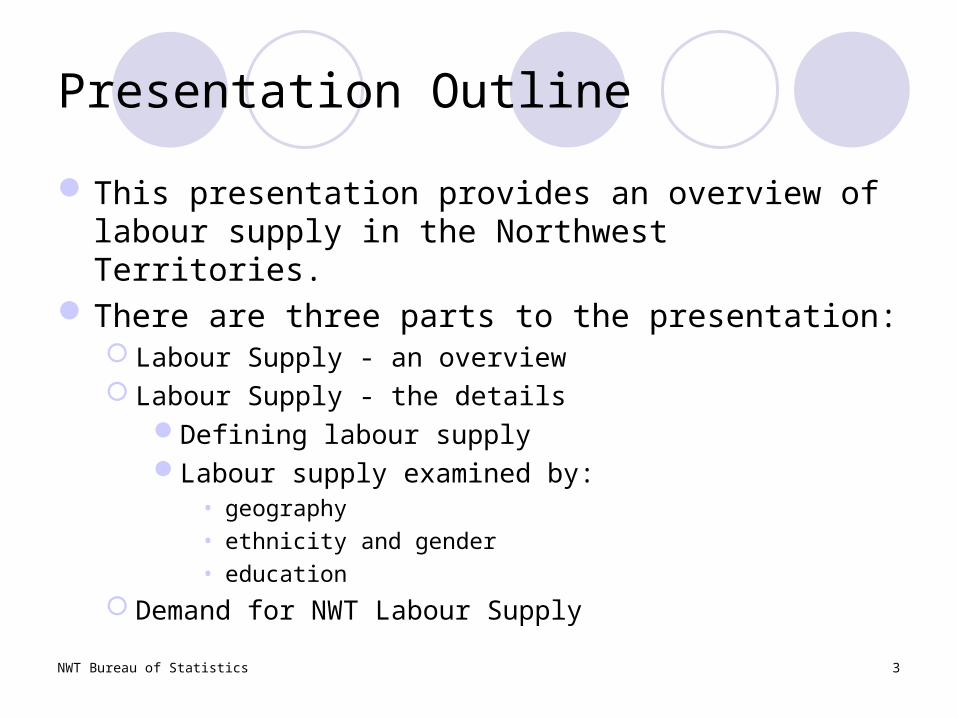
Presentation Outline
This presentation provides an overview of labour supply in the Northwest Territories.
There are three parts to the presentation: Labour Supply - an overview Labour Supply - the details
Defining labour supplyLabour supply examined by:
• geography
• ethnicity and gender
• education
Demand for NWT Labour Supply
Labour Supply - An Overview
NWT Bureau of Statistics 5
Why Labour Supply is important
Significant resource-based development is expected in the NWT, bringing increased labour demand
An aging population means that existing workers will need to be replaced
Labour demand in southern jurisdictions creates competition for labour, and has the potential to attract NWT residents
NWT Bureau of Statistics 6
Defining Labour Supply
The answer isn’t as simple as “the unemployed” Need to understand what comprises potential labour supply Need to consider practical limitations to labour market
participation
NWT Bureau of Statistics 7
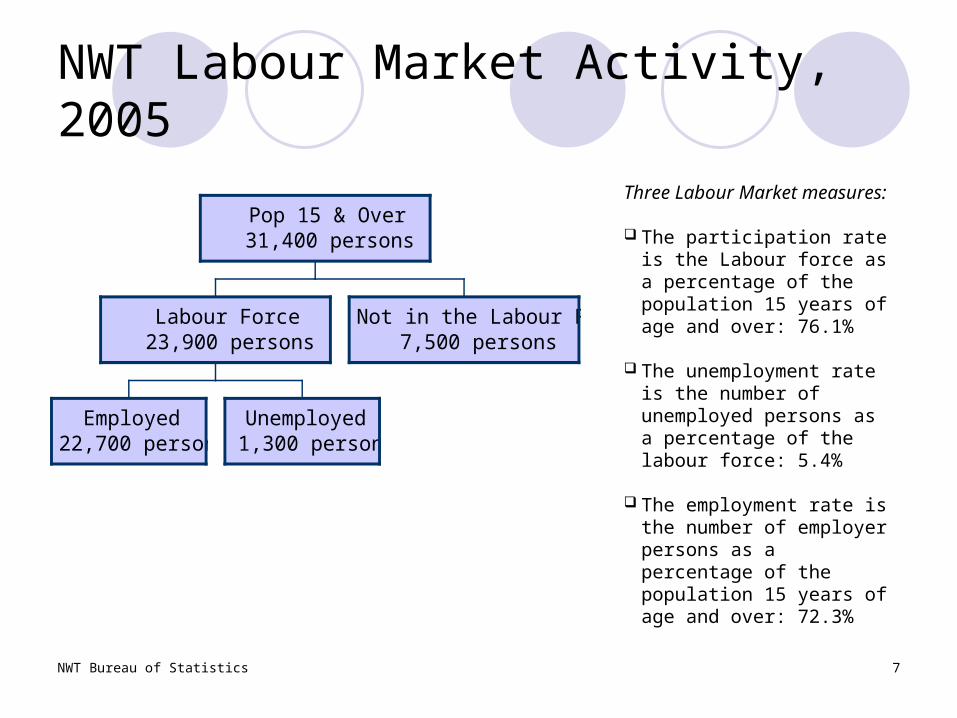
NWT Labour Market Activity, 2005
Employed22,700 persons
Unemployed1,300 persons
Labour Force23,900 persons
Not in the Labour Force7,500 persons
Pop 15 & Over31,400 persons
Three Labour Market measures:
The participation rate is the Labour force as a percentage of the population 15 years of age and over: 76.1%
The unemployment rate is the number of unemployed persons as a percentage of the labour force: 5.4%
The employment rate is the number of employer persons as a percentage of the population 15 years of age and over: 72.3%
NWT Bureau of Statistics 8
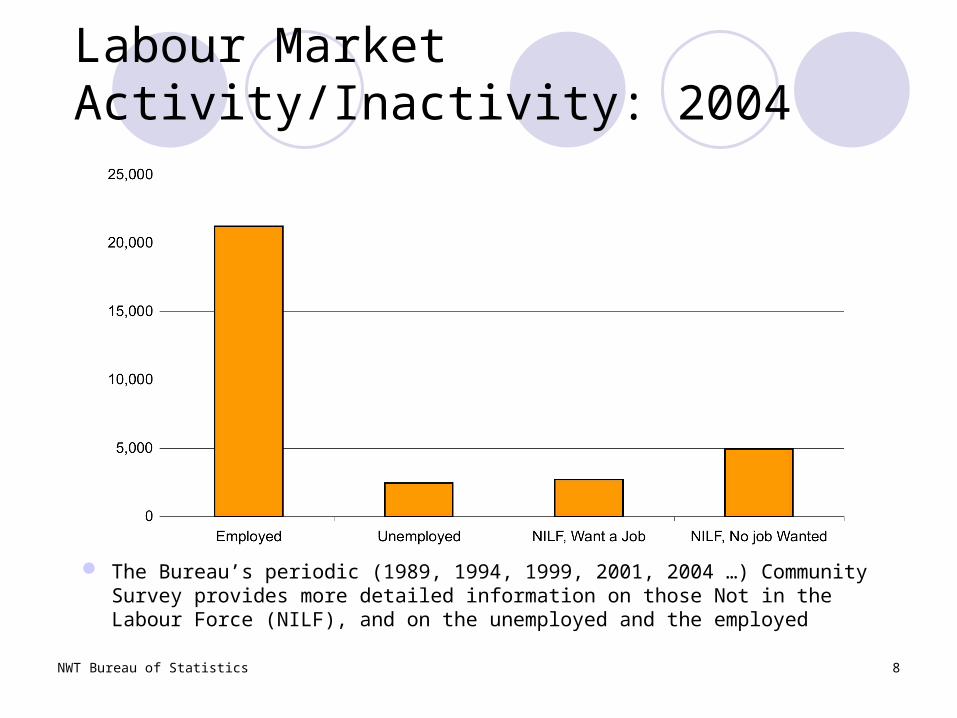
Labour Market Activity/Inactivity: 2004
The Bureau’s periodic (1989, 1994, 1999, 2001, 2004 …) Community Survey provides more detailed information on those Not in the Labour Force (NILF), and on the unemployed and the employed
NWT Bureau of Statistics 9
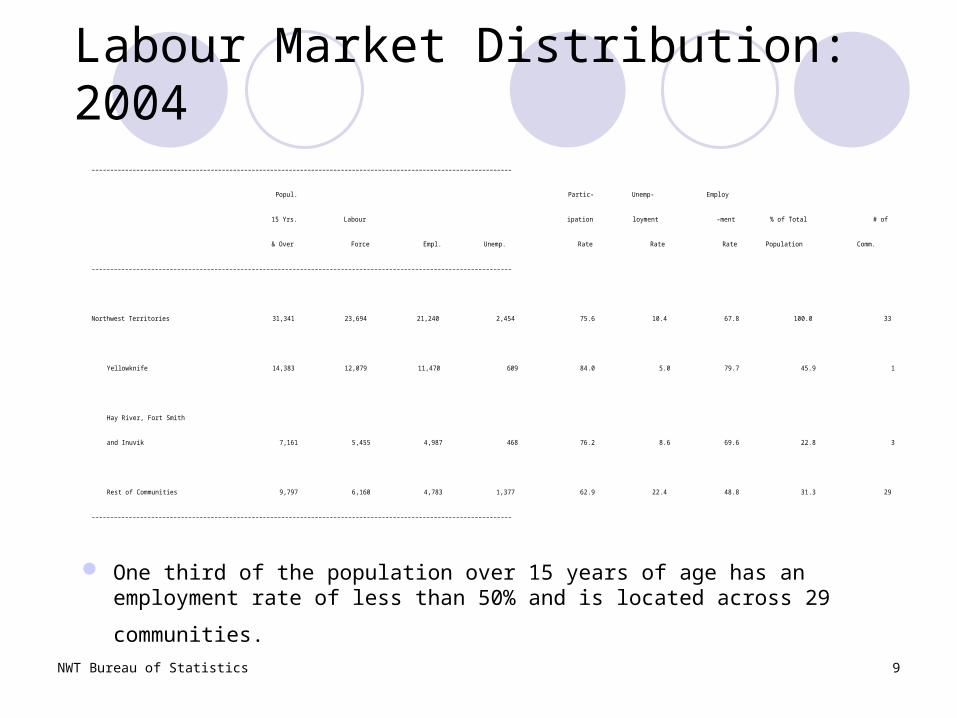
Labour Market Distribution: 2004
One third of the population over 15 years of age has an employment
rate of less than 50% and is located across 29 communities.
–––––––––––––––––––––––––––––––––––––––––––––––––––––––––––––––––––––––––––––––––––––––––––––––––––––––––––––––––
Popul. Partic- Unemp- Employ
15 Yrs. Labour ipation loyment -ment % of Total # of
& Over Force Empl. Unemp. Rate Rate Rate Population Comm.
–––––––––––––––––––––––––––––––––––––––––––––––––––––––––––––––––––––––––––––––––––––––––––––––––––––––––––––––––
Northwest Territories 31,341 23,694 21,240 2,454 75.6 10.4 67.8 100.0 33
Yellowknife 14,383 12,079 11,470 609 84.0 5.0 79.7 45.9 1
Hay River, Fort Smith
and Inuvik 7,161 5,455 4,987 468 76.2 8.6 69.6 22.8 3
Rest of Communities 9,797 6,160 4,783 1,377 62.9 22.4 48.8 31.3 29
–––––––––––––––––––––––––––––––––––––––––––––––––––––––––––––––––––––––––––––––––––––––––––––––––––––––––––––––––

Labour Supply - The Details
NWT Bureau of Statistics 11
Labour Market Components
Labour supply from: NILF - don’t want a job Employed Unemployed and NILF - want a job
NWT Bureau of Statistics 12
NILF - Don’t want a job
A few questions to answer about those that don’t want a job: Where are these people located? What is their age distribution? Why don’t they want a job?
NWT Bureau of Statistics 13
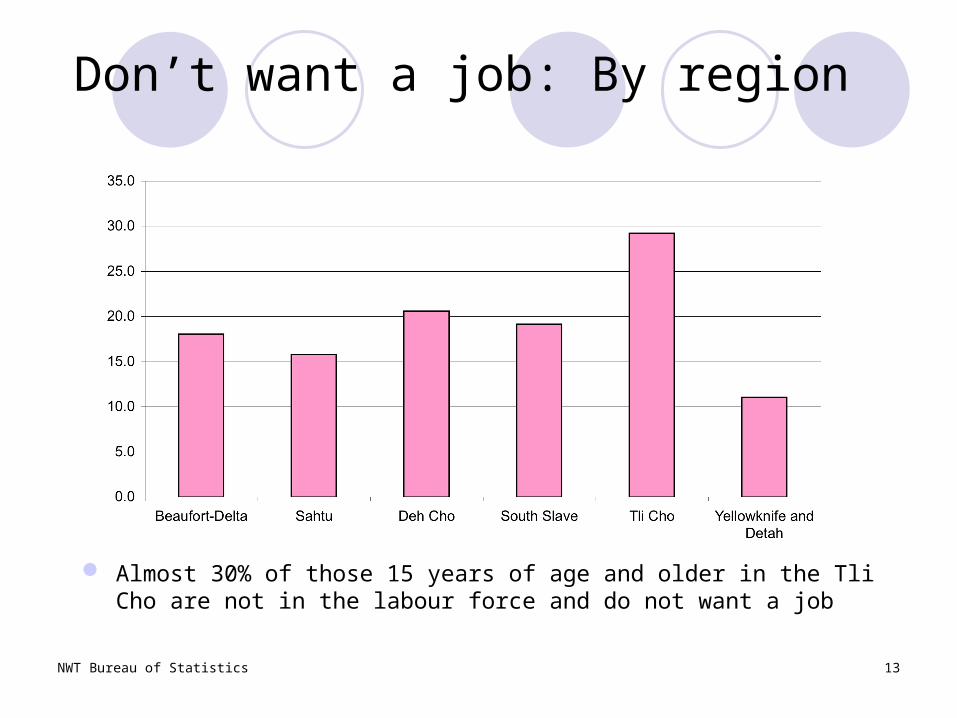
Don’t want a job: By region
Almost 30% of those 15 years of age and older in the Tli Cho are not in the labour force and do not want a job
NWT Bureau of Statistics 14
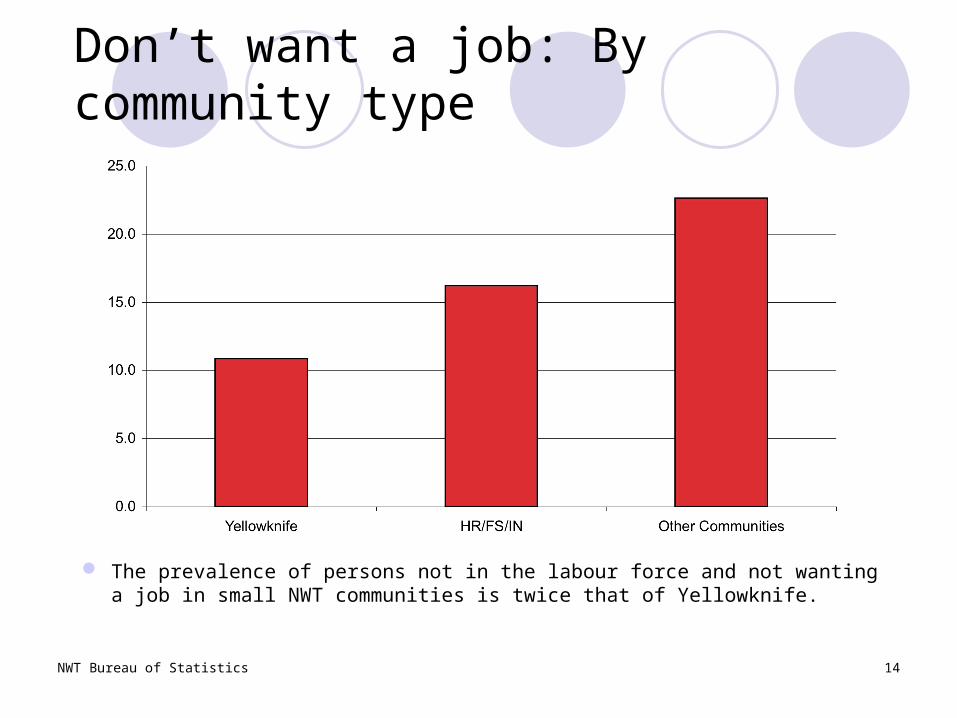
Don’t want a job: By community type
The prevalence of persons not in the labour force and not wanting a job in small NWT communities is twice that of Yellowknife.
NWT Bureau of Statistics 15
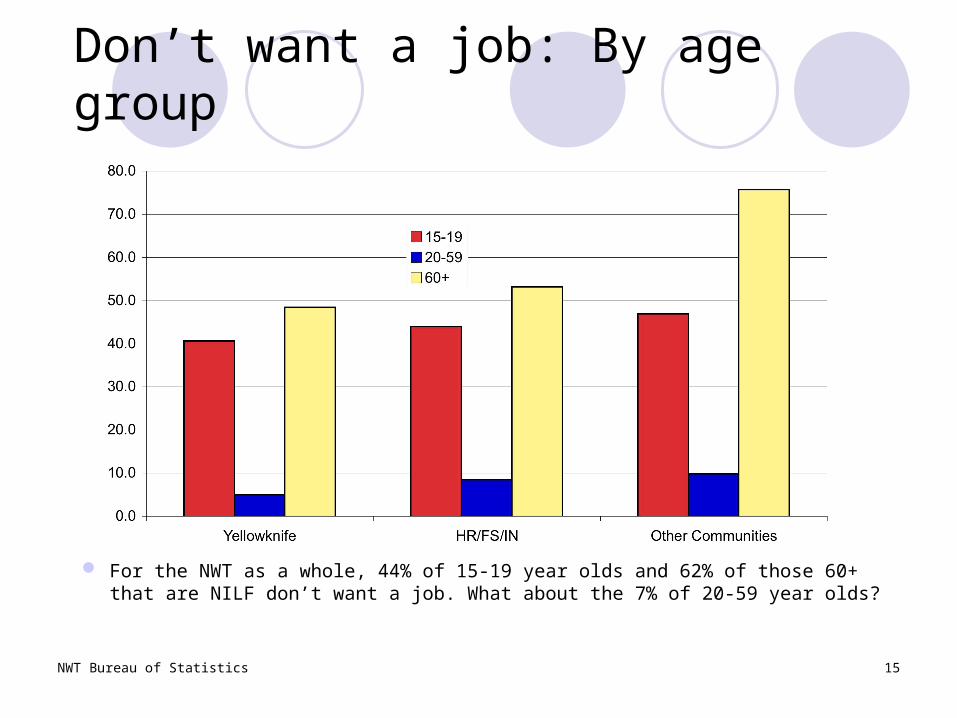
Don’t want a job: By age group
For the NWT as a whole, 44% of 15-19 year olds and 62% of those 60+ that are NILF don’t want a job. What about the 7% of 20-59 year olds?
NWT Bureau of Statistics 16
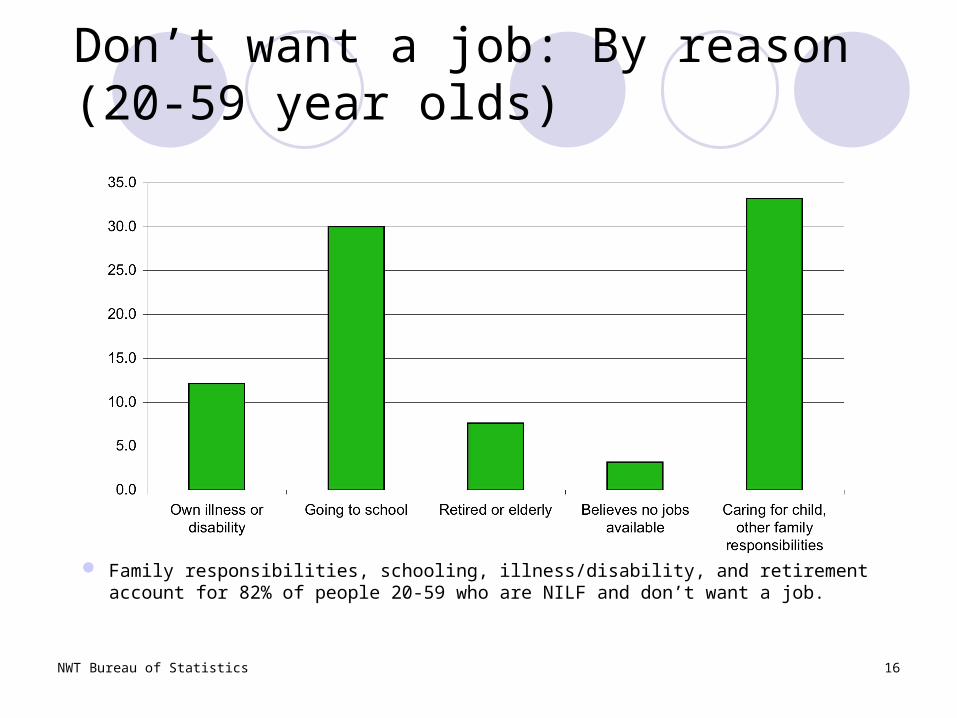
Don’t want a job: By reason (20-59 year olds)
Family responsibilities, schooling, illness/disability, and retirement account for 82% of people 20-59 who are NILF and don’t want a job.
NWT Bureau of Statistics 17
Employed
How can the employed be considered part of the available labour supply? The under-employed
NWT Bureau of Statistics 18
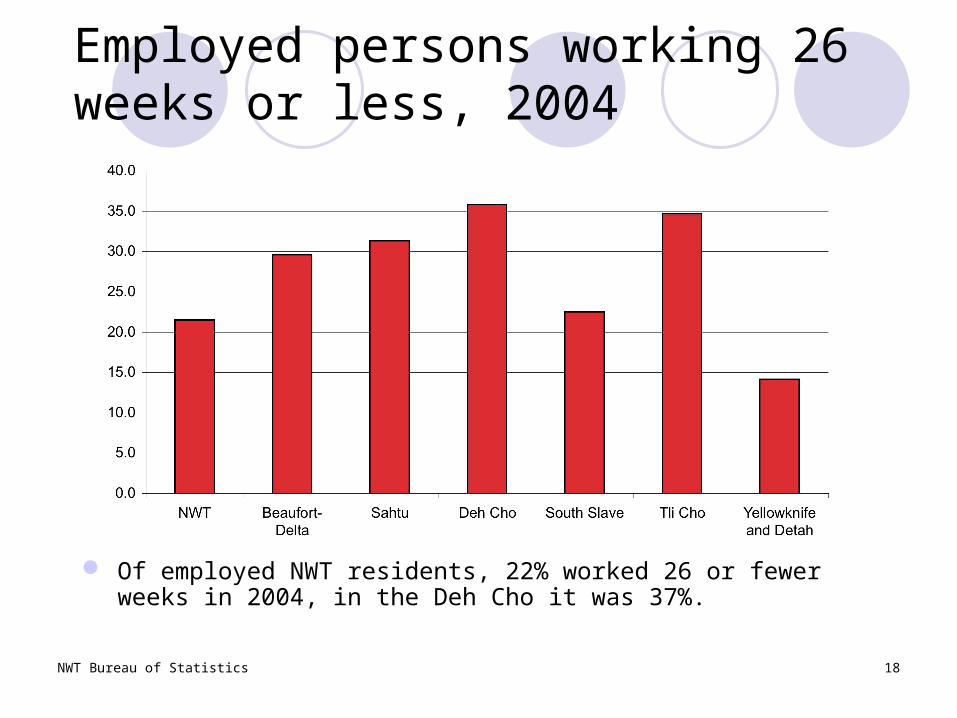
Employed persons working 26 weeks or less, 2004
Of employed NWT residents, 22% worked 26 or fewer weeks in 2004, in the Deh Cho it was 37%.
NWT Bureau of Statistics 19
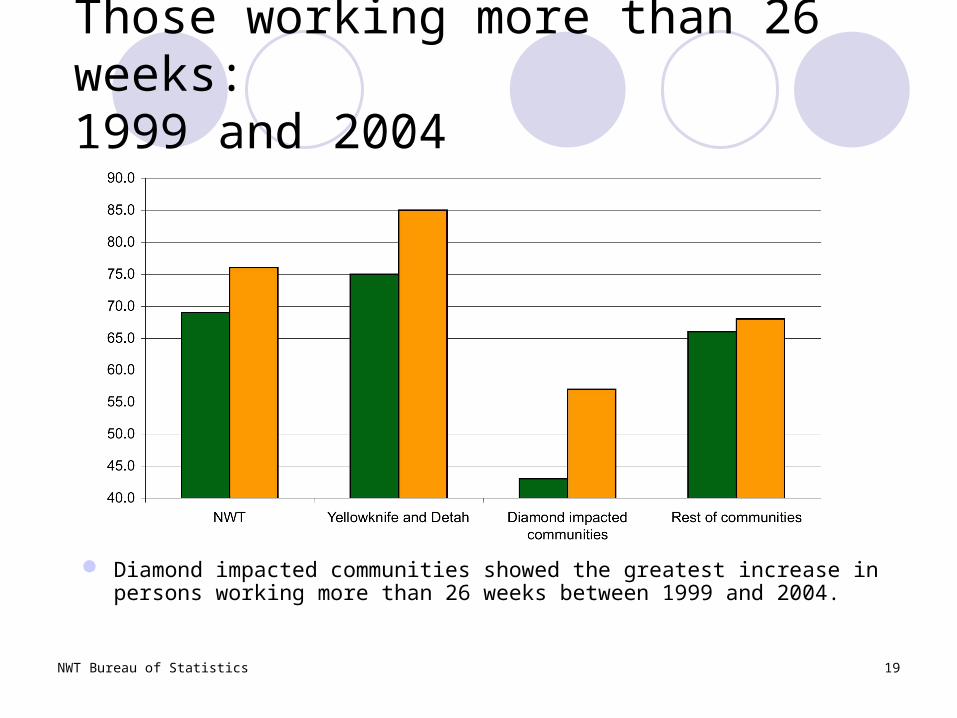
Those working more than 26 weeks: 1999 and 2004
Diamond impacted communities showed the greatest increase in persons working more than 26 weeks between 1999 and 2004.

NWT Bureau of Statistics 20
Labour Supply Defined
Some supply has, and will, come from the ranks of the under-employed, however…
Our definition of labour supply: The Unemployed Those not in the labour force, but wanting a job
But should we include everyone who is unemployed and/or wants a job?
NWT Bureau of Statistics 21
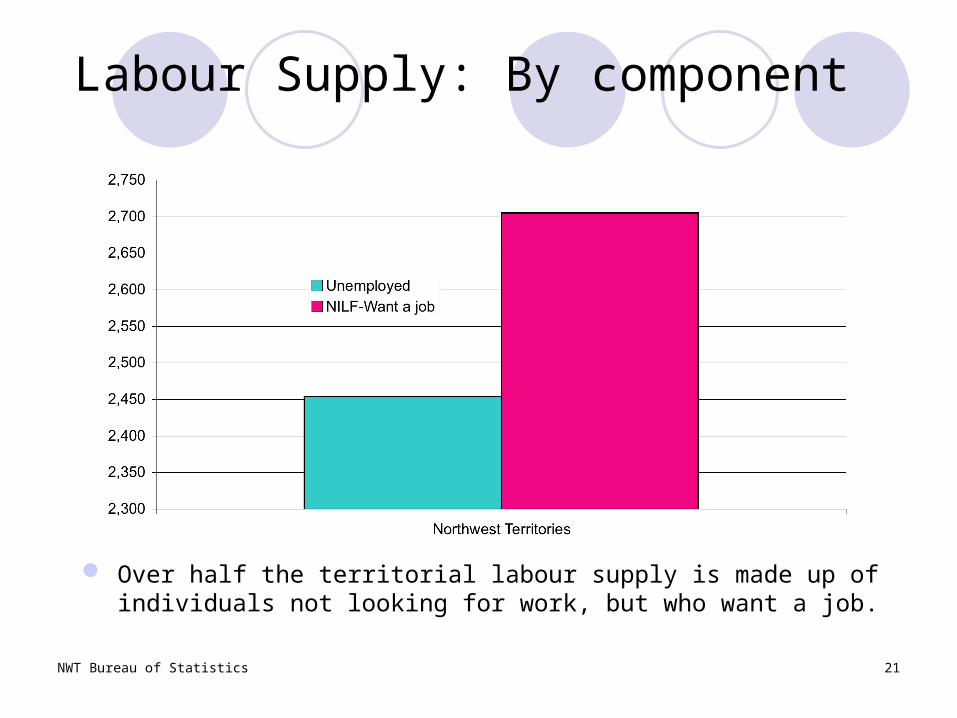
Labour Supply: By component
Over half the territorial labour supply is made up of individuals not looking for work, but who want a job.
NWT Bureau of Statistics 22
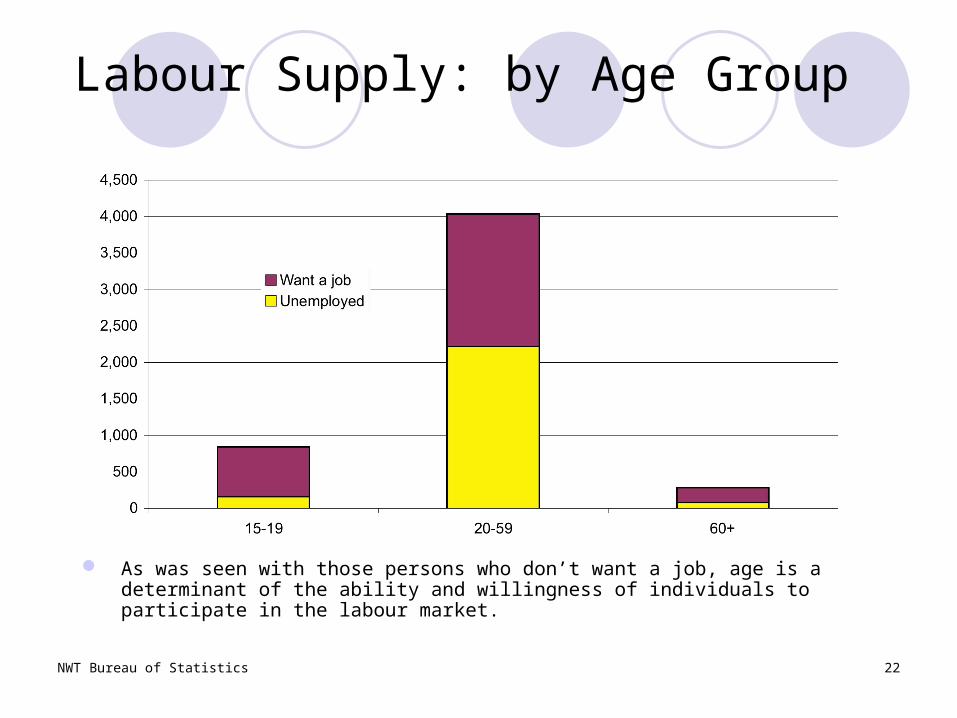
Labour Supply: by Age Group
As was seen with those persons who don’t want a job, age is a determinant of the ability and willingness of individuals to participate in the labour market.
NWT Bureau of Statistics 23
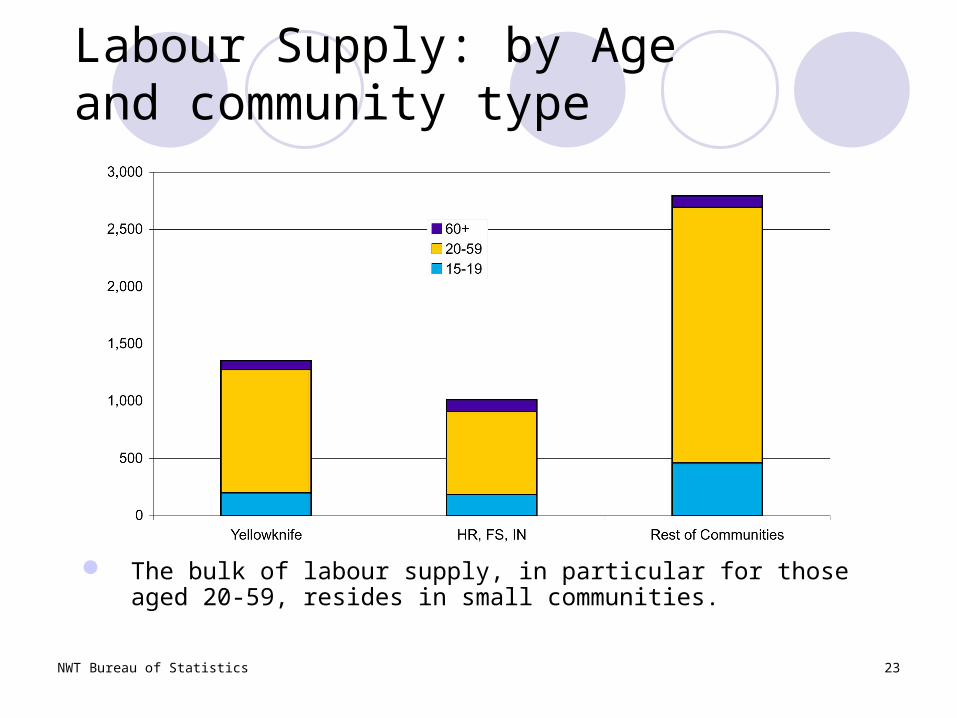
Labour Supply: by Age and community type
The bulk of labour supply, in particular for those aged 20-59, resides in small communities.
NWT Bureau of Statistics 24
Labour Supply (20-59 year olds)
GeographyEducation by Gender/Ethnicity and GeographyReasons for not looking for a job
NWT Bureau of Statistics 25
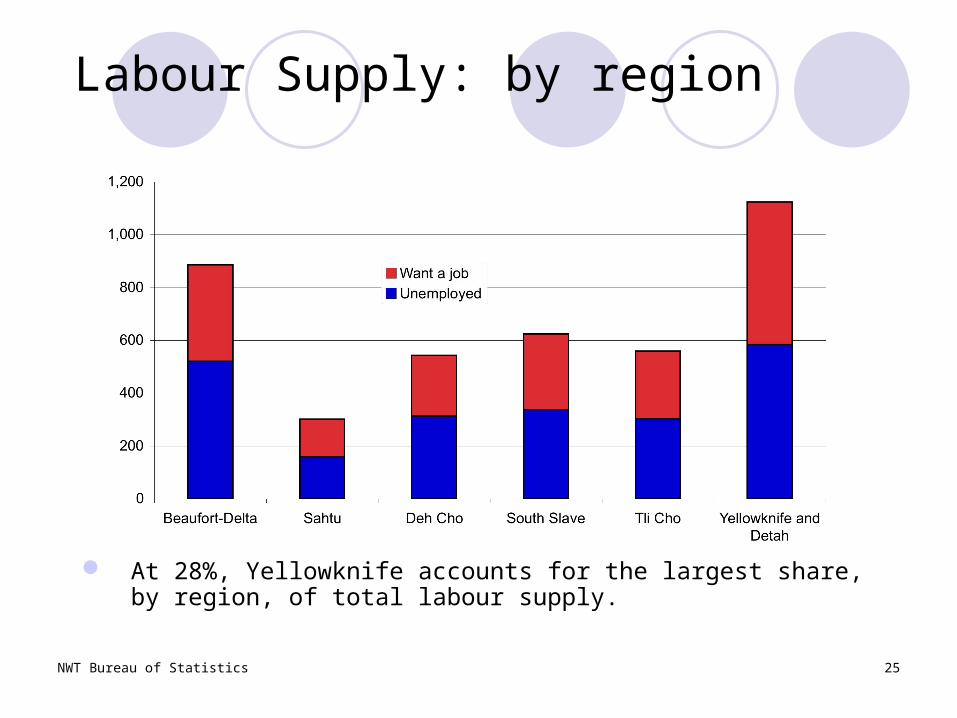
Labour Supply: by region
At 28%, Yellowknife accounts for the largest share, by region, of total labour supply.
NWT Bureau of Statistics 26
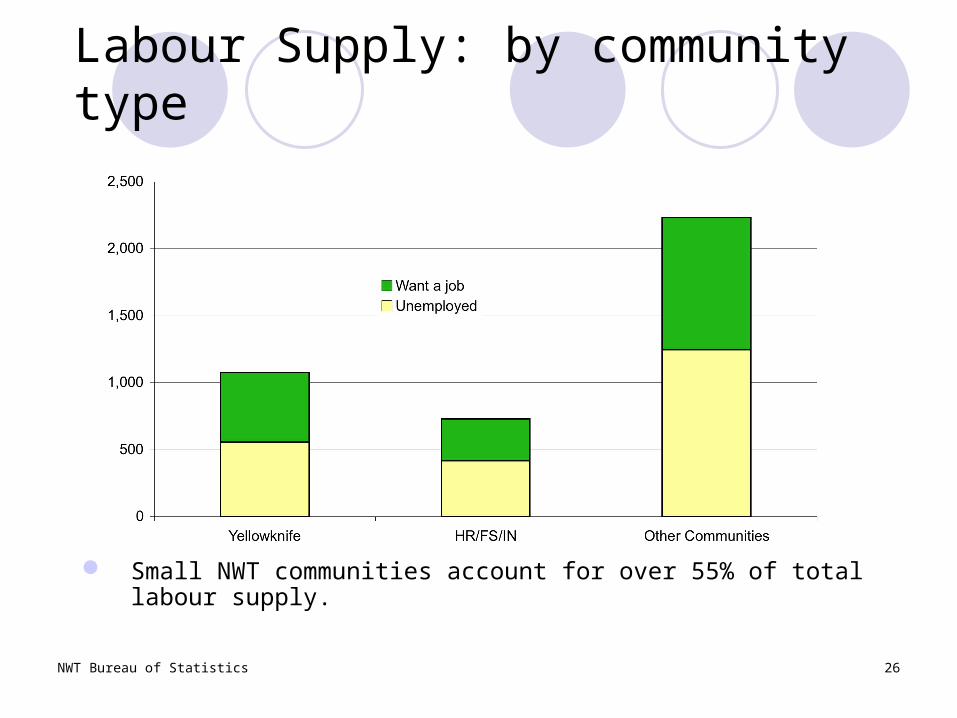
Labour Supply: by community type
Small NWT communities account for over 55% of total labour supply.
NWT Bureau of Statistics 27
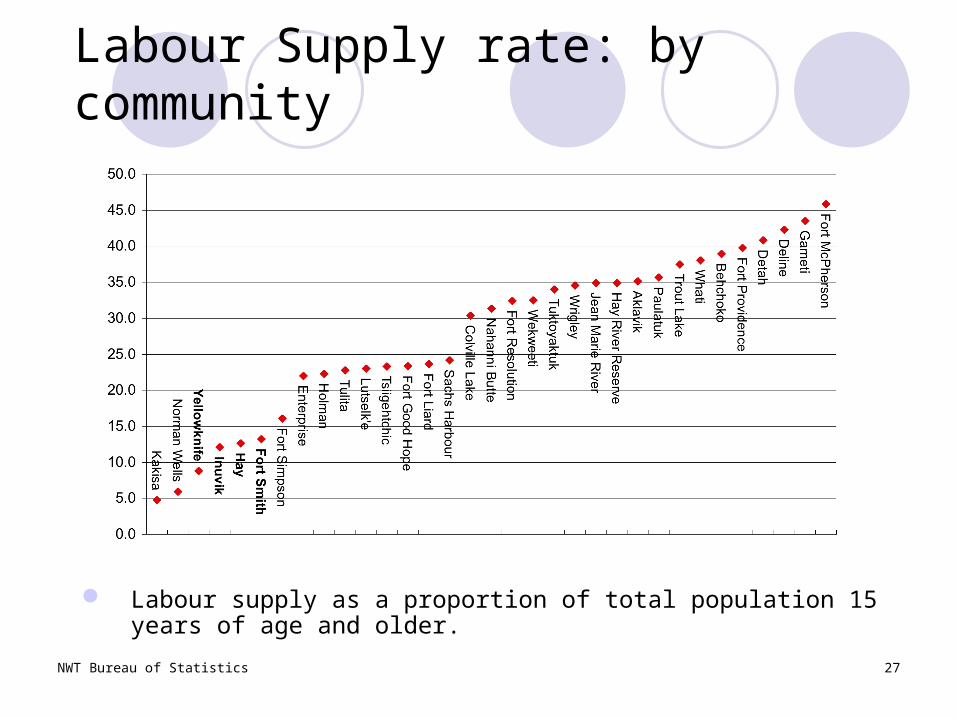
Labour Supply rate: by community
Labour supply as a proportion of total population 15 years of age and older.
NWT Bureau of Statistics 28
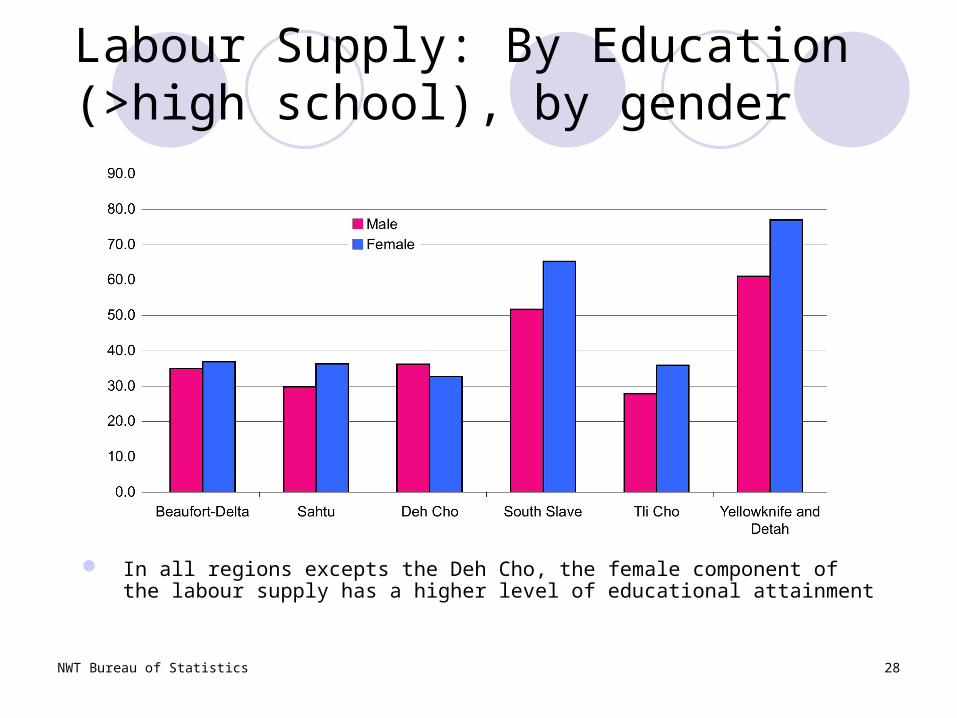
Labour Supply: By Education (>high school), by gender
In all regions excepts the Deh Cho, the female component of the labour supply has a higher level of educational attainment

NWT Bureau of Statistics 29
Labour Supply: Reasons for not looking for work, by gender
Caring for children was the most often cited reason for not looking for work, and it was most often cited by women.
NWT Bureau of Statistics 30
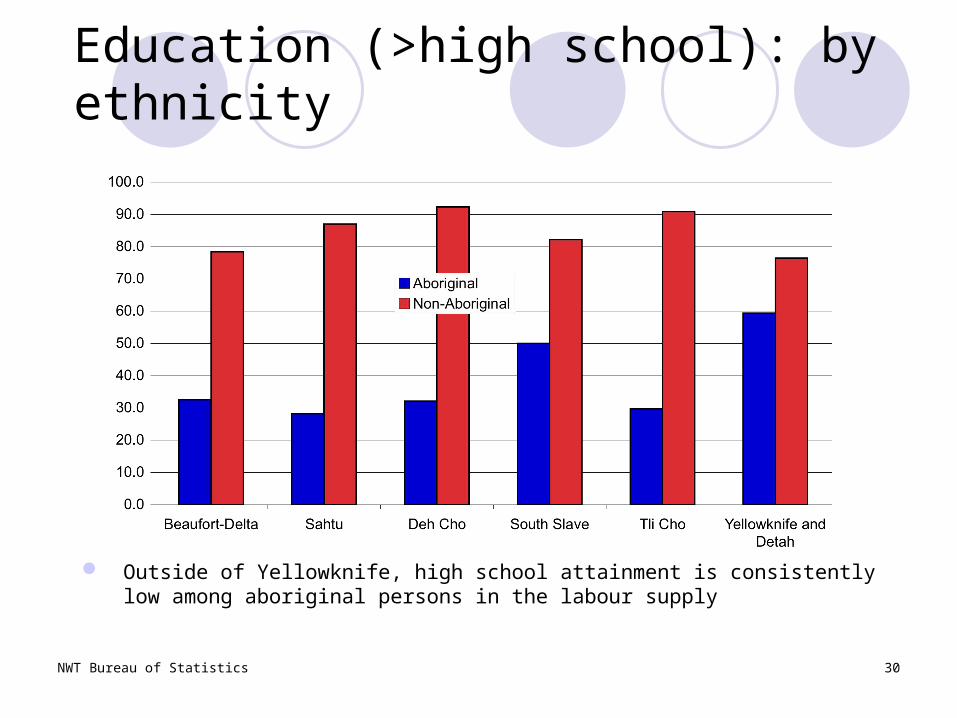
Education (>high school): by ethnicity
Outside of Yellowknife, high school attainment is consistently low among aboriginal persons in the labour supply
NWT Bureau of Statistics 31
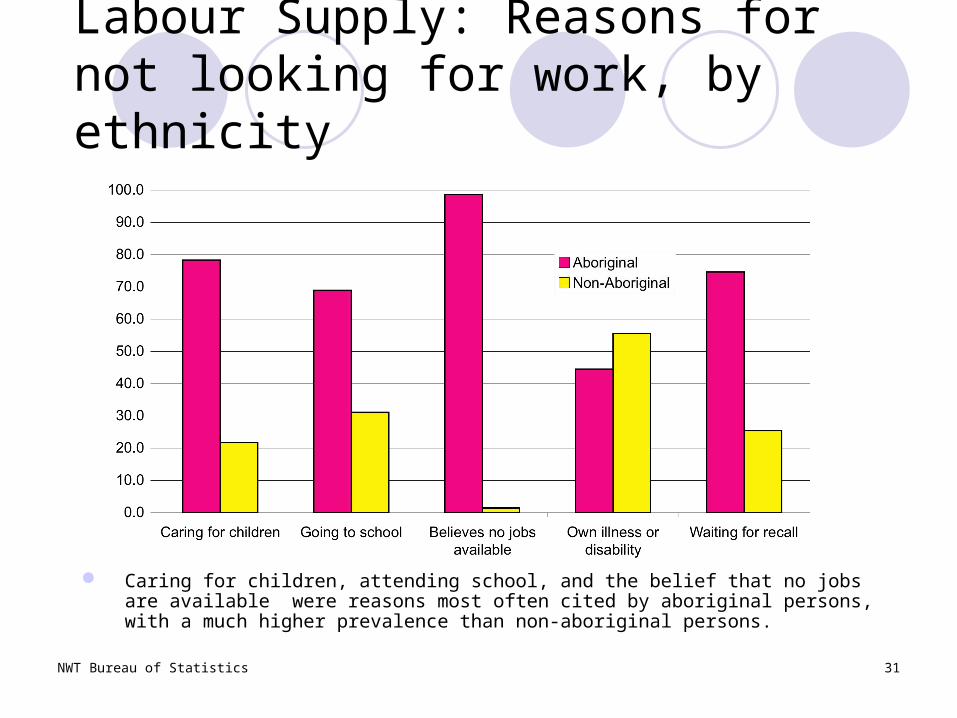
Labour Supply: Reasons for not looking for work, by ethnicity
Caring for children, attending school, and the belief that no jobs are available were reasons most often cited by aboriginal persons, with a much higher prevalence than non-aboriginal persons.

Demand for NWT Labour Supply
NWT Bureau of Statistics 33
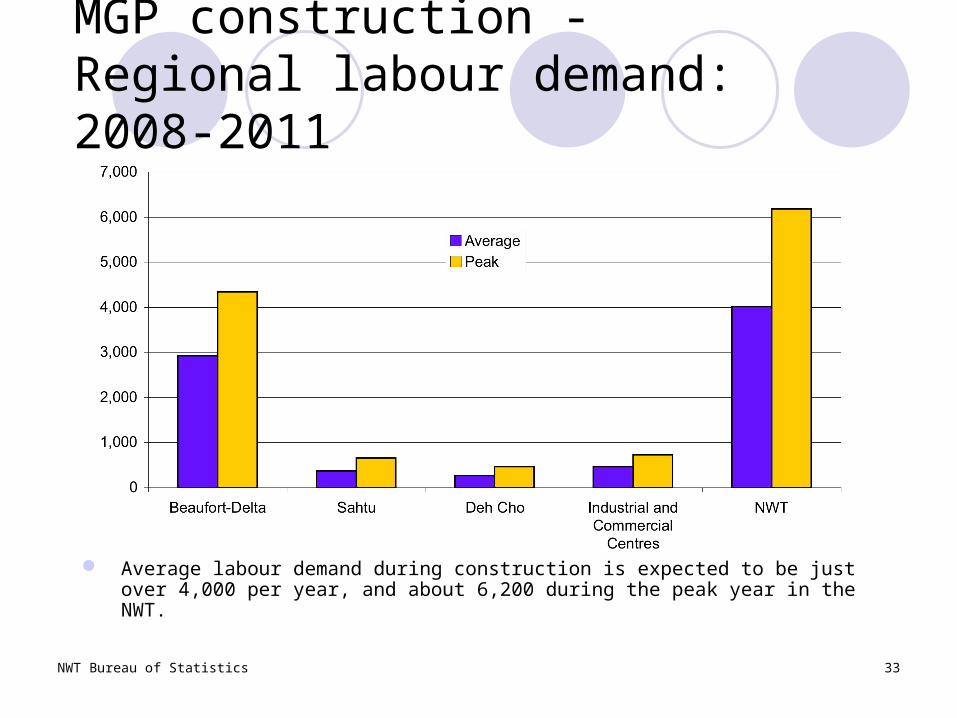
MGP construction - Regional labour demand: 2008-2011
Average labour demand during construction is expected to be just over 4,000 per year, and about 6,200 during the peak year in the NWT.
NWT Bureau of Statistics 34
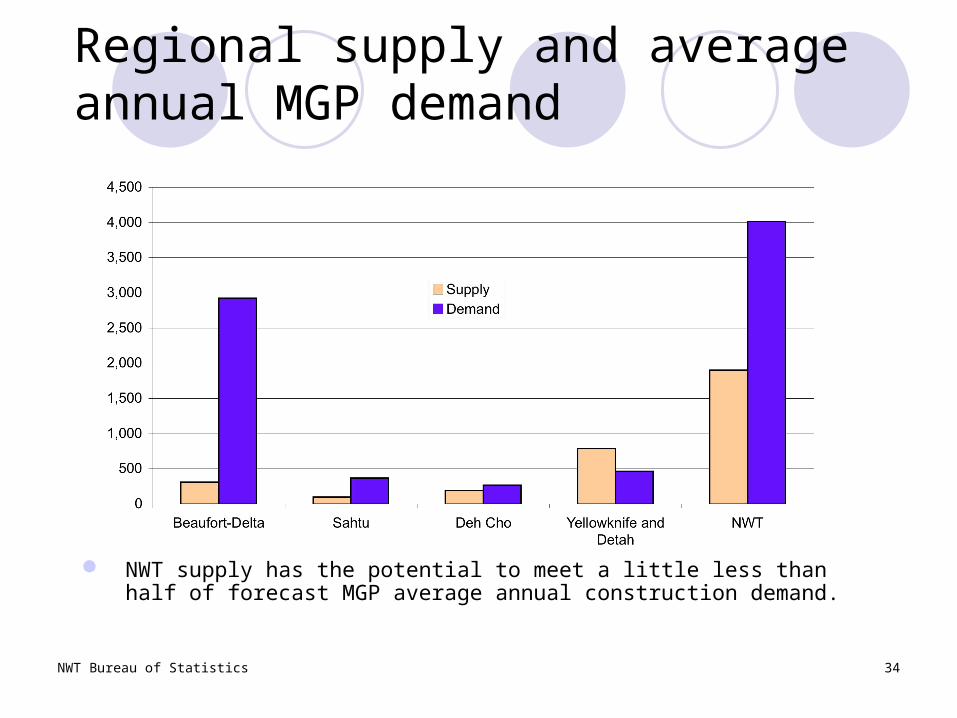
Regional supply and average annual MGP demand
NWT supply has the potential to meet a little less than half of forecast MGP average annual construction demand.
NWT Bureau of Statistics 35
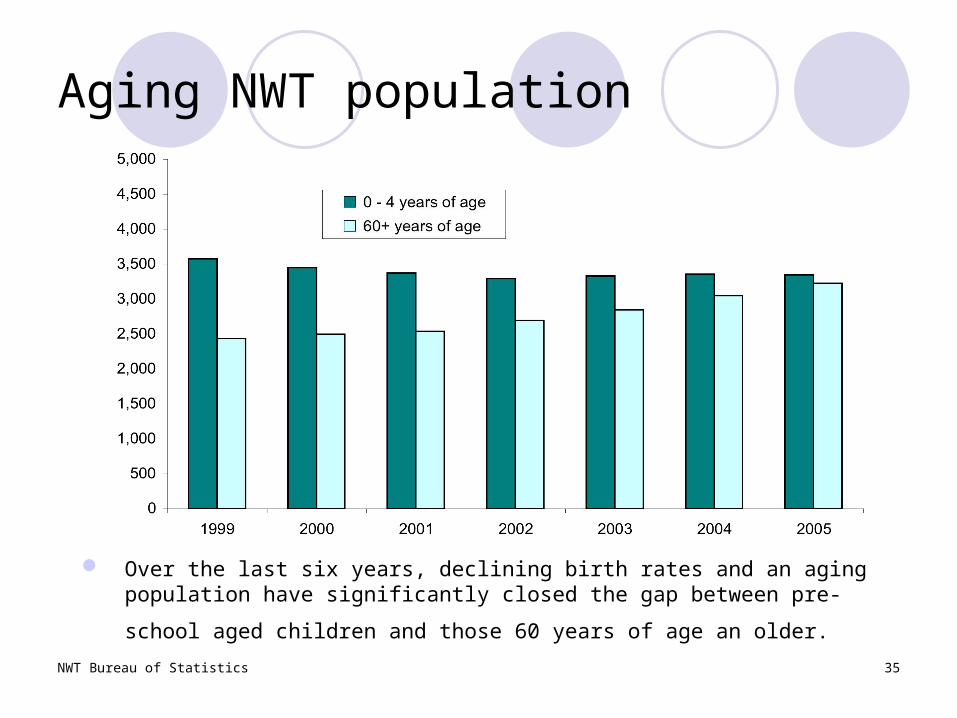
Aging NWT population
Over the last six years, declining birth rates and an aging population have significantly closed the gap between pre-school aged children and those
60 years of age an older.
NWT Bureau of Statistics 36
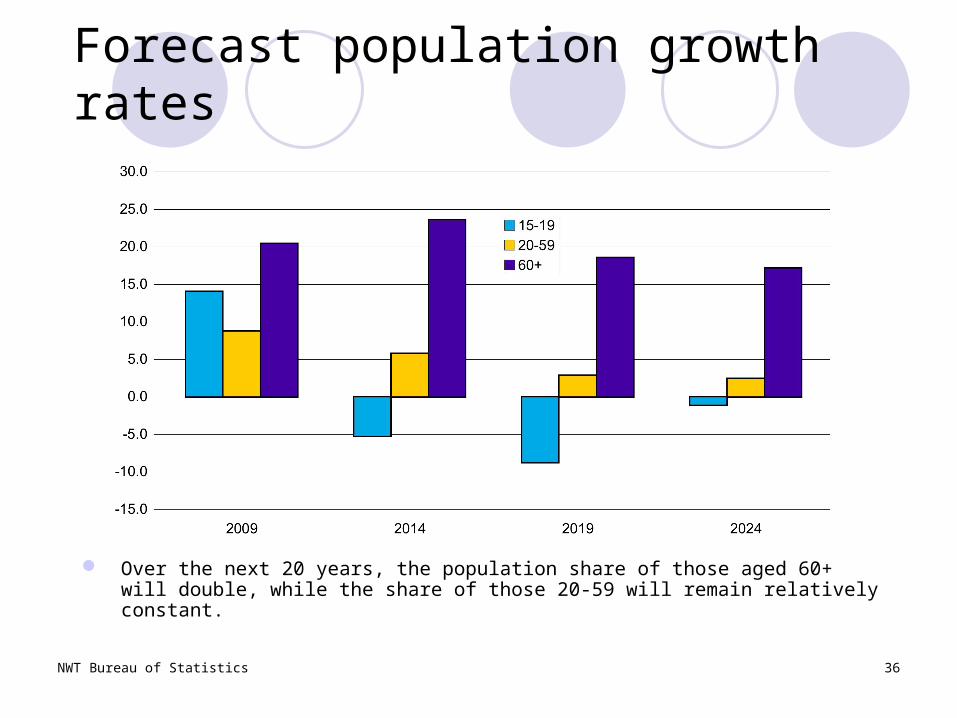
Forecast population growth rates
Over the next 20 years, the population share of those aged 60+ will double, while the share of those 20-59 will remain relatively constant.

NWT Bureau of Statistics 37
Summary1
Labour supply comprises: the unemployed; and those not in the labour force (NILF) who want a job.
This definition can be further refined to include only the 20-59 year old age group
Labour supply can also come from the ranks of the employed - part-time or seasonal workers who expand their volume of work to meet demand
NWT labour supply: 55% resides primarily in small communities, of which almost 90% is aboriginal
Childcare, and the belief that no jobs are available are reasons cited as reasons for not looking for work
Of those with high school or greater, 52% is female Childcare is the most cited reason (22%) for not looking for work
NWT Bureau of Statistics 38
Summary2
The NWT will encounter significant demand for labour resources over the next 10 years, and beyond, which will result in considerable demand and competition for labour resources.
There exists significant labour supply across most regions to support increased development, assuming that: Opportunities will exist for the segment of labour supply with low levels of
educational attainment (i.e., less than high school). Employment opportunities will be available where labour supply resides -
smaller communities - or those wanting employment will be willing, or able, to go to the work.
Female employment in mining and oil and gas in the NWT significantly exceed the current NWT and national averages of around 16%.
NWT Bureau of Statistics 39
Contact Information
NWT Bureau of StatisticsDepartment of Executive
(867) 873 7147
www.stats.gov.nt.ca