NWS HOLDINGS LIMITED - nws.com.hk · NWS Holdings Limited (Hong Kong stock code: 659) is the...
213
NWS HOLDINGS LIMITED STOCK CODE: 659 Annual Report 2016 Balanced Growth Strategic Focus
Transcript of NWS HOLDINGS LIMITED - nws.com.hk · NWS Holdings Limited (Hong Kong stock code: 659) is the...
NWS HOLDINGS LIMITEDSTOCK CODE: 659
Annual Report 2016
Balanced GrowthStrategic Focus
Environment
Logistics
Strategic
Investm
ents
Construction & Transport
Facilities Managem
ent
R
oads
Aviation

NWS Holdings Limited (Hong Kong stock code: 659) is the infrastructure and
service flagship of New World Development Company Limited (Hong Kong
stock code: 17). Listed on the Hong Kong Stock Exchange, NWS Holdings
embraces a range of businesses in Hong Kong, Mainland China and Macau.
With a workforce of approximately 27,900 people, NWS Holdings is
committed to achieving sustainable growth in its two core business areas of
infrastructure and services.
To build a dynamic and premier
group of infrastructure and
service management companies
driven by a shared passion for
customer value and care
VISION
About NWS Holdings
NWS HOLDINGS LIMITEDSTOCK CODE: 659
Annual Report 2016
Balanced GrowthStrategic Focus
CORE VALUES• Reputable customer care
• Pride and teamwork
• Innovation
• Community contributions and
environmental awareness
• Stakeholders’ interest
Download the NWS Holdings
Annual Report 2016
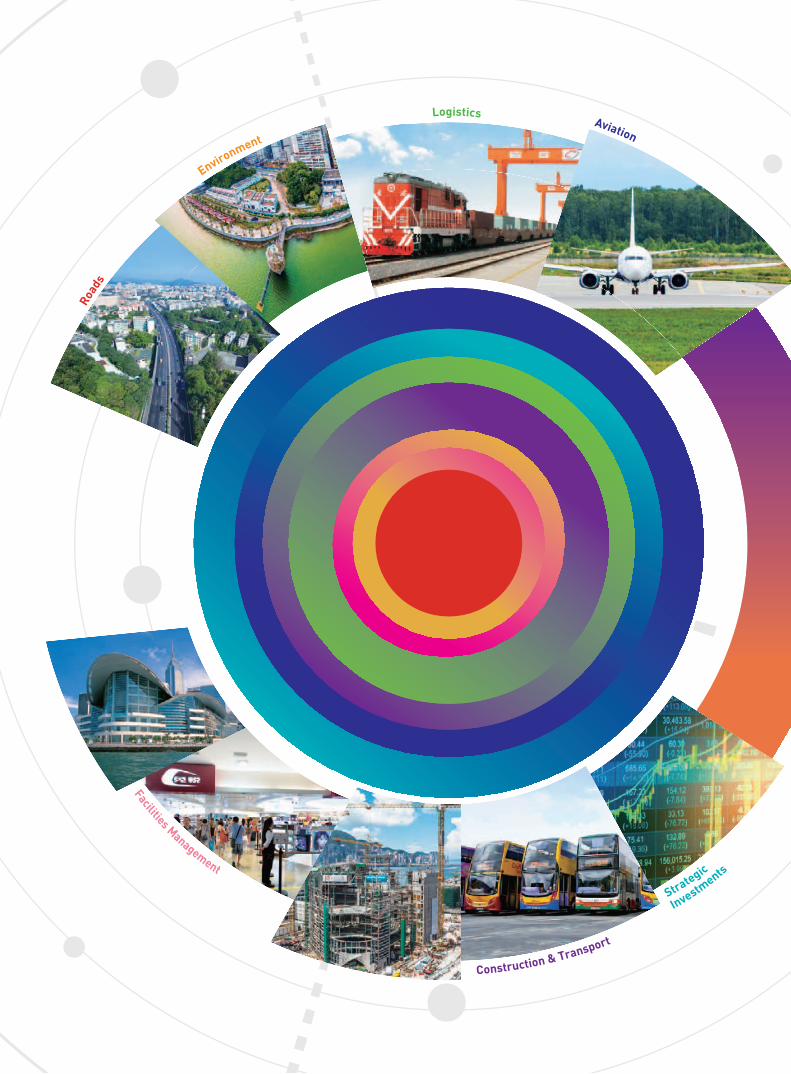
Strategic Focus Balanced GrowthThe circular cutout cover design of this year's annual report reflects NWS Holdings'
business development strategy and depicts the seven business segments that were
reclassified in FY2016: Roads, Environment, Logistics, Aviation, Facilities Management,
Construction & Transport and Strategic Investments. Concentric and interlocking circles
on the cover overlay an archery target image on the inside page, symbolising the focus
and synergies of the Group’s businesses, which connect lives and build futures for people
in markets in which the Group operates. The photographs that border the target on the
inside page represent the breadth of our operations and their balanced growth that create
shareholder value.
MISSIONSynergize and develop business
units that:
• Nurture total integrity
• Attain total customer satisfaction
• Foster learning culture and
employee pride
• Build a world-class service
provider brand
• Maximize financial returns
4 Corporate Profile
6 Major Events and Accolades
8 Financial Highlights
10 Chairman’s Statement
12 Board of Directors and Senior Management
23 Corporate Governance Report
41 Risk Management
46 Sustainability
54 Management Discussion and Analysis
70 Reports and Financial Statements
190 Five-Year Financial Summary
192 Project Key Facts and Figures
208 Glossary of Terms
210 Corporate Information
CONTENTS

26-27
13-14
29-34
9
4
1-8
17 35-36 2-3*
2-3
10-111
1
2-4, 40-41, 43
16
125
28
10-12, 37
1
5
5-6
JILIN
LIAONING
INNER
MONGOLIA
NINGXIA
GANSU
QINGHAI
SHAANXI
HUBEI
HUNAN
SHANXI
HEBEI
•Beijing
• Tianjin
• Shanghai
• Chongqing
Macau • • Hong Kong
SHANDONG
ANHUI
JIANGSU
ZHEJIANG
JIANGXI
FUJIAN
GUIZHOU
SICHUAN
YUNNAN GUANGXI
GUANGDONG
TAIWAN
7-9
1
1
6
1
12-15
20-24, 38-39 1
1
1
17-19, 42
HAINAN
15
HENAN6 1
Commercial aircraft on lease to
worldwide airline operators
As at 30 June 2016 (Please refer to Project Key Facts and Figures on page 192 to page 207 for project details)
Corporate Profi le
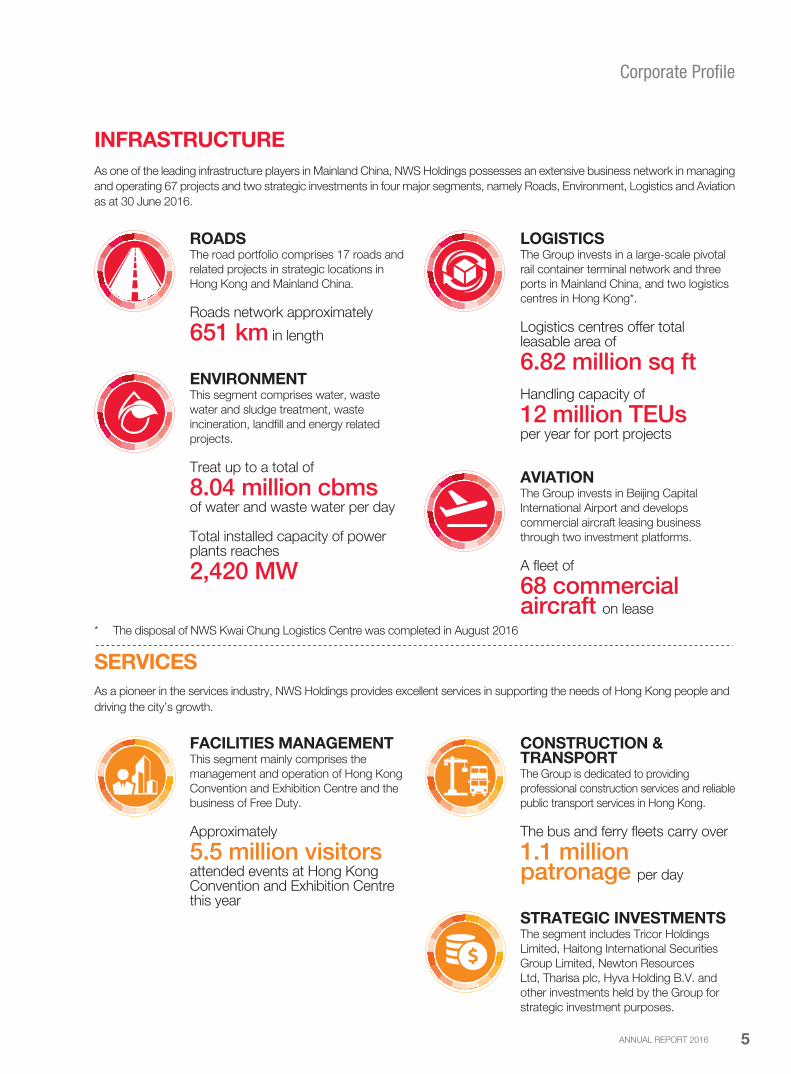
* The disposal of NWS Kwai Chung Logistics Centre was completed in August 2016
NWS HOLDINGS LIMITED4
* The disposal of NWS Kwai Chung Logistics Centre was completed in August 2016
INFRASTRUCTURE
As one of the leading infrastructure players in Mainland China, NWS Holdings possesses an extensive business network in managing
and operating 67 projects and two strategic investments in four major segments, namely Roads, Environment, Logistics and Aviation
as at 30 June 2016.
ROADSThe road portfolio comprises 17 roads and
related projects in strategic locations in
Hong Kong and Mainland China.
Roads network approximately
651 km in length
ENVIRONMENTThis segment comprises water, waste
water and sludge treatment, waste
incineration, landfill and energy related
projects.
Treat up to a total of
8.04 million cbmsof water and waste water per day
Total installed capacity of power plants reaches
2,420 MW
LOGISTICSThe Group invests in a large-scale pivotal
rail container terminal network and three
ports in Mainland China, and two logistics
centres in Hong Kong*.
Logistics centres offer total leasable area of
6.82 million sq ftHandling capacity of
12 million TEUsper year for port projects
AVIATIONThe Group invests in Beijing Capital
International Airport and develops
commercial aircraft leasing business
through two investment platforms.
A fleet of
68 commercial aircraft on lease
SERVICES
As a pioneer in the services industry, NWS Holdings provides excellent services in supporting the needs of Hong Kong people and
driving the city’s growth.
FACILITIES MANAGEMENTThis segment mainly comprises the
management and operation of Hong Kong
Convention and Exhibition Centre and the
business of Free Duty.
Approximately
5.5 million visitorsattended events at Hong Kong Convention and Exhibition Centre this year
CONSTRUCTION & TRANSPORTThe Group is dedicated to providing
professional construction services and reliable
public transport services in Hong Kong.
The bus and ferry fleets carry over
1.1 million patronage per day
STRATEGIC INVESTMENTSThe segment includes Tricor Holdings
Limited, Haitong International Securities
Group Limited, Newton Resources
Ltd, Tharisa plc, Hyva Holding B.V. and
other investments held by the Group for
strategic investment purposes.
Corporate Profi le
ANNUAL REPORT 2016 5
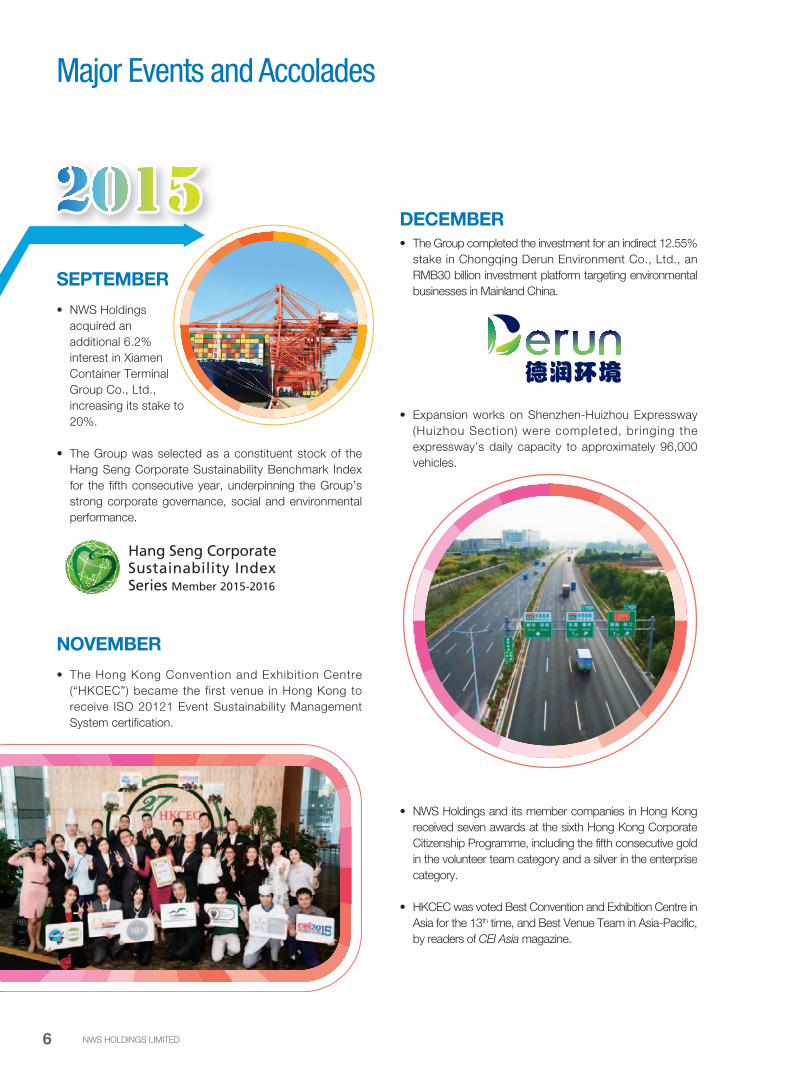
NOVEMBER
• The Hong Kong Convention and Exhibition Centre
(“HKCEC”) became the first venue in Hong Kong to
receive ISO 20121 Event Sustainability Management
System certification.
SEPTEMBER
• NWS Holdings
acquired an
additional 6.2%
interest in Xiamen
Container Terminal
Group Co., Ltd.,
increasing its stake to
20%.
• The Group was selected as a constituent stock of the
Hang Seng Corporate Sustainability Benchmark Index
for the fifth consecutive year, underpinning the Group’s
strong corporate governance, social and environmental
performance.
DECEMBER• The Group completed the investment for an indirect 12.55%
stake in Chongqing Derun Environment Co., Ltd., an
RMB30 billion investment platform targeting environmental
businesses in Mainland China.
• Expansion works on Shenzhen-Huizhou Expressway
(Huizhou Section) were completed, bringing the
expressway’s daily capacity to approximately 96,000
vehicles.
• NWS Holdings and its member companies in Hong Kong
received seven awards at the sixth Hong Kong Corporate
Citizenship Programme, including the fifth consecutive gold
in the volunteer team category and a silver in the enterprise
category.
• HKCEC was voted Best Convention and Exhibition Centre in
Asia for the 13th time, and Best Venue Team in Asia-Pacific,
by readers of CEI Asia magazine.
Major Events and Accolades
NWS HOLDINGS LIMITED6

MARCH
• NWS Holdings established a joint venture, Bauhinia Aviation
Capital Limited, with Chow Tai Fook Enterprises Limited and
Aviation Capital Group Corp., to further expand its commercial
aircraft leasing business. NWS Holdings holds 40% effective
interest in the joint venture.
APRIL
• NWS Holdings was named among the Best Companies to
Work for in Asia 2016 by HR Asia magazine.
• NWS Holdings and its four member companies, as well as the
NWS Holdings Charities Foundation, received six golds and
one silver honour at the fourth Web Accessibility Recognition
Scheme, organized by the Office of the Government Chief
Information Officer and the Equal Opportunities Commission.
Major Events and Accolades
JUNE
• The new ten-year franchise for Citybus Franchise 1 (Hong
Kong Island and Cross-Harbour bus network) took effect on
1 June.
• A wholly owned subsidiary of the Group signed a sale and
purchase agreement to dispose of its entire interest in NWS
Kwai Chung Logistics Centre for a cash consideration of
HK$3.75 billion.
• New World First Ferry Services Limited launched the first-ever
breastfeeding room in Hong Kong public transportation.
• NWS Holdings and its seven member companies in Hong
Kong were awarded the 10 Years Plus Caring Company Logo
by The Hong Kong Council of Social Service.
ANNUAL REPORT 2016 7

Financial Highlights
2016 2015
HK$’m HK$’m
Revenue 29,497.8 24,491.8
Profit Attributable to Shareholders of the Company 4,912.8 4,477.6
Net Debt 6,141.2 6,389.1
Total Assets 75,685.0 75,153.6
Net Assets 45,858.4 46,187.7
Shareholders’ Funds 45,618.9 45,413.4
2016 2015
HK$ HK$
Basic Earnings per Share 1.30 1.19
Net Assets per Share 11.97 12.23
2016 2015
Net Gearing Ratio 13% 14%
Return on Equity 11% 10%
Return on Capital Employed 9% 7%
Dividend Payout Ratio 51% 50%
NWS HOLDINGS LIMITED8
Financial Highlights
2012 2013 2014 2015 2016
2016 2015 2016 2015 2016 2015
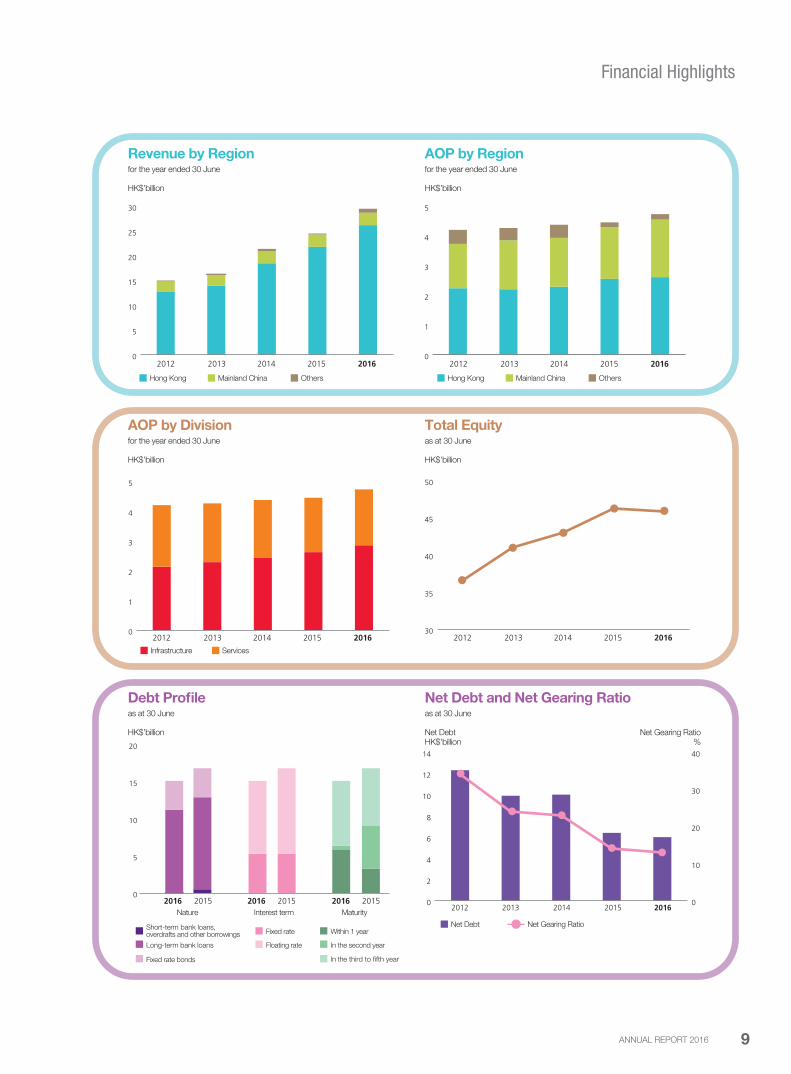
Revenue by Region
AOP by Division
Debt Pro le
AOP by Regionfor the year ended 30 June
HK$’billion
for the year ended 30 June
HK$’billion
as at 30 June
HK$’billion
for the year ended 30 June
HK$’billion
2012 2013 2014 2015 2016
Net Debt and Net Gearing Ratio as at 30 June
Net DebtHK$’billion
Net Gearing Ratio%
2012 2013 2014 2015 2016
Total Equityas at 30 June
HK$’billion
2012 2013 2014 2015 2016
Hong Kong Mainland China Others
2012 2013 2014 2015 2016
Infrastructure Services
Net Debt
Nature
Short-term bank loans, overdrafts and other borrowings Fixed rate Within 1 year
Long-term bank loans Floating rate In the
In the third to fifth year
second year
Fixed rate bonds
Interest term Maturity
Net Gearing Ratio
Hong Kong Mainland China Others
0
5
10
15
20
25
30
0
1
2
3
4
5
0
1
2
3
4
5
30
35
40
45
50
0
5
10
15
20
0
2
4
6
8
10
12
14
0
10
20
30
40
ANNUAL REPORT 2016 9

Chairman’s Statement
Dear Shareholders,
I am pleased to report another successful year with profit attributable to shareholders of HK$4.913 billion, a 10% growth over FY2015. We have been able to achieve this through strategic and effective asset allocation founded on a prudent and proactive capital management approach despite challenging market conditions. Drawing on the quality of our assets and our active portfolio management and multi-asset class investment practices, the Group is confident that we will be able to provide long-term stable returns to shareholders through economic cycles in the years ahead.
Sustainable Growth Path AheadTo achieve the average economic growth target of 6.5% set by the Central People’s Government (“CPG”) over the medium term, the CPG has adopted policy measures to reduce over-supply in certain sectors of the economy while at the same time, endeavour to boost domestic consumption. Meanwhile, the CPG continues to accelerate the pace of economic reforms to improve market efficiency and address underlying structural issues. Having established an extensive infrastructure platform and network in China, the Group has the operational and financial capabilities to capitalize on opportunities brought by the new policies and economic developments. In addition to being able to achieve sustainable growth for its well established infrastructure business platform in the Mainland, the Group will also continue to seek other growth opportunities through strategic acquisitions by undertaking direct investments and participating in public-private partnership projects.
To better reflect the Group’s latest investment strategy and focus, segmental reporting of the Infrastructure division has undergone some changes. With the Roads segment maintaining status quo, the other infrastructure projects have been regrouped under Environment, Logistics and Aviation segments. As the backbone of local economic development, the Group’s Mainland based infrastructure projects under the Roads, Environment and Logistics segments will continue to benefit from government policies on further reforms, urbanization, sustainable development through environmental protection and above all, the Belt and Road Initiative. Indeed, the positive contribution from the organic growth across the infrastructure portfolio in FY2016 would have been more significant had this not been diluted by the depreciation of Renminbi.
The Aviation segment registered notable growth with the full-year result of Goshawk Aviation Limited (“Goshawk”). Riding on the strong global demand for air travel and leased aircraft, Goshawk’s fleet size increased from 40 to 68 during FY2016. The establishment of Bauhinia Aviation Capital Limited (“Bauhinia”), our second aircraft leasing platform, further strengthens the Group’s ability to increase investment returns from this growing market.
The less than satisfactory result of the Environment segment in FY2016 mainly reflected the contraction of the coal-fired energy business on the back of weakening electricity demand and mounting competition from renewable energy. On the other hand, water related businesses maintained steady growth momentum as evidenced by the growth in sales and treatment volume. This included the part-year contribution from the newly invested joint venture to expand on environmental business, namely Chongqing Derun Environment Co., Ltd. (“Derun Environment”). As such, the Group looks forward to embracing the opportunities brought by the nationwide environmental reform initiatives as detailed in the country’s 13th Five-Year Plan.
We are committed to
delivering sustainable returns
to our shareholders through
multi-asset class investment
practices and active portfolio
management strategies.
“
”
10

Chairman’s Statement
The growth of the Logistics segment owed much to the
proactive leasing approach adopted by ATL Logistics
Centre and its competitiveness in attracting and retaining
quality tenants. Driven by the rising demand and supportive
policy measures introduced by the authorities, throughput
of China United International Rail Containers Co., Limited
(“CUIRC”) surpassed 2 million TEUs in FY2016. The outlook
is encouraging as apart from rolling out Tianjin and Urumqi
terminals in FY2017, CUIRC will also proceed to plan for the
construction of a terminal in Guangzhou. It is expected that
the Logistics segment will remain resilient even without the
contribution from NWS Kwai Chung Logistics Centre following
the strategic decision to dispose of this asset in FY2016.
The Services division produced modest growth despite the
weakness of its retail component. The Construction & Transport
segment continues to benefit from the demand for building and
contracting services and the current low fuel price environment
respectively. In contrast, the Facilities Management segment
experienced further contraction as high rental amid weak
consumer sentiments continued to squeeze the profit margins
of the Free Duty shops while the Hong Kong Convention and
Exhibition Centre (“HKCEC”) performed steadfastly by delivering
service excellence. With the opening of Gleneagles Hong Kong
Hospital (“GHKH”) in early 2017, the Group will benefit from the
provision of quality healthcare services by GHKH, which will be
a fresh impetus for the services portfolio.
Performance Review
Attributable Operating Profit (“AOP”) grew by 6% to
HK$4.740 billion while profit attributable to shareholders
increased by 10% to HK$4.913 billion in FY2016. AOP growth
of 9% delivered by the Infrastructure division against the impact
of Renminbi depreciation fully illustrated the underlying strength
of the infrastructure projects and the value of the Group’s vision
to invest in the aviation sector. On the other hand, the modest
AOP growth of 3% for the Services division reflected the difficult
operating environment of the retail business of the Group.
Besides AOP growth, the 10% increase in profit attributable
to shareholders was also boosted by the net positive
impact of the exceptional items. As detailed in the interim
results announcement, the Group booked fair value and
deemed disposal gains of approximately HK$593 million and
HK$179 million on its investment properties and investment
in Derun Environment although the impact was partly offset
by impairment losses on Tharisa plc (“Tharisa”) and Hyva
Holding B.V. (“Hyva”) which amounted to approximately
HK$200 million and HK$178 million respectively. During the
latter half of FY2016, the Group recognized additional fair
value and disposal gains of approximately HK$850 million
and HK$534 million from the divestment of NWS Kwai Chung
Logistics Centre and shares in New World China Land Limited
prior to its privatization. However, such impact was softened
by the marked-to-market loss of approximately HK$670 million
on Haitong International Securities Group Limited (“Haitong
International”), which is held by the Group as an available-for-
sale financial asset.
The Board is pleased to propose a final dividend of HK$0.34 per
share, representing a payout ratio of approximately 50.5%.
Corporate Sustainability
The Group’s firm commitment in corporate sustainability is
underpinned by our structured management approach in
benchmarking and adopting industry and international best
practices, in addition to engaging stakeholders in a transparent
and accountable way. As an early adopter of the Global
Reporting Initiative G4 Sustainability Reporting Guidelines and
Hong Kong Stock Exchange’s Environmental, Social and
Governance Reporting Guide in sustainability reporting, we
take another step forward this year by disclosing the Group’s
risk management approach and progress in our annual
report. As we progress along our sustainable journey, we are
honoured to have been recognized as a constituent of the
Hang Seng Corporate Sustainability Benchmark Index for the
sixth consecutive year and the top performer in fair operating
practices in September 2016.
A Note of Thanks and Appreciation
I would like to express my sincere appreciation to our board
of directors for their invaluable leadership and insights and our
management staff and employees for their dedication and
hard work in forging a resilient future. Finally, I must thank our
business partners and shareholders for maintaining the support
and confidence in the Group over the years.
Dr Cheng Kar Shun, Henry
Chairman
Hong Kong, 20 September 2016
ANNUAL REPORT 2016 11

Board of Directors
Dr Cheng Kar Shun, Henry GBS
Chairman
Dr Cheng, aged 69, was appointed as Executive Director in
March 2000 and became the Chairman in March 2001. He
is also the Chairman of the Executive Committee and the
Nomination Committee of the Company and a director of
certain subsidiaries of the Group. Dr Cheng is the Chairman
and Executive Director of New World Development Company
Limited, a substantial shareholder of the Company, the
Chairman and Executive Director of Chow Tai Fook Jewellery
Group Limited and International Entertainment Corporation,
the Chairman and Non-executive Director of New World
Department Store China Limited, Newton Resources Ltd
and FSE Engineering Holdings Limited, an independent non-
executive director of HKR International Limited and Hang Seng
Bank Limited and a non-executive director of SJM Holdings
Limited, all being listed public companies in Hong Kong. He is
the Chairman and Managing Director of New World China Land
Limited, a listed public company in Hong Kong until its delisting
on 4 August 2016. He was a non-executive director of Lifestyle
International Holdings Limited, a listed public company in Hong
Kong, up to his retirement on 4 May 2015. Dr Cheng is also the
Chairman of New World Hotels (Holdings) Limited and a director
of several substantial shareholders of the Company, namely
Cheng Yu Tung Family (Holdings) Limited, Cheng Yu Tung
Family (Holdings II) Limited, Chow Tai Fook Capital Limited,
Chow Tai Fook (Holding) Limited, Chow Tai Fook Enterprises
Limited and Mombasa Limited. Dr Cheng is the Chairman of the
Advisory Council for The Better Hong Kong Foundation and a
Standing Committee Member of the Twelfth Chinese People’s
Political Consultative Conference of The People’s Republic of
China. In 2001, he was awarded the Gold Bauhinia Star by the
Government of the HKSAR. Dr Cheng is the father of Mr Cheng
Chi Ming, Brian and the uncle of Mr William Junior Guilherme
Doo.
Mr Tsang Yam Pui GBS, OBE, QPM, CPM
Executive Director and Chief Executive Officer
Mr Tsang, aged 70, was appointed as Executive Director
in June 2004 and became the Chief Executive Officer
on 1 July 2015. He is also the Chairman of the Corporate Social
Responsibility Committee and a member of the Executive
Committee, the Remuneration Committee and the Nomination
Committee of the Company and also a director of certain
subsidiaries of the Group. Mr Tsang is the Vice Chairman of
New World First Bus Services Limited, Citybus Limited, New
World First Bus Services (China) Limited and New World First
Ferry Services Limited. He is also a director of GHK Hospital
Limited which owns and operates Gleneagles Hong Kong
Hospital. Mr Tsang is a non-executive director of Wai Kee
Holdings Limited, a listed public company in Hong Kong. He is
also a director of Mapletree Investments Pte Ltd in Singapore
and the Chairman and a non-executive director of Mapletree
Commercial Trust Management Ltd. (as manager of Mapletree
Commercial Trust which is listed on the Singapore Stock
Exchange). Prior to joining the Company, Mr Tsang had served
with the Hong Kong Police Force for 38 years and retired
from the Force as its Commissioner in December 2003. He
has extensive experience in corporate leadership and public
administration. Mr Tsang was awarded the Gold Bauhinia Star,
the OBE, the Queen’s Police Medal, the Colonial Police Medal
for Meritorious Service, the Commissioner’s Commendation,
and the HKSAR Police Long Service Medal.
NWS HOLDINGS LIMITED12

Board of Directors
Mr Hui Hon Chung JP
Executive Director and Deputy Chief Executive Officer
Mr Hui, aged 65, was appointed as Executive Director and
the Deputy Chief Executive Officer on 1 September 2015.
He is also a member of the Executive Committee and the
Corporate Social Responsibility Committee of the Company
and a director of certain subsidiaries of the Group. Mr Hui is
the Vice Chairman and a non-executive director of Newton
Resources Ltd, a listed public company in Hong Kong, and an
independent non-executive director of Air China Limited whose
shares are listed in Hong Kong, London and Shanghai. Mr Hui
joined Cathay Pacific Airways Limited in 1975 and had held a
range of management positions in Hong Kong and overseas.
In 1997, he joined Hong Kong Dragon Airlines Limited as its
Chief Executive Officer. During the period from February 2007
to July 2014, he served as the Chief Executive Officer of Hong
Kong Airport Authority. Mr Hui has also served in a number of
advisory committees both in Hong Kong and Mainland China,
which included membership on the Greater Pearl River Delta
Business Council, the Commission on Strategic Development
of the HKSAR Government, Aviation Advisory Board, Aviation
Development Advisory Committee, Vocational Training Council,
the Hong Kong Logistics Development Council and the Hong
Kong Tourism Board. Mr Hui was a member of the 4th and
5th Shenzhen Committee of the Chinese People’s Political
Consultative Conference. He is currently a member of the
National Committee of the Twelfth Chinese People’s Political
Consultative Conference. Mr Hui is also a member of the
General Committee of the Hong Kong General Chamber of
Commerce. In July 2006, Mr Hui was appointed as a Justice of
the Peace by the Chief Executive of the HKSAR. Mr Hui holds
a Bachelor Degree of Science from The Chinese University of
Hong Kong.
Mr Cheung Chin CheungExecutive Director
Mr Cheung, aged 60, was appointed as Executive Director
in October 2003 and is also a member of the Executive
Committee and the Corporate Social Responsibility Committee
of the Company. He had been an executive director of the
Company during the period from May 1998 to January
2003. Mr Cheung is also a director of NWS Infrastructure
Management Limited, Sino-French Holdings (Hong Kong)
Limited, Far East Landfill Technologies Limited and a number of
companies in Mainland China. He is the Managing Director of
The Macao Water Supply Company Limited and a director of
Chongqing Water Group Company Limited, a company listed
in Shanghai, the PRC. He is a director of certain subsidiaries of
the Group and is mainly responsible for managing the Group’s
infrastructure business. Mr Cheung had been a member of
the Infrastructure Development Advisory Committee and the
China Trade Advisory Committee of the Hong Kong Trade
Development Council. He has over 25 years of experience
in business development, investment and management in
the infrastructure business in Mainland China. Mr Cheung is
a member of the Hebei Province Committee of the Eleventh
Chinese People’s Political Consultative Conference of The
People’s Republic of China. He is a Chartered Professional
Accountant of Canada.
ANNUAL REPORT 2016 13
Board of Directors
Mr Cheng Chi Ming, BrianExecutive Director
Mr Cheng, aged 33, was appointed as Executive Director in
July 2009 and is also a member of the Executive Committee
and the Corporate Social Responsibility Committee of the
Company. He is also a director of certain subsidiaries of the
Group. He has been with the Company since January 2008 and
is mainly responsible for overseeing the infrastructure business
and the merger and acquisition affairs of the Group. Mr Cheng
is the Chairman and non-executive director of Integrated Waste
Solutions Group Holdings Limited and a non-executive director
of Newton Resources Ltd, Haitong International Securities
Group Limited, Wai Kee Holdings Limited and Beijing Capital
International Airport Co., Ltd., all being listed public companies
in Hong Kong. Mr Cheng is a non-executive director of Tharisa
plc, whose shares are listed on the Johannesburg Stock
Exchange Limited and the London Stock Exchange plc. He is
also a director of Sino-French Holdings (Hong Kong) Limited,
The Macao Water Supply Company Limited and a number of
companies in Mainland China. Before joining the Company,
Mr Cheng had been working as a research analyst in the
Infrastructure and Conglomerates sector for CLSA Asia-Pacific
Markets. Mr Cheng holds a Bachelor of Science degree from
Babson College in Massachusetts, USA. Mr Cheng is the son of
Dr Cheng Kar Shun, Henry and the cousin of Mr William Junior
Guilherme Doo.
Mr To Hin Tsun, GeraldNon-executive Director
Mr To, aged 67, was appointed as Independent Non-executive
Director in May 1998 and was re-designated as Non-executive
Director in August 2002. Mr To has been a practising solicitor
in Hong Kong since 1975. He is also qualified as a solicitor in
the United Kingdom, as well as an advocate and solicitor in
Singapore. Mr To is also a non-executive director of Mongolia
Energy Corporation Limited and an executive director of
International Entertainment Corporation, both companies’
shares being listed on the Main Board of the Hong Kong Stock
Exchange.
NWS HOLDINGS LIMITED14
Board of Directors
Mr Dominic LaiNon-executive Director
Mr Lai, aged 69, was appointed as Independent Non-executive
Director in August 2002 and was re-designated as Non-
executive Director in September 2004. He is also a member of
the Audit Committee and the Corporate Social Responsibility
Committee of the Company. Mr Lai is a practising solicitor in
Hong Kong and is also admitted in England and Wales, the
Republic of Singapore and the States of New South Wales
and Victoria, Australia. Mr Lai is a senior partner of the Hong
Kong law firm, Iu, Lai & Li. He is also a non-executive director of
Midas International Holdings Limited and Oriental Press Group
Limited, both being listed public companies in Hong Kong.
Mr Lam Wai Hon, PatrickNon-executive Director
Mr Lam, aged 54, was appointed as Executive Director in
January 2003 and was re-designated as Non-executive
Director on 1 January 2016. He is also a member of the
Corporate Social Responsibility Committee of the Company
and a director of certain subsidiaries of the Group. Mr Lam is
currently an executive director and the Chief Executive Officer
of FSE Holdings Limited. He is also an executive director of FSE
Engineering Holdings Limited (appointed on 1 April 2016) and a
non-executive director of Road King Infrastructure Limited, both
being listed public companies in Hong Kong. He was the Vice
Chairman and a non-executive director of Newton Resources
Ltd (resigned on 2 January 2016) and a non-executive director
of Wai Kee Holdings Limited (resigned on 30 December 2015),
both being listed public companies in Hong Kong. Mr Lam
is a Chartered Accountant by training and is a fellow of the
Hong Kong Institute of Certified Public Accountants and the
Institute of Chartered Accountants in England and Wales, and a
member of the Chartered Professional Accountants of Ontario,
Canada. He is a member of the Asia advisory board of Ivey
Business School of Western University, Canada.
ANNUAL REPORT 2016 15
Board of Directors
Mr William Junior Guilherme DooNon-executive Director
Mr Doo, aged 42, was appointed as Director in December
2005 and was re-designated from Executive Director to Non-
executive Director on 1 July 2014. He is also a member of the
Corporate Social Responsibility Committee of the Company.
Mr Doo is an executive director of FSE Engineering Holdings
Limited, a listed public company in Hong Kong, and an
executive director and the Deputy Chief Executive Officer of
FSE Holdings Limited. He is a solicitor admitted in the HKSAR
and is currently a non-practising solicitor in England and Wales.
Mr Doo had legal practice experience in one of the largest global
law firms specializing in finance and corporate transactions. He
is a member of the Standing Committee of the Twelfth Chinese
People’s Political Consultative Conference in Beijing of The
People’s Republic of China. Mr Doo is the nephew of Dr Cheng
Kar Shun, Henry and the cousin of Mr Cheng Chi Ming, Brian.
Mr Kwong Che Keung, GordonIndependent Non-executive Director
Mr Kwong, aged 67, was appointed as Independent Non-
executive Director in October 2002 and is the Chairman of
the Audit Committee and a member of the Remuneration
Committee and the Nomination Committee of the Company.
He is also an independent non-executive director of a number
of Hong Kong listed public companies including Agile Group
Holdings Limited, CITIC Telecom International Holdings Limited,
China COSCO Holdings Company Limited, China Power
International Development Limited, Chow Tai Fook Jewellery
Group Limited, FSE Engineering Holdings Limited, Global Digital
Creations Holdings Limited, Henderson Investment Limited,
Henderson Land Development Company Limited and OP
Financial Investments Limited. He was an independent non-
executive director of China Chengtong Development Group
Limited (resigned on 1 November 2013) and an independent
supervisor of Beijing Capital International Airport Co., Ltd.
(retired on 30 June 2014), both being listed public companies
in Hong Kong. Mr Kwong is a fellow member of the Institute of
Chartered Accountants in England and Wales and the Hong
Kong Institute of Certified Public Accountants. He was a Partner
of Price Waterhouse from 1984 to 1998 and an independent
member of the Council of the Hong Kong Stock Exchange from
1992 to 1997, during which, he had acted as convener of both
the Compliance Committee and the Listing Committee.
NWS HOLDINGS LIMITED16
Board of Directors
Dr Cheng Wai Chee, Christopher GBS, OBE, JP
Independent Non-executive Director
Dr Cheng, aged 68, was appointed as Independent Non-
Executive Director in January 2003 and is a member of the Audit
Committee, the Remuneration Committee and the Nomination
Committee of the Company. Dr Cheng is the Chairman of
Wing Tai Properties Limited and an independent non-executive
director of Kingboard Chemical Holdings Limited, both being
listed public companies in Hong Kong. He is an independent
non-executive director of Eagle Asset Management (CP)
Limited (as manager of Champion Real Estate Investment
Trust which is listed on the Hong Kong Stock Exchange).
Dr Cheng is also an independent non-executive director of
The Hongkong and Shanghai Banking Corporation Limited.
He was an independent non-executive director (resigned on
1 September 2016) of New World China Land Limited, a
listed public company in Hong Kong until its delisting on
4 August 2016. Dr Cheng has a keen interest in the public
services. He is currently a member of the Judicial Officers
Recommendation Commission and a steward of the Hong
Kong Jockey Club. He also serves as a member of the board
of Overseers at Columbia Business School and a member on
the President’s Council on International Activities of the Yale
University. He retired as a member of the board of Temasek
Foundation CLG Limited on 7 September 2016. Dr Cheng
holds a Doctorate in Social Sciences honoris causa from
The University of Hong Kong and a Doctorate in Business
Administration honoris causa from The Hong Kong Polytechnic
University. He graduated from the University of Notre Dame,
Indiana with a BBA degree and from Columbia University, New
York with an MBA degree.
The Honourable Shek Lai Him, Abraham GBS, JP
Independent Non-executive Director
Mr Shek, aged 71, was appointed as Independent Non-
executive Director in September 2004 and is the Chairman
of the Remuneration Committee and a member of the Audit
Committee and the Nomination Committee of the Company.
Mr Shek is an independent non-executive director of MTR
Corporation Limited, Midas International Holdings Limited,
Paliburg Holdings Limited, Lifestyle International Holdings
Limited, Chuang’s Consortium International Limited, Chuang’s
China Investments Limited (also acts as Chairman), ITC
Corporation Limited, ITC Properties Group Limited (also
acts as Vice Chairman), Country Garden Holdings Company
Limited, Hop Hing Group Holdings Limited, SJM Holdings
Limited, China Resources Cement Holdings Limited, Lai
Fung Holdings Limited, Cosmopolitan International Holdings
Limited and TUS International Limited, all being listed public
companies in Hong Kong. He is also an independent non-
executive director of Eagle Asset Management (CP) Limited
(the manager of Champion Real Estate Investment Trust) and
Regal Portfolio Management Limited (the manager of Regal
Real Estate Investment Trust), both of the trusts are listed on
the Hong Kong Stock Exchange. Mr Shek was an independent
non-executive director of Titan Petrochemicals Group Limited
(up to expiry of his contract on 27 February 2014) and Hsin
Chong Construction Group Ltd. (now known as Hsin Chong
Group Holdings Limited, retired on 12 May 2014), both are
listed public companies in Hong Kong. He also ceased to act
as an independent non-executive director of Dorsett Hospitality
International Limited (the shares of which were withdrawn from
listing with effect from 17 October 2015) on 11 March 2016.
He was a director of The Hong Kong Mortgage Corporation
Limited (retired on 25 April 2016). Mr Shek is a member of
the Legislative Council for the HKSAR representing real estate
and construction functional constituency since 2000. He was
appointed as Justice of the Peace in 1995 and was awarded
the Gold Bauhinia Star in 2013. Mr Shek graduated from the
University of Sydney with Bachelor of Arts.
ANNUAL REPORT 2016 17

Board of Directors
Mr Lee Yiu Kwong, AlanIndependent Non-executive Director
Mr Lee, aged 72, was appointed as Independent Non-
executive Director in October 2012 and he is also a member of
the Audit Committee and the Corporate Social Responsibility
Committee of the Company. He is the former Chief Executive
Officer of CSX World Terminals Hong Kong Limited and ATL
Logistics Centre Hong Kong Limited. Mr Lee has over 40 years
of shipping and logistics experience, including over 15 years
of international experience working in the United States, the
Netherlands, Malaysia, Singapore and Thailand. Mr Lee is the
former Chairman of Hong Kong Container Terminal Operators
Association. He was also a committee member of Hong Kong
Business Advisory Committee, Logistics Advisory Committee
of Hong Kong Trade Development Council, Hong Kong Port
Development Council, Hong Kong Logistics Development
Council and the Sailors Home and Missions to Seamen Hong
Kong. Mr Lee is an accountant by training and has over six years
of experience at KPMG.
Mrs Oei Fung Wai Chi, GraceIndependent Non-executive Director
Ms Fung, aged 63, was appointed as Independent Non-
executive Director on 1 January 2016 and is also a member
of the Corporate Social Responsibility Committee of the
Company. She is currently the Chairperson of Ronald
McDonald House Charities in Hong Kong since September
2008 and she has been elected to the global board of
trustees of Ronald McDonald House Charities in Chicago
since 1 January 2015. Ms Fung had worked in investment
banking and wholesale banking for 36 years. She was the
Vice Chairman, Corporate & Institutional Clients, at Standard
Chartered Bank, Hong Kong when she retired from the bank
in November 2014. Before joining Standard Chartered Bank
in 2002, she had worked with UBS for nine years including
service as Managing Director responsible for corporate finance
and fixed income. During her service with UBS, Ms Fung had
regional responsibilities for institutional sales, fixed income,
supervising a team in Hong Kong and Singapore which covered
13 countries in Asia (excluding Japan). Her team advised
central banks and other institutional investors in Asia on fixed
income investments and hedging strategies for interest rates
and currencies. Ms Fung had taken on a number of public
service responsibilities over the years, including as a member
of the Takeovers and Mergers Panel and the Takeovers Appeal
Committee of the Securities and Futures Commission and a
member of the Finance Committee of the Hong Kong Housing
Authority. Ms Fung graduated from the London School of
Economics and Political Science, London University, with a BSc
(Econ) degree, majoring in Accounting and Finance.
NWS HOLDINGS LIMITED18

Senior Management
Mr Chow, aged 49, joined the Company in 2002 and is the
Group Financial Controller and Company Secretary of the
Company. He is responsible for the financial management,
treasury and corporate governance functions of the Group.
Mr Chow is a member of the Hong Kong Institute of Certified
Public Accountants and a fellow member of the Association
of Chartered Certified Accountants (UK), The Hong Kong
Institute of Chartered Secretaries and the Institute of Chartered
Secretaries and Administrators. He holds an Executive MBA
degree from Western University, Canada. Mr Chow has over
25 years’ experience in accounting and financial management
and corporate governance. Prior to joining the Group, he
was a manager of an international accounting firm and senior
executive of several Hong Kong listed public companies.
Mr Chow Tak WingGroup Financial Controller
and Company Secretary
NWS Holdings Limited
Mr Ng Tik HongGeneral Manager
– Merger & Acquisition
NWS Holdings Limited
Mr Mak Kai Lert,
RussellHead
– Audit & Risk Assurance
NWS Holdings Limited
Ms Lam Yuet Wan,
ElinaGeneral Manager
– Human Resources
NWS Holdings Limited
Mr Mak, aged 61, joined the Company in 2006 and is the Head
of Audit & Risk Assurance of the Company. He is responsible
for internal audit and risk management of the Group.
Mr Mak is a fellow of the Institute of Chartered Accountants
in England & Wales and the Hong Kong Institute of Certified
Public Accountants. He is also a Certified Information Security
Manager of the Information Systems Audit and Control
Association (USA). He holds a BA(Hons) in Accountancy.
Mr Mak has profound professional knowledge in auditing and
corporate governance issues with over 30 years’ auditing
experience in various listed companies, financial institutions and
investment banks. Prior to joining the Company, he had worked
as the Head of Audit Departments in several Hong Kong listed
public companies.
Mr Ng, aged 46, joined New World Group in 1997 and is the
General Manager of Merger & Acquisition Department of the
Company. He is responsible for the merger and acquisition
affairs of the Group. Mr Ng is a member of the Hong Kong
Institute of Certified Public Accountants and a fellow member
of the Association of Chartered Certified Accountants (UK). He
holds a Bachelor Degree in Accountancy, and a Master Degree
of Business Administration from The Chinese University of Hong
Kong. Mr Ng has over 20 years’ experience in accounting,
finance and project management. Prior to joining the Group, he
worked in an international accounting firm.
Ms Lam, aged 53, joined the Company in 1997 and is the
General Manager of Human Resources Department of the
Company. She is responsible for managing the human
resources and administration affairs of the Group. Ms Lam is
a professional member of the Hong Kong Institute of Human
Resources Management. She holds an Executive MBA degree
from Western University, Canada and a Master of Business
Administration degree from University of Strathclyde, United
Kingdom. Ms Lam has over 25 years’ experience in human
resources and training and development. Prior to joining the
Group, she was a senior executive of human resources in
several companies in Hong Kong.
ANNUAL REPORT 2016 19

Senior Management
Ms Tang Cheung YiGeneral Manager
– Corporate Communication
NWS Holdings Limited
Ms Cheng Ka Ki,
JoannaGeneral Manager
– Environment
NWS Infrastructure
Management Limited
Mr Cheng Chi KwokDirector and General Manager
– Roads
NWS Infrastructure
Management Limited
Mr Lee Wai Bong,
StephenGeneral Manager
– Logistics & Ports
NWS Ports Management
Limited
Ms Tang, aged 52, joined the Company in 2012 and is the
General Manager of Corporate Communication Department
of the Company. She is responsible for the Group’s corporate
communication, public affairs and corporate sustainability
functions. Ms Tang possesses more than 25 years of
management experience in corporate communication,
government relations and journalism in Hong Kong and the
United States. Prior to joining the Group, she was the corporate
affairs director with a multinational company in information
technology. Ms Tang holds a Bachelor of Social Science degree
and a Master of Arts degree in Telecommunications.
Mr Cheng, aged 52, joined New World Group in 1993 and is the
Director and General Manager (Roads) of NWS Infrastructure
Management Limited, a wholly owned subsidiary of the
Company. He is also a director of several major PRC joint
ventures in the Roads segment of the Group. Mr Cheng holds
a Bachelor of Business Administration degree and he has over
25 years of experience in project development, investment
and management in the infrastructure and roads business in
Mainland China.
Ms Cheng, aged 49, joined New World Group in 1996 and
is the General Manager (Environment) of NWS Infrastructure
Management Limited, a wholly owned subsidiary of the
Company. She is also an executive director of Sino French
Water Development Company Limited and a director of Sino-
French Holdings (Hong Kong) Limited, The Macao Water
Supply Company Limited, Far East Landfill Technologies
Limited and certain PRC joint ventures in the Environment
segment of the Group. Ms Cheng is a member of the Chartered
Professional Accountants of Ontario, Canada. She has
more than 20 years of experience in business development,
investment and management in power industry in Mainland
China. Prior to joining the Group, she had worked for audit firms
in Canada and Hong Kong.
Mr Lee, aged 51, joined the Group in 2002 and is the General
Manager (Logistics & Ports) of NWS Ports Management
Limited, a wholly owned subsidiary of the Company. Mr Lee
holds a Bachelor of Business Administration degree from The
Chinese University of Hong Kong and a Master of Business
Administration degree from the University of Toronto, Canada.
Mr Lee has extensive experience in project management and
merger and acquisition activities. Prior to joining the Group, he
had worked in several major multinational corporations.
NWS HOLDINGS LIMITED20
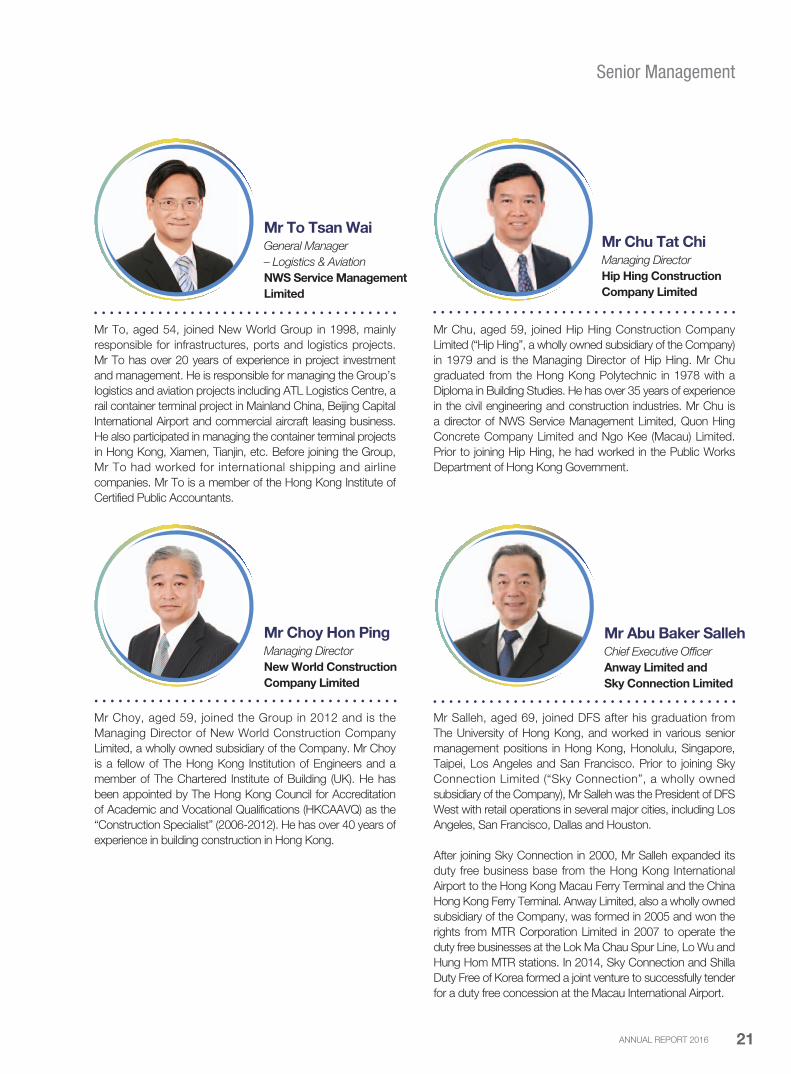
Senior Management
Mr To Tsan WaiGeneral Manager
– Logistics & Aviation
NWS Service Management
Limited
Mr Choy Hon PingManaging Director
New World Construction
Company Limited
Mr Chu Tat ChiManaging Director
Hip Hing Construction
Company Limited
Mr To, aged 54, joined New World Group in 1998, mainly
responsible for infrastructures, ports and logistics projects.
Mr To has over 20 years of experience in project investment
and management. He is responsible for managing the Group’s
logistics and aviation projects including ATL Logistics Centre, a
rail container terminal project in Mainland China, Beijing Capital
International Airport and commercial aircraft leasing business.
He also participated in managing the container terminal projects
in Hong Kong, Xiamen, Tianjin, etc. Before joining the Group,
Mr To had worked for international shipping and airline
companies. Mr To is a member of the Hong Kong Institute of
Certified Public Accountants.
Mr Chu, aged 59, joined Hip Hing Construction Company
Limited (“Hip Hing”, a wholly owned subsidiary of the Company)
in 1979 and is the Managing Director of Hip Hing. Mr Chu
graduated from the Hong Kong Polytechnic in 1978 with a
Diploma in Building Studies. He has over 35 years of experience
in the civil engineering and construction industries. Mr Chu is
a director of NWS Service Management Limited, Quon Hing
Concrete Company Limited and Ngo Kee (Macau) Limited.
Prior to joining Hip Hing, he had worked in the Public Works
Department of Hong Kong Government.
Mr Choy, aged 59, joined the Group in 2012 and is the
Managing Director of New World Construction Company
Limited, a wholly owned subsidiary of the Company. Mr Choy
is a fellow of The Hong Kong Institution of Engineers and a
member of The Chartered Institute of Building (UK). He has
been appointed by The Hong Kong Council for Accreditation
of Academic and Vocational Qualifications (HKCAAVQ) as the
“Construction Specialist” (2006-2012). He has over 40 years of
experience in building construction in Hong Kong.
Mr Abu Baker SallehChief Executive Officer
Anway Limited and
Sky Connection Limited
Mr Salleh, aged 69, joined DFS after his graduation from
The University of Hong Kong, and worked in various senior
management positions in Hong Kong, Honolulu, Singapore,
Taipei, Los Angeles and San Francisco. Prior to joining Sky
Connection Limited (“Sky Connection”, a wholly owned
subsidiary of the Company), Mr Salleh was the President of DFS
West with retail operations in several major cities, including Los
Angeles, San Francisco, Dallas and Houston.
After joining Sky Connection in 2000, Mr Salleh expanded its
duty free business base from the Hong Kong International
Airport to the Hong Kong Macau Ferry Terminal and the China
Hong Kong Ferry Terminal. Anway Limited, also a wholly owned
subsidiary of the Company, was formed in 2005 and won the
rights from MTR Corporation Limited in 2007 to operate the
duty free businesses at the Lok Ma Chau Spur Line, Lo Wu and
Hung Hom MTR stations. In 2014, Sky Connection and Shilla
Duty Free of Korea formed a joint venture to successfully tender
for a duty free concession at the Macau International Airport.
ANNUAL REPORT 2016 21
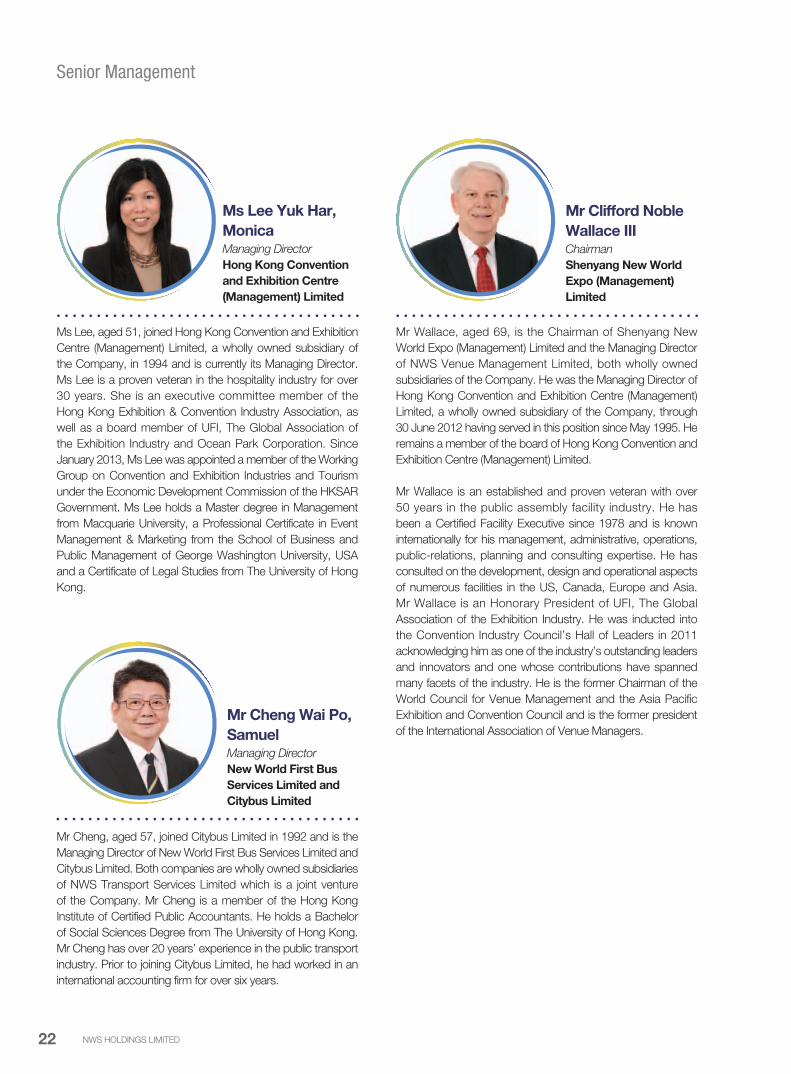
Senior Management
Ms Lee Yuk Har,
MonicaManaging Director
Hong Kong Convention
and Exhibition Centre
(Management) Limited
Mr Cheng Wai Po,
SamuelManaging Director
New World First Bus
Services Limited and
Citybus Limited
Mr Clifford Noble
Wallace IIIChairman
Shenyang New World
Expo (Management)
Limited
Ms Lee, aged 51, joined Hong Kong Convention and Exhibition
Centre (Management) Limited, a wholly owned subsidiary of
the Company, in 1994 and is currently its Managing Director.
Ms Lee is a proven veteran in the hospitality industry for over
30 years. She is an executive committee member of the
Hong Kong Exhibition & Convention Industry Association, as
well as a board member of UFI, The Global Association of
the Exhibition Industry and Ocean Park Corporation. Since
January 2013, Ms Lee was appointed a member of the Working
Group on Convention and Exhibition Industries and Tourism
under the Economic Development Commission of the HKSAR
Government. Ms Lee holds a Master degree in Management
from Macquarie University, a Professional Certificate in Event
Management & Marketing from the School of Business and
Public Management of George Washington University, USA
and a Certificate of Legal Studies from The University of Hong
Kong.
Mr Wallace, aged 69, is the Chairman of Shenyang New
World Expo (Management) Limited and the Managing Director
of NWS Venue Management Limited, both wholly owned
subsidiaries of the Company. He was the Managing Director of
Hong Kong Convention and Exhibition Centre (Management)
Limited, a wholly owned subsidiary of the Company, through
30 June 2012 having served in this position since May 1995. He
remains a member of the board of Hong Kong Convention and
Exhibition Centre (Management) Limited.
Mr Wallace is an established and proven veteran with over
50 years in the public assembly facility industry. He has
been a Certified Facility Executive since 1978 and is known
internationally for his management, administrative, operations,
public-relations, planning and consulting expertise. He has
consulted on the development, design and operational aspects
of numerous facilities in the US, Canada, Europe and Asia.
Mr Wallace is an Honorary President of UFI, The Global
Association of the Exhibition Industry. He was inducted into
the Convention Industry Council’s Hall of Leaders in 2011
acknowledging him as one of the industry’s outstanding leaders
and innovators and one whose contributions have spanned
many facets of the industry. He is the former Chairman of the
World Council for Venue Management and the Asia Pacific
Exhibition and Convention Council and is the former president
of the International Association of Venue Managers.
Mr Cheng, aged 57, joined Citybus Limited in 1992 and is the
Managing Director of New World First Bus Services Limited and
Citybus Limited. Both companies are wholly owned subsidiaries
of NWS Transport Services Limited which is a joint venture
of the Company. Mr Cheng is a member of the Hong Kong
Institute of Certified Public Accountants. He holds a Bachelor
of Social Sciences Degree from The University of Hong Kong.
Mr Cheng has over 20 years’ experience in the public transport
industry. Prior to joining Citybus Limited, he had worked in an
international accounting firm for over six years.
NWS HOLDINGS LIMITED22

Corporate Governance Report
Corporate Governance Practices
The Board firmly believes that good corporate governance is fundamental to the smooth, effective and transparent operation of a
company and its ability to attract investment, protect the rights of shareholders and stakeholders, and enhance shareholder value.
Maintaining a high standard of corporate governance has been and remains one of the core missions of the Company. The Board
devotes considerable effort to identify and formalize best practices for adoption by the Company.
This report describes the corporate governance practices adopted by the Company and specifically highlights how the Company has
applied the principles of the code provisions set out in the Corporate Governance Code (the “CG Code”) contained in Appendix 14 of
the Listing Rules.
Set out below is the current corporate governance framework of the Group:
Shareholders
Corporate
Governance
Steering
Committee
Internal
Audit & Risk
Management
Functions
Disclosure
Committee
External
Auditor
Executive
Committee
Remuneration
Committee
Nomination
Committee
Corporate
Social
Responsibility
Committee
Audit
Committee
CompanySecretary Board
ANNUAL REPORT 2016 23
Corporate Governance Report
Comprehensive guidelines, policies and procedures have been formulated by the Board in support of the Group’s corporate
governance framework including the “Director’s Manual”, “Corporate Governance Manual”, “Guidelines on Risk Management”,
“Guidelines on Internal Control System”, “Corporate Policy on Staff Responsibility”, “Whistleblowing Policy”, “Disclosure Policy for Inside
Information”, “Board Diversity Policy” and the terms of reference for various board committees. These documents are reviewed regularly
by the Board and the relevant board committees and are updated in line with the amendments of applicable legislations and rules as
well as the current market practices.
The Company has complied with all the applicable code provisions in the CG Code throughout FY2016.
The Board
The primary role of the Board is to protect and enhance long-term shareholder value. It sets the overall strategy for the Group and
supervises executive management. It also ensures that good corporate governance policies and practices are implemented within the
Group. In the course of discharging its duties, the Board acts in good faith, with due diligence and care, and in the best interests of the
Company and its shareholders.
The Board currently comprises 14 members whose biographical details (including their relationships (if any)) are set out in the “Board of
Directors and Senior Management” section of this annual report. An updated list of directors of the Company and their respective role
and function has been maintained on the website of each of the Hong Kong Stock Exchange and the Company. Updated biographical
details of each director are also available on the Company’s website.
Day-to-day operation of the businesses of the Company is delegated to the management who is led by the Executive Committee. They
are being closely monitored by the Board and are accountable for the performance of the Company as measured against the corporate
goals and business targets set by the Board.
The Company provides extensive background information about its history, mission and businesses to its directors. Directors are also
invited to visit the Group’s operational facilities from time to time and to meet with the management for gaining better understanding of
business operations of the Group. Furthermore, the Board has separate and independent access to the senior management and the
Company Secretary at all times. With prior request to the Company Secretary, the Board is given access to independent professional
advice any time when it thinks appropriate.
Appropriate liability insurance for directors has been arranged for indemnifying their liabilities arising out of corporate activities. This
insurance coverage is reviewed on an annual basis.
The posts of Chairman and Chief Executive Officer of the Company are separate to ensure a clear distinction between the Chairman’s
responsibility to manage the Board and the Chief Executive Officer’s responsibility to manage the Company’s business. The division of
responsibilities between the Chairman and the Chief Executive Officer is clearly established and set out in writing.
NWS HOLDINGS LIMITED24

Corporate Governance Report
Board Meetings
The Board meets regularly at least four times a year at quarterly intervals and holds additional meetings as and when the Board thinks
appropriate.
Four Board meetings were held during FY2016. Notice of no less than 14 days was given to directors for the regular Board meetings.
Draft agenda for Board meetings were prepared by the Company Secretary and were circulated to all directors for comments before
each meeting. Directors were given an opportunity to include any other matters in the agenda. The agenda, together with Board papers,
were sent in full to the directors not less than three business days before the intended date of the Board meeting.
Minutes of Board meetings were prepared by the Company Secretary with details of decisions reached, any concerns raised and
dissenting views expressed. The draft minutes were sent to all directors within a reasonable time after each meeting for their comment
before being formally signed by the chairman of the meeting. Copies of the final version of minutes of the Board meetings were sent to
the directors for information and record.
At each regular Board meeting, executive directors of the Company made presentations to the Board on various aspects, including the
business performance, financial performance, corporate governance and outlook, etc. A written report reviewing the key operational
aspects of the Group was provided to the directors before each regular Board meeting to enable them to make informed decisions for
the benefit of the Company.
Throughout FY2016, directors of the Company also participated in the consideration and approval of matters of the Company by way
of written resolutions circulated to them. Supporting written materials were provided in the circulation and verbal briefings were given
by the subject executive directors or the Company Secretary when required.
Pursuant to the bye-laws of the Company, a director, whether directly or indirectly, interested in a contract or arrangement or proposed
contract or arrangement with the Company shall declare the nature of his/her interest at the meeting of the Board at which the question
of entering into the contract or arrangement is first considered. Furthermore, a director shall not vote (nor be counted in the quorum)
on any resolution of the directors in respect of any contract or arrangement or proposal in which he/she or any of his/her associate(s) is
to his/her knowledge materially interested. Matters to be decided at Board meetings are decided by a majority of votes from directors
entitled to vote. These bye-laws were strictly observed throughout FY2016.
Board meeting
ANNUAL REPORT 2016 25
Corporate Governance Report
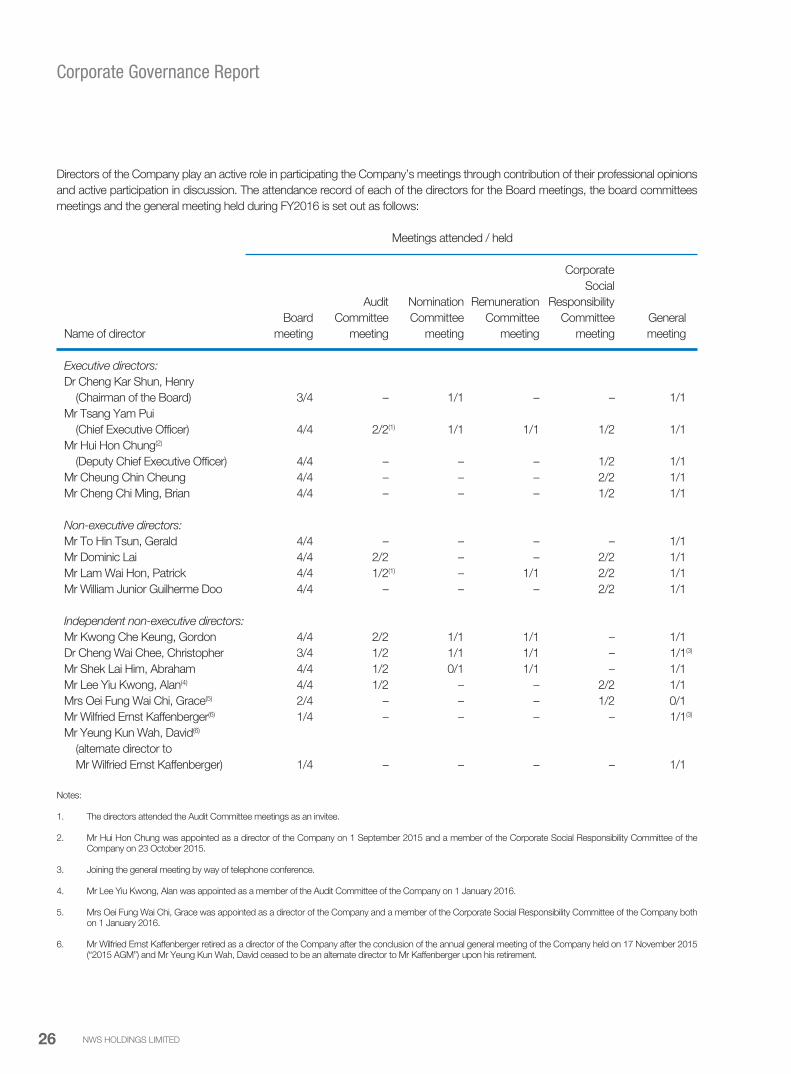
Directors of the Company play an active role in participating the Company’s meetings through contribution of their professional opinions
and active participation in discussion. The attendance record of each of the directors for the Board meetings, the board committees
meetings and the general meeting held during FY2016 is set out as follows:
Meetings attended / held
Corporate
Social
Audit Nomination Remuneration Responsibility
Board Committee Committee Committee Committee General
Name of director meeting meeting meeting meeting meeting meeting
Executive directors:
Dr Cheng Kar Shun, Henry
(Chairman of the Board) 3/4 – 1/1 – – 1/1
Mr Tsang Yam Pui
(Chief Executive Officer) 4/4 2/2(1) 1/1 1/1 1/2 1/1
Mr Hui Hon Chung(2)
(Deputy Chief Executive Officer) 4/4 – – – 1/2 1/1
Mr Cheung Chin Cheung 4/4 – – – 2/2 1/1
Mr Cheng Chi Ming, Brian 4/4 – – – 1/2 1/1
Non-executive directors:
Mr To Hin Tsun, Gerald 4/4 – – – – 1/1
Mr Dominic Lai 4/4 2/2 – – 2/2 1/1
Mr Lam Wai Hon, Patrick 4/4 1/2(1) – 1/1 2/2 1/1
Mr William Junior Guilherme Doo 4/4 – – – 2/2 1/1
Independent non-executive directors:
Mr Kwong Che Keung, Gordon 4/4 2/2 1/1 1/1 – 1/1
Dr Cheng Wai Chee, Christopher 3/4 1/2 1/1 1/1 – 1/1(3)
Mr Shek Lai Him, Abraham 4/4 1/2 0/1 1/1 – 1/1
Mr Lee Yiu Kwong, Alan(4) 4/4 1/2 – – 2/2 1/1
Mrs Oei Fung Wai Chi, Grace(5) 2/4 – – – 1/2 0/1
Mr Wilfried Ernst Kaffenberger(6) 1/4 – – – – 1/1(3)
Mr Yeung Kun Wah, David(6)
(alternate director to
Mr Wilfried Ernst Kaffenberger) 1/4 – – – – 1/1
Notes:
1. The directors attended the Audit Committee meetings as an invitee.
2. Mr Hui Hon Chung was appointed as a director of the Company on 1 September 2015 and a member of the Corporate Social Responsibility Committee of the Company on 23 October 2015.
3. Joining the general meeting by way of telephone conference.
4. Mr Lee Yiu Kwong, Alan was appointed as a member of the Audit Committee of the Company on 1 January 2016.
5. Mrs Oei Fung Wai Chi, Grace was appointed as a director of the Company and a member of the Corporate Social Responsibility Committee of the Company both on 1 January 2016.
6. Mr Wilfried Ernst Kaffenberger retired as a director of the Company after the conclusion of the annual general meeting of the Company held on 17 November 2015 (“2015 AGM”) and Mr Yeung Kun Wah, David ceased to be an alternate director to Mr Kaffenberger upon his retirement.
NWS HOLDINGS LIMITED26
Corporate Governance Report
Board Committees
The Board delegates its powers and authorities from time to time to committees in order to ensure the operational efficiency and specific
issues are being handled with relevant expertise. Five board committees have been established and each of them has its specific duties
and authorities set out in its own terms of reference. Written terms of reference, which are in line with the CG Code, of each of the Audit
Committee, the Nomination Committee and the Remuneration Committee are available on the website of each of the Hong Kong Stock
Exchange and the Company.
(a) Executive Committee
Members
Dr Cheng Kar Shun, Henry (Chairman), Mr Tsang Yam Pui, Mr Hui Hon Chung, Mr Cheung Chin Cheung and Mr Cheng Chi
Ming, Brian
Major responsibilities
• to review the Group’s performance and manage its assets and liabilities in accordance with the policies and directives of
the Board
• to make recommendation to the Board in respect of the overall strategy for the Group from time to time
(b) Audit Committee
Members
Mr Kwong Che Keung, Gordon (Chairman), Mr Dominic Lai, Dr Cheng Wai Chee, Christopher, Mr Shek Lai Him, Abraham
and Mr Lee Yiu Kwong, Alan
Major responsibilities
• to monitor the financial reporting process of the Group
• to review the Company’s financial control, risk management and internal control systems and arrangements under the
Company’s whistleblowing policy
• to govern the engagement of external auditor and its performance
Work performed during FY2016
• reviewing the audited consolidated financial statements of the Group for FY2015 and the interim results of the Group for
FY2016
• reviewing the continuing connected transactions of the Company during FY2015
• reviewing the system of internal control of the Group
• reviewing the internal audit plan of the Group for FY2017 and the internal audit reports prepared by the Group Audit and
Risk Assurance Department of the Company (“GARA”)
• reviewing the audit plans from external auditor and its remuneration
• making recommendation on the re-appointment of the external auditor
• reviewing the manpower of the Group’s finance team
• reviewing the performance, constitution and terms of reference of the Audit Committee
• making recommendation on the amendments to the terms of reference of the Audit Committee
The Audit Committee meets regularly with at least two meetings annually. It also has separate meeting with the Company’s
external auditor at least once a year in the absence of the management.
ANNUAL REPORT 2016 27

Corporate Governance Report
(c) Nomination Committee
Members
Dr Cheng Kar Shun, Henry (Chairman), Mr Tsang Yam Pui, Mr Kwong Che Keung, Gordon, Dr Cheng Wai Chee, Christopher
and Mr Shek Lai Him, Abraham
Major responsibilities
• to review the structure, size and composition (including the skills, knowledge and experience) of the Board
• to make recommendations to the Board on the appointment or re-appointment of directors
Work performed during FY2016
• reviewing the structure of the Board
• reviewing the board diversity policy of the Company
• reviewing the independence of independent non-executive directors
• making recommendations in relation to the re-appointment of the retiring directors
• making recommendations in relation to the appointment of directors
(d) Remuneration Committee
Members
Mr Shek Lai Him, Abraham (Chairman), Mr Tsang Yam Pui, Mr Kwong Che Keung, Gordon and Dr Cheng Wai Chee,
Christopher
Major responsibilities
• to review and make recommendations to the Board on the Company’s policy and structure for remuneration of directors
and on the establishment of a formal and transparent procedure for developing policy on such remuneration
• to make recommendations to the Board on the remuneration packages, including benefits in kind, pension rights and
compensation payments, of individual executive directors
• to determine the remuneration packages of senior management
Work performed during FY2016
• reviewing the remuneration policy, structure and packages for directors and senior management
• making recommendations to the Board regarding the directors’ fee and other allowances for FY2016 and the
remuneration packages of executive directors
• determining the remuneration packages of senior management
• making recommendations on the remuneration packages for the new directors appointed during FY2016
NWS HOLDINGS LIMITED28
Corporate Governance Report
(e) Corporate Social Responsibility Committee
Members
Mr Tsang Yam Pui (Chairman), Mr Hui Hon Chung, Mr Cheung Chin Cheung, Mr Cheng Chi Ming, Brian, Mr Dominic Lai,
Mr Lam Wai Hon, Patrick, Mr William Junior Guilherme Doo, Mr Lee Yiu Kwong, Alan, Mrs Oei Fung Wai Chi, Grace, Ms Lam
Yuet Wan, Elina and Ms Tang Cheung Yi
Major responsibilities
• to formulate and oversee the Group’s corporate sustainability strategy, framework and policies
• to track progress on human resources management, community investment, corporate volunteering and environmental
protection
• to oversee strategic direction and funding commitments of NWS Holdings Charities Foundation
Work performed during FY2016
• reviewing the progress of the Group’s overall corporate sustainability development, benchmarking and reporting
• reviewing the development and implementation of human resources management, community investment, corporate
volunteering and environmental protection
• revewing the funding commitments and statement of financial position of NWS Holdings Charities Foundation
In addition to the abovementioned board committees, the Corporate Governance Steering Committee and the Disclosure Committee
were set up in 2007 and 2013 respectively under the supervision of the Executive Committee to ensure that good corporate governance
practices are implemented within the Group and proper compliance procedures are followed.
The Corporate Governance Steering Committee is currently chaired by Mr Hui Hon Chung and its members comprise Mr Cheung Chin
Cheung, Mr Kwong Che Keung, Gordon and the department heads of the Company’s Finance Department, Company Secretarial
Department and GARA. This committee is responsible for identifying corporate governance standards and practices applicable to the
Company, reviewing the existing corporate governance practices of the Group and considering promotion and enhancement on the
corporate governance of the Group.
Members of the Disclosure Committee compose of all executive directors of the Company. This committee is responsible for promoting
consistent disclosure practices aiming at timely, accurate, complete and broadly disseminated disclosure of inside information about
the Group to the market in accordance with applicable laws and regulatory requirements.
Non-executive Directors
Coming from diverse business and professional backgrounds, the non-executive directors (including independent non-executive
directors) of the Company have shared their valuable experiences to the Board for promoting the best interests of the Company and its
shareholders. Except for the Executive Committee, the non-executive directors have actively participated in the board committees of
the Company and have made significant contribution of their skills and expertise to these committees. All non-executive directors are
appointed under a fixed term of three years and are also subject to retirement on a rotational basis in accordance with the bye-laws of
the Company.
During the year, the Company has complied with Rules 3.10(1) and 3.10(2) of the Listing Rules regarding the appointment of at least
three independent non-executive directors and having at least one independent non-executive director with appropriate professional
qualifications or accounting or relating financial management expertise. During FY2016, Mr Wilfried Ernst Kaffenberger retired as an
independent non-executive director of the Company with effect from the conclusion of the 2015 AGM. Following his retirement, the
number of independent non-executive directors of the Company fell below the requirement under Rule 3.10A of the Listing Rules which
requires the Company to appoint independent non-executive directors representing at least one-third of the Board. Upon the appointment
of Mrs Oei Fung Wai Chi, Grace as an independent non-executive director of the Company on 1 January 2016, the Company has
re-complied with the requirement under Rule 3.10A of the Listing Rules. A written confirmation was received by the Company under
Rule 3.13 of the Listing Rules from each of the independent non-executive directors in relation to his/her independence to the Company.
The Company considers all its independent non-executive directors to be independent.
ANNUAL REPORT 2016 29

Corporate Governance Report
Mr Kwong Che Keung, Gordon, Dr Cheng Wai Chee, Christopher and Mr Shek Lai Him, Abraham, all being independent non-executive
directors of the Company, have served the Board for more than nine years. Notwithstanding their long term service, given their extensive
business experience and not connected with any director or substantial shareholder of the Company, the Board is of the opinion that
they continue to bring independent and objective perspectives to the Company’s affairs.
Remuneration of Directors
Each director will be entitled to a director’s fee which is determined by the Board with authorization granted by the shareholders at
the Company’s annual general meetings. The Company’s Human Resources Department assists the Remuneration Committee by
providing relevant remuneration data and market conditions for the Remuneration Committee’s consideration. The remuneration of
executive directors and senior management of the Company is determined with reference to the Group’s performance and profitability,
as well as remuneration benchmarks in the industry and the prevailing market conditions. Remuneration is performance-based and
coupled with an incentive system is competitive to attract and retain talented employees.
The emoluments paid to each director for FY2016 are shown in note 14 to the financial statements on pages 140 to 142 of this annual
report.
Nomination, Appointment and Re-election of Directors
Formal nomination procedures were adopted by the Board for governing the nomination and re-election of directors. Any nomination of
director will be reviewed and discussed by the Nomination Committee for his/her suitability on the basis of qualifications, experience and
background. Suitable candidate will be recommended by the Nomination Committee to the Board for consideration of the appointment.
During FY2016, the Nomination Committee considered the appointment of Mrs Oei Fung Wai Chi, Grace as an independent non-
executive director of the Company and made recommendation to the Board for consideration. Her appointment was approved by the
Board and took effect on 1 January 2016.
Pursuant to the bye-laws of the Company, all directors appointed to fill a casual vacancy or as an addition to the existing Board shall
hold office only until the next general meeting of the Company and shall then be eligible for re-election at that meeting. Accordingly,
Mrs Oei Fung Wai Chi, Grace will retire at the forthcoming annual general meeting and being eligible, will offer herself for re-election.
In addition, one-third of the directors that have served longest on the Board must retire, thus becoming eligible for re-election at each
annual general meeting. Each director is subject to retirement by rotation at least once every three years. Any further re-appointment
of an independent non-executive director, who has served the Board for more than nine years, will be subject to separate resolution to
be approved by the shareholders. Mr Tsang Yam Pui, Mr To Hin Tsun, Gerald, Mr Dominic Lai, Mr Kwong Che Keung, Gordon and
Mr Shek Lai Him, Abraham will retire by rotation at the forthcoming annual general meeting in accordance with the bye-laws of the
Company. The retiring directors, being eligible, will offer themselves for re-election at the forthcoming annual general meeting.
None of the directors of the Company has a service contract which is not determinable by the Company within one year without
payment of compensation (other than statutory compensation).
Board Diversity
The Board adopted the “Board Diversity Policy” in June 2013 setting out the approach to diversity on the Board. As set out in this
policy, a truly diverse board will include and make good use of differences in the skills, regional and industrial experience, background,
race, gender and other qualities of members of the Board. These differences will be taken into account in determining the optimum
composition of the Board.
The “Board Diversity Policy” also states that the Nomination Committee is responsible for setting annually measurable objectives for
implementing diversity on the Board and recommends them to the Board for adoption. The “Board Diversity Policy” has been reviewed
by the Nomination Committee during FY2016 for ensuring its effectiveness. During FY2016, the Board has achieved remarkable
progress on its board diversity by the appointments of Mr Hui Hon Chung and Mrs Oei Fung Wai Chi, Grace as directors of the
Company. Their professional experiences would enrich the Board’s expertise and Ms Fung represents the first female director being
appointed to the Board.
NWS HOLDINGS LIMITED30
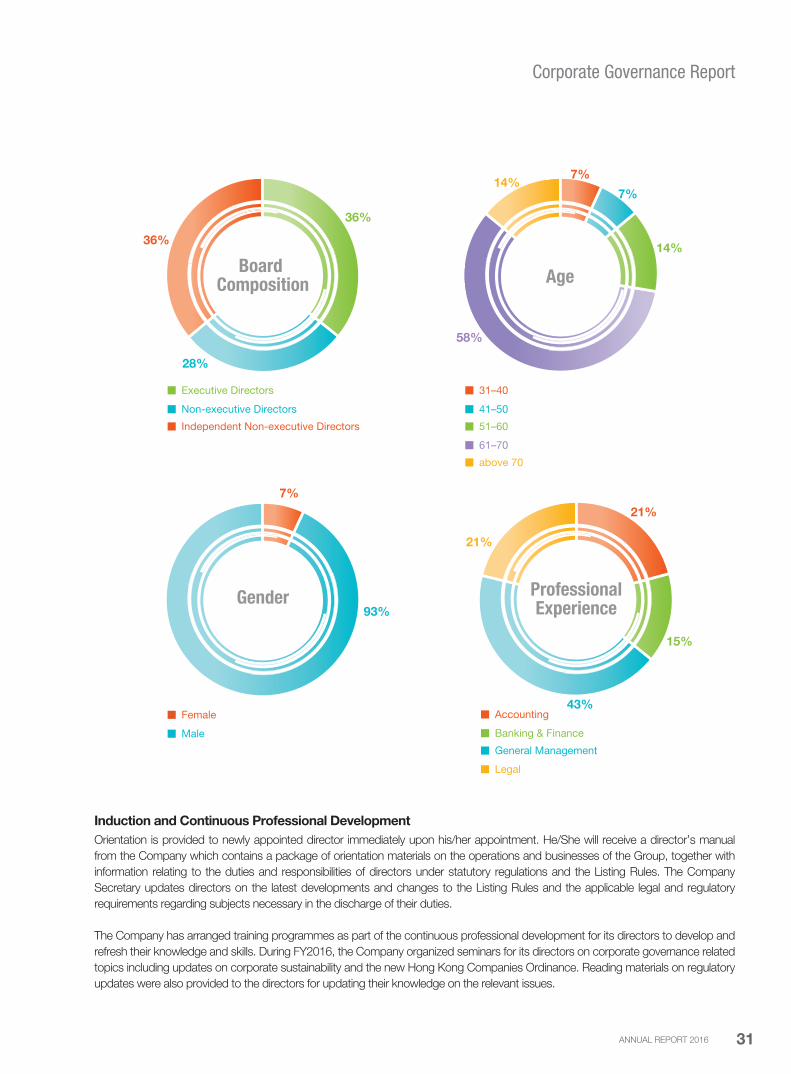
Corporate Governance Report
Induction and Continuous Professional Development
Orientation is provided to newly appointed director immediately upon his/her appointment. He/She will receive a director’s manual
from the Company which contains a package of orientation materials on the operations and businesses of the Group, together with
information relating to the duties and responsibilities of directors under statutory regulations and the Listing Rules. The Company
Secretary updates directors on the latest developments and changes to the Listing Rules and the applicable legal and regulatory
requirements regarding subjects necessary in the discharge of their duties.
The Company has arranged training programmes as part of the continuous professional development for its directors to develop and
refresh their knowledge and skills. During FY2016, the Company organized seminars for its directors on corporate governance related
topics including updates on corporate sustainability and the new Hong Kong Companies Ordinance. Reading materials on regulatory
updates were also provided to the directors for updating their knowledge on the relevant issues.
Executive Directors
Independent Non-executive Directors
Non-executive Directors
7%
93%Gender
Female
Male
7%
21%
7%
43%
14%
15%
58%
14%
21%
Age
31–40
51–60
41–50
above 70
61–70
Accounting
General Management
Banking & Finance
Legal
ProfessionalExperience
28%
36%
36%
Board Composition
ANNUAL REPORT 2016 31
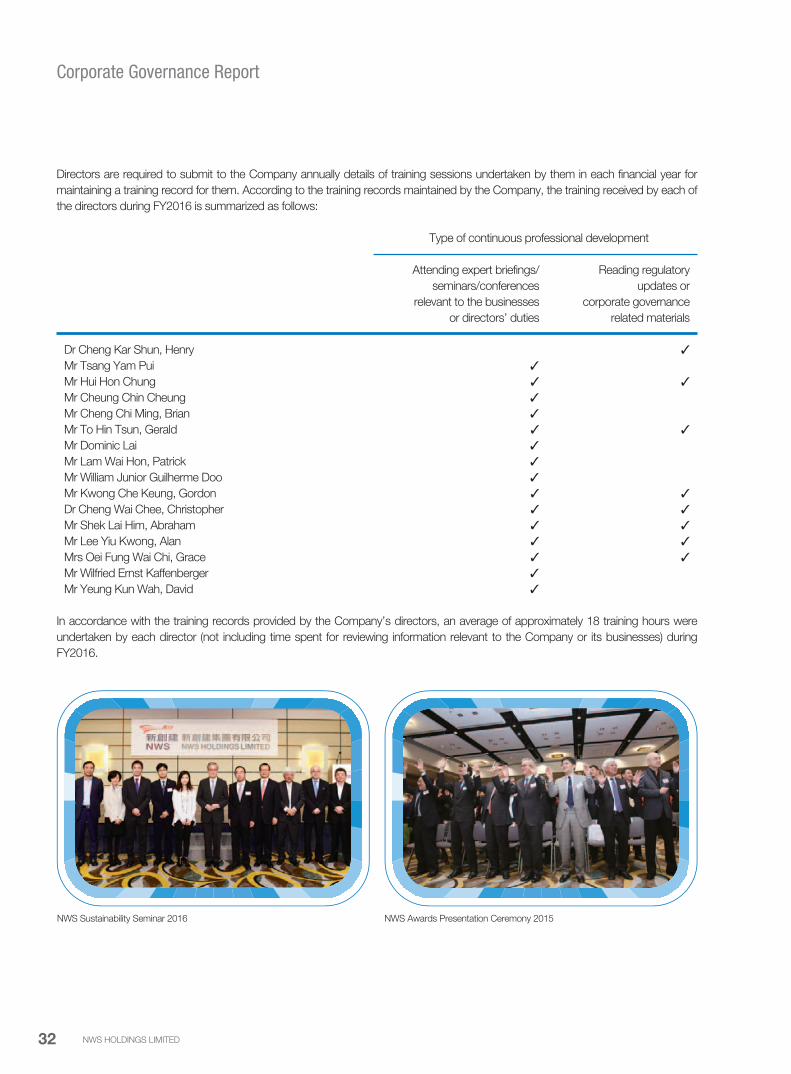
Corporate Governance Report
Directors are required to submit to the Company annually details of training sessions undertaken by them in each financial year for
maintaining a training record for them. According to the training records maintained by the Company, the training received by each of
the directors during FY2016 is summarized as follows:
Type of continuous professional development
Attending expert briefings/ Reading regulatory
seminars/conferences updates or
relevant to the businesses corporate governance
or directors’ duties related materials
Dr Cheng Kar Shun, Henry
Mr Tsang Yam Pui
Mr Hui Hon Chung
Mr Cheung Chin Cheung
Mr Cheng Chi Ming, Brian
Mr To Hin Tsun, Gerald
Mr Dominic Lai
Mr Lam Wai Hon, Patrick
Mr William Junior Guilherme Doo
Mr Kwong Che Keung, Gordon
Dr Cheng Wai Chee, Christopher
Mr Shek Lai Him, Abraham
Mr Lee Yiu Kwong, Alan
Mrs Oei Fung Wai Chi, Grace
Mr Wilfried Ernst Kaffenberger
Mr Yeung Kun Wah, David
In accordance with the training records provided by the Company’s directors, an average of approximately 18 training hours were
undertaken by each director (not including time spent for reviewing information relevant to the Company or its businesses) during
FY2016.
NWS Sustainability Seminar 2016 NWS Awards Presentation Ceremony 2015
NWS HOLDINGS LIMITED32

Corporate Governance Report
Corporate Governance Function
The Board is responsible for performing the corporate governance duties. Specific terms of reference were set out in the Corporate
Governance Manual of the Company and the relevant duties include the following:
(a) to develop and review the Company’s policies and practices on corporate governance;
(b) to review and monitor the training and continuous professional development of directors and senior management;
(c) to review and monitor the Company’s policies and practices on compliance with legal and regulatory requirements;
(d) to develop, review and monitor the code of conduct and compliance manual (if any) applicable to employees and directors; and
(e) to review the Company’s compliance with the CG Code and disclosure in the Corporate Governance Report.
The Group strives to keep staff members abreast of the latest development of corporate governance issues through education and
promotion. In FY2016, the Company organized a corporate governance related seminar for senior management of the Group, including
directors of the Company. Besides, a series of training sessions on corporate governance and internal control practices were also given
to staff members to update and improve their knowledge in these matters.
Directors’ Responsibilities for Financial Reporting and Disclosures
The Company’s directors acknowledge their responsibilities to prepare accounts for each half and full financial year which give a true and
fair view of the state of affairs of the Group. The directors consider that in preparing financial statements, the Group ensures statutory
requirements are met and applies appropriate accounting policies that are consistently adopted and makes judgements and estimates
that are reasonable and prudent in accordance with the applicable accounting standards.
The directors are responsible for taking all reasonable and necessary steps to safeguard the assets of the Group and to prevent and detect
fraud and other irregularities within the Group. They consider that the Group has adequate resources to continue in operational existence for
the foreseeable future and are not aware of material uncertainties in relation to events or conditions that may cast significant doubt upon the
Company’s ability to continue as a going concern. The Group’s financial statements have accordingly been prepared on a going concern basis.
The directors are responsible for ensuring that proper accounting records are kept so that the Group could prepare financial statements
in accordance with statutory requirements and the Group’s accounting policies. The Board is aware of the requirements under the
applicable Listing Rules and statutory regulations with regard to the timely and proper disclosure of inside information, announcements
and financial disclosures and authorizes their publication as and when required.
Securities Transactions of Directors and Relevant Employees
The Company has adopted the Model Code as its own code of conduct for securities transactions by directors. Specific enquiry was
made with all directors and it was established that they had all complied with the required standards of the Model Code during FY2016.
Securities interests in the Company and its associated corporations held by each of the directors of the Company are disclosed in the
“Report of the Directors” section of this annual report.
The Company has also adopted the “Code for Securities Transactions by Relevant Employees”, which is no less exacting than the
Model Code, for governing the securities transactions of specified employees (“Relevant Employees”) who, because of their positions,
are likely to come across unpublished inside information. Following specific enquiry by the Company, all Relevant Employees had
confirmed that they complied with the standard set out in the “Code for Securities Transactions by Relevant Employees” during FY2016.
Moreover, employees are bound by the corporate policy issued by the Company, among other things, to keep unpublished inside
information confidential and refrain from dealing in the Company’s securities if they are in possession of such inside information.
Formal notifications are sent by the Company to its directors and Relevant Employees reminding them that they should not deal in the
securities of the Company during the “black-out period” specified in the Model Code.
ANNUAL REPORT 2016 33

Corporate Governance Report
Risk Management and Internal Control
Risk management and internal control are essential parts of corporate governance. The Board is responsible for ensuring that
appropriate and effective risk management and internal control systems are established and maintained, and overseeing the systems on
an ongoing basis, while management ensures sufficient and effective operational controls over the key business processes are properly
implemented with regular reviews and updates.
The Board has put in place effective and efficient risk management and internal control systems which enable the Group to respond
appropriately to significant business, operational, financial, compliance and other risks. This includes safeguarding assets from
inappropriate use or from loss and fraud, and ensuring that liabilities are identified and managed. Furthermore, they help ensure the
quality of internal and external reporting within the Group and the compliance with applicable laws and regulations, and also internal
policies with respect to the conduct of businesses of the Group. However, the risk management and internal control systems are
designed to manage rather than eliminate the risk of failure to achieve business objectives, and can only provide reasonable but not
absolute assurance against material misstatement or loss.
The Group has in place an integrated framework of risk management and internal control which is consistent with the principles outlined
in the “Internal Control and Risk Management – A Basic Framework” issued by the Hong Kong Institute of Certified Public Accountants
as illustrated below:
Monitoring• Ongoing assessment of control systems’ performance.
• Internal audits performed by GARA.
Information and Communication• Information in sufficient detail is provided to the right person timely.
• Channels of communication across the Group and with customers, suppliers and
external parties.
• Channels of communication for people to report any suspected improprieties.
Control Activities• Policies and procedures for ensuring management directives are carried out.
• Control activities include performance review, segregation of duties, authorization,
physical count, access control, documentation and records, etc.
Risk Assessment• Identification, evaluation and assessment of the key risk factors affecting the
achievement of the Company’s objectives are performed regularly.
• Undertake proper actions to manage the risks so identified.
Control Environment• Channels to communicate the Company’s commitment to integrity and high ethical
standards to the staff are established.
• Organizational chart and limits of authority are set and communicated to staff
concerned.
• Reporting lines in accordance with organizational chart and line of authority are set.
We have the “Guidelines on Risk Management” as well as the “Guidelines on Internal Control System” which provide guidance and
procedures to subsidiaries and corporate departments of the Company for implementing risk management and internal control
practices. Under the supervision of the Audit Committee, GARA performs the internal audit function and provides assurance services
on risk management and internal control.
Effectiveness
and efficiency
of operations
Reliability of
financial
reporting
Compliance with
applicable laws
and regulations
NWS HOLDINGS LIMITED34
Corporate Governance Report
The Board, through the Audit Committee, has conducted a review on the effectiveness of the risk management and internal control
systems of the Group for FY2016 and considers these systems effective and adequate. Along with the Group’s framework of risk
management and internal control, the review covered all material controls, including financial, operational and compliance controls.
Management of all subsidiaries are required to submit to GARA the Risk Management and Internal Control Compliance Certificate
and the Risk Management and Internal Control Assessment Checklist for reporting the key risks, the effectiveness and efficiency of
operations, reliability of financial reporting, and compliance with applicable laws and regulations half-yearly. Executive directors of the
Company would also submit a written report on the effectiveness of the Group’s risk management and internal control systems to the
Audit Committee for review on a half-yearly basis.
In addition to the above, the Board also monitors the Group’s internal control through GARA. Staffed by six professionals, GARA is
responsible for reviewing the major operational, financial, compliance and risk management controls of the Group on a continuous basis.
GARA schedules its work in an annual audit plan which is reviewed by the Audit Committee annually. The audit plan is derived from
risk assessment basis and is aimed at covering each significant unit in which the Group involves in day-to-day management within a
reasonable period.
Internal audit reports are submitted to the Audit Committee regularly. Key audit findings are presented in Executive Committee meetings
and diligently followed up. Management is responsible for ensuring appropriate actions are taken to rectify any control deficiencies
highlighted in the audit reports within a reasonable period. GARA reports the status of internal audit findings to the Audit Committee on
a half-yearly basis. Besides, GARA also follows up the implementation progress of any internal control recommendations given by the
external auditor to the Group to ensure any issues noted are properly resolved within a reasonable period.
Furthermore, we have the “Whistleblowing Policy” for staff members to raise concerns, in strict confidence, about possible improprieties
in any matters related to the Group. Reported cases will be investigated by GARA in a confidential and timely manner and the
investigation report will be submitted to the Executive Committee, the Audit Committee and the Corporate Governance Steering
Committee.
In FY2016, GARA assessed the Group’s risks in actual and potential legal cases by reviewing the legal case registers of business units
and submitted reports to the Executive Committee on a regular basis.
The Company has adopted the “Disclosure Policy for Inside Information” and established the Disclosure Committee, under the
authority delegated by the Executive Committee, to promote consistent disclosure practices. Various internal control measures such
as management review, use of project codes and document filing in a register are instituted in the reporting procedures. Furthermore,
GARA conducts a review on the compliance of the policy and reports the results to the Audit Committee annually.
Effective risk management facilitates the Group’s business development and operation by setting the appropriate risk appetite,
maintaining an optimal risk level and most importantly, managing the risks proactively. The Board, through the Audit Committee,
oversees the risk management function of the Group. The Group’s risk management system and key risks can be found in the “Risk
Management” section on pages 41 to 45 of this Annual Report.
External Auditor
The Audit Committee is responsible for considering the appointment, re-appointment and removal of external auditor subject
to endorsement by the Board and final approval and authorization by the shareholders of the Company in general meetings.
PricewaterhouseCoopers, who was first appointed in 2000 and is also the Group’s principal auditor, is the existing auditor of the
Company. PricewaterhouseCoopers adopts a policy of rotating the engagement partner servicing their client companies regularly and
the last rotation took place during the year ended 30 June 2016. The reporting responsibilities of PricewaterhouseCoopers are stated
in the Independent Auditor’s Report on page 91 of this annual report.
ANNUAL REPORT 2016 35
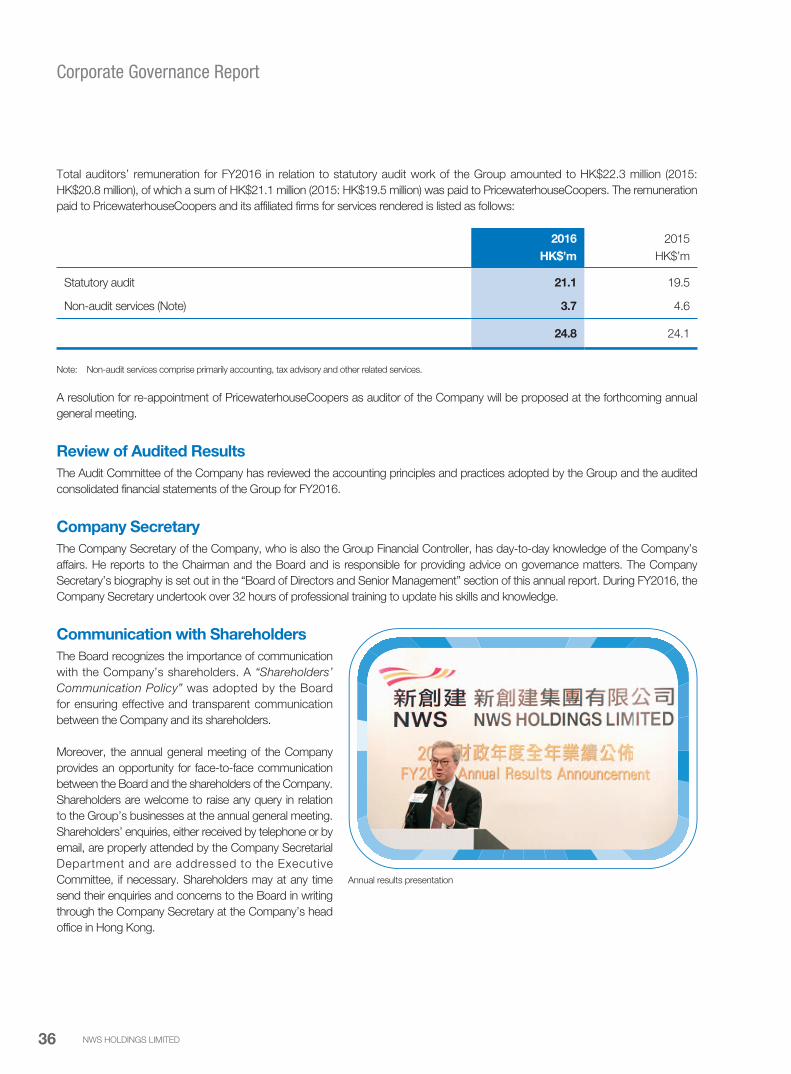
Corporate Governance Report
Total auditors’ remuneration for FY2016 in relation to statutory audit work of the Group amounted to HK$22.3 million (2015:
HK$20.8 million), of which a sum of HK$21.1 million (2015: HK$19.5 million) was paid to PricewaterhouseCoopers. The remuneration
paid to PricewaterhouseCoopers and its affiliated firms for services rendered is listed as follows:
2016 2015
HK$’m HK$’m
Statutory audit 21.1 19.5
Non-audit services (Note) 3.7 4.6
24.8 24.1
Note: Non-audit services comprise primarily accounting, tax advisory and other related services.
A resolution for re-appointment of PricewaterhouseCoopers as auditor of the Company will be proposed at the forthcoming annual
general meeting.
Review of Audited Results
The Audit Committee of the Company has reviewed the accounting principles and practices adopted by the Group and the audited
consolidated financial statements of the Group for FY2016.
Company Secretary
The Company Secretary of the Company, who is also the Group Financial Controller, has day-to-day knowledge of the Company’s
affairs. He reports to the Chairman and the Board and is responsible for providing advice on governance matters. The Company
Secretary’s biography is set out in the “Board of Directors and Senior Management” section of this annual report. During FY2016, the
Company Secretary undertook over 32 hours of professional training to update his skills and knowledge.
Communication with Shareholders
The Board recognizes the importance of communication
with the Company’s shareholders. A “Shareholders’
Communication Policy” was adopted by the Board
for ensuring effective and transparent communication
between the Company and its shareholders.
Moreover, the annual general meeting of the Company
provides an opportunity for face-to-face communication
between the Board and the shareholders of the Company.
Shareholders are welcome to raise any query in relation
to the Group’s businesses at the annual general meeting.
Shareholders’ enquiries, either received by telephone or by
email, are properly attended by the Company Secretarial
Department and are addressed to the Executive
Committee, if necessary. Shareholders may at any time
send their enquiries and concerns to the Board in writing
through the Company Secretary at the Company’s head
office in Hong Kong.
Annual results presentation
NWS HOLDINGS LIMITED36

Corporate Governance Report
Set out below is certain useful information for reference by the Company’s shareholders:
Analysis of Shareholding Structure (as at 30 June 2016)
Approximate
percentage to
the total number
Category Number of shares of issued shares
NWD and its subsidiaries 2,349,647,884 61.32%
Chow Tai Fook Enterprises Limited 97,034,424 2.53%
Directors (Note) 36,520,338 0.95%
Other shareholders (including individuals,
institutions, corporates and nominees) 1,348,764,194 35.20%
Total 3,831,966,840 100.00%
Note: Including their deemed interests under the Securities and Futures Ordinance.
Stock Code
659 (Listed on the Main Board of the Hong Kong Stock Exchange)
Board Lot
1,000 shares
Shareholder Services
Any matter in relation to the transfer of shares, change of name or address, or loss of share certificates or dividend cheques, registrations
and requests for annual/interim report copies should be addressed to the Company’s branch share registrar as follows:
Tricor Standard Limited
Level 22, Hopewell Centre
183 Queen’s Road East
Hong Kong
Tel: 2980 1333
Fax: 2810 8185
Dividend Policy
Subject to the financial performance of the Company, we expect to pay two dividends each financial year. Barring unforeseen special
circumstances, the Company intends to maintain a dividend payout ratio at not less than 50%.
Dividend per share (in HK$)
Financial Year Interim Final Total Payout ratio
2012 0.50 0.25 0.75 50.2%
2013 0.29 0.26 0.55 50.2%
2014 0.36 0.22 0.58 50.0%
2015 0.27 0.33 0.60 50.5%
2016 0.31 0.34 0.65 50.5%
ANNUAL REPORT 2016 37
Corporate Governance Report
Financial Calendar
Announcement of FY2016 final results 20 September 2016
For determining eligibility to attend and vote at the 2016 annual general meeting of the Company (“2016 AGM”):
Latest time to lodge transfer documents for registration 4:30 pm on 16 November 2016
Closure of register of members 17 to 21 November 2016
(both days inclusive)
Record date 21 November 2016
2016 AGM date 21 November 2016
For determining entitlement to the proposed final dividend:
Latest time to lodge transfer documents for registration 4:30 pm on 24 November 2016
Closure of register of members 25 November 2016
Record date 25 November 2016
Final dividend payment date on or about 29 December 2016
Company Website and Annual Report
To ensure all shareholders have equal and timely access to important company information, the Company makes extensive use of
the Company’s website to deliver up-to-date information. Latest information regarding the activities and publications of the Group
is included in the Company’s website at www.nws.com.hk in order to provide comprehensive information of the Group for the
shareholders of the Company as well as the general public. The Company’s annual report is printed in both English and Chinese and is
available on our corporate website. Shareholders may at any time change their choice of means of receiving the Company’s corporate
communications free of charge by notice in writing to the Company’s branch share registrar, Tricor Standard Limited.
Shareholders’ Rights
The Board and management shall ensure shareholders’ rights and all shareholders are treated equitably and fairly. Pursuant to the
Company’s bye-laws, any shareholder entitled to attend and vote at a general meeting of the Company is entitled to appoint another
person as his proxy to attend and vote instead of him. Shareholders who hold not less than one-tenth of the paid up capital of the
Company shall have the right, by written requisition to the Company Secretary of the Company, to require a special general meeting to
be called by the Board for the transaction of any business specified in such requisition. The procedures for shareholders to put forward
proposals at general meetings are stated as follows:
1. The written requisition must state the purposes of the meeting, and must be signed by all the shareholders concerned and may
consist of several documents in like form each signed by one or more shareholders concerned.
2. The written requisition must be deposited at the Company’s registered office in Bermuda as well as the principal place of business
in Hong Kong for the attention of the Company Secretary.
3. The written requisition will be verified with the Company’s branch share registrar and upon their confirmation that the request is
proper and in order, the Company Secretary will ask the Board to include the relevant resolution in the agenda for such general
meeting provided that the shareholders concerned have deposited a sum of money reasonably sufficient to meet the Company’s
expenses in serving the notice of the resolution and circulating the statement submitted by the shareholders concerned in
accordance with the statutory requirements to all the registered shareholders. Such general meeting shall be held within two
months after deposit of such requisition.
4. If within 21 days of such deposit, the Board fails to proceed to convene such general meeting, the shareholders concerned, or
any of them representing more than one half of the total voting rights of all of them, may themselves convene a meeting, but any
meeting so convened shall not be held after the expiration of three months from the said date.
NWS HOLDINGS LIMITED38
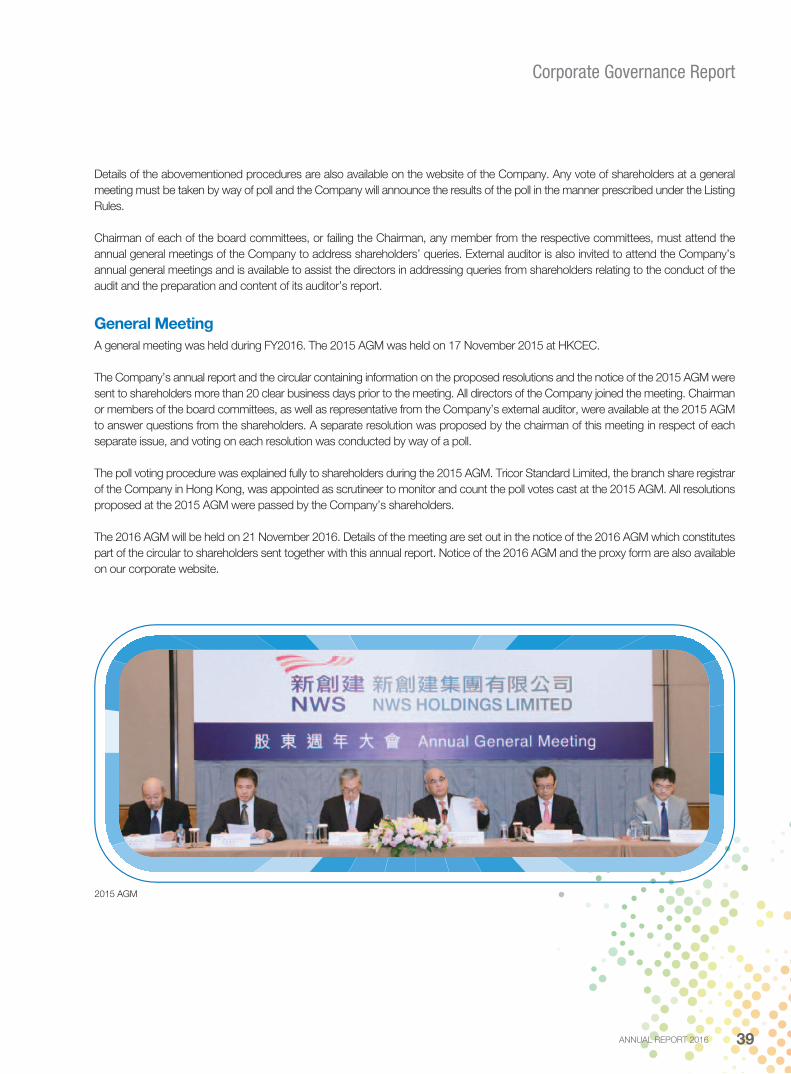
Corporate Governance Report
Details of the abovementioned procedures are also available on the website of the Company. Any vote of shareholders at a general
meeting must be taken by way of poll and the Company will announce the results of the poll in the manner prescribed under the Listing
Rules.
Chairman of each of the board committees, or failing the Chairman, any member from the respective committees, must attend the
annual general meetings of the Company to address shareholders’ queries. External auditor is also invited to attend the Company’s
annual general meetings and is available to assist the directors in addressing queries from shareholders relating to the conduct of the
audit and the preparation and content of its auditor’s report.
General Meeting
A general meeting was held during FY2016. The 2015 AGM was held on 17 November 2015 at HKCEC.
The Company’s annual report and the circular containing information on the proposed resolutions and the notice of the 2015 AGM were
sent to shareholders more than 20 clear business days prior to the meeting. All directors of the Company joined the meeting. Chairman
or members of the board committees, as well as representative from the Company’s external auditor, were available at the 2015 AGM
to answer questions from the shareholders. A separate resolution was proposed by the chairman of this meeting in respect of each
separate issue, and voting on each resolution was conducted by way of a poll.
The poll voting procedure was explained fully to shareholders during the 2015 AGM. Tricor Standard Limited, the branch share registrar
of the Company in Hong Kong, was appointed as scrutineer to monitor and count the poll votes cast at the 2015 AGM. All resolutions
proposed at the 2015 AGM were passed by the Company’s shareholders.
The 2016 AGM will be held on 21 November 2016. Details of the meeting are set out in the notice of the 2016 AGM which constitutes
part of the circular to shareholders sent together with this annual report. Notice of the 2016 AGM and the proxy form are also available
on our corporate website.
2015 AGM
ANNUAL REPORT 2016 39
Corporate Governance Report
Investor Relations
The Company is committed to upholding the highest standards of corporate governance practices and maintaining effective
communication with shareholders and the financial community. To this end, the Company maintains an open-dialogue with investors
and analysts to ensure transparent, timely and accurate dissemination of information including operating performance and strategic
business developments.
The investor relations team of the Company, comprising executive directors and senior management, meets existing and potential
shareholders, research analysts and investment managers on a regular basis. During FY2016, the team participated in over 90 investor
meetings in Hong Kong and overseas cities including London, San Francisco, Los Angeles, Singapore and Beijing.
To promote direct interaction between analysts and the management team, an analyst briefing session is held as soon as practicable
following results announcement. The positive recommendations from reputable financial research institutions including Citigroup,
Goldman Sachs and Nomura International during FY2016 bear testimony to the Company’s devotion in fostering transparency and
accountability.
To ensure fair and equal access to material information, the Company utilizes multiple communication channels such as results
announcements and presentations, press releases, annual and interim reports, corporate website and e-news notifications, to reach
out to individual shareholders and stakeholders within the investment community.
Constitutional Documents
The Company has not made any change to its constitutional documents during FY2016. A consolidated version of the Company’s
constitutional documents is available on the website of each of the Hong Kong Stock Exchange and the Company.
NWS HOLDINGS LIMITED40

Risk Management
Risk management is an essential part of corporate governance. Effective risk management facilitates the Group’s business development
and operation by setting the appropriate risk appetite, maintaining an optimal risk level and most importantly, proactively managing risks.
The Board has the overall responsibility for evaluating and determining the nature and extent of the risks that the Group is willing to take
in achieving its strategic objectives, and ensuring that the Group establishes and maintains appropriate and effective risk management
system. The Audit Committee supports the Board in monitoring the Group’s risk exposures, the design and operating effectiveness of
the underlying risk management system.
Risk Strategy
Risk Assurance
Risk Management Process
RiskGovernance
Risk Appetite
Risk Reporting Structures, Roles and Responsibilities
Early risk flagging
mechanismTraining Whistleblowing
Regular key risk reporting mechanism
Internal audit
Establish the context1
Identify risks2
Analyze risks3
Evaluate risks4
Treat risks5
Communicate & consult
7
Monitor & review
6
ANNUAL REPORT 2016 41
Risk Management
Risk Management Approach
NWS Holdings adopts both top-down and bottom-up approaches in relation to risk management. It involves collating and appraising
bottom-up inputs from risk owners of all NWS Holdings corporate departments and business units of the Group, with refinements and
adjustments through top-down inputs from the Board in an iterative manner.
It is the responsibility of all management staff to uphold the Group’s risk management function by ensuring that all staff members and
business units comply with the risk management practices embedded into our daily operations. The risk owners and risk oversight
parties are clearly defined across the Group. They are required to identify, analyze and evaluate the risks facing their businesses with
proper management execution to avoid, reduce or transfer those risks accordingly.
We have the “Guidelines on Risk Management” for enhancing the effective implementation of the risk management exercises within
the Group. To ensure a smooth implementation of such Guidelines, staff members from GARA are assigned to assist and advise the
Group’s management on the risk management exercises.
To ensure that all major risks are properly identified, evaluated and monitored for achieving a sound and effective risk management
system, risk owners across the Group are required to report the risk review exercises half-yearly. They need to report the effectiveness
of the risk management system and set out details of the key risks including the risk description, change of risk level, current risk level
and the corresponding key risk control/mitigation action in a key risks reporting table (“Key Risks Reporting Table”) as set out in the Risk
Management and Internal Control Assessment Checklist and report them to the risk oversight parties half-yearly.
Overall business risks for the Group are also reviewed and assessed regularly. Executive directors of the Company would also submit
a written report on the effectiveness of the Group’s risk management system together with the Group’s Key Risks Reporting Table to
the Audit Committee for review on a half-yearly basis.
Besides, an early risk flagging mechanism is established which enables the Group to proactively identify and assess emerging risks and
broad areas of changes, emanating from both internal and external factors, and act on them in a timely manner. Risk owners have to flag
and report immediately to the corresponding risk oversight parties when a potential risk is perceived and significant impact is expected
in any business areas.
The Board has put in place an effective risk management system which will enable the Group to respond appropriately to significant
business, operational, financial, compliance and other risks in achieving its objectives.
Risk Factors
The Group’s businesses, financial condition, results of operations and growth prospects may be affected by risks and uncertainties
directly or indirectly pertaining to the Group’s businesses. The risk factors set out below are those that could result in the Group’s
businesses, financial condition, results of operations or growth prospects differing materially from expected or historical results. Such
factors are by no means exhaustive or comprehensive, and there may be other risks in addition to those shown below which are not
known to the Group or which may not be material now but could turn out to be material in the future.
Global economy
The Group is exposed to the development of the global economy as well as the industries and geographical markets in which it operates.
As a result, the Group’s financial condition and results of operations may be influenced by the general state of the global economy or
the general state of a specific market or economy. Any significant decrease in the level of economic growth in the global or regional or
a specific economy could adversely affect the Group’s financial condition or results of operations.
Currency fluctuations
The results of the Group are presented in Hong Kong dollars, but its various subsidiaries, joint ventures and associated companies may
receive turnover and incur expenses in other currencies. Any currency fluctuations on translation of the accounts of these subsidiaries,
associated companies and joint ventures and also on the repatriation of earnings, equity investments and loans may have an impact
on the Group’s businesses. The Group operates mainly in Hong Kong and Mainland China and is therefore exposed to Renminbi
fluctuations with a portion of underlying transactions, assets, investments and cash denominated in Renminbi.
NWS HOLDINGS LIMITED42

Risk Management
Exchange rates of Hong Kong dollar against Renminbi or other foreign currencies are affected by, among other things, changes in the
political and economic environment of the issuing jurisdictions of the currencies. The exchange rates of Renminbi against Hong Kong
dollar, United States dollar or other currencies may be re-valued, and may be permitted to enter a full or limited free float. Such situation
may result in appreciation or depreciation in Renminbi against Hong Kong dollar, United States dollar or other foreign currencies.
Continual fluctuations in the exchange rates of Hong Kong dollar against Renminbi or other currencies may materially and adversely
affect the Group’s businesses, financial condition, results of operations and growth prospects.
Interest rate fluctuations
The Group’s finance costs and interest expenses fluctuate with changes in interest rates. The Group is exposed to interest rate risk
through the impact of rate changes on interest bearing assets and liabilities. The Group may be affected by changes in the prevailing
interest rate of the global credit market. Any increase in interest rate in connection with the currencies the Group borrows will increase
the Group’s finance costs and may adversely and materially affect the Group’s businesses, financial condition, results of operations and
growth prospects.
Changes in government policies and legislations, social and political stability
Clear government policies and legislations with stable social and political environment lay a good foundation for the success of the
Group’s businesses and smooth operation. Any changes in the government policies and legislations such as tax regulations, franchising
and licensing requirements may adversely and materially affect the Group’s financial condition and results of operations. There can be
no assurance that the future social and political conditions are no less favourable than the prevailing environment.
Concession, franchise and license risks
The Group operates and manages certain concession and franchise businesses such as providing facilities management services at the
Hong Kong Convention and Exhibition Centre (“HKCEC”), operating public bus and ferry transportation services and operating duty free
tobacco and alcohol retail business at certain Hong Kong and Macau borders. The Group also has roads, energy and water projects
operating under concessions in Hong Kong, Mainland China and Macau. There can be no assurance that the concession, franchise
and license agreements can be renewed or if renewed, that the terms of such concession, franchise and license agreements will not
be less favourable than those currently obtained by the Group.
Tariff and service fee determination
Tariffs and fees charged by the Group’s projects with respect to its toll roads, water supplied/treated by water plants, electricity
produced by its power plants and aeronautical service provided by its airport are set by various relevant government authorities,
although the Group can propose rate changes in conjunction with its joint venture partners. Factors that these government authorities
take into account when considering rate changes may include construction costs, prospective recovery period of investment, loan
repayment terms, inflation rate, operating and maintenance costs, affordability and usage. Reductions in or cessation of tariffs and fees
charged by the Group’s projects may adversely affect the Group’s operating results.
Environmental concerns
The Group is subject to extensive and increasingly stringent environmental protection laws, regulations and decrees that impose fines
for violation of them. In addition, there is a growing global awareness of environmental issues. The Group may sometimes be expected
to meet a standard which is more stringent than the requirement of the prevailing environmental laws and regulations, which may cause
negative impacts on the costs and operations of its projects.
Though the Group has adopted various environmental protection measures, the Group cannot assure that more stringent
environmental protection regulations will not be imposed in the future. If the Group fails to comply with the prevailing environmental laws
or regulations, or fails to meet public expectations in relation to environmental matters, the Group’s reputation may be damaged or may
be required to pay fines or take remedial actions, in which case suspension of operation may be required in the Group’s related projects.
ANNUAL REPORT 2016 43
Risk Management
Major Risk Factors on Different Business Segments
Infrastructure Division
Roads
The Group invests in and operates a wide range of roads and related projects in Mainland China and Hong Kong. The operational
risk of toll roads is generally low as long as an effective internal control system in toll collection is properly established and periodic
maintenance is appropriately carried out. However, revenue from the Group’s toll roads is principally dependent upon the number and
types of vehicles using such roads and their applicable toll regimes. The review on toll rates of all toll roads in Mainland China and the
implementation of new policies by the Mainland China government, such as toll free access by certain types of vehicles during major
holidays and toll rate standardization, may cast uncertainty on the Group’s roads business and operating results. Traffic volume is
directly and indirectly affected by a number of factors, including the availability, quality, proximity and toll rate differentials of alternative
roads, the existence of new competing roads and other means of transportation, fuel prices, taxation, environmental regulations
and suspension of operation due to material accidents. The Group’s operating results may also be affected by capital expenditure
requirements for the ongoing repair, maintenance, renewal and expansion of the toll roads.
Environment
The operation of the Group’s power plants in Mainland China is complex and may be adversely affected by many factors, such as the
downtime caused by system upgrades and overhaul works, the breakdown of equipment or disruption of production processes, plant
underperformance or low efficiency, labour disputes, natural disasters, insufficient or poor quality fuel, reduced demand for electricity,
the setting of on-grid tariffs and the need to comply with the directions of the relevant government authorities or utilities. Fluctuations in
fuel and finance costs, changes in regulatory regimes, disruptions in fuel supply or shortage of transportation resources may adversely
affect the profit and normal operation of the power plants which in turn may impact on the Group’s business and financial condition.
The Group’s water and related projects are subject to environmental regulations and are exposed to environmental risks, such as water
supplies being polluted by naturally occurring compounds or man-made sources. The types and amounts of pollutants in the water
supplied or waste water treated by the Group may increase unexpectedly due to a number of factors, including the occurrence of natural
disasters, industrial accidents or increase in levels of manufacturing activities.
Logistics
The operation of the Group’s logistics facilities in Mainland China and Hong Kong may be adversely affected by many factors, such as
the breakdown of shore cranes, forklifts and other equipment, labour disputes, inclement weather, natural disasters, stricter government
regulations, the lack of adjoining land for expansion, the lack of qualified equipment operators and the overall performance of the logistics
and transportation sectors.
In addition, the terminals outsource various internal operations and trucking services to contractors. The failure or inefficient operations
of such contractors could disrupt the terminals operation. Cargo handling charges, logistics services fees and rental rates may be
adversely affected by many factors, such as increase in warehouse supply, availability of alternative terminals and slowdown in domestic
and international trade.
Aviation
The Group’s commercial aircraft leasing business depends heavily on the willingness and/or ability of our airline customers to enter into
new aircraft operating leases and to honour their payment and other obligations under their existing or future leases. The business may
be adversely affected by factors such as downturn or disruptions in the aviation industry, global economic and financial markets and
geographical issues.
Aircraft movements and passenger volume handled by the Group’s airport project may be adversely affected by many factors, such
as downturn in the domestic and global economies, airspace constraints for civil aviation, inclement weather, increase in airfares,
competition from other airports and alternative modes of transport and changes in regulations. Concessions and other non-aeronautical
income may be adversely affected by many factors, such as changes in passengers’ consumption ability and preference, failure to
renew concession contracts and competition from other new airports.
NWS HOLDINGS LIMITED44
Risk Management
Services Division
Facilities Management
The Group’s facilities management of HKCEC may be adversely affected by factors such as limited expansion capacity, fierce
competition from other exhibition venues, continuous increase in operating costs, inadequate supply of skilled labour, economic
downturn and potential political sensitivities associated with HKCEC being a government owned Hong Kong icon. HKCEC generally
has a high occupancy rate, however, it is located at the heart of the city with limited land supply, the increase in physical capacity is
restricted. HKCEC has also been affected by the rapid emergence of competing exhibition centres across Hong Kong, Mainland China,
Macau and other south-east Asian countries. Being an icon of Hong Kong, HKCEC has from time to time come under pressure from
a variety of media and social-political groups in Hong Kong which may impact on its attractiveness both commercially and socially.
The Group’s duty free business has been and continues to be affected by changes in government policy relating to domestic and cross-
border duties on tobacco, wine and alcohol. Furthermore, as a significant portion of the revenue of the Group’s duty free business is
dependent upon tourists and travellers, any changes in travel policies may cause uneven fluctuations in the Group’s revenue.
Construction & Transport
Factors such as general economic conditions, political and social stability, government investment plans, mortgage and interest
rates, inflation, demographic trends, consumer confidence, competition among competitors and subcontractors, supply of suitably
skilled labour and workforce in Hong Kong, and material safety incidents may influence the performance and growth of the Group’s
construction business. An economic downturn and a downturn in any of the industries the Group serves in its construction business
will generally lead to a decrease in the number of new construction projects available to the Group as well as delays in or cancellation
of the Group’s ongoing projects, which will in turn adversely affect the Group’s financial condition and operating results.
The Group’s transport business could be affected by fluctuations in fuel costs, elasticity of fares, competition from other means of
transport, increasing difficulty in route development, labour shortage, adverse impacts from labour unions and strikes, serious traffic
accidents as well as bad weather and natural disasters. Fluctuation in fuel price, which is a major cost component, will have a direct
impact on the Group’s transport business. Given the Hong Kong population’s heavy reliance upon public transport, any fare increase
proposals by the Group to offset rising overheads and costs would undoubtedly meet with strong public objection and negative
publicity.
Strategic Investments
From time to time, the Group invests in the stock and capital markets through investments in shares, private equity and pre-IPO
financing of companies in a variety of businesses and industries including, to date, (i) share registration and company secretarial services;
(ii) corporate finance, asset management and brokerage services; (iii) iron ore mining, platinum group metals and chrome mining,
processing and trading; and (iv) hydraulic loading and unloading systems, amongst others. Such investments are affected by factors
particular to the specific industries as well as external and global factors, including but not limited to the performance of various global
financial markets which are generally subject to economic conditions, investment sentiment and fluctuations in interest rates, which are
beyond the Group’s control.
ANNUAL REPORT 2016 45
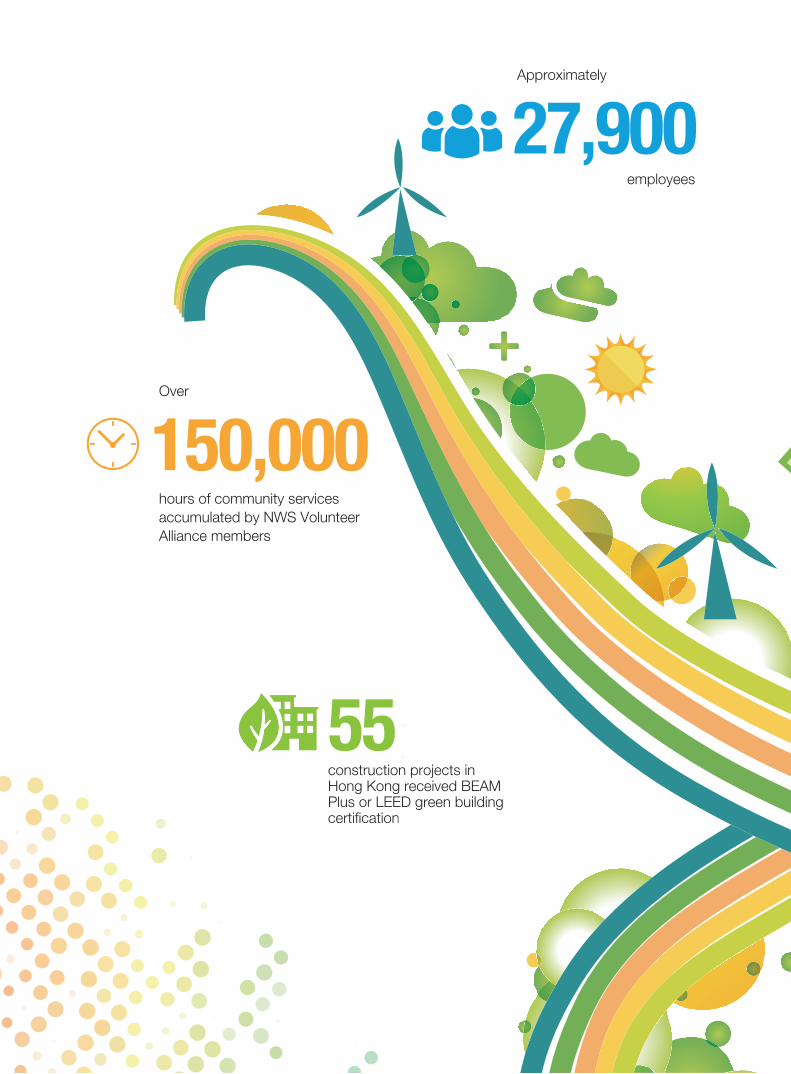
150,000hours of community services
accumulated by NWS Volunteer
Alliance members
Over
27,900employees
construction projects in Hong Kong received BEAM Plus or LEED green building certification
55
50,000urs of community services
cumulated by NWS Volunteer
iance members
construction projects intHong Kong received BEAMKPlus or LEED green building scertificationce
55
15ou
acc
Alli
er
c
Approximately

SUSTAINABILITY
At NWS Holdings, corporate sustainability is an integral part
of both our long-term business strategy and daily operations.
We live in an interconnected world, where global markets,
businesses, communities and the environment are inextricably
linked. To create long-term value for the Group and its
shareholders, we must therefore ensure our business operates
in a way that promotes sustainable growth. Our multi-faceted
approach to sustainability combines management framework
and policies, operational optimization and capacity building.
We are also committed to engaging our stakeholders,
benchmarking our performance, and reporting on our
progress in a transparent and highly accountable way.
Management Framework and Policies
The Board, as the highest governance body of the Group,
takes ultimate responsibility for business sustainability and
plays a pivotal role in enhancing long-term shareholder value,
direct growth strategies, supervise executive management
and ensure that corporate governance policies and practices
are properly executed. (Please refer to the Corporate
Governance Report on page 23 to page 40 for details of the
Group’s corporate governance structure and practices.)
The Corporate Social Responsibility (“CSR”) Committee,
chaired by the Group’s Chief Executive Officer (“CEO”),
is responsible for overseeing the Group’s sustainability
strategy, framework and policies, and tracking progress on
staff engagement, community investment, volunteering and
environmental protection.
The Group’s policies reflect our vision, mission and core
values, which are fundamental to our business success.
Our “Board Diversity Policy” sets out clear objectives of
achieving an appropriate balance of skills, experience and
diversity of perspectives. In FY2016, Board diversity was
further enhanced with the appointment of Mrs Oei Fung Wai
Chi, Grace as an Independent Non-executive Director and a
member of the CSR Committee.
To monitor and manage material risks for our business, the
Group has “Guidelines on Risk Management” and “Guidelines
on Internal Control System” to ensure the effectiveness of our
risk management and internal control systems.
Sustainability
Corporate Sustainability
NWS HOLDINGS LIMITED48
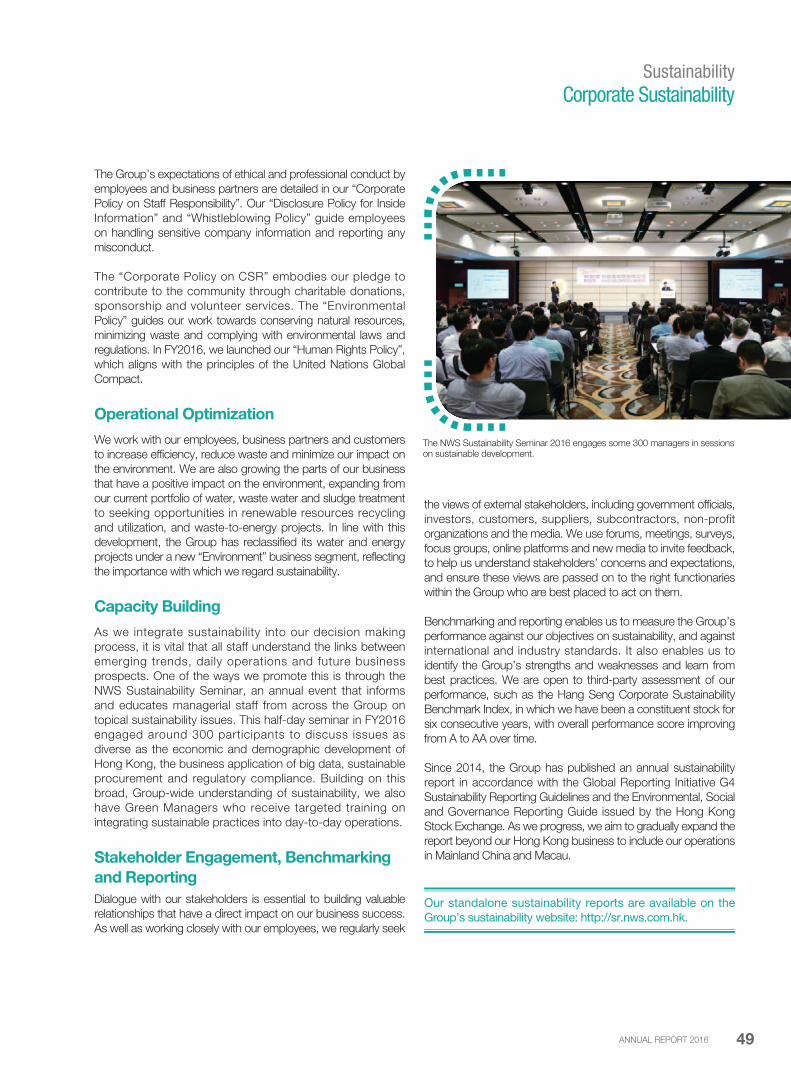
The Group’s expectations of ethical and professional conduct by
employees and business partners are detailed in our “Corporate
Policy on Staff Responsibility”. Our “Disclosure Policy for Inside
Information” and “Whistleblowing Policy” guide employees
on handling sensitive company information and reporting any
misconduct.
The “Corporate Policy on CSR” embodies our pledge to
contribute to the community through charitable donations,
sponsorship and volunteer services. The “Environmental
Policy” guides our work towards conserving natural resources,
minimizing waste and complying with environmental laws and
regulations. In FY2016, we launched our “Human Rights Policy”,
which aligns with the principles of the United Nations Global
Compact.
Operational Optimization
We work with our employees, business partners and customers
to increase efficiency, reduce waste and minimize our impact on
the environment. We are also growing the parts of our business
that have a positive impact on the environment, expanding from
our current portfolio of water, waste water and sludge treatment
to seeking opportunities in renewable resources recycling
and utilization, and waste-to-energy projects. In line with this
development, the Group has reclassified its water and energy
projects under a new “Environment” business segment, reflecting
the importance with which we regard sustainability.
Capacity Building
As we integrate sustainability into our decision making
process, it is vital that all staff understand the links between
emerging trends, daily operations and future business
prospects. One of the ways we promote this is through the
NWS Sustainability Seminar, an annual event that informs
and educates managerial staff from across the Group on
topical sustainability issues. This half-day seminar in FY2016
engaged around 300 participants to discuss issues as
diverse as the economic and demographic development of
Hong Kong, the business application of big data, sustainable
procurement and regulatory compliance. Building on this
broad, Group-wide understanding of sustainability, we also
have Green Managers who receive targeted training on
integrating sustainable practices into day-to-day operations.
Stakeholder Engagement, Benchmarking
and Reporting
Dialogue with our stakeholders is essential to building valuable
relationships that have a direct impact on our business success.
As well as working closely with our employees, we regularly seek
The NWS Sustainability Seminar 2016 engages some 300 managers in sessions on sustainable development.
Corporate SustainabilitySustainability
the views of external stakeholders, including government officials,
investors, customers, suppliers, subcontractors, non-profit
organizations and the media. We use forums, meetings, surveys,
focus groups, online platforms and new media to invite feedback,
to help us understand stakeholders’ concerns and expectations,
and ensure these views are passed on to the right functionaries
within the Group who are best placed to act on them.
Benchmarking and reporting enables us to measure the Group’s
performance against our objectives on sustainability, and against
international and industry standards. It also enables us to
identify the Group’s strengths and weaknesses and learn from
best practices. We are open to third-party assessment of our
performance, such as the Hang Seng Corporate Sustainability
Benchmark Index, in which we have been a constituent stock for
six consecutive years, with overall performance score improving
from A to AA over time.
Since 2014, the Group has published an annual sustainability
report in accordance with the Global Reporting Initiative G4
Sustainability Reporting Guidelines and the Environmental, Social
and Governance Reporting Guide issued by the Hong Kong
Stock Exchange. As we progress, we aim to gradually expand the
report beyond our Hong Kong business to include our operations
in Mainland China and Macau.
Our standalone sustainability reports are available on the
Group’s sustainability website: http://sr.nws.com.hk.
ANNUAL REPORT 2016 49

Sustainability
Human Capital
We are proud to be an employer of choice and strive to reinforce this position. We provide a stimulating,
inclusive and safe work environment for our 27,900-strong workforce, and offer competitive
remuneration and benefits. We also provide training and career development to unlock staff potential.
As an equal opportunity employer, we treat and remunerate our employees fairly, regardless of
their age, gender, ethnicity or other aspects of diversity. As a group, we value communication
and team spirit, and make continuous efforts to promote dialogue, teamwork and a healthy
work-life balance.
NWS Adventure Day 2015 at Hong Kong Disneyland attracts a record-breaking turnout of over 8,000 staff and their family members.
Building Capabilities
In today’s competitive labour market, it is essential to attract
and retain talented people, and to equip employees with the
capabilities to support business development. The Group has
a comprehensive career advancement plan and well-rounded
training programmes to grow the capabilities of our employees,
and ensure each employee has the skills and know-how
necessary to deliver quality results in an efficient and effective
manner. Department heads and supervisors act as mentors, and
training workshops, courses, seminars and external visits are
provided to meet the specific needs of each staff member. To
promote life-long learning, for example, we offer study leave, and
have doubled the annual training subsidy for Corporate Office staff
from HK$5,000 to HK$10,000 each.
Approximately
170,000hours of training clocked up by our employees in Hong Kong
in FY2016
Nurturing Team Spirit
Professional and social events promote communication and
cohesion across departments, business units and levels of
seniority throughout the Group. These activities include the
popular Staff and Family Movie Day, Corporate Team-building
Programme, staff outings, leisure activities and cocktail parties
for new hires and promoted staff. In FY2016, we developed
a new management-employee communication platform, the
Executive Director Luncheon. Hosted by the Group’s CEO or
Executive Directors, this monthly lunch gathering facilitates candid
exchanges between management and staff members in Hong
Kong.
Marine Officer Trainee ProgrammeMore than 65% of the operational workforce at New World
First Ferry Services Limited (“NWFF”) is over 50 years of
age. That gives us a great wealth of experience, but it is also
crucial that we attract and train new recruits to build a pipeline
for succession. In 2015, NWFF launched the First Ferry
Marine Officer Trainee Programme, a six-year development
programme that leads to participants becoming certified Grade
1 coxswains or operation supervisors.
NWS HOLDINGS LIMITED50

Value ChainSustainability
Our business serves as a nexus between the business partners, suppliers and customers that shape
the products and services we offer. As we have a crucial leadership role in managing environmental and
social risks that could arise in our supply chain, we can exert a positive influence on those individuals and
organizations we work with regarding sustainability. Wherever possible, the Group selects local suppliers so
as to support the local economy and create jobs for local people.
Interactive dialogue between Hip Hing’s top management and frontline workers helps boost safety awareness.
We require our suppliers and contractors to meet the ethical,
social and environmental requirements stipulated in the “Supplier
Code of Conduct” developed by our parent company, NWD.
In our construction businesses, for instance, where the risk of
environmental and social impacts is relatively high by business
nature, Hip Hing Construction Company Limited (“Hip Hing”),
Vibro (H.K.) Limited and New World Construction Company
Limited screen suppliers and contractors based on their
performance in quality management, environmental and energy
management, safety management and community investment.
Ensuring Customer Safety
Customer safety is paramount, and is particularly important in
our transport business. In our bus operations, we make safety
facilities a top priority in our bus procurement exercises and daily
operations. In response to safety incidents with sliding exit doors
in early 2016 involving another local bus operator, New World First
Bus Services Limited (“NWFB”) and Citybus Limited (“Citybus”)
asked suppliers to preinstall two additional rails to exit doors on
all new buses to provide better protection for bus passengers. All
existing buses equipped with sliding exit doors will be retrofitted
by FY2017.
15,000 jobsprovided by our construction businesses in Hong Kong (1)
Adding Value for Customers
We go beyond basic requirements to add value to our services.
In FY2016, NWFF launched the first-ever breastfeeding room
on Hong Kong public transport. The new facility aboard the Xin
Guang ferry, which mainly runs between Central and Cheung
Chau, measures about 4.6 sq m and provides a comfortable and
private space with air-conditioning, a sofa, a diaper-changing
area, a wash basin, a hand dryer and an emergency bell for
passengers in need. NWFF will extend this breastfeeding facility
to three other triple-deck ferries and complete installation within
FY2017.
Note:
(1) These include employees hired by our construction companies and construction workers hired by these companies’ subcontractors in FY2016.
“We Hear Your Voice” Safety CampaignFeedback from construction site-based staff and frontline
workers makes accident prevention more effective and
improves site safety. In its push to achieve a zero accident
rate, Hip Hing launched the “We Hear Your Voice”
programme in 2015 to leverage the first-hand experience
of subcontracted workers to improve site safety. Workers
are encouraged to identify safety risks and suggest ways
to enhance site safety through regular meetings and other
designated communication channels. Suggestions are
discussed, prioritized and implemented to augment on-going
safety efforts.
ANNUAL REPORT 2016 51

Sustainability
Community Care
We invest in the communities in which we operate through long-term programmes and the Group’s charity
arm, NWS Holdings Charities Foundation (“Charities Foundation”). Our community investment focuses on
four key areas: community welfare, education, health care and environmental protection. We also encourage
and empower our employees to make meaningful contributions to the community through volunteering.
Reaching Out to the Community
NWS Holdings established the Charities Foundation in 2006
and has since contributed approximately HK$22 million to it.
Over the years, the Charities Foundation has funded hundreds
of community projects. Among the non-profit organizations
supported in FY2016 are the Arts with the Disabled Association
Hong Kong, the Christian Family Service Centre, the Hans
Andersen Club, the Hok Yau Club, the Hong Kong Family
Welfare Society and the Hong Kong Young Women’s Christian
Association.
Since its inception in 2001, the NWS Volunteer Alliance,
comprising our staff and their family members and friends, has
been devoted to serving underprivileged groups, including the
elderly, single-parent families, at-risk youth, ex-mentally ill people
and those with intellectual disabilities. Through years of service
and training, our corporate volunteers have developed skills such
as haircutting, dancing, clown performance and handicraft, which
they have passed on to those in need. In FY2016, for example,
our corporate volunteers became tutors in the “Brightening My
Life’s Path” Men’s Club, co-organized with the Hong Kong Family
HK$4.2 millioncontributed to charitable causes through the NWS Holdings Charities Foundation in FY2016
Running for GeoconservationNWS Holdings launched the NWS Geo Hero Run in FY2016
to promote healthy living and geoconservation. Around 1,500
runners participated in the half marathon and 10-km run, which
wound through Hong Kong Global Geopark. To promote social
inclusion and give disadvantaged people a new experience,
we invited more than 100 beneficiaries from eight non-profit
organizations to join in a 2-km Super Hero Run as part of the
event. The NWS Geo Hero Run is a pillar event of the wider
NWS Hong Kong Geo Wonders Hike campaign, which also
included a full-year geoconservation training for senior high
school students, plus guided public tours and a geopark clean-
up activity.
Some 1,500 people participate in the NWS Geo Hero Run, which promotes physical health and a greater appreciation for Hong Kong’s stunning natural landscape.
Welfare Society. This one-year project was designed to help
underprivileged men in Sham Shui Po rebuild self-confidence
through social events and by acquiring new interests and skills.
NWS HOLDINGS LIMITED52
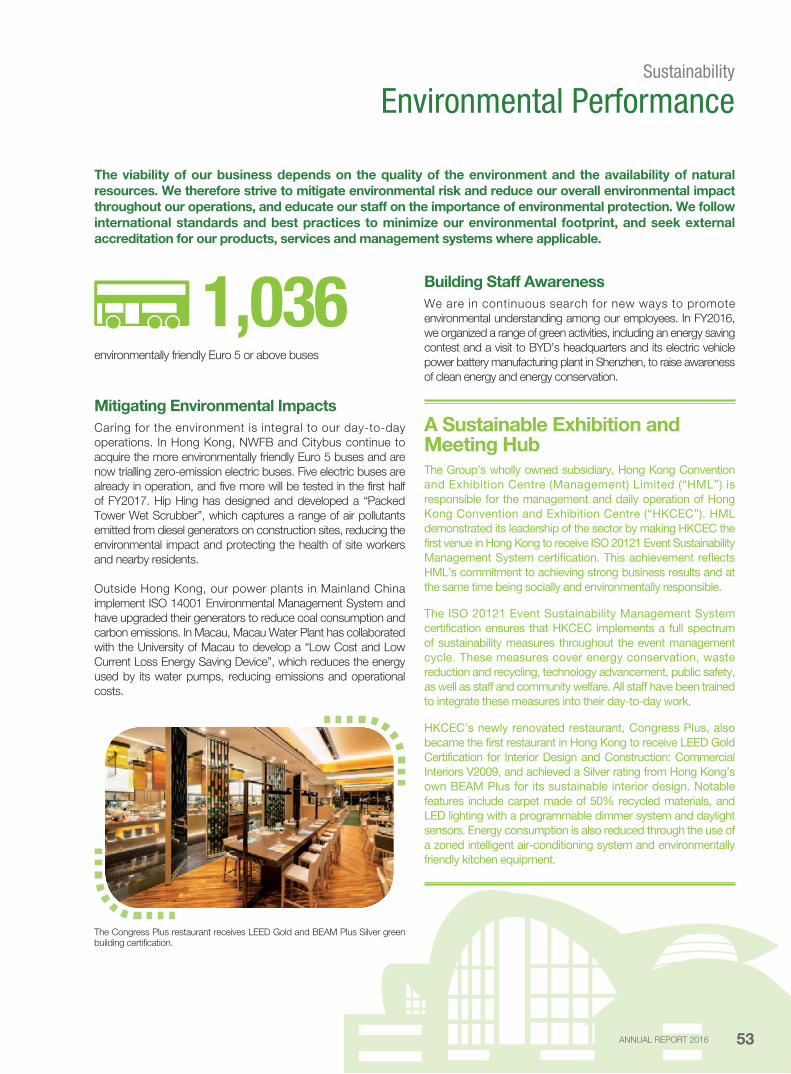
1,036environmentally friendly Euro 5 or above buses
Building Staff Awareness
We are in continuous search for new ways to promote
environmental understanding among our employees. In FY2016,
we organized a range of green activities, including an energy saving
contest and a visit to BYD’s headquarters and its electric vehicle
power battery manufacturing plant in Shenzhen, to raise awareness
of clean energy and energy conservation.
A Sustainable Exhibition and Meeting HubThe Group’s wholly owned subsidiary, Hong Kong Convention
and Exhibition Centre (Management) Limited (“HML”) is
responsible for the management and daily operation of Hong
Kong Convention and Exhibition Centre (“HKCEC”). HML
demonstrated its leadership of the sector by making HKCEC the
first venue in Hong Kong to receive ISO 20121 Event Sustainability
Management System certification. This achievement reflects
HML’s commitment to achieving strong business results and at
the same time being socially and environmentally responsible.
The ISO 20121 Event Sustainability Management System
certification ensures that HKCEC implements a full spectrum
of sustainability measures throughout the event management
cycle. These measures cover energy conservation, waste
reduction and recycling, technology advancement, public safety,
as well as staff and community welfare. All staff have been trained
to integrate these measures into their day-to-day work.
HKCEC’s newly renovated restaurant, Congress Plus, also
became the first restaurant in Hong Kong to receive LEED Gold
Certification for Interior Design and Construction: Commercial
Interiors V2009, and achieved a Silver rating from Hong Kong’s
own BEAM Plus for its sustainable interior design. Notable
features include carpet made of 50% recycled materials, and
LED lighting with a programmable dimmer system and daylight
sensors. Energy consumption is also reduced through the use of
a zoned intelligent air-conditioning system and environmentally
friendly kitchen equipment.
Environmental PerformanceSustainability
The viability of our business depends on the quality of the environment and the availability of natural
resources. We therefore strive to mitigate environmental risk and reduce our overall environmental impact
throughout our operations, and educate our staff on the importance of environmental protection. We follow
international standards and best practices to minimize our environmental footprint, and seek external
accreditation for our products, services and management systems where applicable.
Mitigating Environmental Impacts
Caring for the environment is integral to our day-to-day
operations. In Hong Kong, NWFB and Citybus continue to
acquire the more environmentally friendly Euro 5 buses and are
now trialling zero-emission electric buses. Five electric buses are
already in operation, and five more will be tested in the first half
of FY2017. Hip Hing has designed and developed a “Packed
Tower Wet Scrubber”, which captures a range of air pollutants
emitted from diesel generators on construction sites, reducing the
environmental impact and protecting the health of site workers
and nearby residents.
Outside Hong Kong, our power plants in Mainland China
implement ISO 14001 Environmental Management System and
have upgraded their generators to reduce coal consumption and
carbon emissions. In Macau, Macau Water Plant has collaborated
with the University of Macau to develop a “Low Cost and Low
Current Loss Energy Saving Device”, which reduces the energy
used by its water pumps, reducing emissions and operational
costs.
The Congress Plus restaurant receives LEED Gold and BEAM Plus Silver green building certification.
ANNUAL REPORT 2016 53
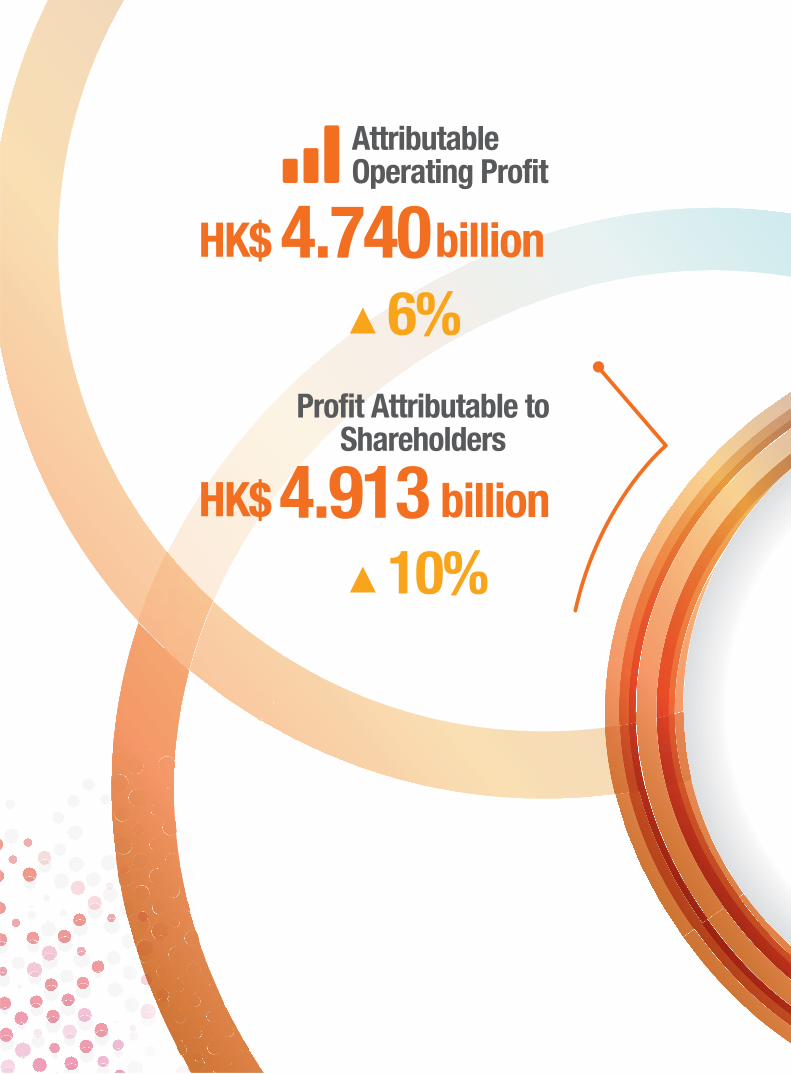
4.913 billion
10%
Profit Attributable to Shareholders
4.740billion
6%
Attributable Operating Profit
HK$
HK$

MANAGEMENTDISCUSSION AND ANALYSIS
Revenue
29.498 billionHK$
20%

Notwithstanding persistent headwinds in the external environment
and heightened financial market volatility, the stable organic
growth underpinned by a well-balanced and diversified asset
portfolio and the outstanding performance of the roads, logistics,
aviation and construction businesses enabled the Group to
sustain growth momentum as a whole. AOP of HK$4.740 billion
for FY2016 represented an increase of HK$283.0 million or 6%
growth compared to the last financial year. The Infrastructure
division achieved an AOP of HK$2.856 billion, an increase of
9% compared to the same in FY2015. The AOP of the Services
division increased by 3% to HK$1.883 billion compared to the last
financial year.
Profit attributable to shareholders rose by 10% to HK$4.913 billion.
Contribution by DivisionFor the year ended 30 June
2016 2015
HK$’m HK$’m
Infrastructure 2,856.2 2,624.9
Services 1,883.4 1,831.7
Attributable operating profit 4,739.6 4,456.6
Corporate office and non-operating items
Gain on fair value of investment properties 1,420.0 306.6
Gain on disposal of an available-for-sale financial asset 534.1 –
Gain on disposal of projects, net of tax 199.4 51.4
Net gain on deemed disposal of a project under a joint venture 179.3 –
Net gain on disposal of a project under a joint venture – 1,549.9
Gain on remeasurement of an available-for-sale financial asset retained at fair value upon reclassification from an associated company – 914.0
Share of profit from Harbour Place, a residential development project 2.0 71.9
Impairment loss of an available-for-sale financial asset (670.4) –
Impairment loss related to an associated company (200.0) –
Impairment loss related to a joint venture (177.6) (300.0)
Loss on partial disposal and impairment loss related to an associated company – (1,910.9)
Net exchange (loss)/gain (368.8) 2.1
Interest income 198.1 210.5
Finance costs (546.3) (522.0)
Expenses and others (396.6) (352.5)
173.2 21.0
Profit attributable to shareholders 4,912.8 4,477.6
During FY2016, the Group recognized fair value gains of
HK$1.4 billion on the revaluation of investment properties. A
significant portion of the fair value gain was contributed by NWS
Kwai Chung Logistics Centre as the Group entered into an
agreement to dispose of its entire interest in this property in June
2016 and the gain on disposal was recognized by means of fair
value gain. On the other hand, the Group accepted a cash offer
for its shareholding in New World China Land Limited in March
2016 and the gain on disposal of this available-for-sale financial
asset amounted to HK$534.1 million. Both disposals underlined
the Group’s strategy of unlocking the value in its investments at
an appropriate time and generating cash resources to fund its
general working capital as well as other investment projects to
further enhance shareholder value.
In addition, the Group shared a gain of HK$179.3 million on the
deemed disposal of its indirect interest in Chongqing Water Group
Co., Ltd. (“Chongqing Water Group”) as a result of the latter and
cash being injected into Derun Environment. The investment in
Derun Environment will serve as a springboard to the Group’s
entry into a wider range of environmental services in Mainland
China and overseas.
NWS HOLDINGS LIMITED56
Management Discussion and Analysis
Group Overview

The Group’s investment in Haitong International was reclassified
from an associated company to an available-for-sale financial
asset in FY2015 and a fair value gain on the remeasurement
of its value amounting to HK$914.0 million was recognized
pursuant to HKAS 39 “Financial Instruments: Recognition and
Measurement”. Thereafter, Haitong International was carried at
fair value. As a result of the drop in its share price, an impairment
loss of HK$670.4 million was recognized by the Group in FY2016.
As explained in the interim results announcement for the six
months ended 31 December 2015, the Group recognized an
impairment loss of HK$200.0 million on the carrying value of the
Group’s interest in Tharisa in view of the substantial drop in the
market price of chrome concentrates. An impairment loss of
HK$177.6 million for Hyva was also shared by the Group in light
of the current and projected slowdown in demand for hydraulic
components in Mainland China. All these impairment losses
are non-cash items and bear no impact on the cash flow and
operation of the Group.
Renminbi further weakened against Hong Kong Dollar by 6% in
FY2016. The net exchange loss of HK$368.8 million mainly arose
from the translation of the Group’s monetary assets denominated
in Renminbi into Hong Kong dollars.
In FY2015, the one-off gain of HK$1.5 billion from the disposal
of indirect interest in Companhia de Electricidade de Macau –
CEM, S.A. was fully offset by the partial disposal and impairment
losses in relation to the Group’s interest in Newton Resources
Ltd (“Newton Resources”) and the impairment loss shared by the
Group on Guangzhou Dongxin Expressway which amounted to
HK$1.9 billion and HK$0.3 billion respectively.
Contributions from the operations in Hong Kong accounted
for 55% of AOP in FY2016 as compared to 57% in FY2015.
Mainland China and Others contributed 41% and 4%
respectively, as compared to 39% and 4% respectively in
FY2015.
In FY2016, the Group reclassified its reporting segments under
the Infrastructure division to better reflect the nature of the income
streams and growth strategies. This resulted in the establishment
of the Environment, Logistics and Aviation segments while
the Roads segment remained. The former Energy and Water
segments have been consolidated into the Environment segment
in view of the long-term investment opportunities in the fast
growing environmental markets through both Sino-French
Holdings (Hong Kong) Limited (“SFH”) and Derun Environment.
The Logistics segment, which replaces the Ports & Logistics
segment, has been set up to capture ports, warehousing
and rail container terminal businesses. A new standalone
Aviation segment has been established to embrace airport
and commercial aircraft leasing investments given their strong
earnings and growth potential. All prior year segment information
has been restated based on the new reporting segments.
Earnings per share
The basic earnings per share was HK$1.30 in FY2016,
representing an increase of 9% from HK$1.19 in FY2015.
Treasury management and cash funding
The Group’s funding and treasury policy is designed to maintain a diversified and balanced debt profile and financial structure. The Group continues to monitor its cash flow position and debt profile, and to enhance the cost-efficiency of funding initiatives by its centralized treasury function. In order to maintain financial flexibility and adequate liquidity for the Group’s operations, potential investments and growth plans, the Group has built a strong base of funding resources and will keep exploring cost-efficient ways of financing.
Liquidity
As at 30 June 2016, the Group’s total cash and bank balances which were mainly denominated in Renminbi and Hong Kong Dollar amounted to HK$8.924 billion, as compared to HK$10.422 billion a year ago. The Group’s Net Debt as at 30 June 2016 was HK$6.141 bil l ion, comparing to HK$6.389 billion as at 30 June 2015. The decrease in Net Debt was mainly due to net cash inflows from operations and disposals of investments. The capital structure of the Group of 25% debt and 75% equity as at 30 June 2016 remained comparable to 27% debt and 73% equity as at 30 June 2015. Details of net gearing ratio are set out in the Financial Highlights section and note 4(d) to the financial statements.
Debt profile and maturity
As at 30 June 2016, the Group’s Total Debt decreased to HK$15.065 billion from HK$16.811 billion as at 30 June 2015. The Group has spaced out its debt maturity profile to reduce refinancing risks. Among the long-term loans and borrowings of HK$9.252 billion as at 30 June 2016, 6% will mature in the second year and 94% will mature in the third to fifth year. Bank loans were denominated in Hong Kong Dollar or Renminbi, while bonds were denominated in United States Dollar. Apart from the fixed rate bonds, bank loans were mainly floating rate interest-bearing. Interest rate swaps are used to hedge part of the Group’s underlying interest rate exposure. The Group did not have any material exposure to exchange risk other than Renminbi during FY2016. As at 30 June 2016, intangible concession rights of Hangzhou Ring Road were pledged as securities for a banking facility of the Group.
Commitments
The Group’s commitments for capital expenditure were HK$3.065 bill ion as at 30 June 2016, as compared to HK$2.175 billion as at 30 June 2015. These represented commitments for capital contributions to an associated company and certain joint ventures, properties and equipment, intangible concession rights and other investment. Sources of funding for capital expenditure include internally generated resources and banking facilities.
Financial guarantee contracts
Financial guarantee contracts of the Group were HK$2.369 billion as at 30 June 2016, as compared to HK$1.095 billion as at 30 June 2015. These represented guarantees for banking facilities of associated companies, joint ventures and a related company.
ANNUAL REPORT 2016 57
Management Discussion and Analysis
Group Overview

2016 2015 Change %
HK$’m HK$’m Fav./(Unfav.)
Roads 1,259.8 1,201.0 5
Environment 469.8 631.4 (26)
Logistics 702.6 548.9 28
Aviation 424.0 243.6 74
Total 2,856.2 2,624.9 9
AOP Contribution by SegmentFor the year ended 30 June
Roads Environment Logistics Aviation
9%
21%
24%
46%
2015
15%
25%
16%
44%
2016
In FY2016, the Infrastructure division reported an AOP of
HK$2,856.2 million, a growth of 9%, which was mainly attributable
to Aviation and Logistics segments, while the Roads segment
maintained steady growth. In order to better reflect the nature
of the income streams and growth strategies, the Environment,
Logistics and Aviation segments were established while the
Roads segment remained.
NWS HOLDINGS LIMITED58
Management Discussion and Analysis
Infrastructure
ANNUAL REPORT 2016 59
Management Discussion and Analysis
Infrastructure
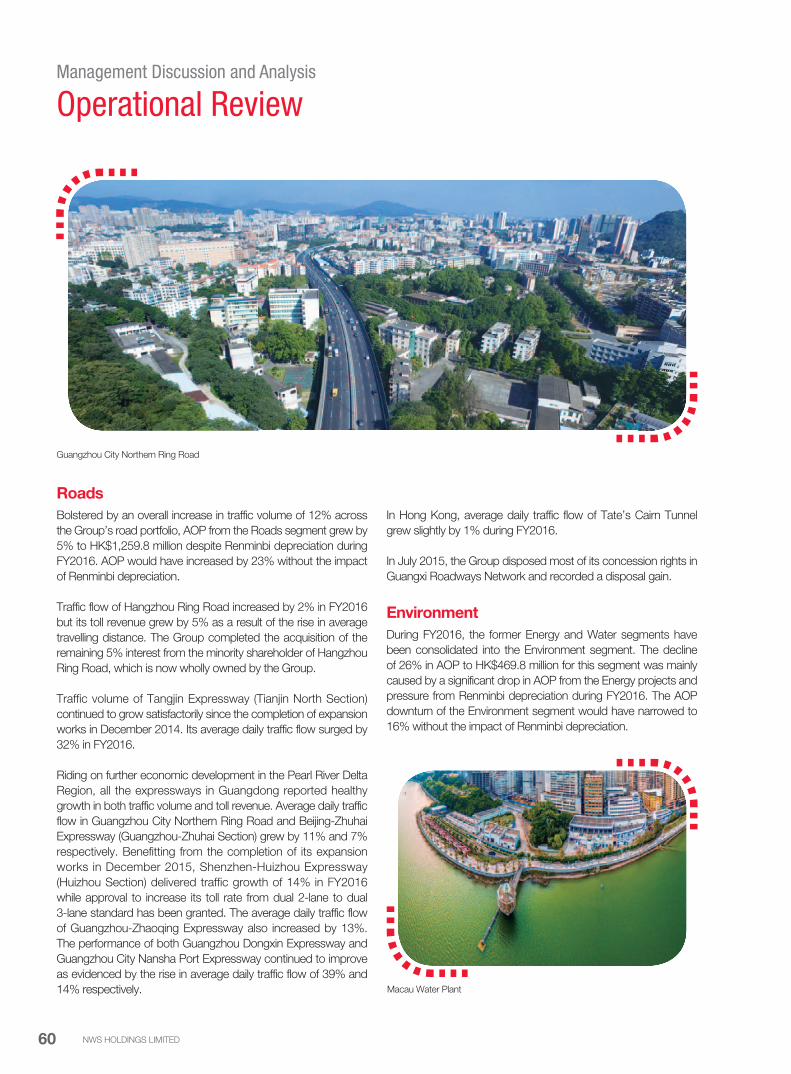
Roads
Bolstered by an overall increase in traffic volume of 12% across
the Group’s road portfolio, AOP from the Roads segment grew by
5% to HK$1,259.8 million despite Renminbi depreciation during
FY2016. AOP would have increased by 23% without the impact
of Renminbi depreciation.
Traffic flow of Hangzhou Ring Road increased by 2% in FY2016
but its toll revenue grew by 5% as a result of the rise in average
travelling distance. The Group completed the acquisition of the
remaining 5% interest from the minority shareholder of Hangzhou
Ring Road, which is now wholly owned by the Group.
Traffic volume of Tangjin Expressway (Tianjin North Section)
continued to grow satisfactorily since the completion of expansion
works in December 2014. Its average daily traffic flow surged by
32% in FY2016.
Riding on further economic development in the Pearl River Delta
Region, all the expressways in Guangdong reported healthy
growth in both traffic volume and toll revenue. Average daily traffic
flow in Guangzhou City Northern Ring Road and Beijing-Zhuhai
Expressway (Guangzhou-Zhuhai Section) grew by 11% and 7%
respectively. Benefitting from the completion of its expansion
works in December 2015, Shenzhen-Huizhou Expressway
(Huizhou Section) delivered traffic growth of 14% in FY2016
while approval to increase its toll rate from dual 2-lane to dual
3-lane standard has been granted. The average daily traffic flow
of Guangzhou-Zhaoqing Expressway also increased by 13%.
The performance of both Guangzhou Dongxin Expressway and
Guangzhou City Nansha Port Expressway continued to improve
as evidenced by the rise in average daily traffic flow of 39% and
14% respectively.
In Hong Kong, average daily traffic flow of Tate’s Cairn Tunnel
grew slightly by 1% during FY2016.
In July 2015, the Group disposed most of its concession rights in
Guangxi Roadways Network and recorded a disposal gain.
Environment
During FY2016, the former Energy and Water segments have
been consolidated into the Environment segment. The decline
of 26% in AOP to HK$469.8 million for this segment was mainly
caused by a significant drop in AOP from the Energy projects and
pressure from Renminbi depreciation during FY2016. The AOP
downturn of the Environment segment would have narrowed to
16% without the impact of Renminbi depreciation.
Macau Water Plant
Guangzhou City Northern Ring Road
NWS HOLDINGS LIMITED60
Management Discussion and Analysis
Operational Review
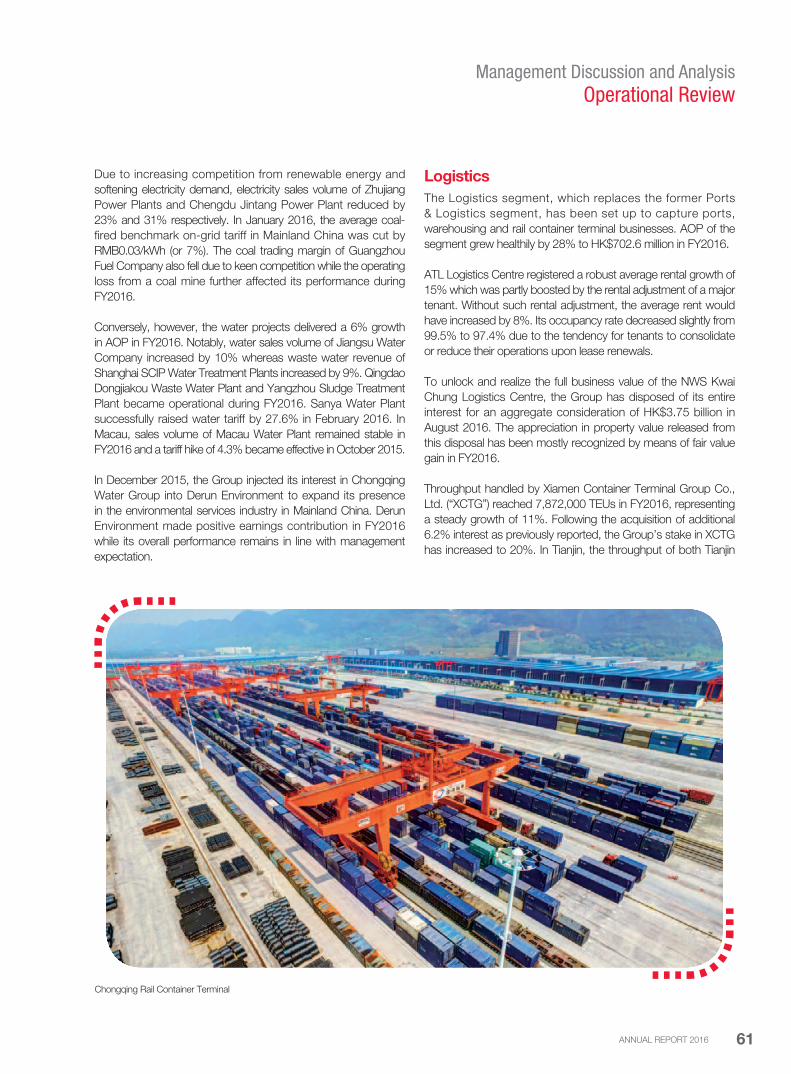
Due to increasing competition from renewable energy and
softening electricity demand, electricity sales volume of Zhujiang
Power Plants and Chengdu Jintang Power Plant reduced by
23% and 31% respectively. In January 2016, the average coal-
fired benchmark on-grid tariff in Mainland China was cut by
RMB0.03/kWh (or 7%). The coal trading margin of Guangzhou
Fuel Company also fell due to keen competition while the operating
loss from a coal mine further affected its performance during
FY2016.
Conversely, however, the water projects delivered a 6% growth
in AOP in FY2016. Notably, water sales volume of Jiangsu Water
Company increased by 10% whereas waste water revenue of
Shanghai SCIP Water Treatment Plants increased by 9%. Qingdao
Dongjiakou Waste Water Plant and Yangzhou Sludge Treatment
Plant became operational during FY2016. Sanya Water Plant
successfully raised water tariff by 27.6% in February 2016. In
Macau, sales volume of Macau Water Plant remained stable in
FY2016 and a tariff hike of 4.3% became effective in October 2015.
In December 2015, the Group injected its interest in Chongqing
Water Group into Derun Environment to expand its presence
in the environmental services industry in Mainland China. Derun
Environment made positive earnings contribution in FY2016
while its overall performance remains in line with management
expectation.
Chongqing Rail Container Terminal
Logistics
The Logistics segment, which replaces the former Ports
& Logistics segment, has been set up to capture ports,
warehousing and rail container terminal businesses. AOP of the
segment grew healthily by 28% to HK$702.6 million in FY2016.
ATL Logistics Centre registered a robust average rental growth of
15% which was partly boosted by the rental adjustment of a major
tenant. Without such rental adjustment, the average rent would
have increased by 8%. Its occupancy rate decreased slightly from
99.5% to 97.4% due to the tendency for tenants to consolidate
or reduce their operations upon lease renewals.
To unlock and realize the full business value of the NWS Kwai
Chung Logistics Centre, the Group has disposed of its entire
interest for an aggregate consideration of HK$3.75 billion in
August 2016. The appreciation in property value released from
this disposal has been mostly recognized by means of fair value
gain in FY2016.
Throughput handled by Xiamen Container Terminal Group Co.,
Ltd. (“XCTG”) reached 7,872,000 TEUs in FY2016, representing
a steady growth of 11%. Following the acquisition of additional
6.2% interest as previously reported, the Group’s stake in XCTG
has increased to 20%. In Tianjin, the throughput of both Tianjin
ANNUAL REPORT 2016 61
Management Discussion and Analysis
Operational Review

Five Continents International Container Terminal Co., Ltd. and
Tianjin Orient Container Terminals Co., Ltd. fell by 4% each to
2,486,000 TEUs and 897,000 TEUs respectively in FY2016.
With the introduction of containerized break-bulk cargo services
in January 2015 and the increasing demand for international
block train services, throughput handled by CUIRC grew 14% to
2,062,000 TEUs in FY2016. To meet the growing demand, the
expansion works to double the handling capacity at Chongqing
terminal were completed in December 2015.
Aviation
This segment includes the Group’s investment in Beijing Capital
International Airport Co., Ltd. (“BCIA”) and the commercial aircraft
leasing business. The significant increase in AOP of 74% was
primarily due to the full year contribution from Goshawk.
As the world’s second busiest airport in terms of passenger
throughput, BCIA served 91.5 million passengers in FY2016,
representing a 3% growth compared to FY2015. The robust
growth of international passengers, together with the new
Beijing Capital International Airport
concession model for retail, restaurants and advertising
businesses, have continued to drive BCIA’s revenue streams.
To capture the growing demand for leased aircraft, the Group
entered the commercial aircraft leasing business by acquiring
40% equity interest in Goshawk in February 2015 which focuses
on commercial aircraft that are young, modern and in demand.
The fleet size grew from 40 aircraft as at 30 June 2015 to
68 aircraft as at 30 June 2016 and thereby reached US$2.7 billion
in total assets under management. All aircraft are purchased with
a lease that generates steady income to the Group.
In FY2016, the Group established the second commercial aircraft
leasing platform through the formation of a joint venture with
Chow Tai Fook Enterprises Limited and Aviation Capital Group
Corp., one of the world’s leading aircraft leasing companies based
in the USA. This new joint venture, namely Bauhinia, which is
expected to bring recurring cash flows and stable income to the
Group in the coming years in the same way as Goshawk, will
further strengthen the Group’s market position in the fast growing
commercial aircraft leasing industry.
NWS HOLDINGS LIMITED62
Management Discussion and Analysis
Operational Review

Roads
China will continue its effort in advancing urbanization and road
network development. Public-private partnership is primed
to be the key model in funding and operating infrastructure
projects including expressways to alleviate the debt burden of
local governments and improve operational efficiency. Against
this backdrop and spurred by the strong financial strength and
experience in the toll road industry, the Group is optimistic that it
will be able to capitalize on the emerging business opportunities.
Furthermore, the anticipated release of the amendment of
“Regulation on the Administration of Toll Roads” by the Ministry
of Transport of Mainland China is poised to provide clearer and
helpful directives on toll regulations and concession extension.
Environment
China is committed to carrying out over 10 mega environmental
related projects in the 13th Five-Year Plan, including setting
up waste utilization bases, water environment renovation and
construction of sponge cities. This will create immense investment
opportunities for the industry. Derun Environment, with its
expertise, resources and local presence, is well positioned to
ride the wave of environmental sustainability. Construction of a
sludge drying facility with daily treatment capacity of 200 tonnes is
underway in Suzhou and the plant is expected to be operational
by the end of 2017.
Renewable energy generation is becoming more technically
mature and commercially viable in Mainland China. Its market
share is expected to grow with the support of government
policies. The Company will continue to explore investment
potentials in this regard. The outlook of coal-fired power remains
overshadowed by slowing electricity demand and rigorous
emission controls.
Logistics
Retail sales in Hong Kong have continued to soften while the
supply of warehouse facilities has been growing. To maintain the
competitiveness of ATL Logistics Centre, a four-year building
renovation programme is well underway and is targeted for
completion in the financial year ending 30 June 2018.
The Belt and Road Initiative continues to benefit CUIRC terminals
as a result of the rising demand for international block train
services. In addition, the supportive policies from China Railway
Corporation will further drive the development of containerized
break-bulk cargo services. To capture the future growth potential,
both Tianjin and Urumqi terminals are scheduled to commence
operations in FY2017.
Aviation
In light of the increasing demand for air transportation, the outlook
of aviation market remains robust.
While BCIA is operating near optimal capacity, it is expected to
deliver relatively stable passenger growth in the coming years.
Nevertheless, BCIA will endeavour to optimize air route network
to increase the proportion of international flights. Other key
management focus areas to realize BCIA’s underlying potentials
include the development of non-aeronautical businesses,
effective cost management, improving aircraft ground handling
and airport operational efficiency.
Global air traffic growth is expected to continue in the long-term.
According to the forecasts by both Boeing and Airbus, the size
of the global aircraft fleet will double by 2035, thereby boosting
the demand for leased aircraft. Looking ahead, the aircraft
leasing industry will be driven by rising air traffic volumes from
the emerging markets of the Asia-Pacific region, low fuel price
and expansion of low cost carriers. With the firm commitment
and strategy to further enhance the aircraft leasing portfolio, this
business will serve as an important growth impetus for the Group
in the years to come.
Commercial aircraft leasing business
Economic growth in Mainland China is still on track
to attaining the official growth target for 2016, albeit
at a slower pace than in previous years. With a strong
financial position and additional cash resources
from divestment activities in FY2016, the Group is
well prepared and positioned to capture investment
opportunities to further strengthen its infrastructure
assets portfolio.
ANNUAL REPORT 2016 63
Management Discussion and Analysis
Business Outlook – Infrastructure
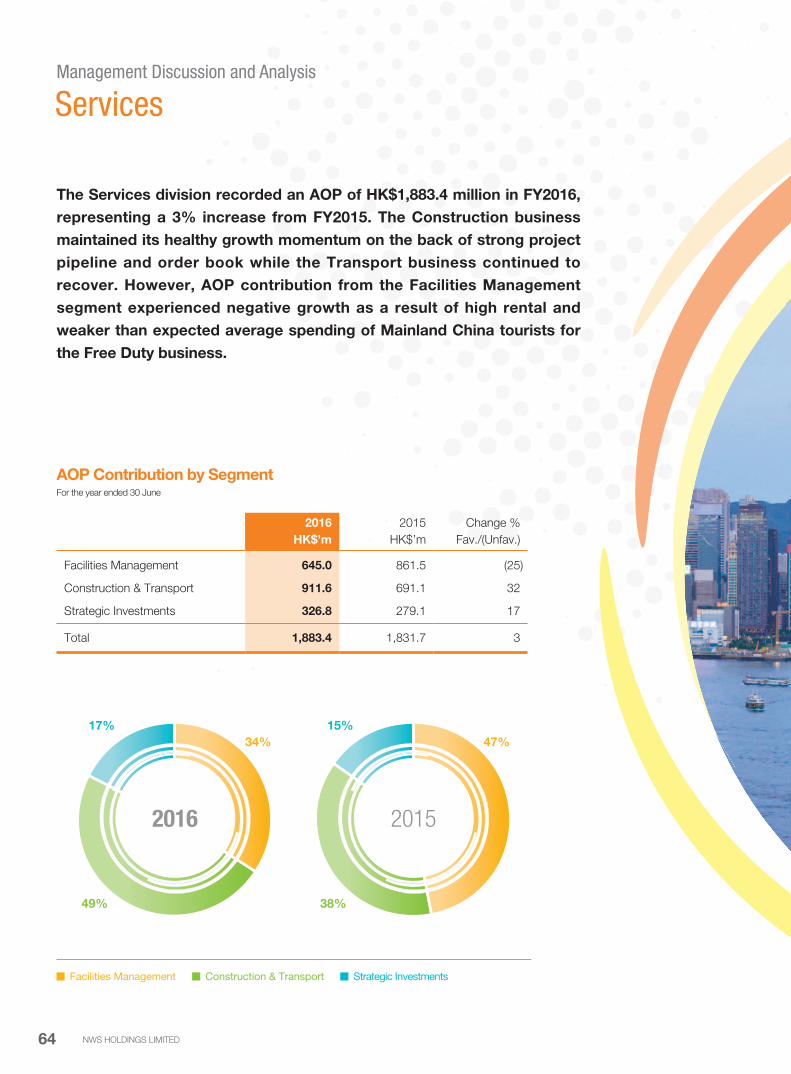
AOP Contribution by SegmentFor the year ended 30 June
2016 2015 Change %
HK$’m HK$’m Fav./(Unfav.)
Facilities Management 645.0 861.5 (25)
Construction & Transport 911.6 691.1 32
Strategic Investments 326.8 279.1 17
Total 1,883.4 1,831.7 3
The Services division recorded an AOP of HK$1,883.4 million in FY2016,
representing a 3% increase from FY2015. The Construction business
maintained its healthy growth momentum on the back of strong project
pipeline and order book while the Transport business continued to
recover. However, AOP contribution from the Facilities Management
segment experienced negative growth as a result of high rental and
weaker than expected average spending of Mainland China tourists for
the Free Duty business.
15%
38%
47%
2015
17%
49%
34%
2016
Facilities Management Construction & Transport Strategic Investments
NWS HOLDINGS LIMITED64
Management Discussion and Analysis
Services

ANNUAL REPORT 2016 65
Management Discussion and Analysis
Services

Facilities Management
The Facilities Management segment mainly comprises the
management and operation of HKCEC and the business of Free
Duty.
During FY2016, 1,149 events were held at HKCEC with a total
patronage of approximately 5.5 million. HKCEC delivered stable
and solid results even though certain trade fairs and luxury shows
had reduced in scale in the face of sluggish economic conditions.
With the recognition of being the first organization in Hong Kong
to attain the ISO 20121 Event Sustainability Management System
certification, HKCEC will stay focused on delivering total customer
satisfaction through innovative environmental solutions and quality
services.
The performance of Free Duty in FY2016 was impacted by a
slowdown in inbound Mainland tourists and the corresponding
decline in visitor spending. At the same time, the change in sales
mix alongside rising rental expenses exerted constant pressure
on profit margins. Despite the retail headwinds, the operation at
the Lok Ma Chau Station sustained steady growth. The Group
will continue to explore opportunities to reinforce the duty free
business.
Construction & Transport
AOP contribution from the Construction business recorded
strong growth of 26% to HK$715.5 million in FY2016 mainly due
to the continuous improvement in gross profit through effective
project management and the strong increase in business volume.
Major projects during FY2016 included New World Centre
remodeling, residential development at Clear Water Bay Road,
Hong Kong Convention and Exhibition Centre
New World First Ferry
NWS HOLDINGS LIMITED66
Management Discussion and Analysis
Operational Review

Gleneagles Hong Kong Hospital, Phase Two Expansion of
Cathay Pacific’s catering services facility, Kerry Hotel Hong Kong
at Hung Hom and foundation work for Public Rental Housing
Development at Lai Chi Kok Road. In addition, new tenders
awarded during FY2016 included construction for the Home
Ownership Scheme Developments at Kiu Cheong Road, Tin
Shui Wai and Ngan Kwong Wan Road East and West, Mui Wo,
a composite development at Tseung Kwan O and a commercial
development at Kowloon Bay. As at 30 June 2016, the gross
value of contracts on hand for the Construction business was
approximately HK$69.7 billion and the remaining works to be
completed amounted to approximately HK$38.6 billion.
Having recovered from the impact of the “Occupy Central
Movement” in FY2015 and as the ridership loss to the MTR West
Island Line has gradually subsided and stabilized in FY2016,
the Group’s Transport business was able to take advantage of
the rising patronage from airport bus services and stable fuel
costs through a hedging programme to increase its earnings
contribution by 56% to HK$196.1 million in FY2016.
Strategic Investments
This segment includes contributions from Tricor Holdings Limited
(“Tricor”), Haitong International, Newton Resources, Tharisa,
Hyva and other investments held by the Group during the year for
strategic investment purposes.
Tricor’s corporate services businesses performed steadily during
FY2016 and captured about 51% of the total share of new listings
in Hong Kong. Its business operations in Hong Kong, Singapore
and Malaysia altogether contributed about 81% of the total profit
of Tricor in FY2016. The Company, together with The Bank of
East Asia, Limited, are currently undertaking a strategic review
on our investments in Tricor whereby various options will be
considered, including potential disposal, to realize shareholder
value.
The Group’s investment in Haitong International was reclassified
from an associated company to an available-for-sale financial
asset in June 2015. Contribution from Haitong International
represented dividend income in FY2016.
While the global commodities prices appear to have stabilized
since early 2016, the Group will continue to monitor its
investments in the mining industry closely.
Tharisa, which is principally engaged in platinum group metals
and chrome mining, processing and trading in South Africa,
continued to ramp up its production to full capacity. Its ordinary
shares are listed on the Johannesburg Stock Exchange Limited
and its secondary listing on the main board of the London
Stock Exchange plc commenced in June 2016. In view of the
substantial drop in the market price of chrome concentrates, the
Group recognized an impairment loss of HK$200.0 million in the
carrying value of its interest in Tharisa in FY2016.
The slowdown of China’s mining related economic activities
continued to have an adverse impact on Hyva’s performance.
While the operating losses had been mitigated by cost savings
measures, an impairment loss of HK$177.6 million was shared by
the Group in FY2016.
New World First Bus and Citybus
ANNUAL REPORT 2016 67
Management Discussion and Analysis
Operational Review
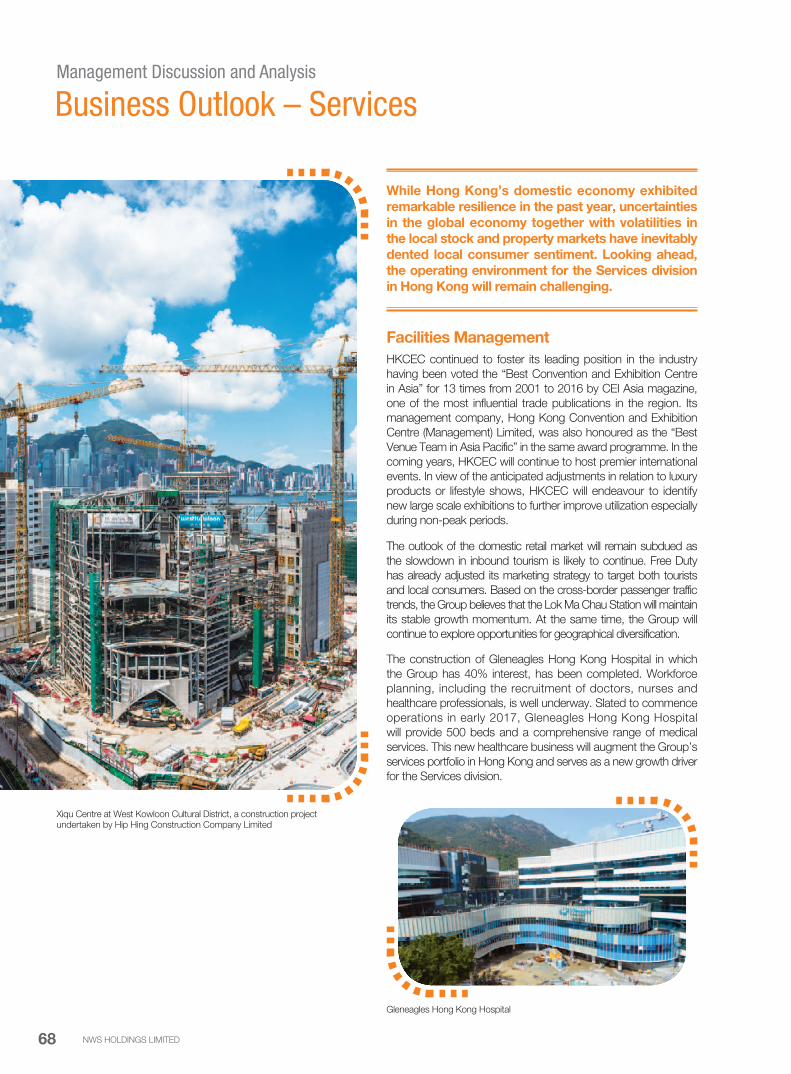
Facilities Management
HKCEC continued to foster its leading position in the industry
having been voted the “Best Convention and Exhibition Centre
in Asia” for 13 times from 2001 to 2016 by CEI Asia magazine,
one of the most influential trade publications in the region. Its
management company, Hong Kong Convention and Exhibition
Centre (Management) Limited, was also honoured as the “Best
Venue Team in Asia Pacific” in the same award programme. In the
coming years, HKCEC will continue to host premier international
events. In view of the anticipated adjustments in relation to luxury
products or lifestyle shows, HKCEC will endeavour to identify
new large scale exhibitions to further improve utilization especially
during non-peak periods.
The outlook of the domestic retail market will remain subdued as
the slowdown in inbound tourism is likely to continue. Free Duty
has already adjusted its marketing strategy to target both tourists
and local consumers. Based on the cross-border passenger traffic
trends, the Group believes that the Lok Ma Chau Station will maintain
its stable growth momentum. At the same time, the Group will
continue to explore opportunities for geographical diversification.
The construction of Gleneagles Hong Kong Hospital in which
the Group has 40% interest, has been completed. Workforce
planning, including the recruitment of doctors, nurses and
healthcare professionals, is well underway. Slated to commence
operations in early 2017, Gleneagles Hong Kong Hospital
will provide 500 beds and a comprehensive range of medical
services. This new healthcare business will augment the Group’s
services portfolio in Hong Kong and serves as a new growth driver
for the Services division.
Xiqu Centre at West Kowloon Cultural District, a construction project undertaken by Hip Hing Construction Company Limited
While Hong Kong’s domestic economy exhibited
remarkable resilience in the past year, uncertainties
in the global economy together with volatilities in
the local stock and property markets have inevitably
dented local consumer sentiment. Looking ahead,
the operating environment for the Services division
in Hong Kong will remain challenging.
Gleneagles Hong Kong Hospital
NWS HOLDINGS LIMITED68
Management Discussion and Analysis
Business Outlook – Services

Construction & Transport
The construction industry in Hong Kong will remain vibrant over
the short to medium term despite predictions of interest rate hike.
In light of the existing contracts on hand and the opportunities to
participate in other sizeable projects, the Group is confident to
maintain a healthy order book and a good pipeline of projects in
the coming years. However, profit margins are under pressure
due to labour shortage, escalating labour and material costs
and increasing scrutiny on industrial safety and environmental
protection. Therefore, risk mitigation and cost control through
proficient project management practices will continue to be the
key focus areas for the construction companies.
The Transport business made steady progress in FY2016 in
regaining some loss of ridership following the opening of the MTR
West Island Line. Regarding the scheduled opening of the MTR
Kwun Tong Line Extension and South Island Line by the end of
2016, such effect will be partly mitigated by the implementation of
bus route rationalization programme.
Conclusions
The effective execution of sustainable investment strategy and
systematic approach to business performance optimization
enabled the Group to deliver solid growth despite unfavourable
market conditions and operating environment. As the most
significant growth driver in FY2016, the Aviation segment fully
justified its new stature as a standalone segment under the
Infrastructure division. While the expansion of Goshawk and its
first full-year earnings contribution were in line with management
expectations, the establishment of Bauhinia will allow the Group
to increase its market presence in the growing aircraft leasing
industry. The simultaneous development of these two aircraft
leasing platforms together with the upside potential of BCIA will
undoubtedly drive the growth of the Aviation segment in the
coming years.
The overall operating performance of the projects under the
Infrastructure division remained robust and resilient although the
financial result was diluted by the impact of Renminbi depreciation
on the projects in Mainland China. The Roads segment delivered
encouraging results driven by growing local economic activities.
On the other hand, the performance of the newly formed
Environment segment was restrained by the continued decline
in coal-fired electricity sales although the impact was partly
alleviated by the growth delivered by the former Water segment.
Nonetheless, the Group remains optimistic in the outlook of the
Environment segment as urbanization and policy support in
Mainland China will continue to spur demand for modern and
advanced water and waste treatment processes while Derun
Environment will make full-year contribution starting from FY2017.
The Services division held its ground relatively well despite
constant headwinds and contrasting performances. The Facilities
Management segment contracted further as the Free Duty
business slowed down due to subdued retail sentiment. Such
impact was however more than compensated by the remarkable
growth of the Construction business. With Gleneagles Hong
Kong Hospital scheduled to commence operation in FY2017, the
Group looks forward to developing the healthcare business into a
new growth driver for its services portfolio.
Having strategically divested and unlocked the value of certain
mature and non-core assets, the Group has built up a sizeable
war chest to undertake value creating initiatives and pursue
acquisition opportunities that will maintain long-term stability and
growth in shareholder value and return on investment. The Group
has accordingly set aside some HK$4 billion of financial resources
for capital expenditure and investment purposes in the coming
financial year. As such, the Group is well prepared and equipped
to embrace opportunities and face challenges that lie ahead.
Free Duty
ANNUAL REPORT 2016 69
Management Discussion and Analysis
Business Outlook – Services
REPORTS ANDFINANCIALSTATEMENTS
71 Report of the Directors
91 Independent Auditor’s Report
92 Consolidated Income Statement
93 Consolidated Statement of Comprehensive Income
94 Consolidated Statement of Financial Position
96 Consolidated Statement of Changes in Equity
98 Consolidated Statement of Cash Flows
100 Notes to the Financial Statements
NWS HOLDINGS LIMITED70
Report of the Directors
The directors of NWS Holdings Limited (the “Company”, together with its subsidiaries, the “Group”) submit their report together with
the audited financial statements of the Group for the year ended 30 June 2016.
Principal Activities and Geographical Analysis of OperationsThe principal activity of the Company is investment holding.
The principal activities of its subsidiaries include:
(i) the development, investment, operation and/or management of roads, environmental projects, commercial aircraft leasing as well
as ports and logistics facilities; and
(ii) the investment in and/or operation of facilities, construction, transport and strategic investments.
An analysis of the Group’s performance for the year by business and geographical segments is set out in note 6 to the financial
statements.
Business ReviewA fair review of the business of the Group and a discussion and analysis of the Group’s performance during the year and the material
factors underlying its results and financial position, as well as the outlook for the Group’s business, are provided in the “Chairman’s
Statement” (pages 10 and 11) and the “Management Discussion and Analysis” (pages 54 to 69) sections. Particulars of significant
events affecting the Group that have occurred since the end of the year ended 30 June 2016, if applicable, can also be found in the
aforesaid sections and the notes to the financial statements (pages 100 to 189). Description of the principal risks and uncertainties
faced by the Group can be found throughout this annual report, particularly in the “Risk Management” section (pages 41 to 45).
Description of the Group’s relationships with its key stakeholders is included in the “Corporate Governance Report” (pages 23 to 40)
and the “Sustainability” (pages 46 to 53) sections. Furthermore, the Group’s environmental policies and performance are set out in the
“Sustainability” section (pages 46 to 53) and details regarding the Group’s compliance with relevant laws and regulations which have a
significant impact on the Group are provided in the “Corporate Governance Report” section (pages 23 to 40).
This discussion forms part of this report of the directors.
Results and AppropriationsThe results of the Group for the year and the state of affairs of the Company and of the Group as at 30 June 2016 are set out in the
financial statements on pages 92 to 189.
The board of directors of the Company (the “Board”) has resolved to recommend a final dividend for the year ended 30 June 2016 (the
“Final Dividend”) in scrip form equivalent to HK$0.34 per share (2015: HK$0.33 per share) with a cash option to the shareholders whose
names appear on the register of members of the Company on 25 November 2016. Together with the interim dividend of HK$0.31 per
share (2015: HK$0.27 per share) paid in May 2016, total distribution of dividend by the Company for the year ended 30 June 2016 will
thus be HK$0.65 per share (2015: HK$0.60 per share).
Subject to the passing of the relevant resolution at the annual general meeting of the Company to be held on 21 November 2016 (the
“2016 AGM”) and the Listing Committee of The Stock Exchange of Hong Kong Limited (the “Hong Kong Stock Exchange”) granting
the listing of and permission to deal in the new shares to be issued under the Final Dividend, each shareholder will be allotted fully paid
shares having an aggregate market value equal to the total amount which such shareholders could elect to receive in cash and they will
be given the option of electing to receive payment in cash of HK$0.34 per share instead of the allotment of shares. A circular containing
details of the scrip dividend arrangement will be despatched to the shareholders of the Company together with a form of election for
cash dividend on or about 29 November 2016.
ANNUAL REPORT 2016 71
Report of the Directors
SubsidiariesParticulars of the Company’s principal subsidiaries are set out in note 43 to the financial statements.
Associated Companies and Joint VenturesParticulars of the Group’s principal associated companies and joint ventures are set out in notes 44 and 45 to the financial statements
respectively.
ReservesDetails of movements in the reserves of the Company and the Group during the year are set out in notes 42 and 30 to the financial
statements respectively.
Distributable ReservesAt 30 June 2016, the Company’s reserves available for distribution amounted to HK$10,047.3 million (2015: HK$6,748.8 million).
DonationsDuring the year, the Group made charitable donations amounted to HK$3.4 million (2015: HK$3.0 million).
Investment PropertiesDetails of movements in the investment properties of the Group during the year are set out in note 15 to the financial statements.
Property, Plant and EquipmentDetails of movements in the property, plant and equipment of the Group during the year are set out in note 16 to the financial statements.
Shares IssuedDuring the year, the Company declared final dividend for the year ended 30 June 2015 and interim dividend for the six months ended
31 December 2015 in scrip form (with cash option). Accordingly, a total of 56,600,940 shares of the Company, fully paid, were issued
for a total consideration of HK$608.3 million.
Details of movements in the share capital of the Company during the year are set out in note 29 to the financial statements.
Debentures IssuedThe Group has not issued any debentures during the year.
NWS HOLDINGS LIMITED72

Report of the Directors
Bank Loans and Other BorrowingsParticulars of the bank loans and other borrowings of the Group are set out in note 31 to the financial statements.
Equity Linked AgreementsSave for the share option scheme of the Company disclosed in the section headed “Share Option Scheme” below and note 29 to the
financial statements, no equity-linked agreements were entered into by the Group, or existed during the year.
Pre-emptive RightsThere is no provision for pre-emptive rights under the Company’s bye-laws or the laws of Bermuda.
Purchase, Sale or Redemption of the Company’s Listed SecuritiesNeither the Company nor any of its subsidiaries has purchased, sold or redeemed any of the Company’s listed securities during the
year.
Major Customers and SuppliersThe amount of turnover attributable to the Group’s five largest customers in aggregate and the Group’s largest customer accounted for
31% and 12% respectively of the Group’s total turnover for the year ended 30 June 2016. The largest and the second largest customers
are subsidiaries of the Company’s ultimate holding company and Dr Cheng Kar Shun, Henry is a director of these two customers. The
turnover from these two customers is in respect of the Group’s construction business.
Save as the interests disclosed above and in the section headed “Directors’ Interests in Securities”, none of the directors, their close
associates or any shareholder (which to the knowledge of the directors owns more than 5% of the Company’s issued shares) had an
interest in these major customers.
The aggregate amount of purchases attributable to the Group’s five largest suppliers accounted for less than 30% of the Group’s total
purchases for the year ended 30 June 2016.
Management ContractsNo contracts concerning the management and administration of the whole or any substantial part of the business of the Company were
entered into or existed during the year.
Permitted Indemnity ProvisionsThe bye-laws of the Company provides that directors, secretary or other officers of the Company shall be indemnified out of the assets
and profits of the Company from and against all losses or liabilities which he/she may sustain or incur in or about the execution of the
duties of his/her office or otherwise in relation thereto.
In addition, a directors and officers liability insurance policy insuring claims made against, among others, the directors and the senior
management of the Group members and the persons representing the Group in associates as directors or senior management was in
effect throughout the year ended 30 June 2016 and remained in effect up to the date of this report.
ANNUAL REPORT 2016 73
Report of the Directors
DirectorsThe directors of the Company during the year and up to the date of this report are:
Executive directorsDr Cheng Kar Shun, Henry (Chairman)
Mr Tsang Yam Pui (Chief Executive Officer) (appointed as Chief Executive Officer on 1 July 2015)
Mr Hui Hon Chung (Deputy Chief Executive Officer) (appointed on 1 September 2015)
Mr Cheung Chin Cheung
Mr Cheng Chi Ming, Brian
Non-executive directorsMr To Hin Tsun, Gerald
Mr Dominic Lai
Mr Lam Wai Hon, Patrick (re-designated from executive director on 1 January 2016)
Mr William Junior Guilherme Doo
Independent non-executive directorsMr Kwong Che Keung, Gordon
Dr Cheng Wai Chee, Christopher
The Honourable Shek Lai Him, Abraham
Mr Lee Yiu Kwong, Alan
Mrs Oei Fung Wai Chi, Grace (appointed on 1 January 2016)
Mr Wilfried Ernst Kaffenberger (retired on 17 November 2015)
Mr Yeung Kun Wah, David (ceased on 17 November 2015)
(alternate director to Mr Wilfried Ernst Kaffenberger)
Mr Wilfried Ernst Kaffenberger, who retired as a director of the Company during the year, has no disagreement with the Board and
nothing relation to the affairs of the Company needed to be brought to the attention of the shareholders of the Company.
In accordance with bye-law 86(2) of the Company’s bye-laws, Mrs Oei Fung Wai Chi, Grace will retire at the forthcoming annual general
meeting and being eligible, will offer herself for re-election.
In accordance with bye-law 87 of the Company’s bye-laws, Mr Tsang Yam Pui, Mr To Hin Tsun, Gerald, Mr Dominic Lai, Mr Kwong
Che Keung, Gordon and Mr Shek Lai Him, Abraham will retire by rotation at the forthcoming annual general meeting and being eligible,
will offer themselves for re-election.
Directors’ Service ContractsNo director has a service contract which is not determinable by the Company within one year without payment of compensation other
than statutory compensation.
Directors’ Interests in Transactions, Arrangements or ContractsSave as disclosed in the section headed “Connected Transactions” below and note 14(b) of the notes to the financial statements, and
the contracts amongst group companies, no other transactions, arrangements or contracts of significance in relation to the Group’s
businesses to which the Company, its subsidiaries, its holding company or its fellow subsidiaries was a party, and in which any director
of the Company or the director’s connected entity had a material interest, whether directly or indirectly, subsisted at the end of the year
or at any time during the year.
NWS HOLDINGS LIMITED74
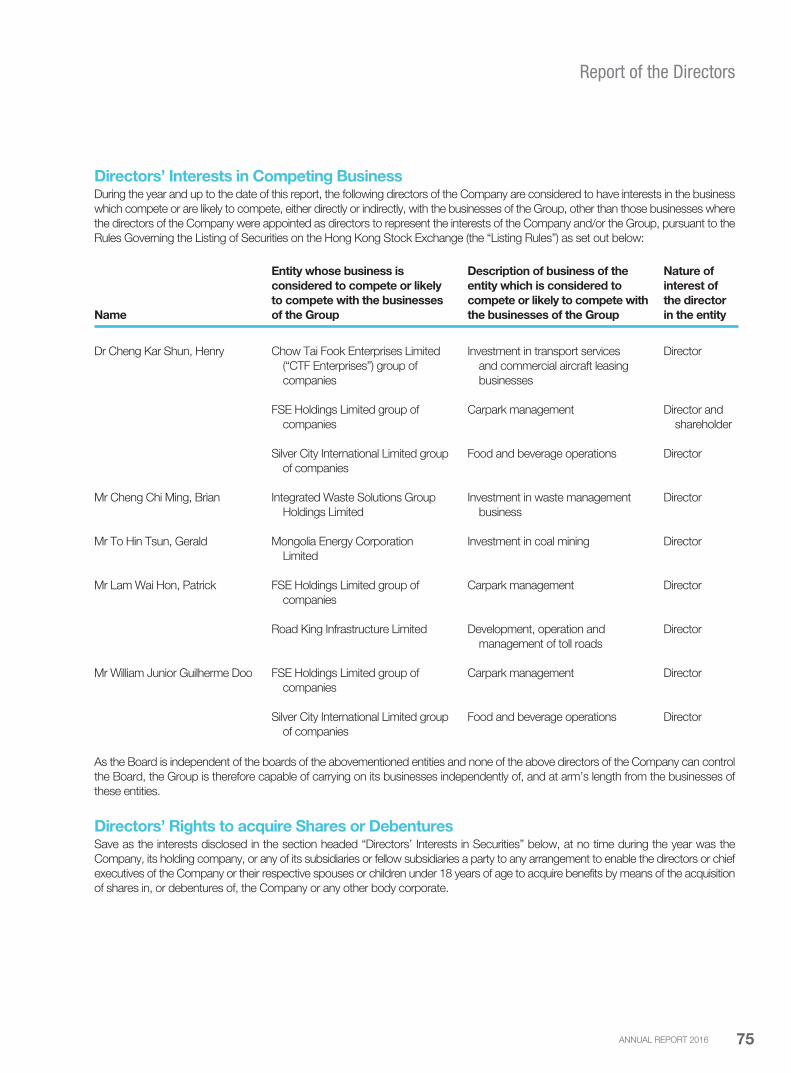
Report of the Directors
Directors’ Interests in Competing BusinessDuring the year and up to the date of this report, the following directors of the Company are considered to have interests in the business
which compete or are likely to compete, either directly or indirectly, with the businesses of the Group, other than those businesses where
the directors of the Company were appointed as directors to represent the interests of the Company and/or the Group, pursuant to the
Rules Governing the Listing of Securities on the Hong Kong Stock Exchange (the “Listing Rules”) as set out below:
Name
Entity whose business is
considered to compete or likely
to compete with the businesses
of the Group
Description of business of the
entity which is considered to
compete or likely to compete with
the businesses of the Group
Nature of
interest of
the director
in the entity
Dr Cheng Kar Shun, Henry Chow Tai Fook Enterprises Limited
(“CTF Enterprises”) group of
companies
Investment in transport services
and commercial aircraft leasing
businesses
Director
FSE Holdings Limited group of
companies
Carpark management Director and
shareholder
Silver City International Limited group
of companies
Food and beverage operations Director
Mr Cheng Chi Ming, Brian Integrated Waste Solutions Group
Holdings Limited
Investment in waste management
business
Director
Mr To Hin Tsun, Gerald Mongolia Energy Corporation
Limited
Investment in coal mining Director
Mr Lam Wai Hon, Patrick FSE Holdings Limited group of
companies
Carpark management Director
Road King Infrastructure Limited Development, operation and
management of toll roads
Director
Mr William Junior Guilherme Doo FSE Holdings Limited group of
companies
Carpark management Director
Silver City International Limited group
of companies
Food and beverage operations Director
As the Board is independent of the boards of the abovementioned entities and none of the above directors of the Company can control
the Board, the Group is therefore capable of carrying on its businesses independently of, and at arm’s length from the businesses of
these entities.
Directors’ Rights to acquire Shares or DebenturesSave as the interests disclosed in the section headed “Directors’ Interests in Securities” below, at no time during the year was the
Company, its holding company, or any of its subsidiaries or fellow subsidiaries a party to any arrangement to enable the directors or chief
executives of the Company or their respective spouses or children under 18 years of age to acquire benefits by means of the acquisition
of shares in, or debentures of, the Company or any other body corporate.
ANNUAL REPORT 2016 75
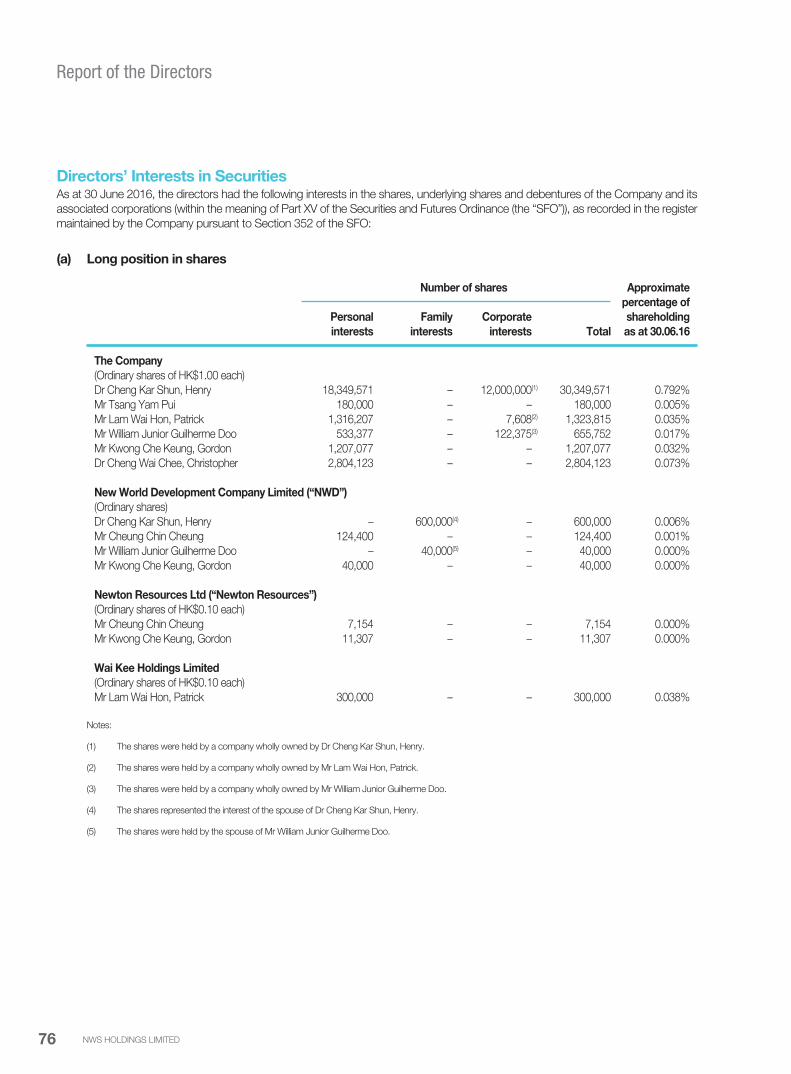
Report of the Directors
Directors’ Interests in SecuritiesAs at 30 June 2016, the directors had the following interests in the shares, underlying shares and debentures of the Company and its
associated corporations (within the meaning of Part XV of the Securities and Futures Ordinance (the “SFO”)), as recorded in the register
maintained by the Company pursuant to Section 352 of the SFO:
(a) Long position in shares
Number of shares Approximate
percentage of
Personal Family Corporate shareholding
interests interests interests Total as at 30.06.16
The Company
(Ordinary shares of HK$1.00 each)
Dr Cheng Kar Shun, Henry 18,349,571 – 12,000,000(1) 30,349,571 0.792%
Mr Tsang Yam Pui 180,000 – – 180,000 0.005%
Mr Lam Wai Hon, Patrick 1,316,207 – 7,608(2) 1,323,815 0.035%
Mr William Junior Guilherme Doo 533,377 – 122,375(3) 655,752 0.017%
Mr Kwong Che Keung, Gordon 1,207,077 – – 1,207,077 0.032%
Dr Cheng Wai Chee, Christopher 2,804,123 – – 2,804,123 0.073%
New World Development Company Limited (“NWD”)
(Ordinary shares)
Dr Cheng Kar Shun, Henry – 600,000(4) – 600,000 0.006%
Mr Cheung Chin Cheung 124,400 – – 124,400 0.001%
Mr William Junior Guilherme Doo – 40,000(5) – 40,000 0.000%
Mr Kwong Che Keung, Gordon 40,000 – – 40,000 0.000%
Newton Resources Ltd (“Newton Resources”)
(Ordinary shares of HK$0.10 each)
Mr Cheung Chin Cheung 7,154 – – 7,154 0.000%
Mr Kwong Che Keung, Gordon 11,307 – – 11,307 0.000%
Wai Kee Holdings Limited
(Ordinary shares of HK$0.10 each)
Mr Lam Wai Hon, Patrick 300,000 – – 300,000 0.038%
Notes:
(1) The shares were held by a company wholly owned by Dr Cheng Kar Shun, Henry.
(2) The shares were held by a company wholly owned by Mr Lam Wai Hon, Patrick.
(3) The shares were held by a company wholly owned by Mr William Junior Guilherme Doo.
(4) The shares represented the interest of the spouse of Dr Cheng Kar Shun, Henry.
(5) The shares were held by the spouse of Mr William Junior Guilherme Doo.
NWS HOLDINGS LIMITED76

Report of the Directors
Directors’ Interests in Securities (continued)
(b) Long position in underlying shares – share options
(i) The Company
The following directors of the Company have personal interests in options to subscribe for shares of the Company:
Number of share options
Re-
Balance Granted Adjusted Exercised classified Balance Exercise
Exercisable as at during during during during as at price
Name Date of grant period 01.07.15 the year the year(2) the year the year 30.06.16 per share(2)
(Note) HK$
Dr Cheng Kar Shun, Henry 9 March 2015 (1) 7,401,080 – 10,978 – – 7,412,058 14.137
Mr Tsang Yam Pui 9 March 2015 (1) 3,700,540 – 5,488 – – 3,706,028 14.137
Mr Cheung Chin Cheung 9 March 2015 (1) 3,700,540 – 5,488 – – 3,706,028 14.137
Mr Cheng Chi Ming, Brian 9 March 2015 (1) 3,700,540 – 5,488 – – 3,706,028 14.137
Mr To Hin Tsun, Gerald 9 March 2015 (1) 700,102 – 1,038 – – 701,140 14.137
Mr Dominic Lai 9 March 2015 (1) 700,102 – 1,038 – – 701,140 14.137
Mr Lam Wai Hon, Patrick 9 March 2015 (1) 3,700,540 – 5,488 – – 3,706,028 14.137
Mr William Junior Guilherme Doo 9 March 2015 (1) 700,102 – 1,038 – – 701,140 14.137
Mr Kwong Che Keung, Gordon 9 March 2015 (1) 1,400,204 – 2,077 – – 1,402,281 14.137
Dr Cheng Wai Chee, Christopher 9 March 2015 (1) 1,400,204 – 2,077 – – 1,402,281 14.137
Mr Shek Lai Him, Abraham 9 March 2015 (1) 1,400,204 – 2,077 – – 1,402,281 14.137
Mr Lee Yiu Kwong, Alan 9 March 2015 (1) 1,400,204 – 2,077 – – 1,402,281 14.137
Mr Wilfried Ernst Kaffenberger 9 March 2015 (1) 1,400,204 – – – (1,400,204) (3) – 14.158
Notes:
(1) 60% of the share options are exercisable from 9 May 2015 to 8 March 2020 while the remaining 40% of the share options are divided into 2 tranches exercisable from 9 March 2016 and 9 March 2017 respectively to 8 March 2020.
(2) The Company declared final dividend for the year ended 30 June 2015 and interim dividend for the six months ended 31 December 2015 in scrip form (with cash option) during the year. Accordingly, adjustments were made to the number of outstanding share options and the exercise price. The exercise price per share of the share options was adjusted from HK$14.158 to HK$14.145 on 29 December 2015, and further to HK$14.137 on 16 May 2016.
(3) The interest of Mr Wilfried Ernst Kaffenberger, who retired as an independent non-executive director of the Company upon the conclusion of the annual general meeting of the Company held on 17 November 2015 (the “2015 AGM”), was re-classified as eligible participants’ interest on the date of his retirement.
(4) The cash consideration paid by each of the directors for the grant of share options was HK$10.
ANNUAL REPORT 2016 77
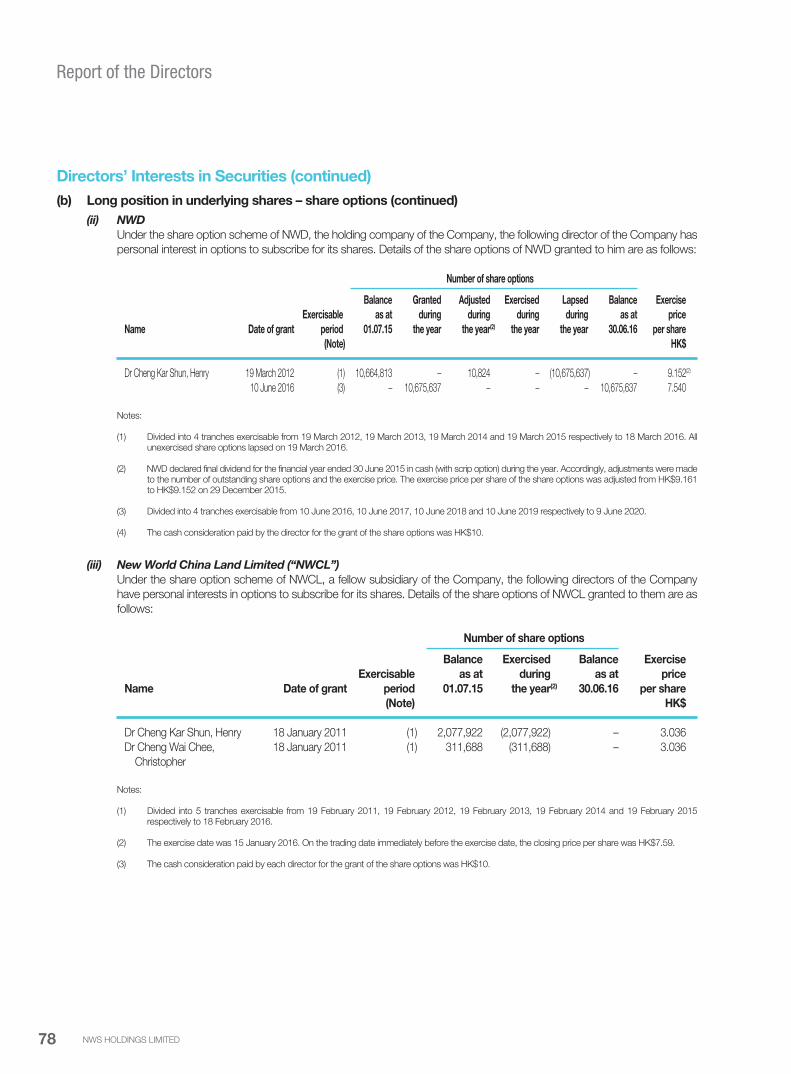
Report of the Directors
Directors’ Interests in Securities (continued)
(b) Long position in underlying shares – share options (continued)
(ii) NWD
Under the share option scheme of NWD, the holding company of the Company, the following director of the Company has
personal interest in options to subscribe for its shares. Details of the share options of NWD granted to him are as follows:
Number of share options
Balance Granted Adjusted Exercised Lapsed Balance Exercise
Exercisable as at during during during during as at price
Name Date of grant period 01.07.15 the year the year(2) the year the year 30.06.16 per share
(Note) HK$
Dr Cheng Kar Shun, Henry 19 March 2012 (1) 10,664,813 – 10,824 – (10,675,637) – 9.152(2)
10 June 2016 (3) – 10,675,637 – – – 10,675,637 7.540
Notes:
(1) Divided into 4 tranches exercisable from 19 March 2012, 19 March 2013, 19 March 2014 and 19 March 2015 respectively to 18 March 2016. All unexercised share options lapsed on 19 March 2016.
(2) NWD declared final dividend for the financial year ended 30 June 2015 in cash (with scrip option) during the year. Accordingly, adjustments were made to the number of outstanding share options and the exercise price. The exercise price per share of the share options was adjusted from HK$9.161 to HK$9.152 on 29 December 2015.
(3) Divided into 4 tranches exercisable from 10 June 2016, 10 June 2017, 10 June 2018 and 10 June 2019 respectively to 9 June 2020.
(4) The cash consideration paid by the director for the grant of the share options was HK$10.
(iii) New World China Land Limited (“NWCL”)
Under the share option scheme of NWCL, a fellow subsidiary of the Company, the following directors of the Company
have personal interests in options to subscribe for its shares. Details of the share options of NWCL granted to them are as
follows:
Number of share options
Balance Exercised Balance Exercise
Exercisable as at during as at price
Name Date of grant period 01.07.15 the year(2) 30.06.16 per share
(Note) HK$
Dr Cheng Kar Shun, Henry 18 January 2011 (1) 2,077,922 (2,077,922) – 3.036
Dr Cheng Wai Chee, 18 January 2011 (1) 311,688 (311,688) – 3.036
Christopher
Notes:
(1) Divided into 5 tranches exercisable from 19 February 2011, 19 February 2012, 19 February 2013, 19 February 2014 and 19 February 2015 respectively to 18 February 2016.
(2) The exercise date was 15 January 2016. On the trading date immediately before the exercise date, the closing price per share was HK$7.59.
(3) The cash consideration paid by each director for the grant of the share options was HK$10.
NWS HOLDINGS LIMITED78

Report of the Directors
Directors’ Interests in Securities (continued)
(c) Long position in debentures
(i) Rosy Unicorn Limited
The following director of the Company has interest in the US$500,000,000 6.50% guaranteed bonds due 2017 issued by
Rosy Unicorn Limited, an indirect wholly owned subsidiary of the Company. Details of his interest in such debentures are
as follows:
Approximate
percentage to
the total
Amount of debentures in US$ amount of
debentures
Personal Family Corporate in issue as at
Name interests interests interests Total 30.06.16
Mr William Junior Guilherme Doo – – 4,500,000(Note) 4,500,000 0.900%
Note: The debentures were held by companies wholly owned by Mr William Junior Guilherme Doo.
(ii) NWCL
The following director of the Company has interest in the debentures issued by NWCL, which include the
RMB3,000,000,000 5.50% bonds due 2018 and the US$900,000,000 5.375% notes due 2019 under its
US$1,500,000,000 medium term note programme. Details of his interest in such debentures are as follows:
Approximate
percentage to
the total
Amount of debentures in RMB amount of
debentures
Personal Family Corporate in issue as at
Name interests interests interests Total 30.06.16
Mr William Junior Guilherme Doo – – 27,628,000(Note) 27,628,000 0.295%
Note: The debentures were held by a company wholly owned by Mr William Junior Guilherme Doo of which RMB6,128,000 debentures were issued in US$ and had been translated into RMB using the rate of US$1 = RMB6.128.
ANNUAL REPORT 2016 79

Report of the Directors
Directors’ Interests in Securities (continued)
(c) Long position in debentures (continued)
(iii) Fita International Limited
The following director of the Company has interest in the US$750,000,000 7.00% guaranteed bonds due 2020 issued by
Fita International Limited, a fellow subsidiary of the Company. Details of his interest in such debentures are as follows:
Approximate
percentage to
the total
Amount of debentures in US$ amount of
debentures
Personal Family Corporate in issue as at
Name interests interests interests Total 30.06.16
Mr William Junior Guilherme Doo – – 3,000,000(Note) 3,000,000 0.400%
Note: The debentures were held by a company wholly owned by Mr William Junior Guilherme Doo.
(iv) NWD (MTN) Limited
The following director of the Company has interest in debentures issued under the medium term notes programme of NWD
(MTN) Limited, a fellow subsidiary of the Company. Details of his interest in such debentures are as follows:
Approximate
percentage to
the total
Amount of debentures in US$ amount of
debentures
Personal Family Corporate in issue as at
Name interests interests interests Total 30.06.16
Mr William Junior Guilherme Doo – – 2,000,000(Note) 2,000,000 0.078%
Note: The debentures were held by a company wholly owned by Mr William Junior Guilherme Doo.
Save as disclosed above, as at 30 June 2016, none of the directors or chief executive had or deemed to have any interest or short
position in the shares, underlying shares and debentures of the Company and any of its associated corporations as defined in the SFO
that were required to be entered into the register kept by the Company pursuant to Section 352 of the SFO or were required to be
notified to the Company and the Hong Kong Stock Exchange pursuant to the Model Code for Securities Transactions by Directors of
Listed Issuers as contained in Appendix 10 of the Listing Rules.
NWS HOLDINGS LIMITED80
Report of the Directors
Share Option SchemeThe existing share option scheme of the Company (the “Scheme”) was adopted at the annual general meeting of the Company held
on 21 November 2011. Summary of the Scheme disclosed in accordance with the Listing Rules is as follows:
Purpose of the Scheme To reward directors and employees of the Group for their past service or performance;
providing incentive and motivation or reward to eligible participants for optimizing their
performance or making contribution to the Group; attracting and retaining persons of right
caliber with the necessary experience to work for or make contribution to the Group; and
fostering a sense of corporate identity.
Participants of the Scheme Eligible participant may be a person or an entity belonging to any of the following classes:
(i) any eligible employee;
(ii) any non-executive director (including independent non-executive director) of the
Group or any invested entity of the Group (“Invested Entity”);
(iii) any supplier of goods or services to any member of the Group or any Invested Entity;
(iv) any customer of any member of the Group or any Invested Entity;
(v) any person or entity that provides research, development or other technological
support to the Group or any Invested Entity;
(vi) any shareholder of any member of the Group or any Invested Entity or any holder of
any securities issued by any member of the Group or any Invested Entity;
(vii) any adviser (professional or otherwise) or consultant to any area of business or
business development of any member of the Group or any Invested Entity; and
(viii) any joint venture partner or business alliance that co-operates with any member of
the Group or any Invested Entity in any area of business operation or development.
Total number of shares available
for issue under the Scheme and
percentage of the issued shares as at
the date of this report
The Company had granted share options to certain eligible participants to subscribe for
a total of 55,560,071 shares of the Company under the Scheme, which include certain
adjustments made pursuant to the rules of the Scheme, up to the date of this report.
The total number of shares available for issue under the Scheme is 284,020,370 shares,
representing approximately 7.41% of the Company’s total number of issued shares as at
the date of this report.
Maximum entitlement of each
participant under the Scheme
Unless approved by shareholders of the Company, the total number of shares issued and to
be issued upon exercise of the share options granted to each eligible participant (including
both exercised and outstanding options) in any 12-month period must not exceed 1% of
the total number of shares of the Company in issue.
The period within which the shares
must be taken up under an option
At any time during a period as specified by the directors, however in any event the share
options must be exercised within 10 years from the date of grant.
The minimum period for which an
option must be held before it can be
exercised
Any period as determined by the directors.
ANNUAL REPORT 2016 81

Report of the Directors
The amount payable on application
or acceptance of the option and the
period within which payments or calls
must or may be made or loans for such
purposes must be paid
HK$10 is to be paid as consideration for the grant of option within 14 days from the date of
offer.
The basis of determining the exercise
price
The exercise price is determined by the directors which must be at least the highest of:
(i) the closing price of the share as stated in the Hong Kong Stock Exchange’s daily
quotations sheet on the date of grant; (ii) the average closing price of the share as stated
in the Hong Kong Stock Exchange’s daily quotations sheets for the five dealing days
immediately preceding the date of grant; and (iii) the nominal value of the share.
The remaining life of the Scheme The Scheme shall be valid and effective for a period of 10 years from the date of adoption,
i.e. 21 November 2011.
During the year ended 30 June 2016, movement of share options granted by the Company under the Scheme is as follows:
(1) Details of the movement of share options granted to directors of the Company are disclosed under the section headed “Directors’
Interests in Securities” above.
(2) Details of the movement of share options granted to other eligible participants are as follows:
Number of share options
Balance Granted Adjusted Exercised Re-classified Lapsed Balance Exercise
Exercisable as at during during during during during as at price per
Date of grant period 01.07.15 the year the year(2) the year the year the year 30.06.16 share(2)
(Note) HK$
9 March 2015 (1) 24,173,487 – 37,666 – 1,400,204(3) (284,248) 25,327,109 14.137
Notes:
(1) 60% of the share options are exercisable from 9 May 2015 to 8 March 2020 while the remaining 40% of the share options are divided into 2 tranches exercisable from 9 March 2016 and 9 March 2017 respectively to 8 March 2020.
(2) The Company declared final dividend for the year ended 30 June 2015 and interim dividend for the six months ended 31 December 2015 in scrip form (with cash option) during the year. Accordingly, adjustments were made to the number of outstanding share options and the exercise price. The exercise price per share of the share options was adjusted from HK$14.158 to HK$14.145 on 29 December 2015, and further to HK$14.137 on 16 May 2016.
(3) The interest of Mr Wilfried Ernst Kaffenberger, who retired as an independent non-executive director of the Company upon the conclusion of the 2015 AGM, was re-classified as eligible participants’ interest on the date of his retirement.
(4) The consideration paid by each eligible participant for the grant of share options was HK$10.
Share Option Scheme (continued)
NWS HOLDINGS LIMITED82

Report of the Directors
Substantial Shareholders’ Interest in SecuritiesAs at 30 June 2016, the following parties (other than a director or chief executive of the Company) were recorded in the register kept
by the Company under Section 336 of the SFO as being directly or indirectly interested or deemed to be interested in 5% or more of
the issued share capital of the Company:
Approximate
Number of shares percentage to
the issued share
Beneficial Corporate capital of the
Name interests interests Total Company
Cheng Yu Tung Family (Holdings) Limited – 2,446,682,308(1) 2,446,682,308 63.85%
Cheng Yu Tung Family (Holdings II) Limited – 2,446,682,308(2) 2,446,682,308 63.85%
Chow Tai Fook Capital Limited – 2,446,682,308(3) 2,446,682,308 63.85%
Chow Tai Fook (Holding) Limited – 2,446,682,308(4) 2,446,682,308 63.85%
CTF Enterprises 97,034,424 2,349,647,884(5) 2,446,682,308 63.85%
NWD 1,572,899,022 776,748,862(6) 2,349,647,884 61.32%
Mombasa Limited 706,667,321 – 706,667,321 18.44%
Notes:
(1) Cheng Yu Tung Family (Holdings) Limited held approximately 48.98% direct interest in Chow Tai Fook Capital Limited (“CTFC”) and was accordingly deemed to have an interest in the shares deemed to be interested by CTFC.
(2) Cheng Yu Tung Family (Holdings II) Limited held approximately 46.65% direct interest in CTFC and was accordingly deemed to have an interest in the shares deemed to be interested by CTFC.
(3) CTFC held approximately 78.58% direct interest in Chow Tai Fook (Holding) Limited (“CTFH”) and was accordingly deemed to have an interest in the shares deemed to be interested by CTFH.
(4) CTFH held 100% direct interest in CTF Enterprises and was accordingly deemed to have an interest in the shares interested by or deemed to be interested by CTF Enterprises.
(5) CTF Enterprises, together with its subsidiaries, held more than one-third of the issued shares of NWD and was accordingly deemed to have an interest in the shares interested by or deemed to be interested by NWD.
(6) NWD held 100% indirect interest in Mombasa Limited and was accordingly deemed to have an interest in the shares held by Mombasa Limited in the Company. NWD was also deemed to be interested in 2,979,975 shares held by Financial Concepts Investment Limited, 33,550,783 shares each held by Hing Loong Limited and Fine Reputation Incorporated respectively, all of them are subsidiaries of NWD.
(7) All the interests stated above represented long positions.
Save as disclosed above, there was no other interest recorded in the register that is required to be kept under Section 336 of the SFO
as at 30 June 2016.
Sufficiency of Public FloatAccording to information that is available to the Company, the percentage of the Company’s shares which are in the hands of the public
exceeds 25% of the Company’s total number of issued shares during the year and up to the date of this report.
ANNUAL REPORT 2016 83
Report of the Directors
Connected TransactionsThe Company has entered into the following connected transactions during the year and up to the date of this report:
(1) On 11 April 2014, a master services agreement was entered into between the Company and CTF Enterprises (the “CTF
Enterprises Master Services Agreement”) whereby each of the Company and CTF Enterprises agreed to, and agreed to procure
that members of the Group or the CTF Enterprises Group (being (a) CTF Enterprises; (b) any other company which is its subsidiary
or holding company or is a fellow subsidiary of any such holding company; (c) any other company in the equity capital of which
CTF Enterprises and/or such other companies referred to in (b) above taken together are or will be directly or indirectly interested
so as to exercise or control the exercise of 30% (or such other amount as may from time to time be specified in the Code on
Takeovers and Mergers (the “Takeovers Code”) as being the level for triggering a mandatory general offer) or more of the voting
power at general meetings from time to time or to control the composition of a majority of the board of directors; and (d) the
subsidiaries of such other companies referred to in (b) and (c) above, but excluding members of the NWD Group (as defined in
(2) below) and the Group) (to the extent practicable), engage relevant members of the CTF Enterprises Group or the Group to
provide certain operational services to relevant members of the Group or the CTF Enterprises Group during the term of the CTF
Enterprises Master Services Agreement.
As at the date of signing of the CTF Enterprises Master Services Agreement, CTF Enterprises held approximately 42.89% of
the total issued share capital of NWD and approximately 2.61% of the total issued share capital of the Company. NWD held
approximately 61.30% of the total issued share capital of the Company. Accordingly, CTF Enterprises was regarded as a
connected person of the Company under the Listing Rules. Thus, the CTF Enterprises Master Services Agreement and all the
transactions contemplated thereunder constituted continuing connected transactions of the Company under the Listing Rules.
The CTF Enterprises Master Services Agreement and the transactions contemplated thereunder were approved by the
independent shareholders at the special general meeting of the Company held on 22 May 2014 (the “SGM”). The CTF Enterprises
Master Services Agreement has an initial term of three years commencing from 1 July 2014. Subject to re-compliance with the
reporting, announcement and independent shareholders’ approval requirements under the Listing Rules at the relevant time, the
CTF Enterprises Master Services Agreement may be renewed for a further term of three years.
During the year ended 30 June 2016, the contract amounts for the operational services under the CTF Enterprises Master
Services Agreement are summarized as follows:
Approximate total
Categories contract sum Annual cap
HK$’m HK$’m
Operational services by members of the Group
to members of the CTF Enterprises Group 55.6 865.4
Operational services by members of the CTF Enterprises Group
to members of the Group 0.9 1.6
NWS HOLDINGS LIMITED84
Report of the Directors
Connected Transactions (continued)(2) On 11 April 2014, a master services agreement was entered into between the Company and NWD (the “NWD Master Services
Agreement”) whereby each of the Company and NWD agreed to, and agreed to procure that members of the Group or the NWD
Group (being NWD, its subsidiaries, any other company in the equity capital of which NWD and/or any of its subsidiaries taken
together are or will be directly or indirectly interested so as to exercise or control the exercise of 30% (or such other amount as
may from time to time be specified in the Takeovers Code as being the level for triggering a mandatory general offer) or more
of the voting power at general meetings from time to time or to control the composition of a majority of the board of directors,
and the subsidiaries of such other companies, but excluding members of the Group) (to the extent practicable), engage relevant
members of the NWD Group or the Group to provide certain operational services to relevant members of the Group or the NWD
Group during the term of the NWD Master Services Agreement.
As at the date of signing of the NWD Master Services Agreement, NWD held approximately 61.30% of the total issued
share capital of the Company and was a substantial shareholder of the Company. Accordingly, NWD was regarded as a
connected person of the Company under the Listing Rules. Thus, the NWD Master Services Agreement and all the transactions
contemplated thereunder constituted continuing connected transactions of the Company under the Listing Rules.
The NWD Master Services Agreement and the transactions contemplated thereunder were approved by the independent
shareholders at the SGM. The NWD Master Services Agreement has an initial term of three years commencing from 1 July 2014.
Subject to re-compliance with the reporting, announcement and independent shareholders’ approval requirements under the
Listing Rules at the relevant time, the NWD Master Services Agreement may be renewed for a further term of three years.
During the year ended 30 June 2016, the contract amounts for the operational services under the NWD Master Services
Agreement are summarized as follows:
Approximate total
Categories contract sum Annual cap
HK$’m HK$’m
Operational services by members of the Group
to members of the NWD Group 7,988.4 14,506.5
Operational services by members of the NWD Group
to members of the Group 80.4 117.1
ANNUAL REPORT 2016 85
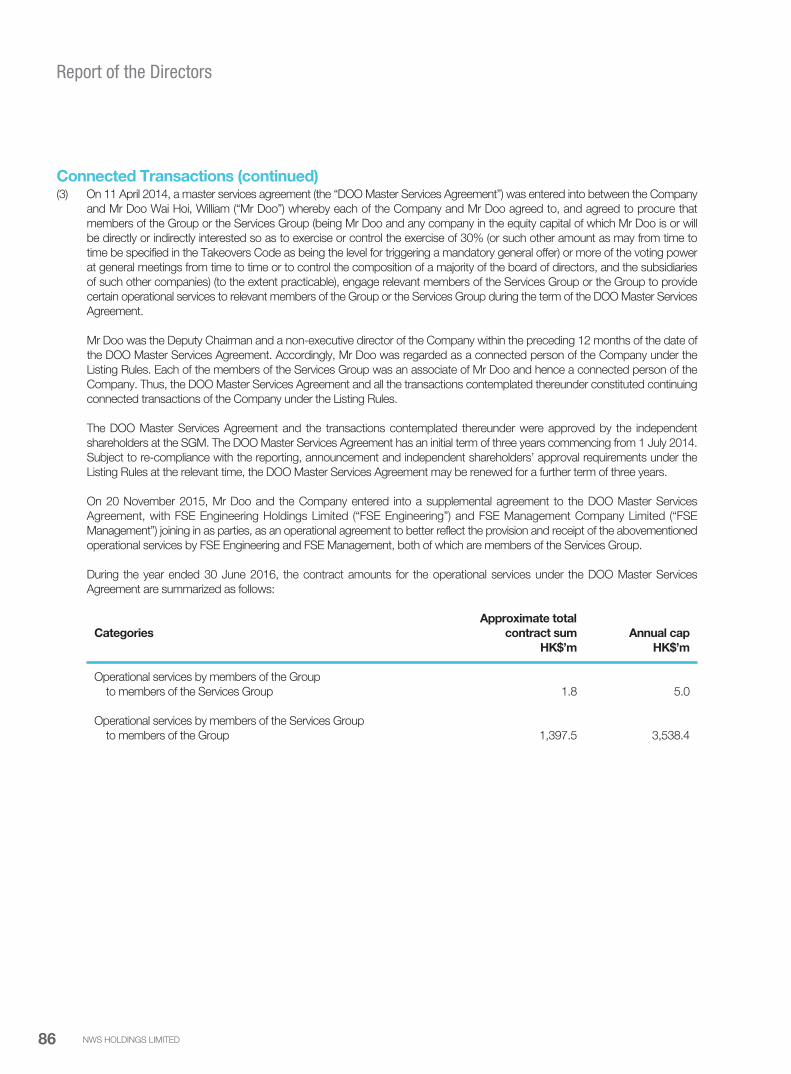
Report of the Directors
Connected Transactions (continued)(3) On 11 April 2014, a master services agreement (the “DOO Master Services Agreement”) was entered into between the Company
and Mr Doo Wai Hoi, William (“Mr Doo”) whereby each of the Company and Mr Doo agreed to, and agreed to procure that
members of the Group or the Services Group (being Mr Doo and any company in the equity capital of which Mr Doo is or will
be directly or indirectly interested so as to exercise or control the exercise of 30% (or such other amount as may from time to
time be specified in the Takeovers Code as being the level for triggering a mandatory general offer) or more of the voting power
at general meetings from time to time or to control the composition of a majority of the board of directors, and the subsidiaries
of such other companies) (to the extent practicable), engage relevant members of the Services Group or the Group to provide
certain operational services to relevant members of the Group or the Services Group during the term of the DOO Master Services
Agreement.
Mr Doo was the Deputy Chairman and a non-executive director of the Company within the preceding 12 months of the date of
the DOO Master Services Agreement. Accordingly, Mr Doo was regarded as a connected person of the Company under the
Listing Rules. Each of the members of the Services Group was an associate of Mr Doo and hence a connected person of the
Company. Thus, the DOO Master Services Agreement and all the transactions contemplated thereunder constituted continuing
connected transactions of the Company under the Listing Rules.
The DOO Master Services Agreement and the transactions contemplated thereunder were approved by the independent
shareholders at the SGM. The DOO Master Services Agreement has an initial term of three years commencing from 1 July 2014.
Subject to re-compliance with the reporting, announcement and independent shareholders’ approval requirements under the
Listing Rules at the relevant time, the DOO Master Services Agreement may be renewed for a further term of three years.
On 20 November 2015, Mr Doo and the Company entered into a supplemental agreement to the DOO Master Services
Agreement, with FSE Engineering Holdings Limited (“FSE Engineering”) and FSE Management Company Limited (“FSE
Management”) joining in as parties, as an operational agreement to better reflect the provision and receipt of the abovementioned
operational services by FSE Engineering and FSE Management, both of which are members of the Services Group.
During the year ended 30 June 2016, the contract amounts for the operational services under the DOO Master Services
Agreement are summarized as follows:
Approximate total
Categories contract sum Annual cap
HK$’m HK$’m
Operational services by members of the Group
to members of the Services Group 1.8 5.0
Operational services by members of the Services Group
to members of the Group 1,397.5 3,538.4
NWS HOLDINGS LIMITED86

Report of the Directors
Connected Transactions (continued)(4) On 24 September 2015, an agreement (the “Agreement”) was entered into between Catchy Investments Limited (“Catchy”) as
vendor and Hip Hing Construction Holdings Limited (“HHCH”, an indirect wholly owned subsidiary of the Company) as purchaser
and pursuant to which, Catchy agreed to sell and HHCH agreed to purchase one share of par value of US$1.00 in the share
capital of Next Jubilee Holdings Limited (“Next Jubilee”, whose main assets were the office units nos. 1 to 20 on the eleventh floor
of Chevalier Commercial Centre at No. 8 Wang Hoi Road, Kowloon Bay, Kowloon, Hong Kong) and to assign the outstanding
shareholder’s loan in the amount of HK$154,016,995.82 of Next Jubilee owed to Catchy immediately prior to the completion of
the Agreement at the total consideration of HK$261,855,950.69.
As at the date of signing of the Agreement, NWD was interested in approximately 61.32% of the total issued share capital of the
Company and Catchy was a direct wholly owned subsidiary of NWD. Catchy was therefore a connected person of the Company
and the transaction contemplated under the Agreement constituted a connected transaction of the Company under the Listing
Rules.
Completion of the Agreement took place on 24 September 2015.
(5) On 10 December 2015, CTF Enterprises, Razor Zenith Limited (“RZL”, a wholly owned subsidiary of CTF Enterprises), NWS
Ports Management Limited (a direct wholly owned subsidiary of the Company), Flying Gravity Limited (“FGL”, an indirect wholly
owned subsidiary of the Company) and Silverway Global Limited (“SGL”) (collectively, the “Parties”) entered into a shareholders
agreement (the “Shareholders Agreement”) to regulate the respective rights and obligations of RZL and FGL towards the
management of SGL. The entire issued share capital of SGL is owned as to 50% by RZL and 50% by FGL. Pursuant to the
Shareholders Agreement, it was agreed that SGL shall, subject to the satisfaction of certain conditions precedent, establish a joint
venture with Aviation Capital Group Corp. (“ACG”, a company established in USA engaged in the business of aircraft leasing), in
which SGL shall hold 80% of the shares and ACG shall hold the remaining 20% of the shares of the same class.
On 8 March 2016, Bauhinia Aviation Capital Limited was established as the joint venture between SGL and ACG as contemplated
under the Shareholders Agreement and owned as to 80% by SGL and 20% by ACG. Pursuant to a supplemental agreement
to the Shareholders Agreement (the “Supplemental Agreement”) entered into among the Parties on 8 March 2016, the Parties
agreed that the total capital commitment (whether equity, loan or otherwise and including any guarantee or indemnity in
connection with the establishment of SGL) of each of RZL and FGL towards SGL shall be increased from US$4.0 million to
US$240.0 million.
As at the date of signing of the Supplemental Agreement, RZL was wholly owned by CTF Enterprises and CTF Enterprises held
approximately 43.87% of the total issued share capital of NWD and approximately 2.55% of the total issued share capital of the
Company. NWD held approximately 61.33% of the total issued share capital of the Company. Accordingly, the formation of a joint
venture between RZL and FGL through SGL and the increase of the total capital commitment in SGL pursuant to the terms of the
Shareholders Agreement and the Supplemental Agreement and the performance of the transactions contemplated thereunder
constituted a connected transaction of the Company under the Listing Rules.
ANNUAL REPORT 2016 87
Report of the Directors
Connected Transactions (continued)(6) On 6 January 2016, NWD, Easywin Enterprises Corporation Limited (the “Offeror”) and NWCL issued an announcement jointly
in relation to (i) the voluntary conditional cash offer by The Hongkong and Shanghai Banking Corporation Limited (“HSBC”) on
behalf of the Offeror to acquire all of the issued shares of NWCL (“NWCL Shares”) (other than those already held by the Offeror and
NWD) (the “Share Offer”); and (ii) the voluntary conditional cash offer by HSBC on behalf of the Offeror to the holders of NWCL’s
share options to cancel all the outstanding share options of NWCL held by them.
On 11 March 2016, High Earnings Holdings Limited (“High Earnings”, a wholly owned subsidiary of the Company) tendered
its acceptance of the Share Offer (the “Acceptance”) in respect of 93,073,738 NWCL Shares held by it by returning the duly
completed and signed form of acceptance and transfer in respect of the Share Offer together with the relevant documents
to the Hong Kong branch share registrar of NWCL. Based on the price of the Share Offer of HK$7.80 per offer share of
NWCL, the aggregate consideration paid by the Offeror for the 93,073,738 NWCL Shares held by High Earnings amounted
to HK$725,975,156.40 (before deduction of seller’s ad valorem stamp duty). The relevant consideration was received by High
Earnings on 1 April 2016.
As at the date of the Acceptance, the Offeror was a wholly owned subsidiary of NWD. NWD was interested in approximately
61.33% of the total issued share capital of the Company. Accordingly, the Offeror was regarded as a connected person of the
Company and the Acceptance constituted a connected transaction for the Company under the Listing Rules.
The price and terms of the continuing connected transactions mentioned in (1) to (3) above have been determined in accordance with
the pricing policies and guidelines as set out in the circular of the Company dated 5 May 2014. These continuing connected transactions
have been reviewed by the independent non-executive directors of the Company who have confirmed that the transactions have been
entered into:
(a) in the ordinary and usual course of business of the Group;
(b) on normal commercial terms or better;
(c) according to the relevant agreements governing them on terms that are fair and reasonable and in the interests of the
shareholders of the Company as a whole; and
(d) within the caps as set out in the relevant circular.
The Company’s auditor was engaged to report on the Group’s continuing connected transactions in accordance with Hong Kong
Standard on Assurance Engagements 3000 (Revised) “Assurance Engagements Other Than Audits or Reviews of Historical Financial
Information” and with reference to Practice Note 740 “Auditor’s Letter on Continuing Connected Transactions under the Listing Rules”
issued by the Hong Kong Institute of Certified Public Accountants. The auditor has issued an unqualified letter containing their findings
and conclusions in respect of the continuing connected transactions disclosed by the Company in this annual report in accordance with
Rule 14A.56 of the Listing Rules. A copy of the auditor’s letter has been provided by the Company to the Hong Kong Stock Exchange.
Save as disclosed above, a summary of significant related party transactions made during the year, which included the abovesaid
connected transactions of the Company, is disclosed in note 39 to the financial statements.
NWS HOLDINGS LIMITED88

Report of the Directors
Disclosure pursuant to Rule 13.22 of the Listing RulesAs at 30 June 2016, the Group has provided financial assistance, by way of shareholders’ loans or advances, in the aggregate amount
of HK$6,871.0 million to its affiliated companies (included in amounts disclosed in notes 19, 20 and 24 to the financial statements),
guaranteed bank loans and other borrowing facilities for the benefit of the affiliated companies in the amount of HK$2,369.5 million
(included in the amounts disclosed in note 37 to the financial statements) and contracted to provide an aggregate amount of
HK$2,339.7 million in capital and/or loans to affiliated companies (included in the amounts disclosed in note 36 to the financial
statements). The said amounts, in aggregate, represent approximately 15.6% under the assets ratio as defined under Rule 14.07(1) of
the Listing Rules. Affiliated companies include associated companies and joint ventures of the Group.
The advances are unsecured, interest free and have no definite repayment terms except for (i) an aggregate amount of
HK$104.7 million which carries interest at 8% per annum; (ii) an amount of HK$12.2 million which carries interest at Hong Kong
prime rate; (iii) an amount of HK$1,562.3 million which carries interest at 6-month HIBOR plus a margin of 1.3% per annum
and is not repayable within the next 12 months from the end of the reporting period; (iv) an amount of HK$58.5 million which
carries interest at 12-month People’s Bank of China Rate; (v) an amount of HK$279.7 million which carries interest at 12-month
LIBOR plus a margin of 12.15% per annum and is repayable within the next 12 months from the end of the reporting period;
(vi) an amount of HK$1,344.5 million which is interest free and is repayable within the next 12 months from the end of the reporting period;
and (vii) an amount of HK$169.6 million which is interest free and is not repayable within the next 12 months from the end of the reporting
period. The advances also include an aggregate amount of HK$197.5 million which has been subordinated to certain indebtedness of an
affiliated company. Contracted capital and loan contributions to affiliated companies would be funded by internally generated resources
and banking facilities of the Group.
Pursuant to Rule 13.22 of the Listing Rules, a proforma combined statement of financial position of those affiliated companies with
financial assistance from the Group and the Group’s attributable interest in those affiliated companies as at 30 June 2016 are presented
as follows:
Proforma combined Group’s
statement of attributable
financial position interest
HK$’m HK$’m
Non-current assets 100,998.8 31,103.8
Current assets 15,001.1 4,752.1
Current liabilities (28,110.1) (10,299.9)
Non-current liabilities (33,209.4) (11,387.7)
54,680.4 14,168.3
The proforma combined statement of financial position of the affiliated companies is prepared by combining their statements of
financial position, after making adjustments to conform with the Group’s significant accounting policies and re-grouping into significant
classification in the statement of financial position, as at 30 June 2016.
Employees and Remuneration PoliciesAs at 30 June 2016, approximately 27,900 staff were employed by entities under the Group’s management of which approximately
11,100 staff were employed in Hong Kong. Total staff related costs, including provident funds, staff bonus and deemed share option
benefit but excluding directors’ remunerations, were HK$3.033 billion (2015: HK$2.645 billion). Remuneration packages including
salaries, bonuses and share options are granted to employees according to individual performance and are reviewed according to
general market conditions every year. Structured training programmes were provided to employees on an ongoing basis.
ANNUAL REPORT 2016 89

Report of the Directors
Five-Year Financial SummaryA summary of the results and of the assets and liabilities of the Group for the last five financial years is set out on pages 190 and 191.
AuditorThe financial statements for the year ended 30 June 2016 have been audited by PricewaterhouseCoopers, who will retire at the
forthcoming annual general meeting of the Company and, being eligible, will offer themselves for re-appointment.
On behalf of the Board
Dr Cheng Kar Shun, Henry
Chairman
Hong Kong, 20 September 2016
NWS HOLDINGS LIMITED90

TO THE SHAREHOLDERS OF NWS HOLDINGS LIMITED
(Incorporated in Bermuda with limited liability)
We have audited the consolidated financial statements of NWS Holdings Limited (the “Company”) and its subsidiaries
set out on pages 92 to 189, which comprise the consolidated statement of financial position as at 30 June 2016, and
the consolidated income statement, the consolidated statement of comprehensive income, the consolidated statement
of changes in equity and the consolidated statement of cash flows for the year then ended, and a summary of significant
accounting policies and other explanatory information.
Directors’ responsibility for the consolidated financial statementsThe Directors of the Company are responsible for the preparation of consolidated financial statements that give a true and
fair view in accordance with Hong Kong Financial Reporting Standards issued by the Hong Kong Institute of Certified Public
Accountants and the disclosure requirements of the Hong Kong Companies Ordinance, and for such internal control as the
Directors determine is necessary to enable the preparation of consolidated financial statements that are free from material
misstatement, whether due to fraud or error.
Auditor’s responsibilityOur responsibility is to express an opinion on these consolidated financial statements based on our audit and to report our
opinion solely to you, as a body, in accordance with Section 90 of the Companies Act 1981 of Bermuda and for no other
purpose. We do not assume responsibility towards or accept liability to any other person for the contents of this report.
We conducted our audit in accordance with Hong Kong Standards on Auditing issued by the Hong Kong Institute of
Certified Public Accountants. Those standards require that we comply with ethical requirements and plan and perform
the audit to obtain reasonable assurance about whether the consolidated financial statements are free from material
misstatement.
An audit involves performing procedures to obtain audit evidence about the amounts and disclosures in the consolidated
financial statements. The procedures selected depend on the auditor’s judgement, including the assessment of the risks
of material misstatement of the consolidated financial statements, whether due to fraud or error. In making those risk
assessments, the auditor considers internal control relevant to the entity’s preparation of consolidated financial statements
that give a true and fair view in order to design audit procedures that are appropriate in the circumstances, but not for the
purpose of expressing an opinion on the effectiveness of the entity’s internal control. An audit also includes evaluating the
appropriateness of accounting policies used and the reasonableness of accounting estimates made by the Directors, as well
as evaluating the overall presentation of the consolidated financial statements.
We believe that the audit evidence we have obtained is sufficient and appropriate to provide a basis for our audit opinion.
OpinionIn our opinion, the consolidated financial statements give a true and fair view of the financial position of the Company and its
subsidiaries as at 30 June 2016, and of their financial performance and cash flows for the year then ended in accordance
with Hong Kong Financial Reporting Standards and have been properly prepared in compliance with the disclosure
requirements of the Hong Kong Companies Ordinance.
PricewaterhouseCoopers
Certified Public Accountants
Hong Kong, 20 September 2016
ANNUAL REPORT 2016 91
Independent Auditor’s Report

NWS HOLDINGS LIMITED92
For the year ended 30 June
Consolidated Income Statement
2016 2015
Note HK$’m HK$’m
Revenue 6 29,497.8 24,491.8
Cost of sales (26,145.3) (21,341.1)
Gross profit 3,352.5 3,150.7
Other income/gains 7 1,701.0 1,774.2
General and administrative expenses (1,103.7) (1,014.4)
Operating profit 8 3,949.8 3,910.5
Finance costs 10 (621.4) (637.7)
Share of results of
Associated companies 6(b) 724.3 (946.4)
Joint ventures 6(b) 1,541.7 2,662.7
Profit before income tax 5,594.4 4,989.1
Income tax expenses 11 (632.9) (476.2)
Profit for the year 4,961.5 4,512.9
Attributable to
Shareholders of the Company 4,912.8 4,477.6
Non-controlling interests 48.7 35.3
4,961.5 4,512.9
Basic earnings per share attributable to the shareholders of the Company 13 HK$1.30 HK$1.19
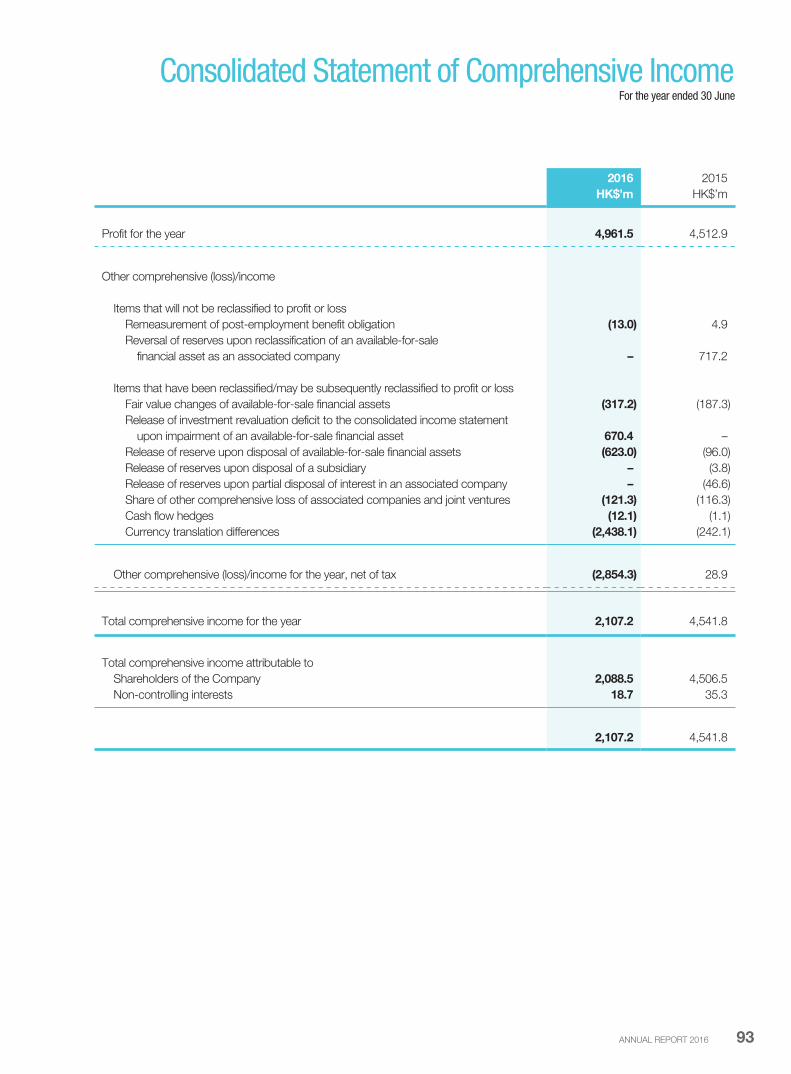
ANNUAL REPORT 2016 93
For the year ended 30 June
Consolidated Statement of Comprehensive Income
2016 2015
HK$’m HK$’m
Profit for the year 4,961.5 4,512.9
Other comprehensive (loss)/income
Items that will not be reclassified to profit or loss
Remeasurement of post-employment benefit obligation (13.0) 4.9
Reversal of reserves upon reclassification of an available-for-sale
financial asset as an associated company – 717.2
Items that have been reclassified/may be subsequently reclassified to profit or loss
Fair value changes of available-for-sale financial assets (317.2) (187.3)
Release of investment revaluation deficit to the consolidated income statement
upon impairment of an available-for-sale financial asset 670.4 –
Release of reserve upon disposal of available-for-sale financial assets (623.0) (96.0)
Release of reserves upon disposal of a subsidiary – (3.8)
Release of reserves upon partial disposal of interest in an associated company – (46.6)
Share of other comprehensive loss of associated companies and joint ventures (121.3) (116.3)
Cash flow hedges (12.1) (1.1)
Currency translation differences (2,438.1) (242.1)
Other comprehensive (loss)/income for the year, net of tax (2,854.3) 28.9
Total comprehensive income for the year 2,107.2 4,541.8
Total comprehensive income attributable to
Shareholders of the Company 2,088.5 4,506.5
Non-controlling interests 18.7 35.3
2,107.2 4,541.8

NWS HOLDINGS LIMITED94
As at 30 June
Consolidated Statement of Financial Position
2016 2015
Note HK$’m HK$’m
ASSETS
Non-current assets
Investment properties 15 1,612.6 3,944.0
Property, plant and equipment 16 1,034.7 658.4
Intangible concession rights 17 13,006.7 14,904.0
Intangible assets 18 386.9 423.9
Associated companies 19 14,947.7 13,480.4
Joint ventures 20 18,122.5 18,277.5
Available-for-sale financial assets 21 1,512.5 2,602.5
Other non-current assets 22 1,036.8 1,015.1
51,660.4 55,305.8
Current assets
Inventories 23 395.7 436.9
Trade and other receivables 24 10,909.2 8,988.6
Available-for-sale financial asset 21 30.0 –
Cash and bank balances 26 8,923.6 10,422.3
20,258.5 19,847.8
Assets held-for-sale 27 3,766.1 –
Total assets 75,685.0 75,153.6
EQUITY
Share capital 29 3,832.0 3,775.4
Reserves 30 41,786.9 41,638.0
Shareholders’ funds 45,618.9 45,413.4
Non-controlling interests 239.5 774.3
Total equity 45,858.4 46,187.7

ANNUAL REPORT 2016 95
As at 30 June
Consolidated Statement of Financial Position
2016 2015
Note HK$’m HK$’m
LIABILITIES
Non-current liabilities
Borrowings 31 9,251.7 13,487.0
Deferred tax liabilities 32 2,109.3 2,378.3
Other non-current liabilities 33 215.0 351.7
11,576.0 16,217.0
Current liabilities
Borrowings 31 5,813.1 3,324.4
Trade and other payables 34 12,035.9 9,055.2
Taxation 318.3 369.3
18,167.3 12,748.9
Liabilities directly associated with assets held-for-sale 27 83.3 –
Total liabilities 29,826.6 28,965.9
Total equity and liabilities 75,685.0 75,153.6
Dr Cheng Kar Shun, Henry Mr Tsang Yam Pui
Director Director
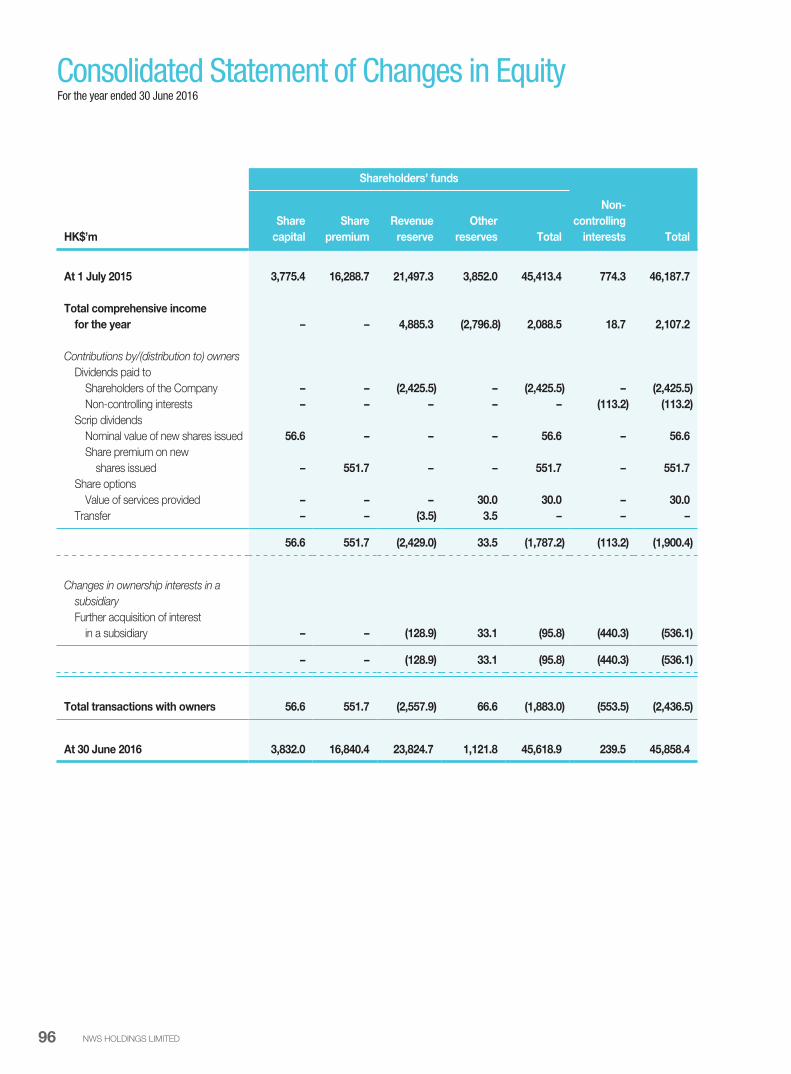
NWS HOLDINGS LIMITED96
For the year ended 30 June 2016
Consolidated Statement of Changes in Equity
Shareholders’ funds
HK$’m
Share
capital
Share
premium
Revenue
reserve
Other
reserves Total
Non-
controlling
interests Total
At 1 July 2015 3,775.4 16,288.7 21,497.3 3,852.0 45,413.4 774.3 46,187.7
Total comprehensive income
for the year – – 4,885.3 (2,796.8) 2,088.5 18.7 2,107.2
Contributions by/(distribution to) owners
Dividends paid to
Shareholders of the Company – – (2,425.5) – (2,425.5) – (2,425.5)
Non-controlling interests – – – – – (113.2) (113.2)
Scrip dividends
Nominal value of new shares issued 56.6 – – – 56.6 – 56.6
Share premium on new
shares issued – 551.7 – – 551.7 – 551.7
Share options
Value of services provided – – – 30.0 30.0 – 30.0
Transfer – – (3.5) 3.5 – – –
56.6 551.7 (2,429.0) 33.5 (1,787.2) (113.2) (1,900.4)
Changes in ownership interests in a
subsidiary
Further acquisition of interest
in a subsidiary – – (128.9) 33.1 (95.8) (440.3) (536.1)
– – (128.9) 33.1 (95.8) (440.3) (536.1)
Total transactions with owners 56.6 551.7 (2,557.9) 66.6 (1,883.0) (553.5) (2,436.5)
At 30 June 2016 3,832.0 16,840.4 23,824.7 1,121.8 45,618.9 239.5 45,858.4

ANNUAL REPORT 2016 97
For the year ended 30 June 2015
Consolidated Statement of Changes in Equity
Shareholders’ funds
HK$’m
Share
capital
Share
premium
Revenue
reserve
Other
reserves Total
Non-
controlling
interests Total
At 1 July 2014 3,741.9 15,880.0 18,894.2 3,700.3 42,216.4 827.0 43,043.4
Total comprehensive income for
the year – – 4,453.3 53.2 4,506.5 35.3 4,541.8
Contributions by/(distribution to) owners
Dividends paid to
Shareholders of the Company – – (1,837.5) – (1,837.5) – (1,837.5)
Non-controlling interests – – – – – (88.0) (88.0)
Scrip dividends
Nominal value of new shares issued 33.5 – – – 33.5 – 33.5
Share premium on new
shares issued – 408.7 – – 408.7 – 408.7
Share options
Value of services provided – – – 85.8 85.8 – 85.8
Transfer – – (12.7) 12.7 – – –
Total transactions with owners 33.5 408.7 (1,850.2) 98.5 (1,309.5) (88.0) (1,397.5)
At 30 June 2015 3,775.4 16,288.7 21,497.3 3,852.0 45,413.4 774.3 46,187.7

NWS HOLDINGS LIMITED98
For the year ended 30 June
Consolidated Statement of Cash Flows
2016 2015
Note HK$’m HK$’m
Cash flows from operating activities
Net cash generated from operations 38(a) 4,598.0 3,520.5
Finance costs paid (542.6) (554.3)
Interest received 287.5 406.0
Hong Kong profits tax paid (296.0) (73.2)
Mainland China and overseas taxation paid (453.4) (504.3)
Net cash generated from operating activities 3,593.5 2,794.7
Cash flows from investing activities
Dividends received from associated companies 609.2 258.1
Dividends received from joint ventures 1,289.4 3,524.9
Disposal of a joint venture 189.5 –
Disposal of a subsidiary 38(c) 95.0 3.4
Increase in investments in and advances to associated companies (1,902.9) (3,853.1)
Increase in investments in and advances to joint ventures (1,073.2) (67.7)
Refund of deposits from potential investments – 2,375.0
Additions of investment properties, property, plant and equipment (548.9) (237.3)
Additions of intangible concession rights (122.1) (43.3)
Addition of an available-for-sale financial asset (54.3) (30.0)
Disposal of property, plant and equipment 1.2 62.5
Disposal of available-for-sale financial assets and a financial asset
at fair value through profit or loss 836.3 386.9
Disposal of intangible concession rights and their related assets and liabilities 156.5 –
Disposal of an asset held-for-sale 22.8 –
Dividends received from available-for-sale financial assets 65.8 3.5
Decrease in other non-current assets 4.1 1.4
(Increase)/decrease in short-term bank deposits maturing after
more than three months (26.6) 1.3
Net cash (used in)/from investing activities (458.2) 2,385.6
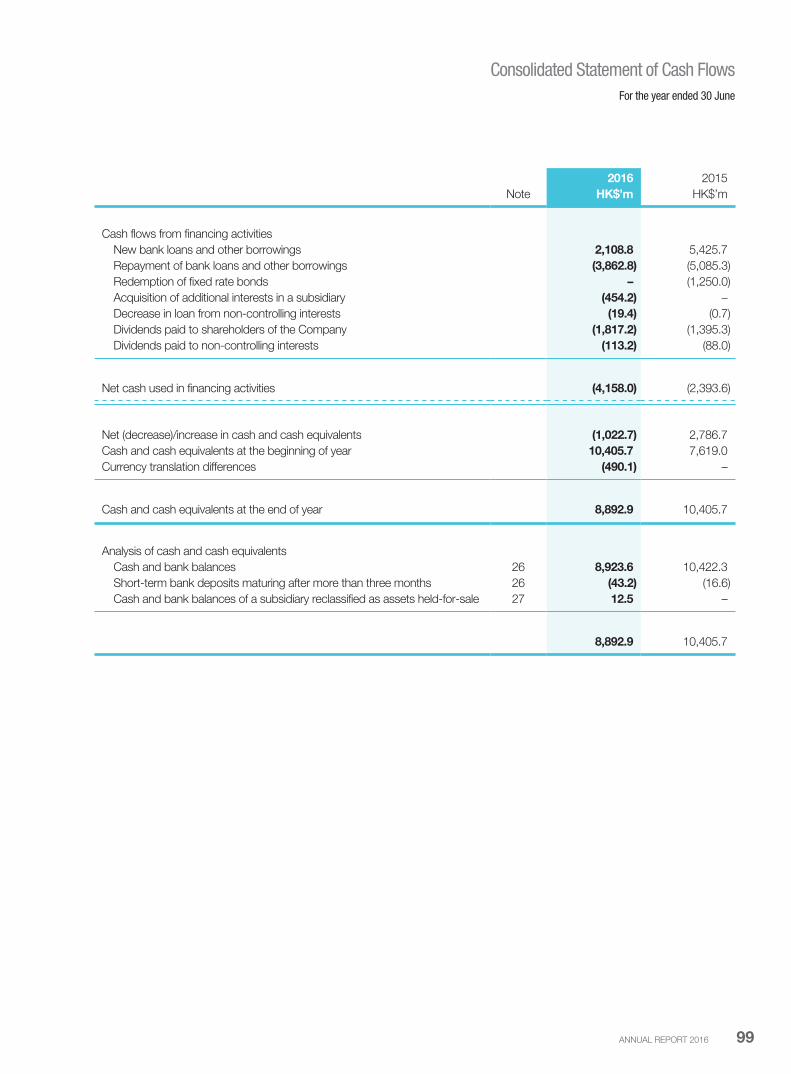
ANNUAL REPORT 2016 99
For the year ended 30 June
Consolidated Statement of Cash Flows
2016 2015
Note HK$’m HK$’m
Cash flows from financing activities
New bank loans and other borrowings 2,108.8 5,425.7
Repayment of bank loans and other borrowings (3,862.8) (5,085.3)
Redemption of fixed rate bonds – (1,250.0)
Acquisition of additional interests in a subsidiary (454.2) –
Decrease in loan from non-controlling interests (19.4) (0.7)
Dividends paid to shareholders of the Company (1,817.2) (1,395.3)
Dividends paid to non-controlling interests (113.2) (88.0)
Net cash used in financing activities (4,158.0) (2,393.6)
Net (decrease)/increase in cash and cash equivalents (1,022.7) 2,786.7
Cash and cash equivalents at the beginning of year 10,405.7 7,619.0
Currency translation differences (490.1) –
Cash and cash equivalents at the end of year 8,892.9 10,405.7
Analysis of cash and cash equivalents
Cash and bank balances 26 8,923.6 10,422.3
Short-term bank deposits maturing after more than three months 26 (43.2) (16.6)
Cash and bank balances of a subsidiary reclassified as assets held-for-sale 27 12.5 –
8,892.9 10,405.7

NWS HOLDINGS LIMITED100
Notes to the Financial Statements
1 General InformationNWS Holdings Limited (the “Company”) is a limited liability company incorporated in Bermuda. The address of its registered
office is Clarendon House, 2 Church Street, Hamilton HM 11, Bermuda.
The principal activity of the Company is investment holding.
The principal activities of its subsidiaries include:
(a) the development, investment, operation and/or management of roads, environmental projects, commercial aircraft
leasing as well as ports and logistics facilities; and
(b) the investment in and/or operation of facilities, construction, transport and strategic investments.
The Company has its listing on the Main Board of the Hong Kong Stock Exchange.
The consolidated financial statements were approved for issuance by the Board on 20 September 2016.
2 Basis of PreparationThe consolidated financial statements have been prepared in accordance with Hong Kong Financial Reporting Standards,
Hong Kong Accounting Standards (“HKAS”) and interpretations (collectively the “HKFRS”) issued by the Hong Kong Institute of
Certified Public Accountants (“HKICPA”). The consolidated financial statements have been prepared under the historical cost
convention, as modified by the revaluation of investment properties, available-for-sale financial assets, certain financial assets
and financial liabilities (including derivative financial instruments) which have been measured at fair value.
The preparation of consolidated financial statements in conformity with HKFRS requires the use of certain critical accounting
estimates. It also requires management to exercise its judgement in the process of applying the Group’s accounting policies.
The areas involving a higher degree of judgement or complexity, or areas where assumptions and estimates are significant to
the consolidated financial statements, are disclosed in note 5 below.
(a) Adoption of new standards and amendments to standardsThere has been no new standards or amendments to standards which are relevant to the Group’s operations and are
mandatory for FY2016. The following new standards and amendments to standards are mandatory for accounting
period beginning on or after 1 July 2016 or later periods but which the Group has not early adopted:
Effective for the year ending 30 June 2017 or after
HKFRS 2 (Amendments) Classification and Measurement of Share-based Payment
Transactions
HKFRS 9 Financial Instruments
HKFRS 14 Regulatory Deferral Accounts
HKFRS 15 Revenue from Contracts with Customers
HKFRS 16 Leases
HKAS 1 (Amendments) Disclosure Initiative
HKAS 7 (Amendments) Disclosure Initiative
HKAS 12 (Amendments) Recognition of Deferred Tax Assets for Unrealized Losses
HKAS 16 and HKAS 38 (Amendments) Clarification of Acceptable Methods of Depreciation and Amortization
HKAS 27 (Amendments) Equity Method in Separate Financial Statements
HKFRS 10 and HKAS 28 (Amendments) Sale or Contribution of Assets between an Investor and its
Associate or Joint Venture
HKFRS 10, HKFRS 12 and Investment Entities: Applying the Consolidation Exception
HKAS 28 (Amendments)
HKFRS 11 (Amendments) Accounting for Acquisitions of Interests in Joint Operations
HKFRSs Amendments Annual Improvements to HKFRSs 2012-2014 Cycle
ANNUAL REPORT 2016 101
Notes to the Financial Statements
2 Basis of Preparation (continued)
(a) Adoption of new standards and amendments to standards (continued)The Group has already commenced an assessment of the impact of these new standards and amendments to
standards, certain of which may be relevant to the Group’s operations and may give rise to changes in accounting
policies, changes in disclosures and remeasurement of certain items in the consolidated financial statements. The Group
is not yet in a position to ascertain their impact on its results of operations and financial position.
(b) Amendments to the Listing RulesIn addition, the Company has adopted the amendments to the Listing Rules related to the disclosure of financial
information with reference to the Hong Kong Companies Ordinance (Cap. 622 of the Laws of Hong Kong) during
the current financial year. As a result, there are changes to presentation and disclosure of certain information in the
consolidated financial statements.
3 Principal Accounting PoliciesThe principal accounting policies adopted for the preparation of the consolidated financial statements, which have been
consistently applied to all the years presented are set out as below:
(a) ConsolidationThe consolidated financial statements incorporate the financial statements of the Company and all its subsidiaries made
up to 30 June.
(i) Subsidiaries
Subsidiaries are entities in which the Group has control. The Group controls an entity when the Group is exposed
to, or has rights to, variable returns from its involvement with the entity and has the ability to affect those returns
through its power over the entity. Subsidiaries are fully consolidated from the date on which control is transferred
to the Group. They are deconsolidated from the date that control ceases.
The Group applies the acquisition method to account for business combinations. The consideration transferred for
the acquisition of a subsidiary is the fair values of the assets transferred, the liabilities incurred to the former owners
of the acquiree and the equity interests issued by the Group. The consideration transferred includes the fair value
of any asset or liability resulting from a contingent consideration arrangement. Identifiable assets acquired and
liabilities and contingent liabilities assumed in a business combination are measured initially at their fair values at the
acquisition date. The Group recognizes any non-controlling interest in the acquiree on an acquisition-by-acquisition
basis, either at fair value or at the non-controlling interest’s proportionate share of the recognized amounts of
acquiree’s identifiable net assets.
Acquisition-related costs are expensed as incurred.
If the business combination is achieved in stages, the carrying value of the acquirer’s previously held equity
interest in the acquiree is remeasured to fair value at the acquisition date; any gains or losses arising from such re-
measurement are recognized in the consolidated income statement.
NWS HOLDINGS LIMITED102
Notes to the Financial Statements
3 Principal Accounting Policies (continued)
(a) Consolidation (continued)
(i) Subsidiaries (continued)
Any contingent consideration to be transferred by the Group is recognized at fair value at the acquisition date.
Subsequent changes to the fair value of the contingent consideration that is deemed to be an asset or liability
is recognized either in the consolidated income statement or as a change to other comprehensive income.
Contingent consideration that is classified as equity is not re-measured, and its subsequent settlement is
accounted for within equity.
The excess of the consideration transferred, the amount of any non-controlling interest in the acquiree and the
acquisition-date fair value of any previous equity interest in the acquiree over the fair value of the identifiable net
assets acquired is recorded as goodwill. If the total of consideration transferred, non-controlling interest recognized
and previously held interest measured is less than the fair value of the net assets of the subsidiary acquired in the
case of a bargain purchase, the difference is recognized directly in the consolidated income statement.
Inter-group transactions, balances and unrealized gains on transactions between group companies are eliminated.
Unrealized losses are also eliminated. When necessary, amounts reported by subsidiaries have been adjusted to
conform with the Group’s accounting policies.
Transactions with non-controlling interests that do not result in a loss of control are accounted for as equity
transactions – that is, as transactions with the owners of the subsidiary in their capacity as owners. The difference
between fair value of any consideration paid and the relevant share acquired of the carrying amount of net assets
of the subsidiary is recorded in equity. Gains or losses on disposal to non-controlling interests are also recorded in
equity.
When the Group ceases to have control, any retained interest in the entity is remeasured to its fair value at the
date when control is lost, with the change in carrying amount recognized in the consolidated income statement.
The fair value is the initial carrying amount for the purposes of subsequently accounting for the retained interest as
an associated company, joint venture or financial asset. In addition, any amounts previously recognized in other
comprehensive income in respect of that entity are accounted for as if the Group had directly disposed of the
related assets or liabilities. This may mean that amounts previously recognized in other comprehensive income are
reclassified to the consolidated income statement.
In the Company’s statement of financial position, interests in subsidiaries are stated at cost less impairment losses.
Cost includes direct attributable costs of investment. The results of subsidiaries are accounted for by the Company
on the basis of dividend received and receivable.
Impairment testing of the interests in subsidiaries is required upon receiving a dividend from these investments if
the dividend exceeds the total comprehensive income of the subsidiary in the period the dividend is declared or
if the carrying amount of the investment in the separate financial statements exceeds the carrying amount in the
consolidated financial statements of the investee’s net assets including goodwill.
ANNUAL REPORT 2016 103
Notes to the Financial Statements
3 Principal Accounting Policies (continued)
(a) Consolidation (continued)
(ii) Associated companies
An associated company is a company other than a subsidiary and a joint venture, in which the Group has
significant influence exercised through representatives on the board of directors.
Investments in associated companies are accounted for by the equity method of accounting and are initially
recognized at cost. The Group’s investments in associated companies include goodwill (net of any accumulated
impairment loss) identified on acquisition. The interests in associated companies also include long-term interests
that, in substance, form part of the Group’s net investment in associated companies.
The Group’s share of its associated companies’ post acquisition profits or losses is recognized in the consolidated
income statement, and the share of post-acquisition movements in other comprehensive income is recognized
in other comprehensive income. The cumulative post-acquisition movements are adjusted against the carrying
amount of the investment. When the share of losses in an associated company equals or exceeds its interest in
the associated company, including any other unsecured receivable, the Group does not recognize further losses,
unless it has incurred legal and constructive obligations or made payments on behalf of the associated company.
Unrealized gains on transactions between the Group and its associated companies are eliminated to the extent
of the Group’s interest in the associated companies. Unrealized losses are also eliminated unless the transaction
provides evidence of an impairment of the asset transferred.
For equity accounting purpose, accounting policies of associated companies have been changed where
necessary to ensure consistency with the policies adopted by the Group.
Dilution gains or losses arising from investments in associates are recognized in the consolidated income
statement.
The cost of an associated company acquired in stages is measured as the sum of consideration paid for each
purchase plus a share of investee’s profits and other equity movements.
The Group ceases to use the equity method from the date an investment ceases to be an associated company
that is the date on which the Group ceases to have significant influence over the associated company or on the
date it is classified as held-for-sale.
(iii) Joint arrangements
A joint arrangement is an arrangement of which two or more parties have joint control and over which none of the
participating parties has unilateral control.
Investments in joint arrangements are classified either as joint operations or joint ventures, depending on the
contractual rights and obligations each investor has.
(1) Joint operations
Joint operations arise where the investors have rights to the assets and obligations for the liabilities of an
arrangement. Investments in joint operations are accounted for such that each joint operator recognizes its
assets (including its share of any assets jointly held), its liabilities (including its share of any liabilities incurred
jointly), its revenue (including its share of revenue from the sale of the output by the joint operation) and its
expenses (including its share of any expenses incurred jointly). Each joint operator accounts for the assets
and liabilities, as well as revenues and expenses, relating to its interest in the joint operation in accordance
with the applicable standards.
NWS HOLDINGS LIMITED104
Notes to the Financial Statements
3 Principal Accounting Policies (continued)
(a) Consolidation (continued)
(iii) Joint arrangements (continued)
(2) Joint ventures
A joint venture is a joint arrangement whereby the parties have rights to the net assets of the arrangement.
Under the equity method of accounting, interests in joint ventures are initially recognized at cost and adjusted
thereafter to recognize the Group’s share of the post-acquisition profits or losses and movements in other
comprehensive income. Upon the acquisition of the ownership interest in a joint venture, any difference
between the cost of the joint venture and the Group’s share of the net fair value of the joint venture’s
identifiable assets and liabilities is accounted for as goodwill.
When the Group’s share of losses of a joint venture equals or exceeds its interest in that joint venture (which
includes any long-term interests that, in substance, form part of the Group’s net investment in the joint
venture), the Group does not recognize further losses, unless it has incurred obligations or made payments
on behalf of that joint venture.
The share of post-acquisition results and reserves is based on the relevant profit sharing ratios which vary
according to the nature of the joint ventures set out as follows:
• Equity joint ventures
Equity joint ventures are joint ventures in respect of which the capital contribution ratios of the
venturers are defined in the joint venture contracts and the profit sharing ratios of the venturers are in
proportion to the capital contribution ratios.
• Co-operative joint ventures
Co-operative joint ventures are joint ventures in respect of which the profit sharing ratios of the
venturers and share of net assets upon the expiration of the joint venture periods are not in proportion
to their capital contribution ratios but are as defined in the joint venture contracts.
• Companies limited by shares
Companies limited by shares are limited liability companies in respect of which each shareholder’s
beneficial interests therein is in accordance with the amount of the voting share capital held thereby.
Unrealized gains on transactions between the Group and its joint ventures are eliminated to the extent of the
Group’s interest in the joint ventures. Unrealized losses are also eliminated unless the transaction provides
evidence of an impairment of the asset transferred. For equity accounting purpose, accounting policies of
the joint ventures have been changed where necessary to ensure consistency with the policies adopted by
the Group.
(b) Non-controlling interestsNon-controlling interests are the equity in a subsidiary which is not attributable, directly or indirectly, to a parent. The
Group treats transactions with non-controlling interests (namely, acquisitions of additional interests and disposals of
partial interests in subsidiaries that do not result in a loss of control) as transactions with equity owners of the Group.
For purchases of additional interests in subsidiaries from non-controlling shareholders, the difference between any
consideration paid and the relevant share acquired of the carrying value of net assets of the subsidiary is recorded in
equity. Gains or losses on disposals of partial interests to non-controlling shareholders are also recorded in equity.
ANNUAL REPORT 2016 105
Notes to the Financial Statements
3 Principal Accounting Policies (continued)
(c) Intangible assets
(i) Goodwill
Goodwill arising on acquisitions of subsidiaries is included in intangible assets. Goodwill arising on acquisitions
of associated companies and joint ventures is included in interests in associated companies and joint ventures
respectively and is tested for impairment as part of overall balance. Separately recognized goodwill is tested
annually for impairment and carried at cost less accumulated impairment losses. Impairment losses on goodwill
are not reversed. Gains and losses on the disposal of all or part of an entity include the carrying amount of goodwill
relating to the entity sold.
Goodwill is allocated to cash-generating units (“CGU”) for the purpose of testing for impairment. The allocation is
made to those CGU or groups of CGU that are expected to benefit from the business combination in which the
goodwill arose.
(ii) Operating right
Operating right primarily resulted from the acquisition of right to operate facilities management business. Operating
right is carried at cost less accumulated amortization and impairment. Amortization is calculated using the straight-
line method to allocate the cost over the period of the operating right.
(iii) Intangible concession rights
The Group has entered into various service concessions (“Service Concessions”) with local government
authorities for its participation in the development, financing operation and maintenance of infrastructural projects
(“Infrastructures”). The Group carries out the construction or upgrade work of Infrastructures from the granting
authorities in exchange for the right to operate the Infrastructures concerned and the right to charge users of
the respective Infrastructures. The fees collected during the operating periods are attributable to the Group. The
relevant Infrastructures are required to be returned to the local government authorities upon the expiry of the
operating rights without significant compensation to the Group.
The Group applies the intangible asset model to account for the Infrastructures where they are paid by the users
of the Infrastructures and the concession grantors (the respective local governments) have not provided any
contractual guarantees in respect of the amounts of construction costs incurred to be recoverable.
Land use rights acquired in conjunction with the Service Concessions which the Group has no discretion or latitude
to deploy for other services other than the use in the Service Concessions are treated as intangible assets acquired
under the Service Concessions.
Amortization of intangible concession rights is calculated to write off their costs, where applicable, on an economic
usage basis for roads and bridges whereby the amount of amortization is provided based on the ratios of actual
volume compared to the total projected volume or on a straight-line basis for water treatment plant over the
periods which the Group is granted the rights to operate these Infrastructures. The total projected volume of the
respective Infrastructures is reviewed regularly with reference to both internal and external sources of information
and appropriate adjustments will be made should there be a material change.

NWS HOLDINGS LIMITED106
Notes to the Financial Statements
3 Principal Accounting Policies (continued)
(c) Intangible assets (continued)
(iv) Mining rights
Mining rights are stated at cost less accumulated amortization and any impairment losses. Mining rights include
the cost of acquiring mining licenses, exploration and evaluation costs transferred from exploration rights and
assets upon determination that an exploration property is capable of commercial production, and the cost of
acquiring interests in the mining reserves of existing mining properties. The mining rights are amortized over the
estimated useful lives of the mines, in accordance with the production plans of the entities concerned and the
proved and probable reserves of the mines using the units of production method. Mining rights are written off to
the consolidated income statement if the mining property is abandoned.
(d) Revenue recognitionRevenue comprises the fair value of the consideration received or receivable for the sale of goods and services rendered
in the ordinary course of the Group’s activities. Revenue is shown net of value-added tax, returns, rebates and discounts,
allowances for credit and other revenue reducing factors after eliminating sales within the Group.
Revenue is recognized when the amount can be reliably measured, it is probable that future economic benefits will flow
to the Group and specific criteria for each of the activities have been met. The amount of revenue is not considered to be
reliably measurable until all contingencies relating to the activities have been resolved. Estimates are based on historical
results, taking into consideration the type of customers, the type of transactions and the specifics of each arrangement.
(i) Port revenue
Port revenue from cargo, container handling and storage is recognized when services are rendered.
(ii) Toll revenue
Toll revenue from road and bridge operations is recognized when services are rendered.
(iii) Service fee income
Property and facilities management service fees and property letting agency fee are recognized when services are
rendered.
(iv) Rental income
Rental income from investment properties is recognized on a straight-line basis over the terms of the lease
agreements.
(v) Construction revenue
Revenue from a fixed price construction service contract is recognized using the percentage of completion method
when the contracts have progressed to a stage where an outcome can be estimated reliably. The revenue is
measured by reference to the proportion of costs incurred for work performed to the end of the reporting period
as compared to the estimated total costs to completion. Anticipated losses on contracts are fully provided when it
is probable that total contract costs will exceed total contract revenue.
Revenue from a cost-plus construction service contract is recognized when the outcome can be estimated reliably.
The revenue is recognized by reference to the recoverable costs incurred during the year plus the fee earned.
When the outcome of construction service contract cannot be estimated reliably, contract revenue is recognized
only to the extent of contract costs incurred that are likely to be recoverable. Contract costs are recognized as
expenses in the period in which they are incurred.
(vi) Sales of goods
Income from sales of goods is recognized on the transfer of risks and rewards of ownership, which generally
coincides with the time when the goods are delivered to customers and title has passed.
ANNUAL REPORT 2016 107
Notes to the Financial Statements
3 Principal Accounting Policies (continued)
(d) Revenue recognition (continued)
(vii) Interest income
Interest income is recognized on a time proportion basis using the effective interest method. When a receivable is
impaired, the Group reduces the carrying amount to its recoverable amount, being the estimated future cash flow
discounted at the original effective interest rate of the instrument, and continues to unwind the discount as interest
income. Interest income on impaired loans is recognized using the original effective interest rate.
(viii) Dividend income
Dividend income is recognized when the right to receive payment is established.
(e) Leases
(i) Finance leases
Leases that transfer to the Group substantially all the risks and rewards of ownership of assets are accounted for
as finance leases. Finance leases are capitalized at the lease’s commencement date at the lower of the fair value
of the leased assets and the present value of the minimum lease payments. Each lease payment is allocated
between the liability and finance charges so as to achieve a constant rate on the finance balances outstanding.
The corresponding rental obligations net of finance charges are included in liabilities as trade and other payables.
The finance charges are charged to the consolidated income statement over the lease periods so as to produce a
constant periodic rate of interest on the remaining balance of the liability for each period.
(ii) Operating leases
Leases in which a significant portion of the risks and rewards of ownership are retained by the lessor are classified
as operating leases. Payments made under operating leases (net of any incentives received from the lessor) are
charged to the consolidated income statement on a straight-line basis over the period of the lease.
(f) Land use rightsThe upfront prepayments made for the land use rights held under operating leases is expensed in the consolidated
income statement on a straight-line basis over the period of the lease or when there is impairment, the impairment is
expensed in the consolidated income statement.
(g) Investment propertiesProperty that is held for long-term rental yields or for capital appreciation or both, and that is not occupied by the Group,
is classified as investment property. Investment property also includes property that is being constructed or developed
for future use as investment property.
Investment property comprises land held under operating leases and buildings held under finance leases. Land held
under operating leases are classified and accounted for as investment property when the rest of the definition of
investment property is met. The operating lease is accounted for as if it was a finance lease.
Investment property is measured initially at its cost, including related transaction costs and where applicable borrowing
costs. After initial recognition, investment property is carried at fair value. Fair value is determined by professional valuation
or estimation by management conducted at the end of each reporting period. Changes in fair values are recognized in
the consolidated income statement.
Property that is being constructed or developed for future use as investment property is stated at fair value.

NWS HOLDINGS LIMITED108
Notes to the Financial Statements
3 Principal Accounting Policies (continued)
(g) Investment properties (continued)Subsequent expenditure is included in the carrying amount of the asset only when it is probable that future economic
benefits associated with the asset will flow to the Group and the cost of the asset can be measured reliably. All other
repairs and maintenance costs are expensed in the consolidated income statement during the financial period in which
they are incurred.
If an investment property becomes owner-occupied, it is reclassified as property, plant and equipment, and its fair value
at the date of reclassification becomes its cost for accounting purposes.
If a property becomes an investment property because its use has been changed, any difference resulting between
the carrying amount and the fair value of this property at the date of transfer is recognized in equity as a revaluation of
property, plant and equipment. However, if a fair value gives rise to a reversal of the previous impairment loss, the write-
back is recognized in the consolidated income statement.
(h) Property, plant and equipmentProperty, plant and equipment are stated at historical cost less accumulated depreciation and impairment losses.
Historical cost includes expenditure that is directly attributable to the acquisition of the assets. Subsequent costs are
included in the carrying amount of the assets or recognized as a separate asset, as appropriate, only when it is probable
that future economic benefits associated with the asset will flow to the Group and the cost of the asset can be measured
reliably. The carrying amount of replaced part is derecognized. All other repairs and maintenance costs are charged in
the consolidated income statement during the financial period in which they are incurred. The carrying amount of an
asset is written down immediately to its recoverable amount if the asset’s carrying amount is greater than its estimated
recoverable amount.
(i) Assets under construction
All direct costs relating to the construction of property, plant and equipment, including borrowing costs during the
construction period are capitalized as the costs of the assets.
(ii) Depreciation
No depreciation is provided in respect of construction in progress until such time when the relevant assets are
completed and available for intended use.
Leasehold land classified as finance lease commences amortization from the time when the land interest becomes
available for its intended use. Amortization of leasehold land classified as finance lease and depreciation of other
property, plant and equipment are calculated to allocate their cost to their estimated residual values over their
estimated useful lives, using the straight-line method, at the following annual rates:
Leasehold land classified as finance lease over the period of lease terms
Properties 2.5% – 3%
Other plant and equipment 4% – 50%
The residual values and useful lives of the assets are reviewed, and adjusted if appropriate, at the end of each
reporting period.
(iii) Gain or loss on disposal
The gain or loss on disposal of property, plant and equipment is determined by comparing the difference between
the net sales proceeds and the carrying amount of the relevant asset, and is recognized in the consolidated income
statement.
ANNUAL REPORT 2016 109
Notes to the Financial Statements
3 Principal Accounting Policies (continued)
(i) Impairment of investments in subsidiaries, associated companies, joint ventures and non-
financial assetsAssets that have an indefinite useful life (e.g. goodwill) or have not yet been available for use are not subject to
amortization and are tested annually for impairment. Assets are reviewed for impairment whenever events or changes
in circumstances indicate that the carrying amount may not be recoverable. The carrying amount of an asset is written
down immediately to its recoverable amount if the carrying amount of the asset is greater than its estimated recoverable
amount. An impairment loss is recognized in the consolidated income statement for the amount by which the carrying
amount of an asset exceeds its recoverable amount. The recoverable amount is the higher of its fair value less costs to
sell and value in use. Impairment losses on goodwill are not reversed. For the purpose of assessing impairment, assets
are grouped as CGU for which there are separately identifiable cash flows. Non-financial assets other than goodwill that
suffered an impairment are reviewed for possible reversal of the impairment at the end of each reporting period.
(j) Financial assetsThe Group classifies its financial assets in the categories of financial assets at fair value through profit or loss, loans and
receivables and available-for-sale financial assets. Management determines the classification of its financial assets at
initial recognition depending on the purpose for which the investments are acquired.
(i) Financial assets at fair value through profit or loss
Financial assets at fair value through profit or loss are financial assets held for trading and those designated as at
fair value through profit or loss at inception. Assets in this category are classified as current assets if expected to
be settled within 12 months; otherwise, they are classified as non-current.
(ii) Loans and receivables
Loans and receivables are non-derivative financial assets with fixed or determinable payments that are not quoted
in an active market. They arise when the Group provides money, goods and services directly to a debtor with no
intention of trading the receivable and are included in current assets, except for those with maturities more than
12 months after the end of the reporting period, which are classified as non-current assets. These are accounted
for in accordance with the policy set out in note 3(m).
(iii) Available-for-sale financial assets
Available-for-sale financial assets are non-derivatives that are either designated in this category or not classified in
any of the other categories. They are included in non-current assets unless management intends to dispose of the
investment within 12 months of the end of the reporting period.
Regular purchases and sales of financial assets are recognized on the trade-date, which is the date on which the Group
commits to purchase or sell the asset. Investments are initially recognized at fair value plus transaction costs for all
financial assets not carried at fair value through profit or loss. Financial assets carried at fair value through profit or loss are
initially recognized at fair value and transaction cost are expensed in the consolidated income statement. Financial assets
are derecognized when the rights to receive cash flows from the investments have expired or have been transferred and
the Group has transferred substantially all risks and rewards of ownership.

NWS HOLDINGS LIMITED110
Notes to the Financial Statements
3 Principal Accounting Policies (continued)
(j) Financial assets (continued)Available-for-sale financial assets and financial assets at fair value through profit or loss are subsequently carried at fair
value. Loans and receivables are carried at amortized cost using the effective interest method. Gains and losses arising
from changes in the fair value of financial assets at fair value through profit or loss are included in the consolidated income
statement in the financial period in which they arise. Changes in the fair value of available-for-sale financial assets are
recognized in other comprehensive income. When available-for-sale financial assets are sold, the accumulated fair value
adjustments are included in the consolidated income statement as gains or losses from financial assets. The translation
differences of monetary financial assets are recognized in the consolidated income statement; translation differences on
non-monetary financial assets are recognized in equity.
Financial assets and liabilities are offset and the net amount reported in the consolidated statement of financial position
when there is a legally enforceable right to offset the recognized amounts and there is an intention to settle on a net basis
or realize the asset and settle the liability simultaneously.
The fair values of listed investments are based on current bid prices. If the market for a financial asset in not active and for
unlisted financial assets, the Group establishes fair value by using valuation techniques. These include the use of recent
arm’s length transactions, reference to other instruments that are substantially the same, discounted cash flow analysis
and option pricing models, making maximum use of market inputs and relying as little as possible on entity-specific
inputs.
The Group assesses at the end of each reporting period whether there is objective evidence that a financial asset or a
group of financial assets is impaired. In the case of equity instruments classified as available-for-sale financial assets, a
significant or prolonged decline in the fair value of the asset below its cost is considered in determining whether the asset
is impaired. In the case of debt instruments, objective evidence of impairment includes significant financial difficulty of the
issuer or counterparty; default or delinquency in interest or principal payments; or it becoming probable that the borrower
will enter bankruptcy or financial reorganization. If any such evidence exists for available-for-sale financial assets, the
cumulative loss, measured as the difference between the acquisition cost and the current fair value, less any impairment
loss on that financial asset previously recognized in the consolidated income statement, is removed from equity and
recognized in the consolidated income statement. Impairment losses recognized in the consolidated income statement
on equity instruments classified as available-for-sale are not reversed through the consolidated income statement.
(k) Deferred incomeDeferred income is included in both current and non-current liabilities and is credited to the consolidated income
statement on a straight-line basis over the concession periods.
(l) Derivative financial instruments and hedging activitiesDerivatives are initially recognized at fair value on the date a derivative contract is entered into and are subsequently
remeasured at their fair value.
The Group designates certain derivatives as hedges of a particular risk associated with a recognized asset or liability or
a highly probable forecast transaction (cash flow hedge).
The Group documents at the inception of the transaction the relationship between hedging instruments and hedged
items, as well as its risk management objectives and strategy for undertaking various hedging transactions. The Group
also documents its assessment, both at hedge inception and on an ongoing basis, of whether the derivatives that are
used in hedging transactions are highly effective in offsetting changes in fair values or cash flows of hedged items.
ANNUAL REPORT 2016 111
Notes to the Financial Statements
3 Principal Accounting Policies (continued)
(l) Derivative financial instruments and hedging activities (continued)The fair values of various derivative instruments used for hedging purposes are disclosed in notes 22, 24 and 33.
Movements in the hedging reserve in shareholders’ equity are shown in note 30. The full fair value of a hedging derivative
is classified as a non-current asset or liability when the remaining maturity of the hedged item is more than 12 months,
and as a current asset or liability when the remaining maturity of the hedged item is less than 12 months. Trading
derivatives are classified as a current asset or liability.
The effective portion of changes in the fair value of derivatives that are designated and qualified as cash flow hedges is
recognized in other comprehensive income. The gain or loss relating to the ineffective portion is recognized immediately
in the consolidated income statement.
When a hedging instrument expires or is sold, or when a hedge no longer meets the criteria for hedge accounting, any
cumulative gain or loss existing in equity at that time remains in equity and is recognized when the forecast transaction is
ultimately recognized in the consolidated income statement. When a forecast transaction is no longer expected to occur,
the cumulative gain or loss that was reported in equity immediately transferred to the consolidated income statement.
(m) Trade and other receivablesTrade and other receivables are recognized initially at fair value and subsequently measured at amortized cost using
the effective interest method, less provision for impairment, which is established when there is objective evidence that
the Group will not be able to collect all amounts due according to the original terms of receivable. Significant financial
difficulties of the debtor, probability that the debtor will enter bankruptcy and default or delinquency in payments are
considered indicators that the receivable is impaired. The amount of the provision is the difference between the carrying
amount of the assets and the present value of estimated future cash flows, discounted at the original effective interest
rate. The carrying amount of the assets is reduced through the use of an allowance account, and the amount of the
provision is recognized in the consolidated income statement. When a receivable is uncollectible, it is written off against
the allowance account for receivable. Subsequent recoveries of amounts previously written off are credited to the
consolidated income statement.
(n) InventoriesInventories comprise stocks and work in progress and are stated at the lower of cost and net realizable value. Cost is
calculated on the weighted average basis. Net realizable value is determined on the basis of anticipated sales proceeds
less estimated selling expenses.
(o) Contracts in progressContracts in progress comprise contract cost incurred, plus recognized profits (less recognized losses) less progress
billing. Cost comprises materials, direct labour and overheads attributable to bringing the work in progress to its present
condition.
Variations in contract work, claims and incentive payments are included in contract revenue to the extent that may have
been agreed with the customer and are capable of being reliably measured.
For fixed price construction service contract, the Group uses the “percentage-of-completion method” to determine the
appropriate amount to recognize in a given period. The stage of completion is measured by reference to the contract
costs incurred up to the end of the reporting period as a percentage of total estimated costs for each contract. Costs
incurred in the year in connection with future activity on a contract are excluded from contract costs in determining the
stage of completion.
NWS HOLDINGS LIMITED112
Notes to the Financial Statements
3 Principal Accounting Policies (continued)
(o) Contracts in progress (continued)The Group presents the net contract position for each contract as an asset, the gross amount due from customers
for contract work, for all contracts in progress for which costs incurred plus recognized profits (less recognized losses)
exceed progress billings. Progress billings not yet paid by customers and retention are included under current assets.
The Group presents the net contract position for each contract as a liability, the gross amount due to customers for
contract work, for all contracts in progress for progress billings exceed costs incurred plus recognized profits (less
recognized losses).
(p) Assets held-for-saleNon-current assets are classified as assets held-for-sale when their carrying amount is to be recovered principally
through a sale transaction and a sale is considered highly probable. They are stated at the lower of carrying amount and
fair value less costs to sell if their carrying amount is to be recovered principally through a sale transaction rather than
through continuing use. Investment properties classified as non-current assets held-for-sale are stated at fair value at the
end of reporting period.
(q) Cash and cash equivalentsIn the consolidated statement of cash flows, cash and cash equivalents include cash in hand, deposits held at call with
banks, other short-term highly liquid investments with original maturities of three months or less and bank overdrafts.
Bank overdrafts are shown within borrowings under current liabilities in the consolidated statement of financial position.
(r) Trade payablesTrade payables are recognized initially at fair value and subsequently measured at amortized cost using the effective
interest method.
(s) ProvisionsProvisions are recognized when the Group has a present legal or constructive obligation as a result of past events; it is
probable that an outflow of resources will be required to settle the obligation; and the amount has been reliably estimated.
Where there are a number of similar obligations, the likelihood that an outflow of resources will be required in settlement
is determined by considering the class of obligations as a whole. A provision is recognized even if the likelihood of an
outflow of resources with respect to any one item included in the same class of obligations may be small.
Provisions are measured at the present value of the expenditures expected to be required to settle the obligation using a
pre-tax rate that reflects current market assessments of the time value of money and the risks specific to the obligation.
The increase in the provision due to passage of time is recognized as interest expense.
(t) Share capitalOrdinary shares are classified as equity.
Incremental costs directly attributable to the issue of new shares or options are shown in equity as a deduction, net of
tax, from the proceeds.
(u) Contingent liabilities and contingent assetsA contingent liability is a possible obligation that arises from past events and whose existence will only be confirmed by
the occurrence or non-occurrence of one or more uncertain future events not wholly within the control of the Group. It
can also be a present obligation arising from past events that is not recognized because it is not probable that outflow of
economic resources will be required or the amount of obligation cannot be measured reliably.
ANNUAL REPORT 2016 113
Notes to the Financial Statements
3 Principal Accounting Policies (continued)
(u) Contingent liabilities and contingent assets (continued)A contingent liability is not recognized but is disclosed in the notes to the financial statements. When a change in the
probability of an outflow occurs so that outflow is probable, it will then be recognized as a provision.
A contingent asset is a possible asset that arises from past events and whose existence will be confirmed only by the
occurrence or non-occurrence of one or more uncertain events not wholly within the control of the Group.
A contingent asset is not recognized but is disclosed in the notes to the financial statements when an inflow of economic
benefits is probable. When inflow is virtually certain, an asset is recognized.
(v) Current and deferred income taxThe tax expense for the year comprises current and deferred tax. Tax is recognized in the consolidated income
statement, except to the extent that it relates to items recognized in other comprehensive income or directly in equity. In
this case, the tax is also recognized in other comprehensive income or directly in equity, respectively.
The current income tax charge is calculated on the basis of the tax laws enacted or substantively enacted at the end of
the reporting period in the countries where the Group, associated companies and joint ventures operate and generate
taxable income. Management periodically evaluates positions taken in tax returns with respect to situations in which
applicable tax regulation is subject to interpretation and establishes provisions where appropriate on the basis of amounts
expected to be paid to the tax authorities.
Deferred income tax is provided in full, using the liability method, on temporary differences arising between the tax
bases of assets and liabilities and their carrying amounts in the consolidated financial statements. However, deferred tax
liabilities are not recognized if they arise from the initial recognition of goodwill, the deferred income tax is not accounted
for if it arises from initial recognition of an asset or liability in a transaction other than a business combination that at the
time of transaction affects neither accounting nor taxable profit or loss. Deferred income tax is determined using tax rates
and laws that have been enacted or substantively enacted by the end of the reporting period and are expected to apply
when the related deferred income tax asset is realized or the deferred income tax liability is settled.
Deferred income tax assets are recognized to the extent that it is probable that future taxable profit will be available
against which the temporary differences can be utilized.
Deferred income tax is provided on temporary differences arising on investments in subsidiaries, associated companies
and joint ventures except where the timing of the reversal of the temporary difference can be controlled and it is probable
that the temporary difference will not reverse in the foreseeable future.
Deferred income tax assets and liabilities are offset when there is a legally enforceable right to offset current tax assets
against current tax liabilities and when the deferred income taxes assets and liabilities relate to income taxes levied by
the same taxation authority on either the taxable entity or different taxable entities where there is an intention to settle the
balances on a net basis.
(w) Borrowing costsBorrowing costs incurred for the construction of any qualifying assets are capitalized during the construction period when
the asset is being prepared for its intended use. Other borrowing costs are expensed as incurred.
NWS HOLDINGS LIMITED114
Notes to the Financial Statements
3 Principal Accounting Policies (continued)
(x) Foreign currencies
(i) Functional and presentation currency
Items included in the financial statements of each of the Group’s entities are measured using the currency of the
primary economic environment in which the entity operates (the “functional currency”). The consolidated financial
statements are presented in Hong Kong dollars, which is the Company’s functional and presentation currency.
(ii) Transactions and balances
Foreign currency transactions are translated into the functional currency using the exchange rates prevailing at the
dates of the transactions. Foreign exchange gains and losses resulting from the settlement of such transactions
and from the translation of monetary assets and liabilities denominated in foreign currencies at the exchange rates
prevailing at the end of the reporting period are recognized in the consolidated income statement.
Changes in the fair value of debt securities denominated in foreign currency classified as available-for-sale are
analyzed between translation differences resulting from changes in the amortized cost of the security and other
changes in the carrying amount of the security. Translation differences related to changes in amortized cost are
recognized in profit or loss, and other changes in the carrying amount are recognized in other comprehensive
income.
Translation differences on financial assets and liabilities such as equities held at fair value through profit
or loss are recognized in profit or loss as part of the fair value gain or loss. Translation differences on
non-monetary financial assets, such as equities classified as available-for-sale, are included in other
comprehensive income.
(iii) Group companies
The results and financial position of all the entities of the Group that have a functional currency different from the
presentation currency are translated into the presentation currency as follows:
(a) assets and liabilities for each consolidated statement of financial position presented are translated at the
exchange rate prevailing at the date of that consolidated statement of financial position;
(b) income and expenses for each consolidated income statement are translated at the average exchange rate
during the period covered by the consolidated income statement; and
(c) all resulting exchange differences are recognized as a separate component of equity.
On consolidation, exchange differences arising from the translation of the net investment in foreign operations are
taken to equity.
Goodwill and fair value adjustments arising on the acquisition of a foreign entity are treated as assets and liabilities
of the foreign entity and translated at the closing rate. Exchange differences arising are recognized in equity.
(iv) Disposal of foreign operation and partial disposal
On the disposal of the Group’s entire interest in a foreign operation, or a disposal involving loss of control over a
subsidiary that includes a foreign operation, all of the exchange differences accumulated in equity in respect of that
operation attributable to the equity holders of the company are reclassified to the consolidated income statement.
In the case of a partial disposal that does not result in the Group losing control over a subsidiary that includes
a foreign operation, the proportionate share of accumulated exchange differences are re-attributed to
non-controlling interests and not recognized in the consolidated income statement. For all other partial disposals
(that is, reductions in the Group’s ownership interest in associated companies or joint ventures that do not result
in the Group losing significant influence or joint control) the proportionate share of the accumulated exchange
difference is reclassified to the consolidated income statement.

ANNUAL REPORT 2016 115
Notes to the Financial Statements
3 Principal Accounting Policies (continued)
(y) Employee benefits
(i) Employee leave entitlements
Employee entitlements to annual leave are recognized when they accrue to employees. A provision is made for
the estimated liability for annual leave as a result of services rendered by employees up to the end of the reporting
period. Employee entitlements to sick leave and maternity leave are not recognized until the time of leave.
(ii) Bonus plans
Provision for bonus plans are recognized when the Group has a present legal or constructive obligation as a result
of services rendered by employees and a reliable estimate of the obligation can be made.
(iii) Defined contribution plans
A defined contribution plan is a pension plan under which the Group pays contributions into a separate entity.
The Group has no legal or constructive obligations to pay further contributions if the fund does not hold sufficient
assets to pay all employees the benefits relating to employee service in the current and prior periods. Contributions
to defined contribution plans including the Mandatory Provident Fund Scheme and employee pension schemes
established by municipal governments in the PRC are expensed as incurred. Contributions are reduced by
contributions forfeited by those employees who leave the schemes prior to vesting fully in the contributions, where
applicable.
(iv) Defined benefit plans
Defined benefit plans define an amount of pension benefit that an employee will receive on retirement, usually
dependent on one or more factors such as age, years of services and compensation.
The liability recognized in the consolidated statement of financial position in respect of defined benefit pension
plans is the present value of the defined benefit obligation at the end of the reporting period less the fair value of
plan assets. The defined benefit obligation is calculated annually by independent actuaries using the projected
unit credit method. The present value of the defined benefit obligation is determined by discounting the estimated
future cash outflows using interest rates determined by reference to market yields at the end of the reporting period
based on Exchange Fund Notes that are denominated in the currency in which the benefits will be paid, and that
have terms to maturity approximating to the terms of the related pension obligation.
Actuarial gains and losses arising from experience adjustments and changes in actuarial assumptions are credited
or charged to other comprehensive income in the period in which they arise.
(v) Share-based compensation
The Group operates equity-settled, share-based compensation plans. The fair value of the employee services
received in exchange for the grant of share options is recognized as an expense. The total amount to be expensed
over the vesting period is determined by reference to the fair value of the options granted at the date of grant,
excluding the impact of any non-market vesting conditions. At the end of each reporting period, the Group revises
its estimates of the number of options that are expected to vest. It recognizes the impact of the revision of original
estimates, if any, in the consolidated income statement, with a corresponding adjustment to equity.
The proceeds received net of any directly attributable transaction costs are credited to share capital (nominal value)
and share premium when the options are exercised.

NWS HOLDINGS LIMITED116
Notes to the Financial Statements
3 Principal Accounting Policies (continued)
(z) BorrowingsBorrowings are recognized initially at fair value, net of transaction costs incurred. Borrowings are subsequently stated at
amortized cost; any difference between the proceeds (net of transaction costs) and the redemption value is recognized
in the consolidated income statement or capitalized as stated in note 3(w) over the period of the borrowings using the
effective interest method.
Borrowings are classified as current liabilities unless the Group has an unconditional right to defer settlement of the liability
for at least 12 months after the end of the reporting period.
(aa) Segment reportingOperating segment are reported in a manner consistent with the internal reporting provided to the chief operating
decision-maker. The chief operating decision-maker, who is responsible for allocating resources and assessing
performance of the operating segments, has been identified as the Executive Committee that makes strategic decisions.
Segment assets consist primarily of investment properties, property, plant and equipment, intangible concession rights,
intangible assets, available-for-sale financial assets, other non-current assets, inventories, receivables and cash and bank
balances. Segment liabilities primarily comprise operating liabilities, taxation and borrowings. Additions to non-current
assets other than financial instruments, deferred tax assets and post-employment benefit assets comprise additions to
investment properties, property, plant and equipment, intangible concession rights and intangible assets.
(ab) Dividend distributionDividend distribution to the Company’s shareholders is recognized as a liability in the consolidated financial statements
in the financial period when the dividends are approved by the Company’s shareholders and/or directors, where
appropriate.
(ac) Insurance contractsThe Group assesses at the end of each reporting period the liabilities under its insurance contracts using current
estimates of future cash flows. Changes in carrying amount of these insurance liabilities are recognized in the
consolidated income statement.
The Group accounts for its financial guarantee contracts as insurance contracts.
4 Financial Risk Management and Fair Value EstimationThe Group’s activities expose it to a variety of financial risks: market risk (interest rate risk, foreign exchange risk and price risk),
credit risk and liquidity risk.
The Group has centralized treasury function for all of its subsidiaries in a manner consistent with the overall policies of the
Group.
(a) Market risk
(i) Interest rate risk
The Group is exposed to interest rate risk through the impact of rate changes on interest bearing assets and
liabilities. Cash flow interest rate risk is the risk that changes in market interest rates will impact cash flows arising
from variable rate financial instruments. The Group’s interest bearing assets mainly include cash deposits and
amounts due from associated companies and joint ventures.

ANNUAL REPORT 2016 117
Notes to the Financial Statements
4 Financial Risk Management and Fair Value Estimation (continued)
(a) Market risk (continued)
(i) Interest rate risk (continued)
Other than the fixed rate bonds issued by the Group as detailed in note 31(d) and debt securities classified as
available-for-sale financial assets which expose the Group to fair value interest rate risk, the Group’s borrowings
are mainly on a floating rate basis, which will be affected by fluctuation of prevailing market interest rates and will
expose the Group to cash flow interest rate risk.
Interest bearing financial assets and liabilities are mainly subject to an interest re-pricing risk of one year or below.
If interest rates had been 100 basis points higher/lower with all other variables held constant, the Group’s profit for
the year would have been HK$54.6 million (2015: HK$79.8 million) lower/higher respectively.
The sensitivity analysis has been determined assuming that the change in interest rates had occurred throughout
the year and had been applied to calculate the exposure to interest rate risk for financial instruments in existence
at the end of the reporting period. The 100 basis points increase or decrease represents a reasonably possible
change in those interest rates which have the impact on the Group over the period until the end of the next
reporting period. Changes in market interest rates affect the interest income or expense of non-derivative
variable-interest financial instruments. As a consequence, they are included in the calculation of profit for the year
sensitivities.
(ii) Foreign exchange risk
The Group operates mainly in Hong Kong and Mainland China. Entities within the Group are exposed to foreign
exchange risk from future commercial transactions and monetary assets and liabilities that are denominated in a
currency that is not the entity’s functional currency.
The Group currently does not have a foreign currency hedging policy. It manages its foreign currency risk by closely
monitoring the movement of the foreign currency rates and will consider to enter into forward foreign exchange
contracts to reduce the exposure should the need arises.
At 30 June 2016, the Group’s entities with functional currency of Hong Kong dollar had net monetary liabilities
denominated in United States dollar of HK$1,440.8 million (2015: HK$1,765.8 million). Under the Linked Exchange
Rate System in Hong Kong, Hong Kong dollar is pegged to the United States dollar, management therefore
considers that there is no significant foreign exchange risk with respect to the United States dollar.
At 30 June 2016, the Group’s entities with functional currency of Hong Kong dollar had net monetary assets
denominated in Renminbi of HK$4,190.8 million (2015: HK$8,828.5 million) which the related foreign exchange
risk has not been hedged. If Hong Kong dollar had strengthened/weakened by 5% against Renminbi with all other
variables held constant, the Group’s profit for the year would have been HK$206.3 million (2015: HK$436.8 million)
lower/higher respectively.
This sensitivity analysis ignores any offsetting foreign exchange factors and has been determined assuming that the
change in foreign exchange rates had occurred at the end of the reporting period. The stated change represents
reasonably possible changes in foreign exchange rates over the period until the end of the next reporting period.
There are no other significant monetary balances held by group companies at 30 June 2016 and 2015 that are
denominated in a non-functional currency. Currency risks as defined by HKFRS 7 arise on account of monetary
assets and liabilities being denominated in a currency that is not the functional currency, differences resulting from
the translation of financial statements into the Group’s presentation currency are not taken into consideration.
NWS HOLDINGS LIMITED118
Notes to the Financial Statements
4 Financial Risk Management and Fair Value Estimation (continued)
(a) Market risk (continued)
(iii) Price risk
The Group is exposed to equity securities price risk because the Group held listed and unlisted equity investments
of which the fair value are subject to changes in market prices. Gains and losses arising from changes in the fair
value of available-for-sale financial assets and financial assets at fair value through profit or loss are dealt with in
equity and consolidated income statement respectively. The performance of the Group’s listed and unlisted equity
investments are monitored regularly, together with an assessment of their relevance to the Group’s strategic plans.
At 30 June 2016, if the price of listed and unlisted equity investments, classified as available-for-sale financial
assets and financial assets at fair value through profit or loss (notes 21 and 25) had been 25% higher with all other
variables held constant, the Group’s investment revaluation reserve would have been HK$385.6 million higher
(2015: profit for the year HK$0.1 million and investment revaluation reserve HK$650.6 million higher respectively).
If the price of the above-mentioned listed and unlisted equity investments had been 25% lower with all other
variables held constant, the Group’s profit for the year would have been HK$302.1 million (2015: HK$0.1 million)
lower and investment revaluation reserve would have been HK$83.6 million (2015: HK$650.6 million) lower and
resulted in a negative investment revaluation reserve of HK$57.1 million (2015: HK$354.3 million). The sensitivity
analysis has been determined based on a reasonable expectation of possible valuation volatility over the next
12 months.
(b) Credit riskThe credit risk of the Group mainly arises from deposits with banks, trade and other receivables, debt securities and
balances receivable from group companies, including amounts due from associated companies and joint ventures. The
exposures to these credit risks are closely monitored on an ongoing basis by established credit policies in each of its core
businesses.
Deposits are mainly placed with high-credit-quality financial institutions. The Group carries out regular reviews and
follow-up actions on any overdue amounts to minimize exposures to credit risk. There is no concentration of credit risk
with respect to trade receivables from third party customers as of the customer bases are widely dispersed in different
industries.
In addition, the Group monitors the exposure to credit risk in respect of the financial assistance provided to associated
companies and joint ventures through exercising control or influence over their financial and operating policy decisions
and reviewing their financial positions on a regular basis. Debt securities are limited to financial institutions or investment
counterparty with high quality.
The maximum exposure to credit risk is represented by the carrying amount of financial assets in the consolidated
statement of financial position after deducting any impairment allowance.

ANNUAL REPORT 2016 119
Notes to the Financial Statements
4 Financial Risk Management and Fair Value Estimation (continued)
(c) Liquidity riskPrudent liquidity risk management includes managing the profile of debt maturities and funding sources, maintaining
sufficient cash and marketable securities, and ensuring the availability of funding from an adequate amount of committed
credit facilities and the ability to close out market positions. It is the policy of the Group to regularly monitor current and
expected liquidity requirements and to ensure that adequate funding is available for operating, investing and financing
activities. The Group also maintains undrawn committed credit facilities to further reduce liquidity risk in meeting funding
requirements.
The table below analyses the Group’s financial liabilities into relevant maturity groupings based on the remaining period
at the end of the reporting period to the contractual maturity date. The amounts disclosed in the table are the contractual
undiscounted cash outflows.
At 30 June 2016
Non-derivative financial liabilities
HK$’m Note
Carrying
amount
Total
contractual
undiscounted
cash flow
Within
1 year or
on demand
Over
1 year
but within
5 years
Trade payables 34 630.9 630.9 630.7 0.2
Retention money payables and other payables 7,424.0 7,424.0 5,541.4 1,882.6
Amounts due to non-controlling interests 34 148.0 148.0 148.0 –
Amounts due to associated companies 34 14.1 14.1 14.1 –
Amounts due to joint ventures 34 1.2 1.2 1.2 –
Borrowings and contracted interest payment 31 15,064.8 15,708.8 6,145.7 9,563.1
Loans from non-controlling interests 33 71.7 71.7 – 71.7
Derivative financial liabilities
HK$’m Note
Total
contractual
undiscounted
cash flow
Within
1 year or
on demand
Over
1 year
but within
5 years
Over
5 years
Derivative financial instruments (net settled) 33 107.4 26.7 80.7 –

NWS HOLDINGS LIMITED120
Notes to the Financial Statements
4 Financial Risk Management and Fair Value Estimation (continued)
(c) Liquidity risk (continued)
At 30 June 2015
Non-derivative financial liabilities
HK$’m Note
Carrying
amount
Total
contractual
undiscounted
cash flow
Within
1 year or
on demand
Over
1 year
but within
5 years
Trade payables 34 606.5 606.5 606.4 0.1
Retention money payables and other payables 5,783.2 5,783.2 4,466.3 1,316.9
Amounts due to non-controlling interests 34 94.2 94.2 94.2 –
Amounts due to associated companies 34 8.3 8.3 8.3 –
Amounts due to joint ventures 34 0.6 0.6 0.6 –
Borrowings and contracted interest payment 31 16,811.4 17,821.2 3,808.0 14,013.2
Loans from non-controlling interests 33 96.8 96.8 – 96.8
Derivative financial liabilities
HK$’m Note
Total
contractual
undiscounted
cash flow
Within
1 year or
on demand
Over
1 year
but within
5 years
Over 5
years
Derivative financial instruments (net settled) 33 143.2 28.4 112.7 2.1
(d) Capital managementThe Group’s objectives when managing capital are to safeguard the Group’s ability to continue as a going concern in
order to provide returns for shareholders and benefits for other stakeholders and to maintain an optimal capital structure
to reduce the cost of capital.
The Group actively and regularly reviews and manages its capital structure to ensure optimal capital structure and
shareholders’ returns, taking into consideration the future capital requirements of the Group and capital efficiency,
prevailing and projected profitability, projected operating cash flows, projected capital expenditures and projected
strategic investment opportunities. The Group aims to maintain 50% dividend payout ratio. In order to maintain or adjust
the capital structure, the Group may issue or repurchase shares, or raise new debt financing.

ANNUAL REPORT 2016 121
Notes to the Financial Statements
4 Financial Risk Management and Fair Value Estimation (continued)
(d) Capital management (continued)The net gearing ratios at 30 June were as follows:
2016 2015
Note HK$’m HK$’m
Total borrowings 31 (15,064.8) (16,811.4)
Add: Cash and bank balances 26 8,923.6 10,422.3
Net debt (6,141.2) (6,389.1)
Total equity 45,858.4 46,187.7
Net gearing ratio 13% 14%
The decrease of net debt as at 30 June 2016 was primarily resulted from net cash inflow from operations and disposals
of investments.
(e) Fair value estimationThe carrying amounts and fair value disclosures of the financial instruments of the Group are as follows:
(i) Listed investments are stated at market prices. The quoted market price used for financial assets held by the
Group is the bid price at the end of the reporting period. Unlisted investments are stated at fair values which are
estimated using other prices observed in recent transactions or valuation techniques when the market is not readily
available.
(ii) The fair value of long-term financial liabilities is estimated by discounting the future contractual cash flows at the
current market interest rate that is available to the Group for similar financial instruments.
(iii) The carrying values of bank balances, receivables, payables and short-term borrowings approximate their fair
values due to the short-term maturities of these assets and liabilities.
(iv) The following table presents the Group’s assets and liabilities that are measured at fair value at 30 June:
• Quoted prices (unadjusted) in active markets for identical assets or liabilities (Level 1).
• Inputs other than quoted prices included within Level 1 that are observable for the asset or liability, either
directly (that is, as prices) or indirectly (that is, derived from prices) (Level 2).
• Inputs for the asset or liability that are not based on observable market data (that is, unobservable inputs)
(Level 3).
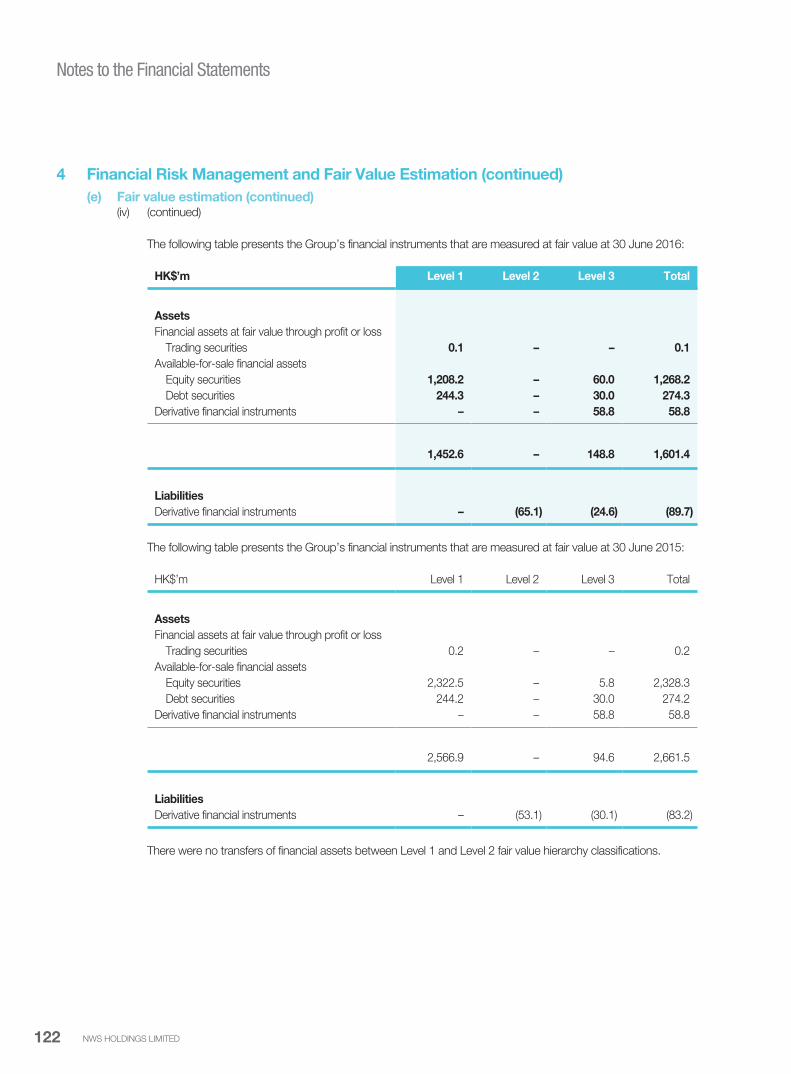
NWS HOLDINGS LIMITED122
Notes to the Financial Statements
4 Financial Risk Management and Fair Value Estimation (continued)
(e) Fair value estimation (continued)(iv) (continued)
The following table presents the Group’s financial instruments that are measured at fair value at 30 June 2016:
HK$’m Level 1 Level 2 Level 3 Total
Assets
Financial assets at fair value through profit or loss
Trading securities 0.1 – – 0.1
Available-for-sale financial assets
Equity securities 1,208.2 – 60.0 1,268.2
Debt securities 244.3 – 30.0 274.3
Derivative financial instruments – – 58.8 58.8
1,452.6 – 148.8 1,601.4
Liabilities
Derivative financial instruments – (65.1) (24.6) (89.7)
The following table presents the Group’s financial instruments that are measured at fair value at 30 June 2015:
HK$’m Level 1 Level 2 Level 3 Total
Assets
Financial assets at fair value through profit or loss
Trading securities 0.2 – – 0.2
Available-for-sale financial assets
Equity securities 2,322.5 – 5.8 2,328.3
Debt securities 244.2 – 30.0 274.2
Derivative financial instruments – – 58.8 58.8
2,566.9 – 94.6 2,661.5
Liabilities
Derivative financial instruments – (53.1) (30.1) (83.2)
There were no transfers of financial assets between Level 1 and Level 2 fair value hierarchy classifications.
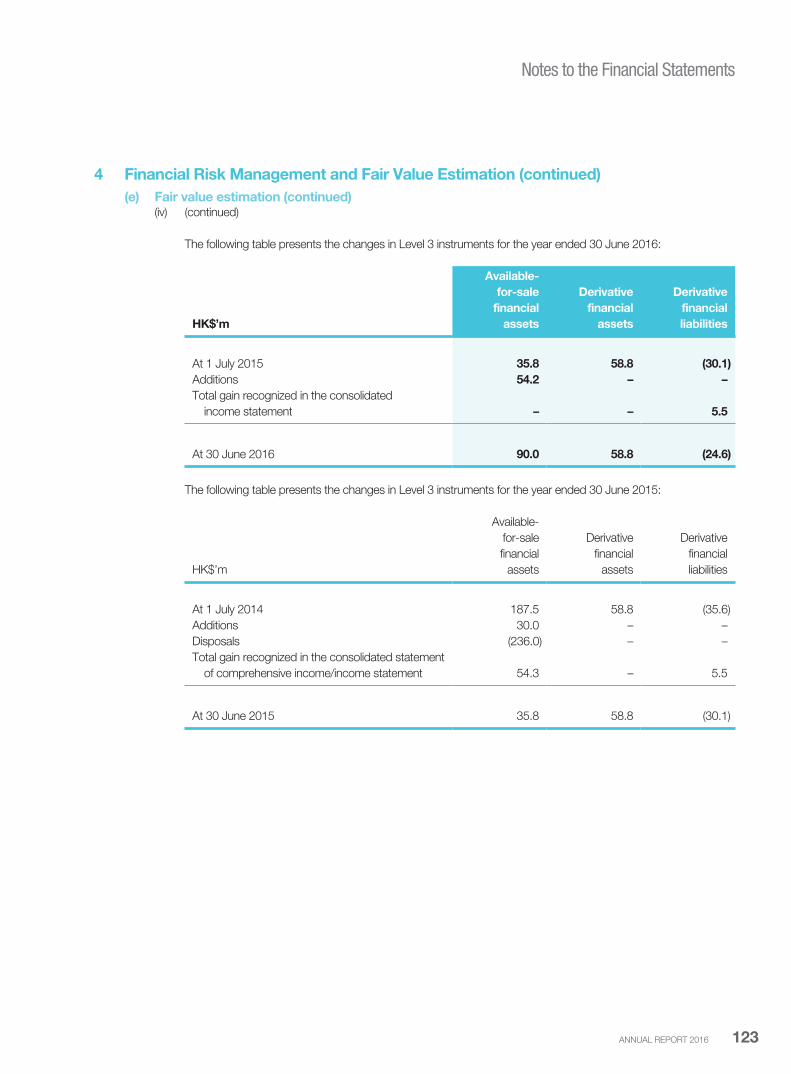
ANNUAL REPORT 2016 123
Notes to the Financial Statements
4 Financial Risk Management and Fair Value Estimation (continued)
(e) Fair value estimation (continued)(iv) (continued)
The following table presents the changes in Level 3 instruments for the year ended 30 June 2016:
HK$’m
Available-
for-sale
financial
assets
Derivative
financial
assets
Derivative
financial
liabilities
At 1 July 2015 35.8 58.8 (30.1)
Additions 54.2 – –
Total gain recognized in the consolidated
income statement – – 5.5
At 30 June 2016 90.0 58.8 (24.6)
The following table presents the changes in Level 3 instruments for the year ended 30 June 2015:
HK$’m
Available-
for-sale
financial
assets
Derivative
financial
assets
Derivative
financial
liabilities
At 1 July 2014 187.5 58.8 (35.6)
Additions 30.0 – –
Disposals (236.0) – –
Total gain recognized in the consolidated statement
of comprehensive income/income statement 54.3 – 5.5
At 30 June 2015 35.8 58.8 (30.1)
NWS HOLDINGS LIMITED124
Notes to the Financial Statements
5 Critical Accounting Estimates and JudgementsEstimates and judgements are continually evaluated by the Group and are based on historical experience and other factors,
including expectations of future events that are believed to be reasonable under the circumstance.
The Group makes estimates and assumptions concerning the future. The resulting accounting estimates will, by definition,
seldom equal to the related actual results. The estimates and assumptions that have a significant effect on carrying amounts of
assets and liabilities are as follows:
(a) Valuation of investment propertiesThe fair value of each investment property is individually determined at the end of each reporting period by management
or by independent valuers based on a market value assessment. Fair value is based on active market prices and adjusted
if necessary for any difference in nature, location or conditions of the specific asset. If the information is not available, the
Group uses alternative valuation methods such as recent prices on less active markets, income capitalization approach
or professional valuation. These methodologies are based upon estimates of future results and a set of assumptions
specific to each property to reflect its tenancy and cash flow profile. The fair value of each investment property reflects,
among other things, rental income from current leases and assumptions about rental income from future leases in the
light of current market conditions. The fair value also reflects, on a similar basis, any cash outflows that could be expected
in respect of the property.
At 30 June 2016, if the market value of investment properties had been 5% (2015: 5%) higher/lower with all other
variables held constant, the carrying value of the Group’s investment properties would have been HK$80.6 million (2015:
HK$197.2 million) higher/lower respectively.
(b) Impairment of assets other than property, plant and equipmentThe Group tests annually whether goodwill has suffered any impairment according to its recoverable amount determined
by the CGU based on value in use calculations and detailed in note 18(a). These calculations require the use of estimates
which are subject to changes of economic environment in future.
The Group determines whether an available-for-sale financial asset is impaired by the duration or extent to which the fair
value of an investment is less than its original cost.
The Group assesses whether there is objective evidence as stated in note 3(m) that deposits, loans and receivables are
impaired. It recognizes impairment based on estimates of the extent and timing of future cash flows using applicable
discount rates. The final outcome of the recoverability and cash flows of these receivables will impact the amount of
impairment required.
(c) Estimate of revenue, costs and foreseeable loss of construction worksThe Group recognizes its contract revenue according to the percentage of completion of the individual contract of
construction works. The Group reviews and revises the estimates of contract revenue, contract costs, variation orders
and contract claims prepared for each construction contract as the contract progresses. Budgeted construction income
is determined in accordance with the terms set out in the relevant contracts. Budgeted construction costs which mainly
comprise sub-contracting charges and costs of materials are prepared by the management on the basis of quotations
from time to time provided by major contractors, suppliers or vendors involved and the experience of the management.
Foreseeable loss will be provided when budgeted construction costs exceed budgeted construction income. In order
to keep the budget accurate and up-to-date, the Group’s management conducts periodic review on the management
budgets by comparing the budgeted amounts to the actual amounts incurred.
ANNUAL REPORT 2016 125
Notes to the Financial Statements
5 Critical Accounting Estimates and Judgements (continued)
(d) Estimated volume of Infrastructures of public servicesThe amortization for intangible concession rights and impairment assessment of Infrastructures for public services using
discounted cash flow model are affected by the estimated volume for public services, such as toll roads and bridges.
Management performs annual reviews to assess the appropriateness of estimated volume by making reference to
independent professional studies, if necessary.
The traffic volume is directly and indirectly affected by a number of factors, including the availability, quality, proximity
and toll rate differentials of alternative roads and the existence of other means of transportation. The growth of the
traffic flow is also highly tied to the future economic and transportation network development of the area in which the
Infrastructures serve, in particular those projects still in their ramp-up period such as Guangzhou Dongxin Expressway
and Guangzhou City Nansha Port Expressway (collectively, the “Expressways”). The growth in future traffic flow projected
by the management is highly dependent on the realization of the aforementioned factors.
For the year ended 30 June 2015, an impairment loss of HK$0.3 billion against investment in Guangzhou Dongxin
Expressway was shared by the Group. Management has conducted an impairment assessment of the Expressways
using discounted cash flow method. The estimated cash flows used in the assessment are based on assumptions,
such as growth of the traffic flow, growth of toll rate and discount rate, with reference to the business plan and prevailing
market conditions. Based on the assessment, management is of the view that there is no further impairment of the
Group’s investment in the Expressways as at 30 June 2016.
(e) Impairment of the Group’s investments in associated companies and joint venturesIn accordance with the requirements under HKAS 36 “Impairment of Assets”, management regularly reviews whether
there are any indications of impairment of the Group’s investments in associated companies and joint ventures based on
value in use calculations. In determining the value in use, management assesses the present value of estimated future
cash flows expected to arise from their businesses. Estimates and judgements are applied in determining these future
cash flows and discount rate. The following impairment assessments involved estimates and judgements that are more
sensitive and any deviation from estimates may result in the recoverable amount lower than the carrying amount.
(i) The Group holds approximately 16% equity interest in Tharisa plc (“Tharisa”), an associated company of the Group
incorporated in Cyprus with its ordinary shares dual-listed on the Johannesburg Stock Exchange Limited and
the London Stock Exchange plc (from June 2016) and principally engaged in platinum group metals and chrome
mining, processing and trading in South Africa.
As at 30 June 2016, the Group’s share of market value of Tharisa amounting to approximately HK$0.2 billion, is
lower than its carrying value of approximately HK$1.0 billion (before the impairment provision as detailed below).
Management has carried out an impairment assessment on the carrying value of such investment using the
discounted cash flow method. The estimated cash flows used in the assessment are based on assumptions,
such as revenue growth, metal price, production cost, proved and probable ore reserve, production capacity and
discount rate, with reference to the business plan and prevailing market conditions. Based on the assessment, an
impairment loss of HK$0.2 billion was provided against the Group’s investment in Tharisa during the year.
The assumptions used in the carrying value assessment are highly judgemental, and heavily dependent on the
discount rate used and metal price projection. For example, if the risk premium increases by 1.4%, or metal price
for the first five projection years decreases by 10% with other variables remain constant, any of such changes, if
adopted, would reduce the recoverable amount as determined by the value in use calculation to approximate the
carrying value of the Group.
NWS HOLDINGS LIMITED126
Notes to the Financial Statements
5 Critical Accounting Estimates and Judgements (continued)
(e) Impairment of the Group’s investments in associated companies and joint ventures (continued)(ii) The Group holds approximately 38% effective equity interest in Hyva Holding B.V. (“Hyva”), a private company and
a joint venture of the Group incorporated in the Netherlands and principally engaged in manufacturing and supply
of components used in hydraulic loading and unloading systems. As at 30 June 2016, the Group’s share of net
assets (including goodwill and intangible assets) of Hyva was approximately HK$1.4 billion (before the impairment
provision as detailed below).
Management of the joint venture has carried out an impairment assessment on the carrying value of such
investment using the discounted cash flow method.
The estimated cash flows used in the assessment are based on assumptions, such as sales growth, production
cost, production capacity and discount rate, with reference to the business plan and prevailing market conditions.
Based on the assessment, the Group shared an impairment loss of approximately HK$177.6 million on goodwill
of its Mainland China business segment in FY2016, primarily due to the weaker demand for hydraulic components
in Mainland China market.
The assumptions used in the carrying value assessment are highly judgemental, and heavily dependent on the
discount rate used and sales growth projection. For example, if the risk premium increases by 1.7%, or projected
revenue decreases by 14%, with other variables remain constant, any of such changes, if adopted, would reduce
the recoverable amount as determined by the value in use calculation to approximate the carrying value of
Mainland China market, a major cash-generating unit of Hyva representing approximately 47% of the value in use
of Hyva. Alternatively, if the risk premium increases by 1.2%, or projected revenue decreases by 4% with other
variables remain constant, any of such changes, if adopted, would reduce the recoverable amount as determined
by the value in use calculation to approximate the carrying value of American market, a cash-generating unit of
Hyva representing approximately 4% of the value in use of Hyva.
(iii) The Group holds 35.5% equity interest in Newton Resources, an associated company of the Group and listed
in the Hong Kong Stock Exchange and principally engaged in owning and operating the Yanjiazhuang Mine, an
iron ore mine in Hebei Province PRC. An impairment loss of HK$1.8 billion was provided against the Group’s
investment in Newton Resources for the year ended 30 June 2015.
As at 30 June 2016, the Group’s share of market value of Newton Resources amounting to approximately
HK$1.1 billion, is higher than its carrying value of approximately HK$1.0 billion. As such, management is of the view
that there is no further impairment provision required. However, in consideration of the uncertainties surrounding
Newton Resources’ business and the continued fluctuation in iron concentrates’ price that may impact its carrying
value, the management has carried out an impairment assessment on the carrying value of such investment using
the discount cash flow method.
The estimated cash flows used in the assessment are based on the assumption that the mine will commence its
operation in near future. Other assumptions applied such as revenue growth, iron concentrates’ price, production
cost, proved and probable ore reserve, production capacity and discount rate, with reference to the business plan
and prevailing market conditions. The assessment also indicated no further impairment on the carrying value of
Newton Resources as at 30 June 2016.

ANNUAL REPORT 2016 127
Notes to the Financial Statements
5 Critical Accounting Estimates and Judgements (continued)
(e) Impairment of the Group’s investments in associated companies and joint ventures (continued)(iii) (continued)
The assumptions used in the carrying value assessment are highly judgemental, and heavily dependent on the
discount rate used and iron concentrates’ price projection. For example, if the risk premium increases by 0.2%,
or the average iron concentrates’ price decreases by 1.6% with other variables remain constant, any of such
changes, if adopted, would reduce the recoverable amount as determined by the value in use calculation to
approximate the carrying value of the Group.
Furthermore, if the mine cannot commence its operation in near future, it will also have significant impact to the
carrying value assessment. However, management of the Group do not aware of any information up to date to
cast doubt on such assumption.
(iv) The Group holds 50% equity interest in NWS Transport Services Limited, a joint venture of the Group. As at
30 June 2016, the Group’s share of net assets (including goodwill) was approximately HK$2.1 billion.
Management has carried out a periodic impairment assessment as at 30 June 2016. The estimated cash flows
used in the assessment are based on assumptions, such as projected fare revenue, fuel costs and discount
rate, with reference to the business plan and prevailing market conditions. Such assumptions used are highly
judgemental, and heavily dependent on the projected fare revenue and discount rate used. For example, if the
projected fare revenue decreases by 1.3%, or the risk premium increases by 1.0%, with other variables remain
constant, any of such changes, if adopted, would reduce the recoverable amount as determined by the value in
use calculation to approximate the carrying value of the Group.
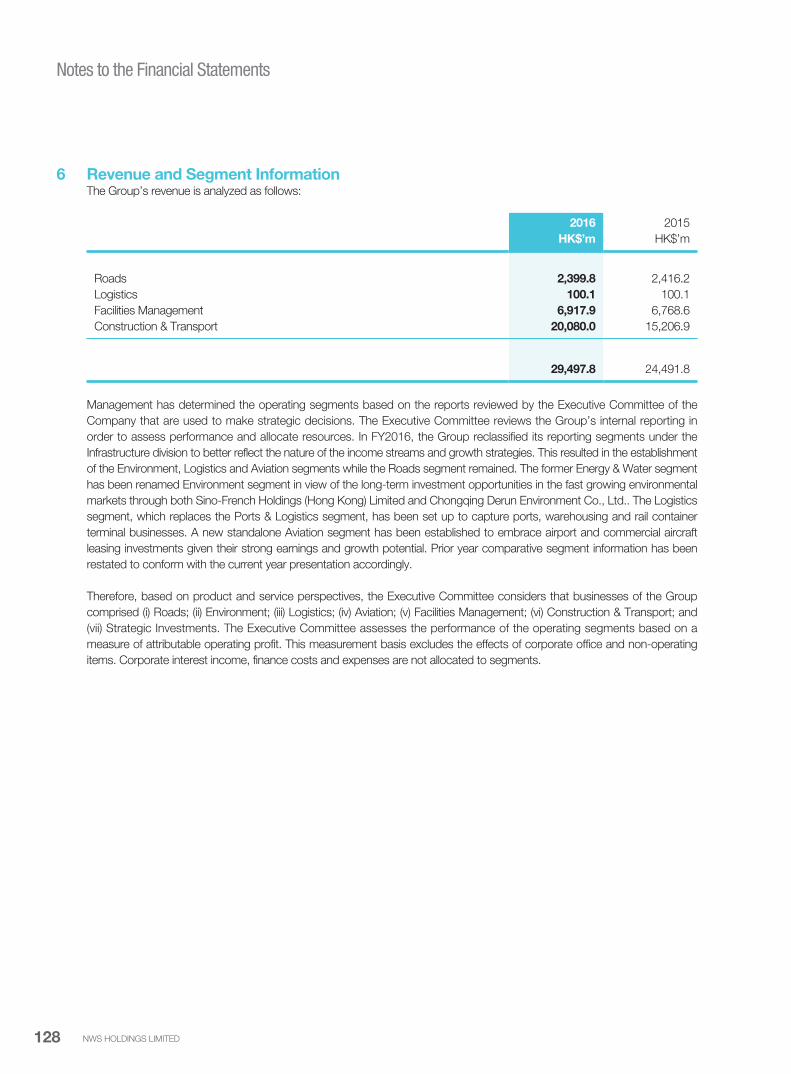
NWS HOLDINGS LIMITED128
Notes to the Financial Statements
6 Revenue and Segment InformationThe Group’s revenue is analyzed as follows:
2016 2015
HK$’m HK$’m
Roads 2,399.8 2,416.2
Logistics 100.1 100.1
Facilities Management 6,917.9 6,768.6
Construction & Transport 20,080.0 15,206.9
29,497.8 24,491.8
Management has determined the operating segments based on the reports reviewed by the Executive Committee of the
Company that are used to make strategic decisions. The Executive Committee reviews the Group’s internal reporting in
order to assess performance and allocate resources. In FY2016, the Group reclassified its reporting segments under the
Infrastructure division to better reflect the nature of the income streams and growth strategies. This resulted in the establishment
of the Environment, Logistics and Aviation segments while the Roads segment remained. The former Energy & Water segment
has been renamed Environment segment in view of the long-term investment opportunities in the fast growing environmental
markets through both Sino-French Holdings (Hong Kong) Limited and Chongqing Derun Environment Co., Ltd.. The Logistics
segment, which replaces the Ports & Logistics segment, has been set up to capture ports, warehousing and rail container
terminal businesses. A new standalone Aviation segment has been established to embrace airport and commercial aircraft
leasing investments given their strong earnings and growth potential. Prior year comparative segment information has been
restated to conform with the current year presentation accordingly.
Therefore, based on product and service perspectives, the Executive Committee considers that businesses of the Group
comprised (i) Roads; (ii) Environment; (iii) Logistics; (iv) Aviation; (v) Facilities Management; (vi) Construction & Transport; and
(vii) Strategic Investments. The Executive Committee assesses the performance of the operating segments based on a
measure of attributable operating profit. This measurement basis excludes the effects of corporate office and non-operating
items. Corporate interest income, finance costs and expenses are not allocated to segments.

ANNUAL REPORT 2016 129
Notes to the Financial Statements
6 Revenue and Segment Information (continued)(a) The information of the reportable segments provided to the Executive Committee for the year is as follows:
HK$’m Roads Environment Logistics Aviation
Facilities
Management
Construction
& Transport
Strategic
Investments Total
2016
Total revenue 2,399.8 – 100.1 – 6,933.0 20,198.9 – 29,631.8
Inter-segment – – – – (15.1) (118.9) – (134.0)
Revenue – external 2,399.8 – 100.1 – 6,917.9 20,080.0 – 29,497.8
Attributable operating profit
Company and subsidiaries 728.3 14.2 68.2 4.1 658.0 556.6 207.0 2,236.4
Associated companies 73.6 8.7 109.0 419.9 (16.5) 158.9 172.4 (ii) 926.0 (b)
Joint ventures 457.9 446.9 525.4 – 3.5 196.1 (i) (52.6) 1,577.2 (b)
1,259.8 469.8 702.6 424.0 645.0 911.6 326.8 4,739.6
Reconciliation – corporate office and
non-operating items
Gain on fair value of investment
properties 1,420.0
Gain on disposal of an available-for-sale
financial asset 534.1
Gain on disposal of projects, net of tax 199.4
Net gain on deemed disposal of
a project under a joint venture 179.3 (b)
Share of profit from Harbour Place,
a residential development project 2.0
Impairment loss of an available-for-sale
financial asset (670.4) (iii)
Impairment loss related to
an associated company (200.0) (b)
Impairment loss related to
a joint venture (177.6) (b)
Net exchange loss (368.8)
Interest income 198.1
Finance costs (546.3)
Expenses and others (396.6)
Profit attributable to shareholders 4,912.8
(i) The amount includes the Group’s share of attributable operating profit of HK$196.1 million from its Transport
business.
(ii) The amount includes the Group’s share of attributable operating profit of HK$143.2 million from certain associated
companies engaged in investment activities.
(iii) The amount represents the impairment loss arising from the drop in the share price of Haitong International
Securities Group Limited (“Haitong International”) (note 7). The Group’s investment in Haitong International is
classified as an available-for-sale financial asset.
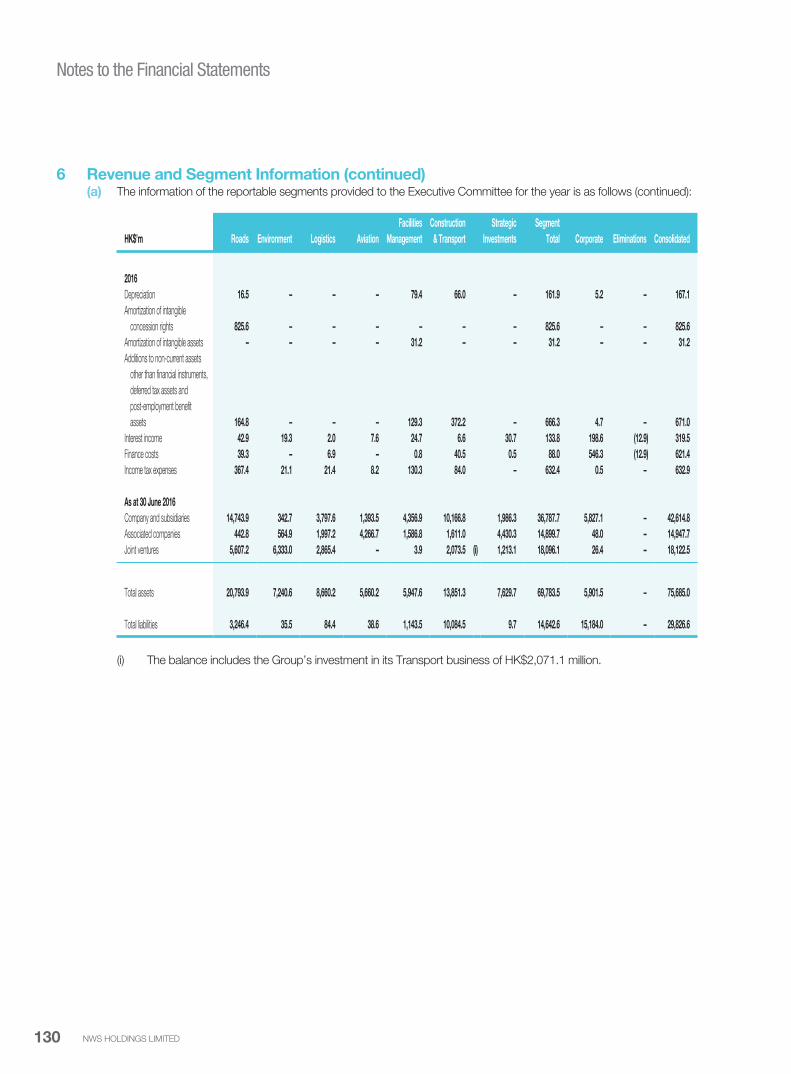
NWS HOLDINGS LIMITED130
Notes to the Financial Statements
6 Revenue and Segment Information (continued)(a) The information of the reportable segments provided to the Executive Committee for the year is as follows (continued):
HK$’m Roads Environment Logistics Aviation
Facilities
Management
Construction
& Transport
Strategic
Investments
Segment
Total Corporate Eliminations Consolidated
2016
Depreciation 16.5 – – – 79.4 66.0 – 161.9 5.2 – 167.1
Amortization of intangible
concession rights 825.6 – – – – – – 825.6 – – 825.6
Amortization of intangible assets – – – – 31.2 – – 31.2 – – 31.2
Additions to non-current assets
other than financial instruments,
deferred tax assets and
post-employment benefit
assets 164.8 – – – 129.3 372.2 – 666.3 4.7 – 671.0
Interest income 42.9 19.3 2.0 7.6 24.7 6.6 30.7 133.8 198.6 (12.9) 319.5
Finance costs 39.3 – 6.9 – 0.8 40.5 0.5 88.0 546.3 (12.9) 621.4
Income tax expenses 367.4 21.1 21.4 8.2 130.3 84.0 – 632.4 0.5 – 632.9
As at 30 June 2016
Company and subsidiaries 14,743.9 342.7 3,797.6 1,393.5 4,356.9 10,166.8 1,986.3 36,787.7 5,827.1 – 42,614.8
Associated companies 442.8 564.9 1,997.2 4,266.7 1,586.8 1,611.0 4,430.3 14,899.7 48.0 – 14,947.7
Joint ventures 5,607.2 6,333.0 2,865.4 – 3.9 2,073.5 (i) 1,213.1 18,096.1 26.4 – 18,122.5
Total assets 20,793.9 7,240.6 8,660.2 5,660.2 5,947.6 13,851.3 7,629.7 69,783.5 5,901.5 – 75,685.0
Total liabilities 3,246.4 35.5 84.4 38.6 1,143.5 10,084.5 9.7 14,642.6 15,184.0 – 29,826.6
(i) The balance includes the Group’s investment in its Transport business of HK$2,071.1 million.
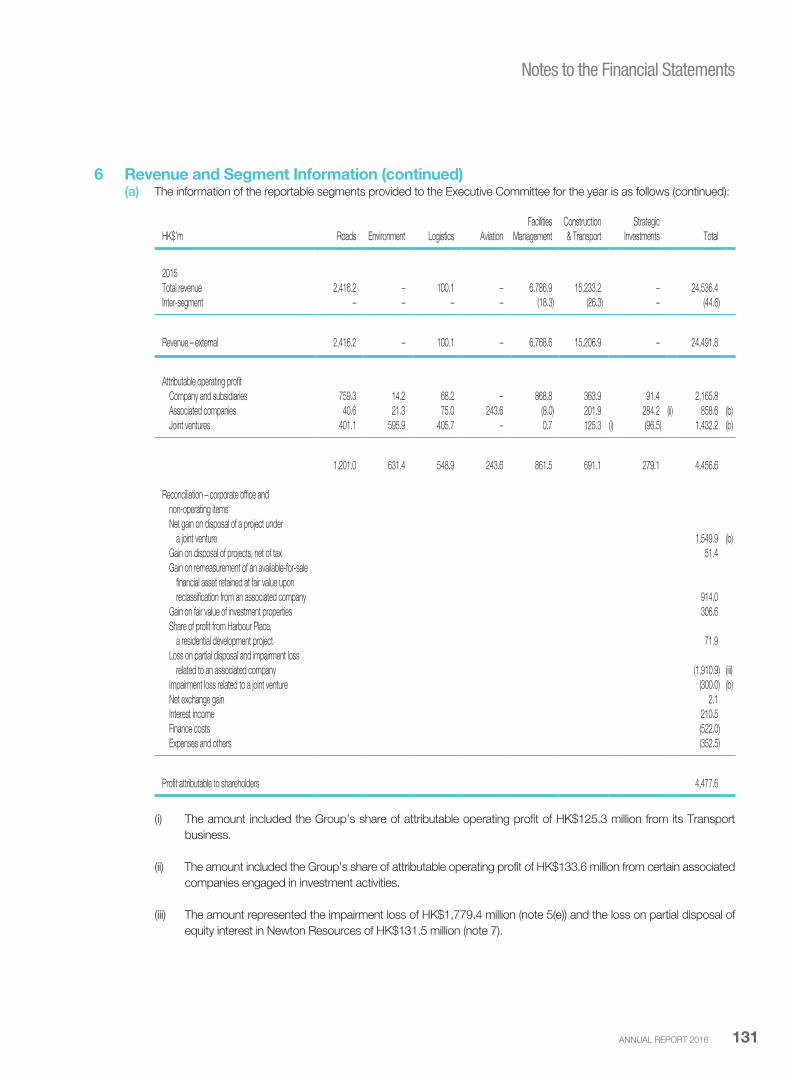
ANNUAL REPORT 2016 131
Notes to the Financial Statements
6 Revenue and Segment Information (continued)(a) The information of the reportable segments provided to the Executive Committee for the year is as follows (continued):
HK$’m Roads Environment Logistics Aviation
Facilities
Management
Construction
& Transport
Strategic
Investments Total
2015
Total revenue 2,416.2 – 100.1 – 6,786.9 15,233.2 – 24,536.4
Inter-segment – – – – (18.3) (26.3) – (44.6)
Revenue – external 2,416.2 – 100.1 – 6,768.6 15,206.9 – 24,491.8
Attributable operating profit
Company and subsidiaries 759.3 14.2 68.2 – 868.8 363.9 91.4 2,165.8
Associated companies 40.6 21.3 75.0 243.6 (8.0) 201.9 284.2 (ii) 858.6 (b)
Joint ventures 401.1 595.9 405.7 – 0.7 125.3 (i) (96.5) 1,432.2 (b)
1,201.0 631.4 548.9 243.6 861.5 691.1 279.1 4,456.6
Reconciliation – corporate office and
non-operating items
Net gain on disposal of a project under
a joint venture 1,549.9 (b)
Gain on disposal of projects, net of tax 51.4
Gain on remeasurement of an available-for-sale
financial asset retained at fair value upon
reclassification from an associated company 914.0
Gain on fair value of investment properties 306.6
Share of profit from Harbour Place,
a residential development project 71.9
Loss on partial disposal and impairment loss
related to an associated company (1,910.9) (iii)
Impairment loss related to a joint venture (300.0) (b)
Net exchange gain 2.1
Interest income 210.5
Finance costs (522.0)
Expenses and others (352.5)
Profit attributable to shareholders 4,477.6
(i) The amount included the Group’s share of attributable operating profit of HK$125.3 million from its Transport
business.
(ii) The amount included the Group’s share of attributable operating profit of HK$133.6 million from certain associated
companies engaged in investment activities.
(iii) The amount represented the impairment loss of HK$1,779.4 million (note 5(e)) and the loss on partial disposal of
equity interest in Newton Resources of HK$131.5 million (note 7).

NWS HOLDINGS LIMITED132
Notes to the Financial Statements
6 Revenue and Segment Information (continued)(a) The information of the reportable segments provided to the Executive Committee for the year is as follows (continued):
HK$’m Roads Environment Logistics Aviation
Facilities
Management
Construction
& Transport
Strategic
Investments
Segment
Total Corporate Eliminations Consolidated
2015
Depreciation 11.1 – – – 64.2 49.8 – 125.1 5.4 – 130.5
Amortization of intangible
concession rights 836.3 – – – – – – 836.3 – – 836.3
Amortization of intangible assets – – – – 31.2 – – 31.2 – – 31.2
Additions to non-current assets
other than financial instruments,
deferred tax tax assets and
post-employment benefit
assets 64.6 – – – 126.8 82.4 – 273.8 6.8 – 280.6
Interest income 100.6 22.4 6.1 7.3 1.4 7.3 – 145.1 216.7 (14.5) 347.3
Finance costs 97.3 – 7.8 – 0.6 23.7 0.8 130.2 522.0 (14.5) 637.7
Income tax expenses 349.0 19.7 19.0 8.2 175.1 17.7 (53.4) 535.3 (59.1) – 476.2
As at 30 June 2015
Company and subsidiaries 15,722.2 530.0 2,426.1 1,543.5 4,262.5 7,465.0 2,499.9 34,449.2 8,946.5 – 43,395.7
Associated companies 488.0 615.6 1,534.9 4,469.5 902.3 1,631.2 3,803.0 13,444.5 35.9 – 13,480.4
Joint ventures 5,993.9 6,290.1 2,990.9 – 6.3 1,908.6 (i) 997.0 18,186.8 90.7 – 18,277.5
Total assets 22,204.1 7,435.7 6,951.9 6,013.0 5,171.1 11,004.8 7,299.9 66,080.5 9,073.1 – 75,153.6
Total liabilities 3,972.7 21.8 70.1 58.3 1,205.9 7,481.2 4.3 12,814.3 16,151.6 – 28,965.9
(i) The balance included the Group’s investment in its Transport business of HK$1,898.2 million.
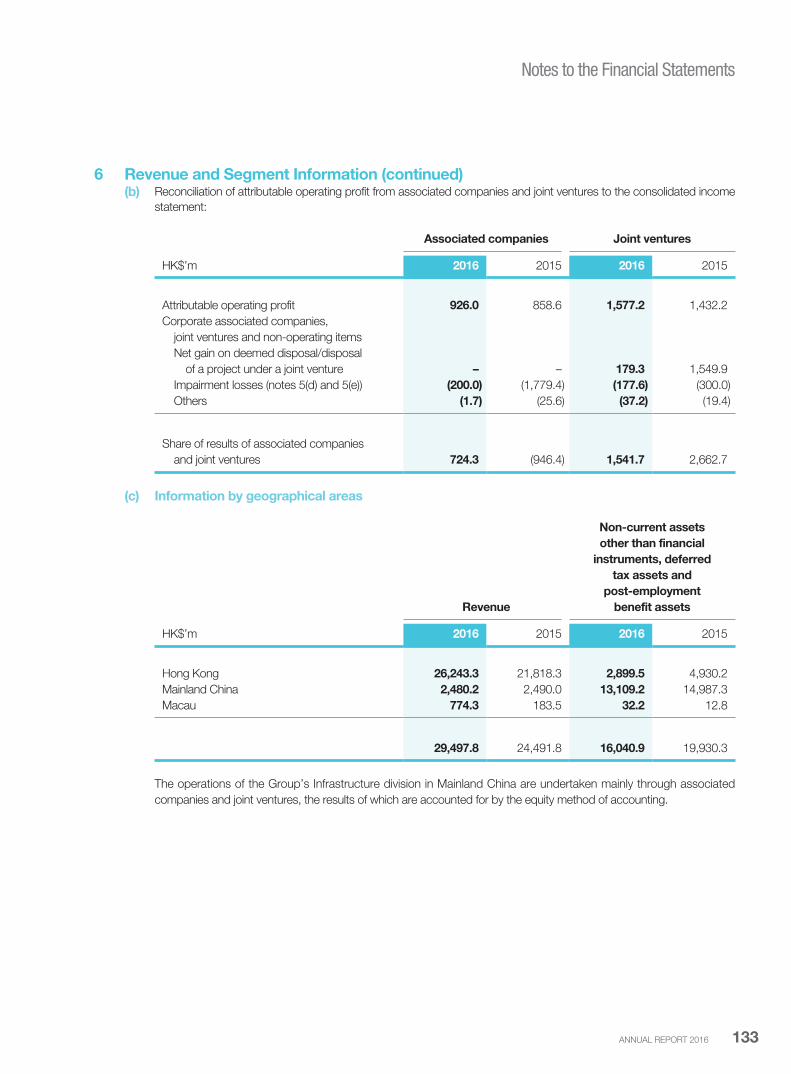
ANNUAL REPORT 2016 133
Notes to the Financial Statements
6 Revenue and Segment Information (continued)(b) Reconciliation of attributable operating profit from associated companies and joint ventures to the consolidated income
statement:
Associated companies Joint ventures
HK$’m 2016 2015 2016 2015
Attributable operating profit 926.0 858.6 1,577.2 1,432.2
Corporate associated companies,
joint ventures and non-operating items
Net gain on deemed disposal/disposal
of a project under a joint venture – – 179.3 1,549.9
Impairment losses (notes 5(d) and 5(e)) (200.0) (1,779.4) (177.6) (300.0)
Others (1.7) (25.6) (37.2) (19.4)
Share of results of associated companies
and joint ventures 724.3 (946.4) 1,541.7 2,662.7
(c) Information by geographical areas
Revenue
Non-current assets
other than financial
instruments, deferred
tax assets and
post-employment
benefit assets
HK$’m 2016 2015 2016 2015
Hong Kong 26,243.3 21,818.3 2,899.5 4,930.2
Mainland China 2,480.2 2,490.0 13,109.2 14,987.3
Macau 774.3 183.5 32.2 12.8
29,497.8 24,491.8 16,040.9 19,930.3
The operations of the Group’s Infrastructure division in Mainland China are undertaken mainly through associated
companies and joint ventures, the results of which are accounted for by the equity method of accounting.

NWS HOLDINGS LIMITED134
Notes to the Financial Statements
7 Other Income/Gains
2016 2015
Note HK$’m HK$’m
Gain on fair value of investment properties 15 1,420.0 306.6
Profit on disposal of available-for-sale financial assets 645.1 25.2
Gain on remeasurement of an available-for-sale financial asset retained
at fair value upon reclassification from an associated company – 914.0
Profit on disposal of a subsidiary 38(b) 95.0 5.1
Profit on disposal of a joint venture 53.2 –
Profit on disposal of intangible concession rights and
their related assets and liabilities 58.7 –
Net profit on disposal of property, plant and equipment – 61.6
Profit on disposal of an asset held-for-sale 15.0 –
Profit on disposal of a financial asset at fair value through profit or loss – 10.7
Interest income 319.5 347.3
Machinery hire income 96.1 99.8
Dividend income 65.8 3.5
Other income 38.6 45.7
Management fee income 23.0 32.9
Net exchange (loss)/gain (458.6) 53.3
Impairment loss of an available-for-sale financial asset 6(a) (670.4) –
Loss on partial disposal of an associated company 6(a) – (131.5)
1,701.0 1,774.2
8 Operating ProfitOperating profit of the Group is arrived at after crediting and charging the following:
2016 2015
HK$’m HK$’m
Crediting
Gross rental income from investment properties 164.3 163.2
Less: outgoings (26.3) (25.9)
138.0 137.3

ANNUAL REPORT 2016 135
Notes to the Financial Statements
8 Operating Profit (continued)Operating profit of the Group is arrived at after crediting and charging the following (continued):
2016 2015
Note HK$’m HK$’m
Charging
Auditor’s remuneration 22.3 20.8
Cost of inventories sold 2,375.0 2,319.6
Cost of services rendered 23,770.3 19,021.5
Depreciation 16 167.1 130.5
Amortization of intangible concession rights 17 825.6 836.3
Amortization of intangible assets 18 31.2 31.2
Operating lease rental expenses – properties 84.3 73.5
Staff costs (including directors’ emoluments (note 14)) 9 3,034.1 2,661.3
9 Staff Costs
(a) Staff costs
2016 2015
Note HK$’m HK$’m
Wages, salaries and other benefits 2,958.2 2,550.5
Share-based payments 30 27.8 79.7
Pension costs – defined contribution plans 123.8 109.3
Pension costs – defined benefits plans 2.3 2.2
3,112.1 2,741.7
Less: capitalized under contracts in progress (78.0) (80.4)
8 3,034.1 2,661.3
Directors’ emoluments are included in staff costs.

NWS HOLDINGS LIMITED136
Notes to the Financial Statements
9 Staff Costs (continued)
(b) Five highest paid individualsThe five individuals whose emoluments are the highest in the Group for the year include four (2015: five) directors whose
emoluments are reflected in note 14(a). The emoluments of the remaining one individual (2015: Nil) during the year are as
follows:
2016 2015
HK$’m HK$’m
Fees 0.1 –
Basic salaries, allowances and other benefits 11.1 –
Employer’s contribution to retirement benefits schemes 0.5 –
11.7 –
Deemed share option benefits 0.5 –
12.2 –
(c) Emoluments of senior managementOther than the emoluments of five highest paid individuals and directors disclosed in notes 9(b) and 14(a) respectively, the
emoluments of the senior management whose profiles are included in the “Board of Directors and Senior Management”
section of this report (excluding Mr Cheng Wai Po, Samuel, who is the senior management of a joint venture of the
Company, the results of which are equity accounted for in the consolidated financial statements) fell within the following
bands:
Number of individual(s)
2016 2015
Emolument band (HK$)
2,000,001 – 3,000,000 5 2
3,000,001 – 4,000,000 4 6
4,000,001 – 5,000,000 1 3
5,000,001 – 6,000,000 1 2
6,000,001 – 7,000,000 1 –
7,000,001 – 8,000,000 1 1
9,000,001 – 10,000,000 – 1
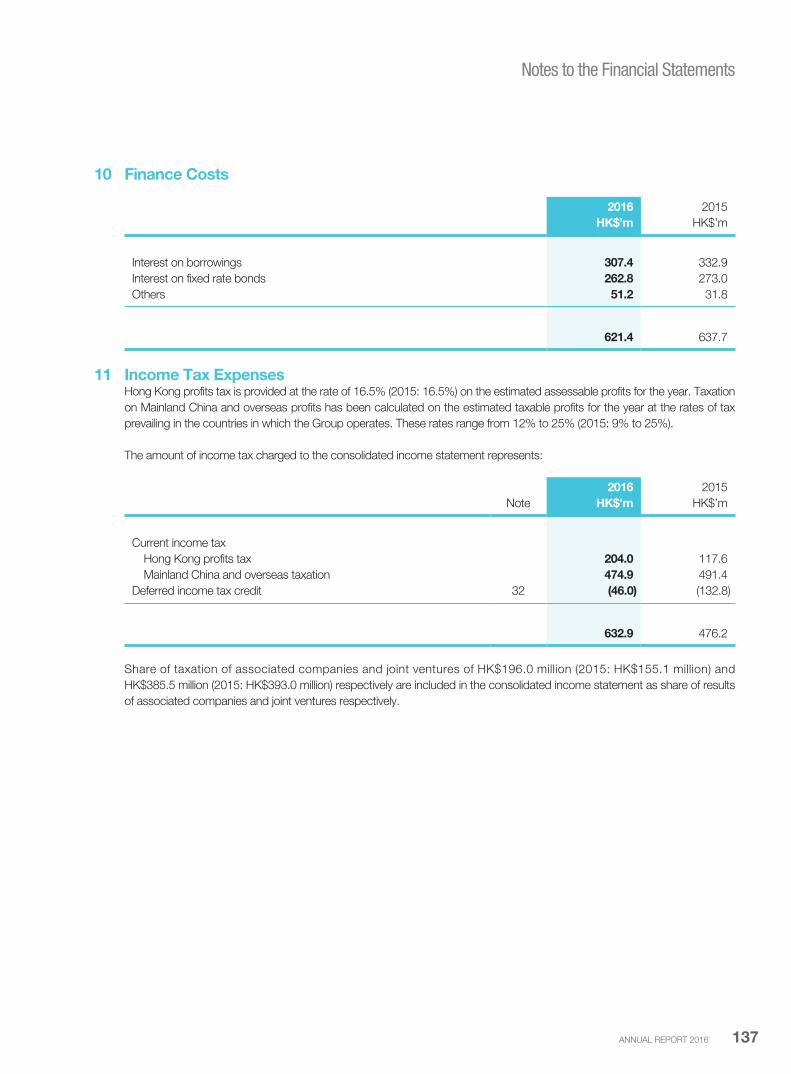
ANNUAL REPORT 2016 137
Notes to the Financial Statements
10 Finance Costs
2016 2015
HK$’m HK$’m
Interest on borrowings 307.4 332.9
Interest on fixed rate bonds 262.8 273.0
Others 51.2 31.8
621.4 637.7
11 Income Tax ExpensesHong Kong profits tax is provided at the rate of 16.5% (2015: 16.5%) on the estimated assessable profits for the year. Taxation
on Mainland China and overseas profits has been calculated on the estimated taxable profits for the year at the rates of tax
prevailing in the countries in which the Group operates. These rates range from 12% to 25% (2015: 9% to 25%).
The amount of income tax charged to the consolidated income statement represents:
2016 2015
Note HK$’m HK$’m
Current income tax
Hong Kong profits tax 204.0 117.6
Mainland China and overseas taxation 474.9 491.4
Deferred income tax credit 32 (46.0) (132.8)
632.9 476.2
Share of taxation of associated companies and joint ventures of HK$196.0 million (2015: HK$155.1 million) and
HK$385.5 million (2015: HK$393.0 million) respectively are included in the consolidated income statement as share of results
of associated companies and joint ventures respectively.
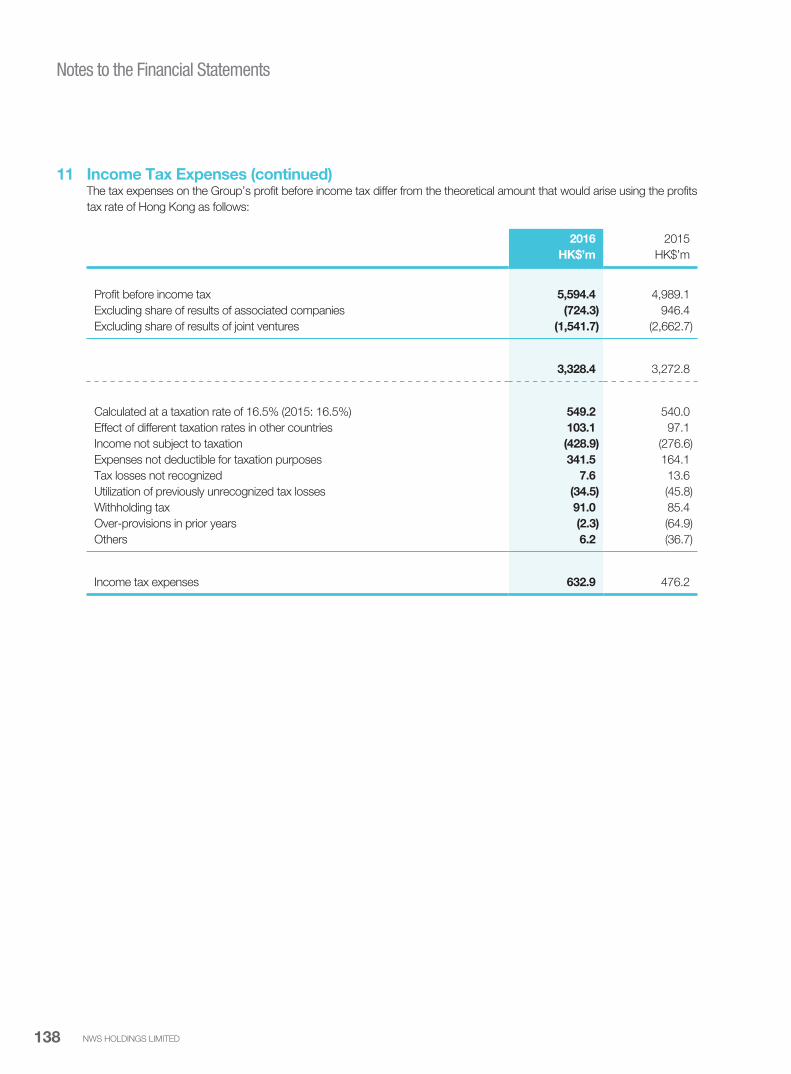
NWS HOLDINGS LIMITED138
Notes to the Financial Statements
11 Income Tax Expenses (continued)The tax expenses on the Group’s profit before income tax differ from the theoretical amount that would arise using the profits
tax rate of Hong Kong as follows:
2016 2015
HK$’m HK$’m
Profit before income tax 5,594.4 4,989.1
Excluding share of results of associated companies (724.3) 946.4
Excluding share of results of joint ventures (1,541.7) (2,662.7)
3,328.4 3,272.8
Calculated at a taxation rate of 16.5% (2015: 16.5%) 549.2 540.0
Effect of different taxation rates in other countries 103.1 97.1
Income not subject to taxation (428.9) (276.6)
Expenses not deductible for taxation purposes 341.5 164.1
Tax losses not recognized 7.6 13.6
Utilization of previously unrecognized tax losses (34.5) (45.8)
Withholding tax 91.0 85.4
Over-provisions in prior years (2.3) (64.9)
Others 6.2 (36.7)
Income tax expenses 632.9 476.2

ANNUAL REPORT 2016 139
Notes to the Financial Statements
12 Dividends
2016 2015
HK$’m HK$’m
Interim dividend paid of HK$0.31 (2015: HK$0.27) per share 1,179.6 1,014.3
Final dividend proposed of HK$0.34 (2015: paid of HK$0.33) per share 1,302.9 1,245.9
2,482.5 2,260.2
At a meeting held on 20 September 2016, the Board recommended a final dividend of HK$0.34 per share in scrip form with a
cash option. This proposed dividend is not reflected as a dividend payable in the consolidated financial statements but will be
reflected as an appropriation of the retained profits for FY2017.
Subject to the passing of the relevant resolution at the 2016 AGM and the Listing Committee of the Hong Kong Stock
Exchange granting the listing of and permission to deal in the new shares to be issued under the proposed final dividend,
each shareholder will be allotted fully paid shares having an aggregate market value equal to the total amount which such
shareholders could elect to receive in cash and they will be given the option of electing to receive payment in cash of HK$0.34
per share instead of the allotment of shares.
13 Earnings Per ShareThe calculation of basic earnings per share for the year is based on earnings of HK$4,912.8 million (2015: HK$4,477.6 million)
and on the weighted average of 3,793,701,910 (2015: 3,751,443,482) ordinary shares outstanding during the year.
For both FY2016 and FY2015, the share options of the Company have an anti-dilutive effect on the basic earnings per share
and are ignored in the calculation of diluted earnings per share.

NWS HOLDINGS LIMITED140
Notes to the Financial Statements
14 Benefits and Interests of Directors(a) The aggregate amounts of emoluments of the directors of the Company are as follows:
2016 2015
Note HK$’m HK$’m
Fees 4.6 4.1
Basic salaries, allowances and other benefits 54.4 41.9
Employer’s contribution to retirement benefits schemes 2.5 2.3
(i) 61.5 48.3
Deemed share option benefits (ii) 17.2 48.4
78.7 96.7
Remuneration package, including basic salaries, allowances and other benefits, contribution to retirement benefits
scheme and share option benefits, is determined according to individual performance, job responsibility and seniority,
and is reviewed with reference to market conditions.
During the year, the Group did not pay the directors any inducement to join or upon joining the Group, or as
compensation for loss of office. No director waived or agreed to waive any emoluments during the year.

ANNUAL REPORT 2016 141
Notes to the Financial Statements
14 Benefits and Interests of Directors (continued)(a) The aggregate amounts of emoluments of the directors of the Company are as follows (continued):
(i) The remunerations of individual directors are set out below:
Fees
Basic
salaries,
allowances
and other
benefits
Employer’s
contribution
to retirement
benefits
schemes
2016
Total
emoluments
2015
Total
emoluments
Name of director HK$’m HK$’m HK$’m HK$’m HK$’m
Dr Cheng Kar Shun, Henry 0.53 13.17 0.53 14.23 13.50
Mr Tsang Yam Pui 0.42 10.37 0.74 11.53 9.33
Mr Hui Hon Chung* 0.09 4.52 0.23 4.84 –
Mr Cheung Chin Cheung 0.28 7.03 0.47 7.78 7.40
Mr Cheng Chi Ming, Brian 0.28 6.55 0.32 7.15 6.79
Mr To Hin Tsun, Gerald 0.23 0.06 – 0.29 0.26
Mr Dominic Lai 0.36 0.09 – 0.45 0.42
Mr Lam Wai Hon, Patrick** 0.33 12.12 0.25 12.70 8.18
Mr William Junior Guilherme Doo 0.28 0.06 – 0.34 0.33
Mr Kwong Che Keung, Gordon 0.48 0.10 – 0.58 0.55
Dr Cheng Wai Chee, Christopher 0.40 0.10 – 0.50 0.47
Mr Shek Lai Him, Abraham 0.45 0.09 – 0.54 0.52
Mr Lee Yiu Kwong, Alan 0.28 0.07 – 0.35 0.32
Mr Wilfried Ernst Kaffenberger^ 0.20 0.05 – 0.25 0.26
4.61 54.38 2.54 61.53 48.33
* Appointed on 1 September 2015
** Re-designated from executive director to non-executive director on 1 January 2016^ Retired on 17 November 2015

NWS HOLDINGS LIMITED142
Notes to the Financial Statements
14 Benefits and Interests of Directors (continued)(a) The aggregate amounts of emoluments of the directors of the Company are as follows (continued):
(ii) The deemed share option benefits of individual directors are set out below:
2016 2015
Deemed share Deemed share
option benefits option benefits
Name of director HK$’m HK$’m
Dr Cheng Kar Shun, Henry 4.07 11.45
Mr Tsang Yam Pui 2.03 5.72
Mr Cheung Chin Cheung 2.03 5.72
Mr Cheng Chi Ming, Brian 2.03 5.72
Mr To Hin Tsun, Gerald 0.38 1.08
Mr Dominic Lai 0.38 1.08
Mr Lam Wai Hon, Patrick 2.03 5.72
Mr William Junior Guilherme Doo 0.38 1.08
Mr Kwong Che Keung, Gordon 0.77 2.17
Dr Cheng Wai Chee, Christopher 0.77 2.17
Mr Shek Lai Him, Abraham 0.77 2.17
Mr Lee Yiu Kwong, Alan 0.77 2.17
Mr Wilfried Ernst Kaffenberger 0.77 2.17
17.18 48.42
The deemed share option benefits are calculated in accordance with the requirement as stipulated in HKFRS 2
“Share-based payment”. None of the directors of the Company has exercised the share options during the year.
(b) Directors’ material interest in transactions, arrangements or contractsOn 11 April 2014, the DOO Master Services Agreement was entered into between the Company and Mr Doo whereby
each of the Company and Mr Doo agreed to, and agreed to procure that members of the Group or the Services Group
(being Mr Doo and any company in the equity capital of which Mr Doo is or will be directly or indirectly interested so as
to exercise or control the exercise of 30% (or such other amount as may from time to time be specified in the Takeovers
Code as being the level for triggering a mandatory general offer) or more of the voting power at general meetings from
time to time or to control the composition of a majority of the board of directors, and the subsidiaries of such other
companies) (to the extent practicable), engage relevant members of the Services Group or the Group to provide certain
operational services to relevant members of the Group or the Services Group during the term of the DOO Master Services
Agreement.
The DOO Master Services Agreement has an initial term of three years commencing from 1 July 2014. For the year ended
30 June 2016, the approximate total contract sum was HK$1,399.3 million (2015: HK$784.8 million).
On 20 November 2015, Mr Doo and the Company entered into a supplemental agreement to the DOO Master Services
Agreement, with FSE Engineering and FSE Management joining in as parties, as an operational agreement to better
reflect the provision and receipt of the abovementioned operational services by FSE Engineering and FSE Management,
both of which are members of the Services Group.
Save as mentioned above, no other significant transaction, arrangements and contracts in relation to the Group’s
business to which the Company was a party and in which a director of the Company had a material interest, whether
directly or indirectly, subsisted at the end of the year or at any time during the year.

ANNUAL REPORT 2016 143
Notes to the Financial Statements
15 Investment Properties
HK$’m Note
Commercial
and industrial
properties in
Hong Kong
Residential
properties
in Mainland
China Total
At 1 July 2015 3,924.9 19.1 3,944.0
Fair value changes 7 1,415.4 4.6 1,420.0
Reclassified as assets held-for-sale 27 (3,750.0) – (3,750.0)
Translation differences – (1.4) (1.4)
At 30 June 2016 1,590.3 22.3 1,612.6
HK$’m Note
Commercial
and industrial
properties in
Hong Kong
Residential
properties
in Mainland
China Total
At 1 July 2014 3,620.1 23.7 3,643.8
Additions – 0.2 0.2
Disposal of a subsidiary 38(b) – (5.6) (5.6)
Fair value changes 7 305.8 0.8 306.6
Adjustment to total estimated construction costs (1.0) – (1.0)
At 30 June 2015 3,924.9 19.1 3,944.0
The investment properties of the Group measured at fair value are categorized as Level 3 in the fair value hierarchy. The Group’s
policy is to recognize transfers into and transfers out of fair value hierarchy levels as of the date of the event or change in
circumstances that caused the transfer. There was no transfer among Levels 1, 2, and 3 during the year except as detailed in
note 27.
(a) Valuation process of the GroupThe investment properties were revalued on 30 June 2016 by independent, professionally qualified valuers, Savills
Valuation and Professional Services Limited or Knight Frank Petty Limited based on a market value assessment or
income approach as detailed in note 5(a).
The Group’s management reviews the valuations performed by the independent valuers for financial reporting purposes.
Discussions of valuation processes and results are held between the management and valuers at least once every six
months, in line with the Group’s interim and annual reporting dates.

NWS HOLDINGS LIMITED144
Notes to the Financial Statements
15 Investment Properties (continued)
(b) Valuation methodsFair values of the residential properties in Mainland China and industrial properties in Hong Kong are generally derived
using the sales comparison method. This valuation method is based on comparing the properties to be valued directly
with other comparable properties, which have recently transacted. However, given the heterogeneous nature of real
estate properties, appropriate adjustments are usually required to allow for any qualitative differences that may affect the
price likely to be achieved by the properties under consideration.
Fair values of commercial properties in Hong Kong are generally derived using the income capitalization method.
This valuation method is based on the capitalization of the net income and reversionary income potential by adopting
appropriate capitalization rates, which are derived from analysis of sale transactions and valuers’ interpretation of
prevailing investor requirements or expectations. The prevailing market rents adopted in the valuation have reference to
recent lettings, within the subject properties and other comparable properties.
There were no changes to the valuation techniques during the year.
(c) Significant unobservable inputs used to determine fair value
Fair value at
30 June 2016
HK$’m
Fair value at
30 June 2015
HK$’m
Valuation
methods
Unobservable
inputs
Range of
unobservable
inputs for 2016
Range of
unobservable
inputs for 2015 Note
Commercial and industrial
properties in Hong Kong
1,441.0 3,779.0 Income capitalization Capitalization rate 4.25% – 5.40% 4.25% – 6.50% (i)
Average monthly rental HK$36 –
HK$480/sq.ft
HK$3,385 per
carpark space
HK$13.7 –
HK$480/sq.ft
HK$3,200 –
HK$4,250 per
carpark space
(ii)
149.3 145.9 Sales comparison Property – specific
adjusting factor
0.8 – 1.3 0.8 – 1.2 (ii)
Residential properties in
Mainland China
22.3 19.1 Sales comparison Property – specific
adjusting factor
0.9 – 1.1 0.9 – 1.2 (ii)
1,612.6 3,944.0
Notes: Descriptions of the sensitivity in unobservable inputs and inter-relationship:
(i) The fair value measurement is negatively correlated to the unobservable input that the lower the factor will result in a higher fair
value.
(ii) The fair value measurement is positively correlated to the unobservable input that the higher the factor will result in a higher fair
value.
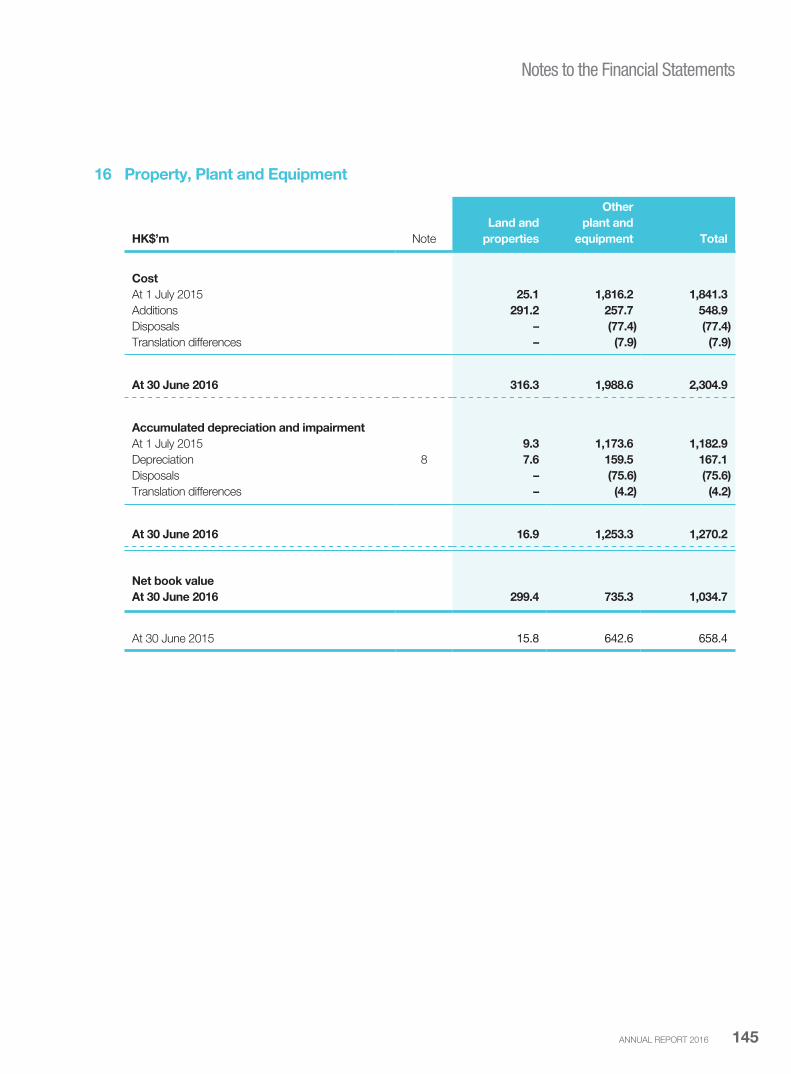
ANNUAL REPORT 2016 145
Notes to the Financial Statements
16 Property, Plant and Equipment
HK$’m Note
Land and
properties
Other
plant and
equipment Total
Cost
At 1 July 2015 25.1 1,816.2 1,841.3
Additions 291.2 257.7 548.9
Disposals – (77.4) (77.4)
Translation differences – (7.9) (7.9)
At 30 June 2016 316.3 1,988.6 2,304.9
Accumulated depreciation and impairment
At 1 July 2015 9.3 1,173.6 1,182.9
Depreciation 8 7.6 159.5 167.1
Disposals – (75.6) (75.6)
Translation differences – (4.2) (4.2)
At 30 June 2016 16.9 1,253.3 1,270.2
Net book value
At 30 June 2016 299.4 735.3 1,034.7
At 30 June 2015 15.8 642.6 658.4
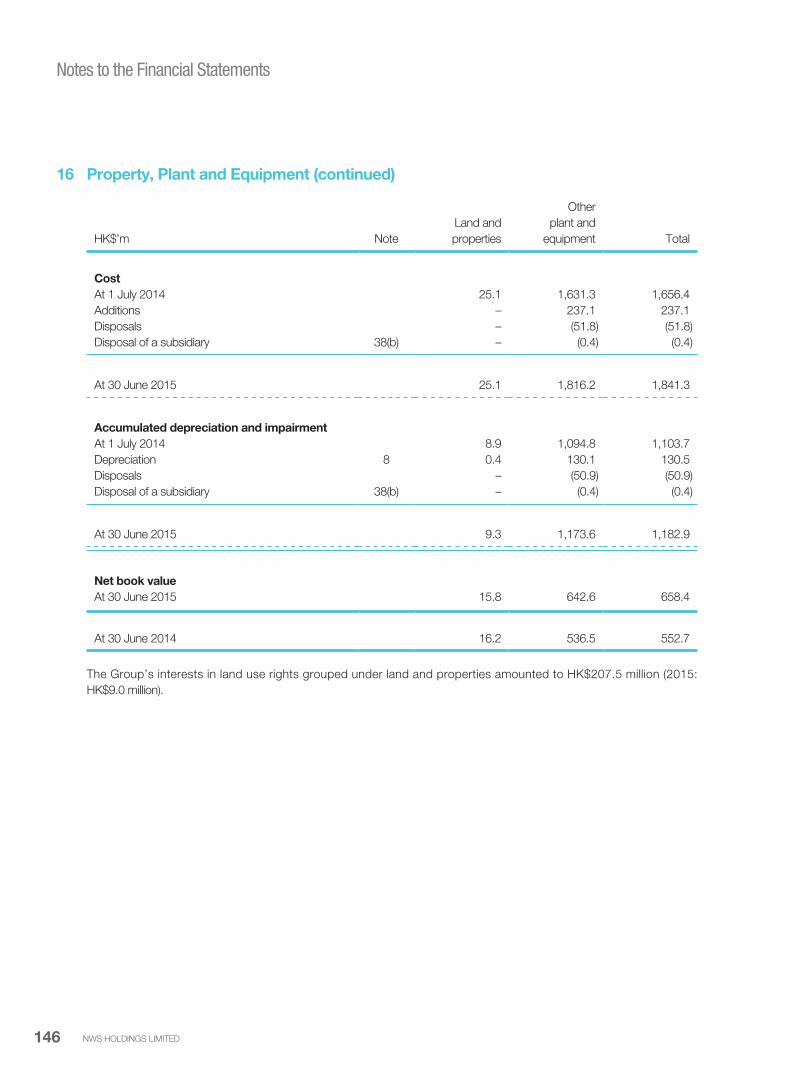
NWS HOLDINGS LIMITED146
Notes to the Financial Statements
16 Property, Plant and Equipment (continued)
HK$’m Note
Land and
properties
Other
plant and
equipment Total
Cost
At 1 July 2014 25.1 1,631.3 1,656.4
Additions – 237.1 237.1
Disposals – (51.8) (51.8)
Disposal of a subsidiary 38(b) – (0.4) (0.4)
At 30 June 2015 25.1 1,816.2 1,841.3
Accumulated depreciation and impairment
At 1 July 2014 8.9 1,094.8 1,103.7
Depreciation 8 0.4 130.1 130.5
Disposals – (50.9) (50.9)
Disposal of a subsidiary 38(b) – (0.4) (0.4)
At 30 June 2015 9.3 1,173.6 1,182.9
Net book value
At 30 June 2015 15.8 642.6 658.4
At 30 June 2014 16.2 536.5 552.7
The Group’s interests in land use rights grouped under land and properties amounted to HK$207.5 million (2015:
HK$9.0 million).
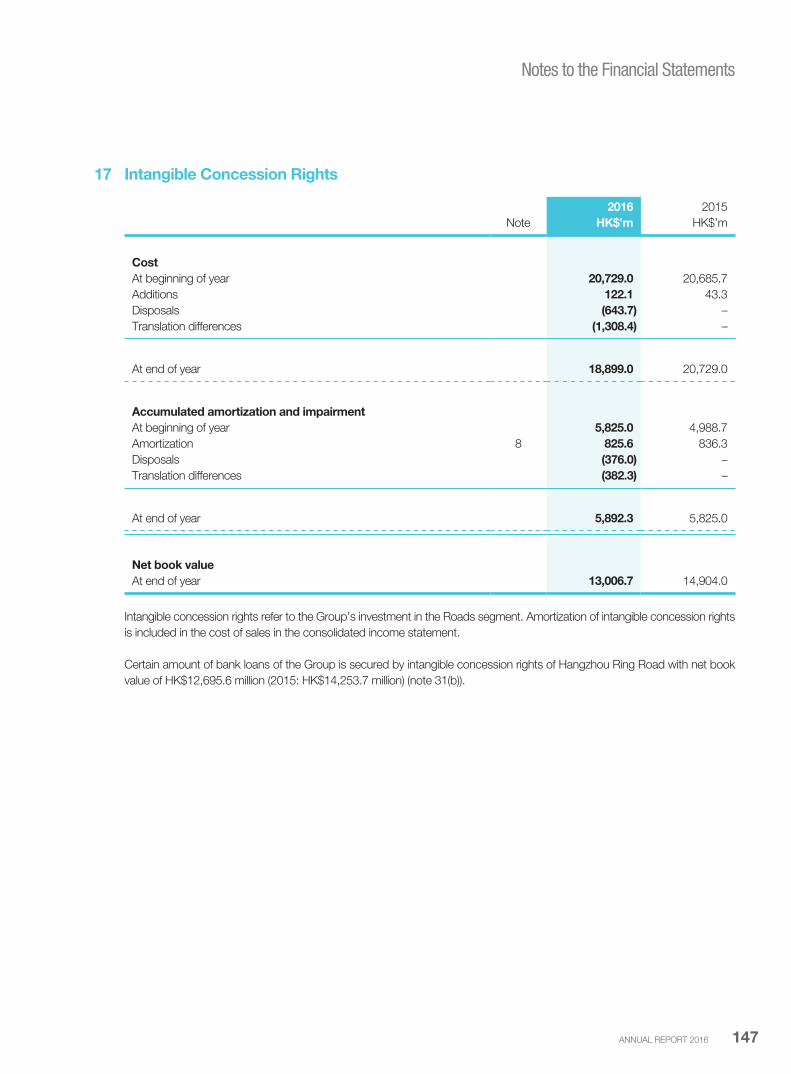
ANNUAL REPORT 2016 147
Notes to the Financial Statements
17 Intangible Concession Rights
2016 2015
Note HK$’m HK$’m
Cost
At beginning of year 20,729.0 20,685.7
Additions 122.1 43.3
Disposals (643.7) –
Translation differences (1,308.4) –
At end of year 18,899.0 20,729.0
Accumulated amortization and impairment
At beginning of year 5,825.0 4,988.7
Amortization 8 825.6 836.3
Disposals (376.0) –
Translation differences (382.3) –
At end of year 5,892.3 5,825.0
Net book value
At end of year 13,006.7 14,904.0
Intangible concession rights refer to the Group’s investment in the Roads segment. Amortization of intangible concession rights
is included in the cost of sales in the consolidated income statement.
Certain amount of bank loans of the Group is secured by intangible concession rights of Hangzhou Ring Road with net book
value of HK$12,695.6 million (2015: HK$14,253.7 million) (note 31(b)).

NWS HOLDINGS LIMITED148
Notes to the Financial Statements
18 Intangible Assets
HK$’m Note Goodwill
Operating
right Total
Cost
At 1 July 2015 67.2 567.2 634.4
Amount written off (5.8) – (5.8)
At 30 June 2016 61.4 567.2 628.6
Accumulated amortization and impairment
At 1 July 2015 15.4 195.1 210.5
Amortization 8 – 31.2 31.2
At 30 June 2016 15.4 226.3 241.7
Net book value
At 30 June 2016 46.0 340.9 386.9
At 30 June 2015 51.8 372.1 423.9
HK$’m Note Goodwill
Operating
right Total
Cost
At 1 July 2014 and at 30 June 2015 67.2 567.2 634.4
Accumulated amortization and impairment
At 1 July 2014 15.4 163.9 179.3
Amortization 8 – 31.2 31.2
At 30 June 2015 15.4 195.1 210.5
Net book value
At 30 June 2015 51.8 372.1 423.9
At 30 June 2014 51.8 403.3 455.1

ANNUAL REPORT 2016 149
Notes to the Financial Statements
18 Intangible Assets (continued)
(a) GoodwillA summary of the goodwill allocation to segments is presented below:
HK$’m Hong Kong Mainland China Total
2016
Roads – 11.9 11.9
Strategic Investments 34.1 – 34.1
34.1 11.9 46.0
HK$’m Hong Kong Mainland China Total
2015
Roads – 17.7 17.7
Strategic Investments 34.1 – 34.1
34.1 17.7 51.8
Impairment tests for goodwill
Goodwill is allocated to the Group’s CGU identified according to country of operation and business segment. For
the purpose of impairment test, the recoverable amount of the business unit is determined based on value in use
calculations. The key assumptions adopted on growth rates and discount rates used in the value in use calculations are
based on management’s best estimates and past experience.
(b) Operating rightOperating right was primarily resulted from the acquisition of right to operate facilities management business. Operating
right is tested for impairment when there is indication of impairment and amortized over the period of the operating right.
(c) AmortizationAmortization of intangible assets is included in the cost of sales in the consolidated income statement.

NWS HOLDINGS LIMITED150
Notes to the Financial Statements
19 Associated Companies
2016 2015
Note HK$’m HK$’m
Group’s share of net assets
Listed shares – Hong Kong (a) 4,905.7 4,985.2
Listed shares – Overseas (a) 827.2 1,081.0
Unlisted shares (b) 6,710.4 5,476.8
12,443.3 11,543.0
Goodwill 727.3 777.3
Amounts receivable (c) 1,777.1 1,160.1
14,947.7 13,480.4
(a) As at 30 June 2016, the carrying amount represents the Group’s investments in Beijing Capital International Airport
Co., Ltd., Wai Kee Holdings Limited, Newton Resources and Tharisa. The share of market value of the Group’s listed
associated companies amounts to HK$5,624.7 million (2015: HK$6,396.2 million). Management regularly reviews
whether there are any indications of impairment of the Group’s investments in associated companies based on value
in use calculations, as detailed in note 5(e). Management is of the view that there is no impairment of the Group’s
investments in associated companies as at 30 June 2016 except as detailed in note 5(e).
(b) As at 30 June 2016, the carrying amount mainly represents the Group’s investments in various infrastructure,
ports, commercial aircraft leasing, healthcare, strategic investments and other projects. Among which the Group
has participating interests and holds for investment purpose in certain investment companies amounted to
HK$2,106.5 million (2015: HK$1,152.9 million), which mainly represents various loans receivable. The Group’s share of
attributable operating profit of these investment companies for the year amounted to HK$143.2 million (2015: HK$133.6
million) as detailed in note 6(a)(ii).
(c) Amounts receivable are analyzed as follows:
2016 2015
Note HK$’m HK$’m
Interest bearing (i),(ii) 1,667.0 1,072.5
Non-interest bearing 110.1 87.6
1,777.1 1,160.1
(i) The balance includes an amount of HK$104.7 million (2015: HK$104.7 million) which carries interest at 8% per
annum and an aggregate amount of HK$1,562.3 million (2015: HK$883.9 million) which carries interest at 6-month
HIBOR plus a margin of 1.3% per annum.
(ii) Included an amount of HK$83.9 million which carried interests at LIBOR plus a margin of 2.2% to 2.75% per
annum as at 30 June 2015.
The amounts are not repayable within the next 12 months from the end of the reporting period. As at 30 June 2016, the
carrying amounts of the amounts receivable are not materially different from their fair values and are fully performing.

ANNUAL REPORT 2016 151
Notes to the Financial Statements
19 Associated Companies (continued)
(d) Dividend income from associated companies for the year is HK$619.4 million (2015: HK$286.3 million).
(e) Details of principal associated companies are given in note 44. The directors of the Company were of the view that as at
30 June 2016, there was no individual associated company that was material to the Group.
(f) Financial guarantee contracts relating to associated companies are disclosed in note 37.
(g) The Group’s share of revenue, results, assets and liabilities of associated companies are summarized below:
2016 2015
HK$’m HK$’m
Revenue 5,162.3 4,794.9
Profit/(loss) for the year 724.3 (946.4)
Other comprehensive loss for the year (665.2) (128.9)
Total comprehensive income/(loss) for the year 59.1 (1,075.3)
Non-current assets 20,613.8 16,485.8
Current assets 5,532.5 3,859.6
Current liabilities (6,461.0) (3,708.0)
Non-current liabilities (7,242.0) (5,094.4)
Net assets 12,443.3 11,543.0
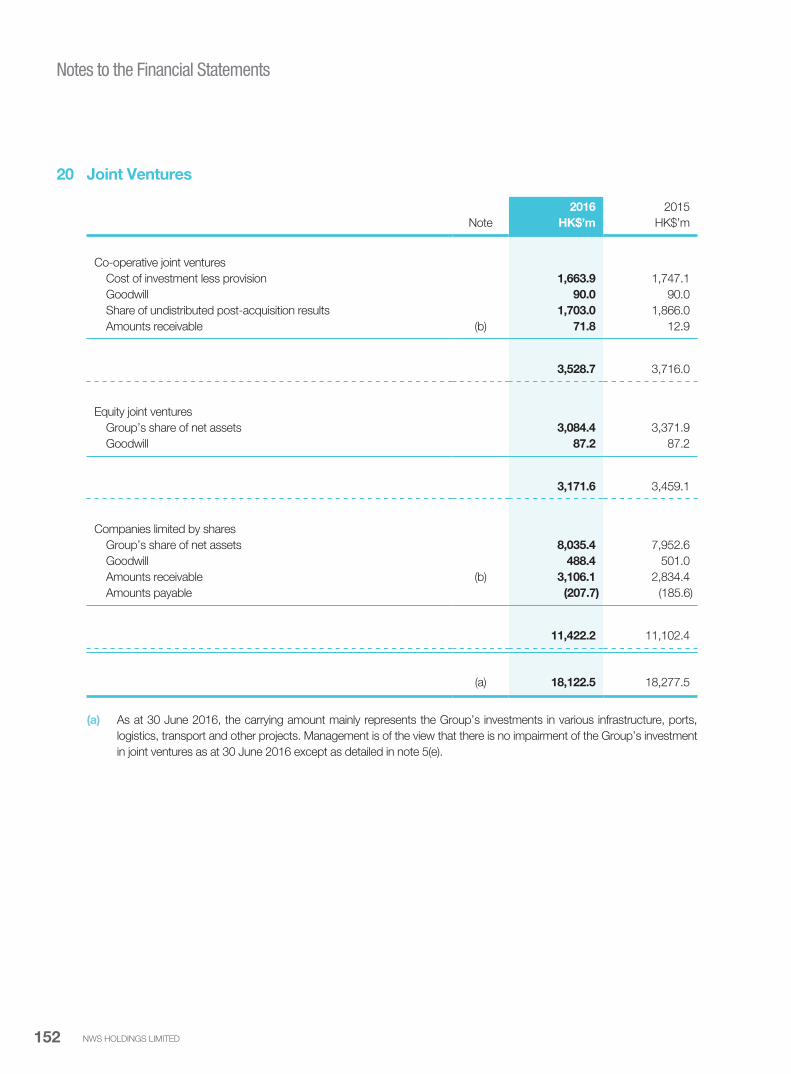
NWS HOLDINGS LIMITED152
Notes to the Financial Statements
20 Joint Ventures
2016 2015
Note HK$’m HK$’m
Co-operative joint ventures
Cost of investment less provision 1,663.9 1,747.1
Goodwill 90.0 90.0
Share of undistributed post-acquisition results 1,703.0 1,866.0
Amounts receivable (b) 71.8 12.9
3,528.7 3,716.0
Equity joint ventures
Group’s share of net assets 3,084.4 3,371.9
Goodwill 87.2 87.2
3,171.6 3,459.1
Companies limited by shares
Group’s share of net assets 8,035.4 7,952.6
Goodwill 488.4 501.0
Amounts receivable (b) 3,106.1 2,834.4
Amounts payable (207.7) (185.6)
11,422.2 11,102.4
(a) 18,122.5 18,277.5
(a) As at 30 June 2016, the carrying amount mainly represents the Group’s investments in various infrastructure, ports,
logistics, transport and other projects. Management is of the view that there is no impairment of the Group’s investment
in joint ventures as at 30 June 2016 except as detailed in note 5(e).

ANNUAL REPORT 2016 153
Notes to the Financial Statements
20 Joint Ventures (continued)(b) Amounts receivable are analyzed as follows:
2016 2015
Note HK$’m HK$’m
Interest bearing (i) 70.7 12.9
Non-interest bearing (ii) 3,107.2 2,834.4
3,177.9 2,847.3
(i) The balance includes an amount of HK$12.2 million (2015: HK$12.9 million) which carries interest at Hong Kong
prime rate and an amount of HK$58.5 million (2015: Nil) which carries interest at 12-month People’s Bank of China
Rate per annum.
(ii) The balance includes an amount of HK$197.5 million (2015: HK$197.5 million) which has been subordinated to
certain indebtedness of a joint venture.
As at 30 June 2016, the carrying amounts of the amounts receivable are not materially different from their fair values and
are fully performing.
(c) Dividend income from joint ventures for the year is HK$1,250.8 million (2015: HK$3,407.2 million).
(d) Details of principal joint ventures are given in note 45. The directors of the Company were of the view that as at 30 June 2016,
there was no individual joint venture that was material to the Group.
(e) Financial guarantee contracts relating to joint ventures are disclosed in note 37.
(f) The Group’s share of revenue, results, assets and liabilities of joint ventures are summarized below:
2016 2015
HK$’m HK$’m
Revenue 13,133.0 13,157.8
Profit for the year 1,541.7 2,662.7
Other comprehensive loss for the year (1,008.9) (211.2)
Total comprehensive income for the year 532.8 2,451.5
Non-current assets 23,253.6 24,131.1
Current assets 4,910.3 6,372.5
Current liabilities (6,627.0) (8,171.5)
Non-current liabilities (7,050.2) (7,394.5)
Net assets 14,486.7 14,937.6

NWS HOLDINGS LIMITED154
Notes to the Financial Statements
21 Available-for-sale Financial Assets
2016 2015
HK$’m HK$’m
Non-current assets
Equity securities listed in Hong Kong 1,208.2 2,245.0
Equity securities listed overseas – 77.5
Debt securities listed in Hong Kong 244.3 244.2
Unlisted equity securities 60.0 5.8
Unlisted debt securities – 30.0
1,512.5 2,602.5
Current asset
Unlisted debt securities 30.0 –
1,542.5 2,602.5
Market value of listed securities 1,452.5 2,566.7
The maximum exposure to credit risk at the end of reporting period is the carrying value of the debt securities.
The fair value of unlisted securities is based on cash flows discounted using a rate based on the market interest rates and the
risk premium specific to the unlisted securities.
The available-for-sale financial assets are denominated in the following currencies:
2016 2015
HK$’m HK$’m
Hong Kong dollar 1,238.2 2,275.0
United States dollar 298.5 321.7
Renminbi 5.8 5.8
1,542.5 2,602.5
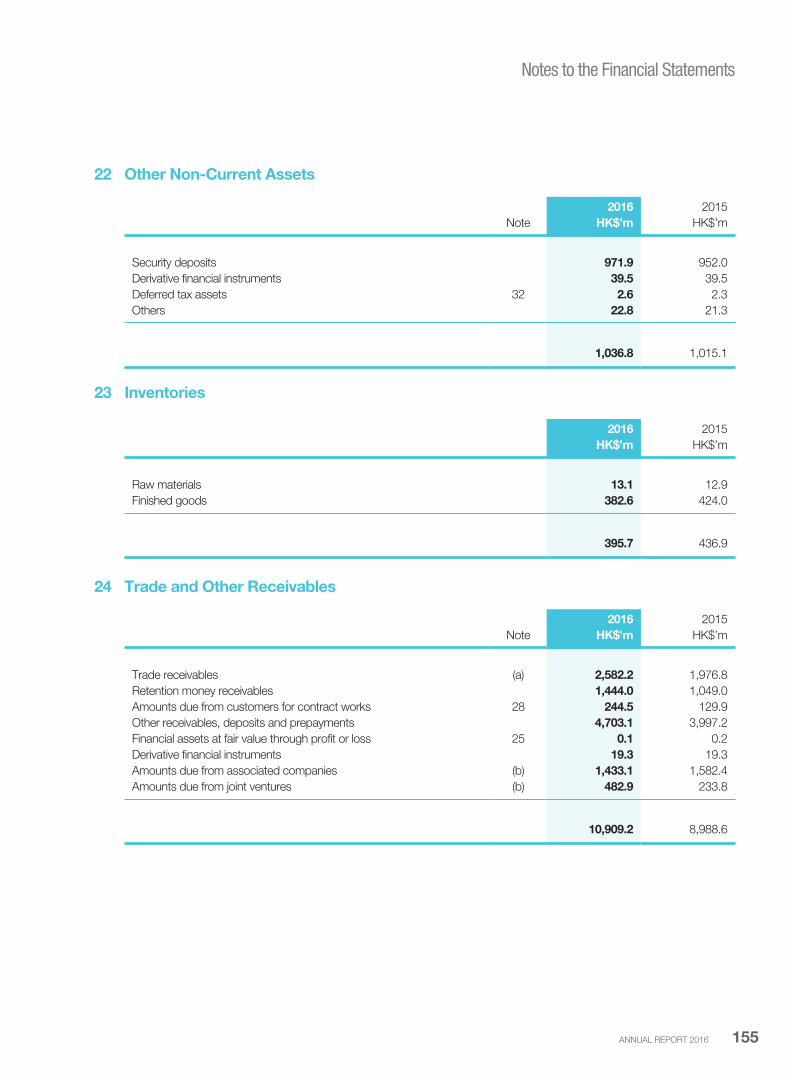
ANNUAL REPORT 2016 155
Notes to the Financial Statements
22 Other Non-Current Assets
2016 2015
Note HK$’m HK$’m
Security deposits 971.9 952.0
Derivative financial instruments 39.5 39.5
Deferred tax assets 32 2.6 2.3
Others 22.8 21.3
1,036.8 1,015.1
23 Inventories
2016 2015
HK$’m HK$’m
Raw materials 13.1 12.9
Finished goods 382.6 424.0
395.7 436.9
24 Trade and Other Receivables
2016 2015
Note HK$’m HK$’m
Trade receivables (a) 2,582.2 1,976.8
Retention money receivables 1,444.0 1,049.0
Amounts due from customers for contract works 28 244.5 129.9
Other receivables, deposits and prepayments 4,703.1 3,997.2
Financial assets at fair value through profit or loss 25 0.1 0.2
Derivative financial instruments 19.3 19.3
Amounts due from associated companies (b) 1,433.1 1,582.4
Amounts due from joint ventures (b) 482.9 233.8
10,909.2 8,988.6
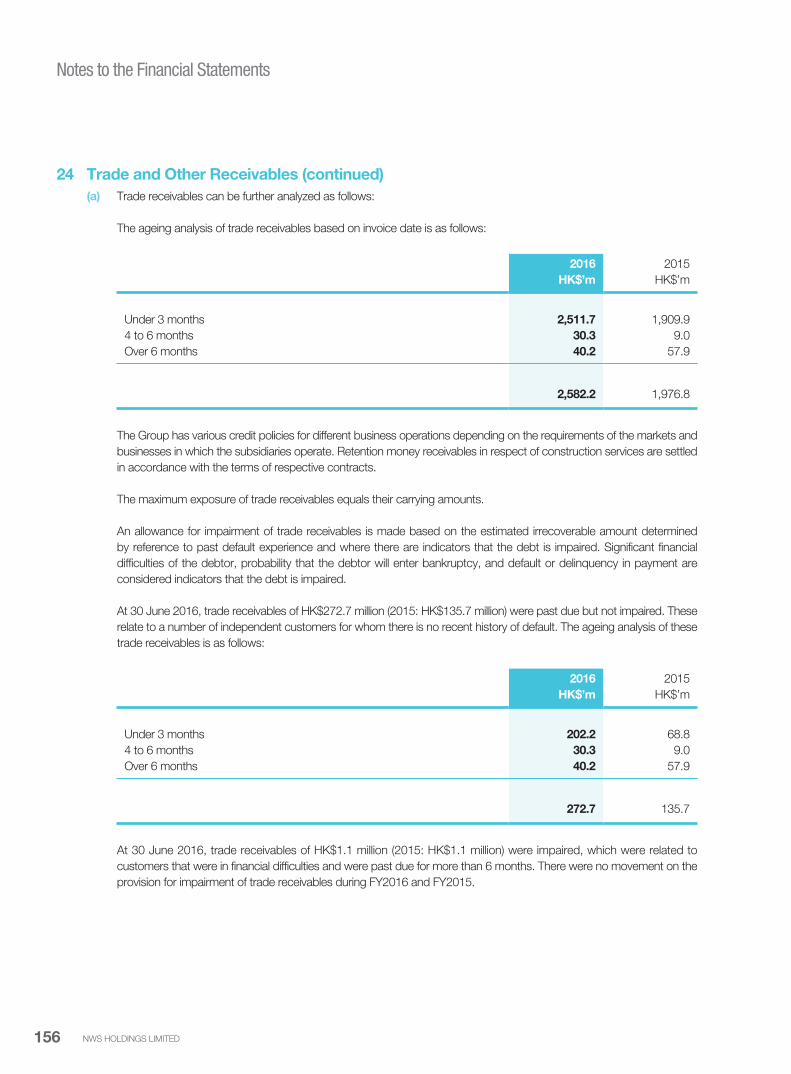
NWS HOLDINGS LIMITED156
Notes to the Financial Statements
24 Trade and Other Receivables (continued)
(a) Trade receivables can be further analyzed as follows:
The ageing analysis of trade receivables based on invoice date is as follows:
2016 2015
HK$’m HK$’m
Under 3 months 2,511.7 1,909.9
4 to 6 months 30.3 9.0
Over 6 months 40.2 57.9
2,582.2 1,976.8
The Group has various credit policies for different business operations depending on the requirements of the markets and
businesses in which the subsidiaries operate. Retention money receivables in respect of construction services are settled
in accordance with the terms of respective contracts.
The maximum exposure of trade receivables equals their carrying amounts.
An allowance for impairment of trade receivables is made based on the estimated irrecoverable amount determined
by reference to past default experience and where there are indicators that the debt is impaired. Significant financial
difficulties of the debtor, probability that the debtor will enter bankruptcy, and default or delinquency in payment are
considered indicators that the debt is impaired.
At 30 June 2016, trade receivables of HK$272.7 million (2015: HK$135.7 million) were past due but not impaired. These
relate to a number of independent customers for whom there is no recent history of default. The ageing analysis of these
trade receivables is as follows:
2016 2015
HK$’m HK$’m
Under 3 months 202.2 68.8
4 to 6 months 30.3 9.0
Over 6 months 40.2 57.9
272.7 135.7
At 30 June 2016, trade receivables of HK$1.1 million (2015: HK$1.1 million) were impaired, which were related to
customers that were in financial difficulties and were past due for more than 6 months. There were no movement on the
provision for impairment of trade receivables during FY2016 and FY2015.

ANNUAL REPORT 2016 157
Notes to the Financial Statements
24 Trade and Other Receivables (continued)
(b) As at 30 June 2016, the amounts due from associated companies and joint ventures of the Group are interest free,
unsecured and repayable on demand except for an amount of HK$279.7 million (2015: Nil) due from a joint venture
which carries interests at 12-month LIBOR plus a margin of 12.15% per annum. As at 30 June 2015, there was also an
aggregate amount of HK$1,038.0 million due from an associated company which borne interest at LIBOR plus a margin
of 2.2% to 2.75% per annum. The amounts receivable are fully performing.
(c) Included in the Group’s trade and other receivables are HK$283.0 million (2015: HK$354.7 million) denominated in
Renminbi, HK$101.0 million (2015: HK$33.6 million) denominated in Macau Pataca and HK$1,723.4 million (2015:
HK$1,664.2 million) denominated in United States dollar. The remaining balances are mainly denominated in Hong Kong
dollar.
25 Financial Assets at Fair Value Through Profit or Loss
2016 2015
Note HK$’m HK$’m
Unlisted equity securities 24 0.1 0.2
The financial assets at fair value through profit or loss are denominated in United States dollar.

NWS HOLDINGS LIMITED158
Notes to the Financial Statements
26 Cash and Bank Balances
2016 2015
HK$’m HK$’m
Time deposits – maturing within three months 5,734.2 8,285.8
Time deposits – maturing after more than three months 43.2 16.6
Other cash at bank and on hand 3,146.2 2,119.9
Cash and bank balances 8,923.6 10,422.3
The effective interest rate on time deposits is 1.9% (2015: 2.9%) per annum; these deposits have an average maturity of
32 days (2015: 43 days).
The balances include HK$2,450.9 million (2015: HK$2,490.5 million) which are kept in the bank accounts opened with banks
in Mainland China where the remittance of funds is subject to foreign exchange control.
The cash and bank balances are denominated in the following currencies:
2016 2015
HK$’m HK$’m
Hong Kong dollar 1,959.4 1,305.1
Renminbi 6,251.9 8,838.5
United States dollar 620.0 228.2
Macau Pataca 92.0 43.8
Others 0.3 6.7
8,923.6 10,422.3

ANNUAL REPORT 2016 159
Notes to the Financial Statements
27 Assets held-for-sale/Liabilities Directly Associated With Assets held-for-saleOn 20 June 2016, NWD (the Company’s ultimate holding company) and the Company jointly announced that an agreement
was entered into in respect of the disposal of Shine Fame Holdings Limited (“Shine Fame”, an investment holding company
which holds the entire interest in NWS Kwai Chung Logistics Centre, an investment property of the Group) and the assignment
of debt at an aggregate cash consideration of HK$3.75 billion (the “Disposal Transaction”). Completion of the Disposal
Transaction took place on 31 August 2016. Assets and liabilities of Shine Fame were reclassified as held-for-sale as at
30 June 2016.
2016
Note HK$’m
Assets
Investment property 15 3,750.0
Other current assets 2.4
Trade and other receivables 1.2
Cash and bank balances 12.5
Assets of a subsidiary reclassified as held-for-sale 3,766.1
Liabilities
Trade and other payables (26.5)
Deferred tax liabilities 32 (56.8)
Liabilities of a subsidiary reclassified as held-for-sale (83.3)
As at 30 June 2016, management of the Group determined the fair value of NWS Kwai Chung Logistics Centre approximated
the consideration of the Disposal Transaction. With reference to the consideration of the Disposal Transaction, the fair value is
adjusted, if necessary, after considering (i) difference between the value of the investment property and the value of Shine Fame
as a whole, and (ii) time factor between the date of entering into the Disposal Transaction and 30 June 2016.
The fair value of NWS Kwai Chung Logistics Centre is categorized as Level 2 (2015: Level 3) in the fair value hierarchy. The
transfer from Level 3 to Level 2 fair value hierarchy is due to the determination of the fair value of the investment property as
at 30 June 2016 having made reference to the consideration of the Disposal Transaction which is an input observable for the
investment property indirectly.
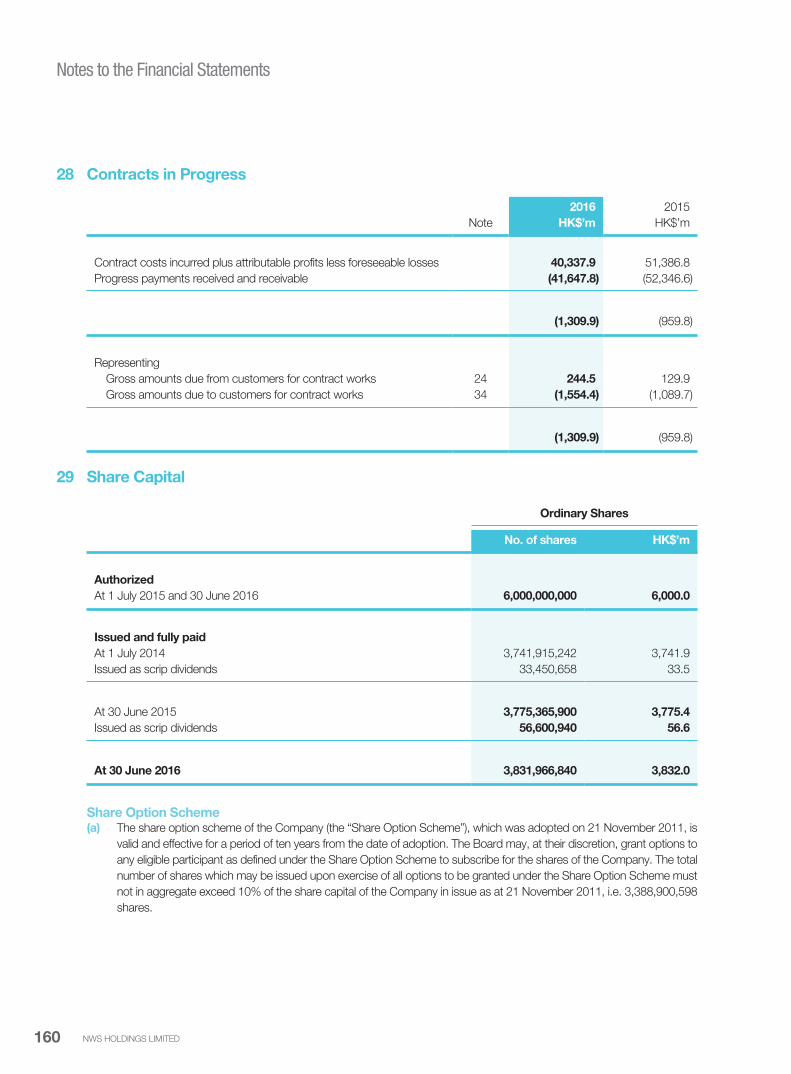
NWS HOLDINGS LIMITED160
Notes to the Financial Statements
28 Contracts in Progress
2016 2015
Note HK$’m HK$’m
Contract costs incurred plus attributable profits less foreseeable losses 40,337.9 51,386.8
Progress payments received and receivable (41,647.8) (52,346.6)
(1,309.9) (959.8)
Representing
Gross amounts due from customers for contract works 24 244.5 129.9
Gross amounts due to customers for contract works 34 (1,554.4) (1,089.7)
(1,309.9) (959.8)
29 Share Capital
Ordinary Shares
No. of shares HK$’m
Authorized
At 1 July 2015 and 30 June 2016 6,000,000,000 6,000.0
Issued and fully paid
At 1 July 2014 3,741,915,242 3,741.9
Issued as scrip dividends 33,450,658 33.5
At 30 June 2015 3,775,365,900 3,775.4
Issued as scrip dividends 56,600,940 56.6
At 30 June 2016 3,831,966,840 3,832.0
Share Option Scheme(a) The share option scheme of the Company (the “Share Option Scheme”), which was adopted on 21 November 2011, is
valid and effective for a period of ten years from the date of adoption. The Board may, at their discretion, grant options to
any eligible participant as defined under the Share Option Scheme to subscribe for the shares of the Company. The total
number of shares which may be issued upon exercise of all options to be granted under the Share Option Scheme must
not in aggregate exceed 10% of the share capital of the Company in issue as at 21 November 2011, i.e. 3,388,900,598
shares.
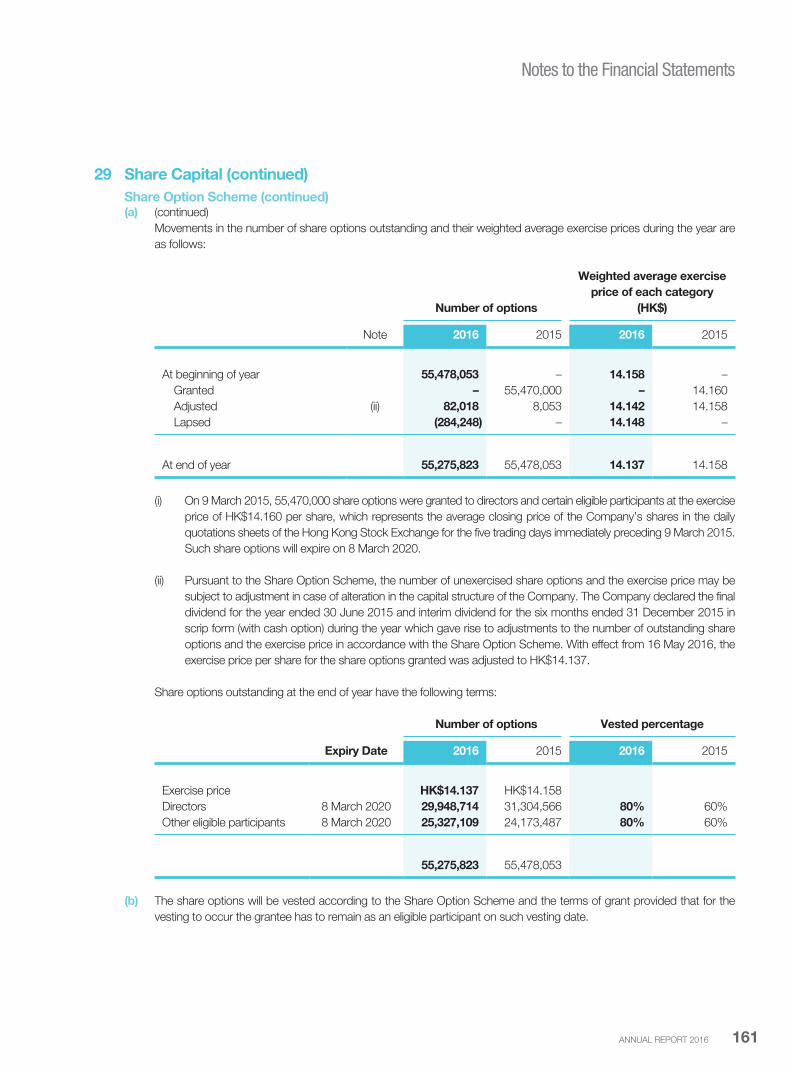
ANNUAL REPORT 2016 161
Notes to the Financial Statements
29 Share Capital (continued)
Share Option Scheme (continued)(a) (continued)
Movements in the number of share options outstanding and their weighted average exercise prices during the year are
as follows:
Number of options
Weighted average exercise
price of each category
(HK$)
Note 2016 2015 2016 2015
At beginning of year 55,478,053 – 14.158 –
Granted – 55,470,000 – 14.160
Adjusted (ii) 82,018 8,053 14.142 14.158
Lapsed (284,248) – 14.148 –
At end of year 55,275,823 55,478,053 14.137 14.158
(i) On 9 March 2015, 55,470,000 share options were granted to directors and certain eligible participants at the exercise
price of HK$14.160 per share, which represents the average closing price of the Company’s shares in the daily
quotations sheets of the Hong Kong Stock Exchange for the five trading days immediately preceding 9 March 2015.
Such share options will expire on 8 March 2020.
(ii) Pursuant to the Share Option Scheme, the number of unexercised share options and the exercise price may be
subject to adjustment in case of alteration in the capital structure of the Company. The Company declared the final
dividend for the year ended 30 June 2015 and interim dividend for the six months ended 31 December 2015 in
scrip form (with cash option) during the year which gave rise to adjustments to the number of outstanding share
options and the exercise price in accordance with the Share Option Scheme. With effect from 16 May 2016, the
exercise price per share for the share options granted was adjusted to HK$14.137.
Share options outstanding at the end of year have the following terms:
Number of options Vested percentage
Expiry Date 2016 2015 2016 2015
Exercise price HK$14.137 HK$14.158
Directors 8 March 2020 29,948,714 31,304,566 80% 60%
Other eligible participants 8 March 2020 25,327,109 24,173,487 80% 60%
55,275,823 55,478,053
(b) The share options will be vested according to the Share Option Scheme and the terms of grant provided that for the
vesting to occur the grantee has to remain as an eligible participant on such vesting date.

NWS HOLDINGS LIMITED162
Notes to the Financial Statements
30 Reserves
Investment
Share Special revaluation Exchange Revenue
HK$’m Note premium reserves reserve reserve reserve Total
At 1 July 2015 16,288.7 634.2 296.3 2,921.5 21,497.3 41,638.0
Profit for the year – – – – 4,912.8 4,912.8
Dividends paid to shareholders of
the Company – – – – (2,425.5) (2,425.5)
Fair value changes of available-
for-sale financial assets
Group – – (300.1) – – (300.1)
Joint ventures – – (17.1) – – (17.1)
Release of investment revaluation
deficit to the consolidated
income statement
upon impairment of
an available-for-sale financial
asset – – 670.4 – – 670.4
Release of reserve upon disposal
of available-for-sale
financial assets – – (623.0) – – (623.0)
Currency translation differences
Group – – – (872.5) – (872.5)
Associated companies – – – (545.4) – (545.4)
Joint ventures – – – (990.2) – (990.2)
Scrip dividends
Share premium on new
shares issued 551.7 – – – – 551.7
Share options
Value of services provided
Group 9 – 27.8 – – – 27.8
Associated company – 0.2 – – – 0.2
Joint ventures – 2.0 – – – 2.0
Further acquisition of interest in
a subsidiary – – – 33.1 (128.9) (95.8)
Share of other comprehensive loss
of associated companies and
joint ventures – (106.8) – – (14.5) (121.3)
Cash flow hedges – (12.1) – – – (12.1)
Remeasurement of post-
employment benefit obligation – – – – (13.0) (13.0)
Transfer – 3.5 – – (3.5) –
At 30 June 2016 16,840.4 548.8 26.5 546.5 23,824.7 41,786.9
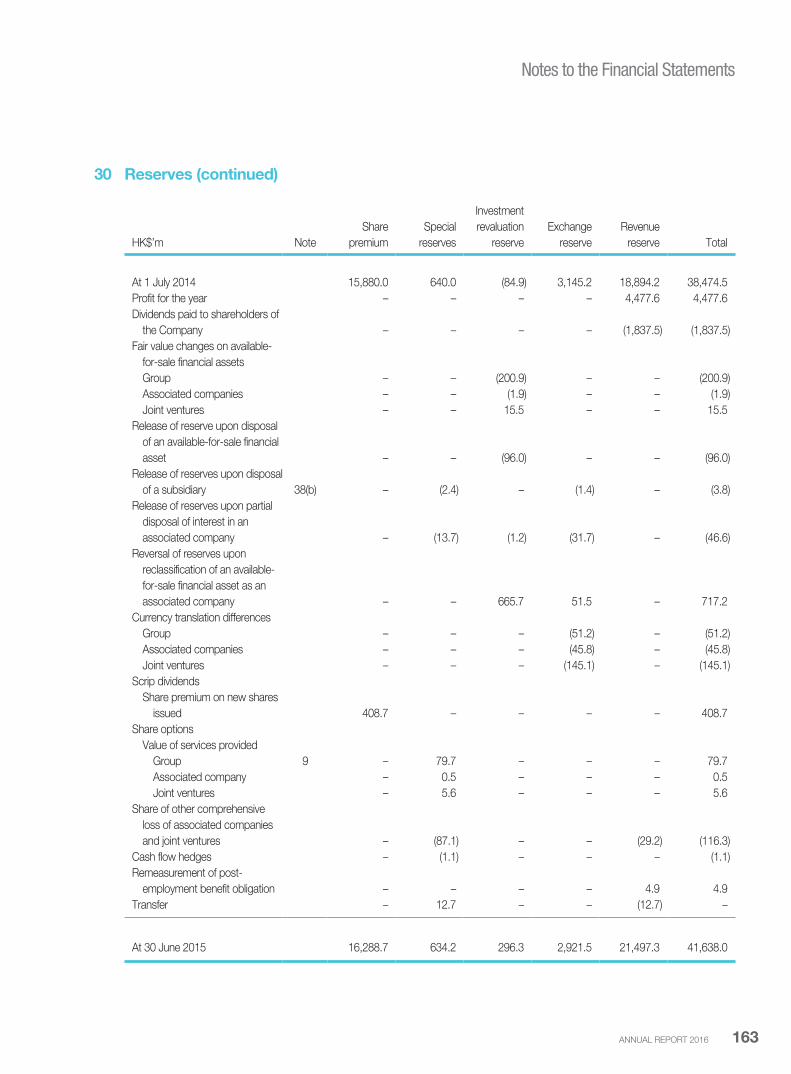
ANNUAL REPORT 2016 163
Notes to the Financial Statements
30 Reserves (continued)
Investment
Share Special revaluation Exchange Revenue
HK$’m Note premium reserves reserve reserve reserve Total
At 1 July 2014 15,880.0 640.0 (84.9) 3,145.2 18,894.2 38,474.5
Profit for the year – – – – 4,477.6 4,477.6
Dividends paid to shareholders of
the Company – – – – (1,837.5) (1,837.5)
Fair value changes on available-
for-sale financial assets
Group – – (200.9) – – (200.9)
Associated companies – – (1.9) – – (1.9)
Joint ventures – – 15.5 – – 15.5
Release of reserve upon disposal
of an available-for-sale financial
asset – – (96.0) – – (96.0)
Release of reserves upon disposal
of a subsidiary 38(b) – (2.4) – (1.4) – (3.8)
Release of reserves upon partial
disposal of interest in an
associated company – (13.7) (1.2) (31.7) – (46.6)
Reversal of reserves upon
reclassification of an available-
for-sale financial asset as an
associated company – – 665.7 51.5 – 717.2
Currency translation differences
Group – – – (51.2) – (51.2)
Associated companies – – – (45.8) – (45.8)
Joint ventures – – – (145.1) – (145.1)
Scrip dividends
Share premium on new shares
issued 408.7 – – – – 408.7
Share options
Value of services provided
Group 9 – 79.7 – – – 79.7
Associated company – 0.5 – – – 0.5
Joint ventures – 5.6 – – – 5.6
Share of other comprehensive
loss of associated companies
and joint ventures – (87.1) – – (29.2) (116.3)
Cash flow hedges – (1.1) – – – (1.1)
Remeasurement of post-
employment benefit obligation – – – – 4.9 4.9
Transfer – 12.7 – – (12.7) –
At 30 June 2015 16,288.7 634.2 296.3 2,921.5 21,497.3 41,638.0

NWS HOLDINGS LIMITED164
Notes to the Financial Statements
30 Reserves (continued)Special reserves include statutory reserves which are created in accordance with the relevant PRC laws and/or terms of the
joint venture agreements of subsidiaries and joint ventures established in Mainland China and are required to be retained in
the financial statements of these subsidiaries and joint ventures for specific purposes. Special reserves also include capital
redemption reserve, share option reserve, property revaluation reserve and cash flow hedges reserve arising from interest rate
swap.
31 Borrowings
2016 2015
Note HK$’m HK$’m
Non-current
Long-term bank loans
Secured (a),(b),(c) 181.3 606.2
Unsecured (a),(c) 9,070.4 9,012.2
Fixed rate bonds
Unsecured (d) – 3,868.4
Other borrowings
Unsecured – 0.2
9,251.7 13,487.0
Current
Current portion of long-term bank loans
Secured (a),(b),(c) 386.0 412.5
Unsecured (a),(c) 1,548.2 2,402.6
Fixed rate bonds
Unsecured (d) 3,878.7 –
Short-term bank loans and overdrafts
Unsecured (c) – 509.1
Other borrowings
Unsecured 0.2 0.2
5,813.1 3,324.4
15,064.8 16,811.4

ANNUAL REPORT 2016 165
Notes to the Financial Statements
31 Borrowings (continued)
(a) Long-term bank loans
2016 2015
HK$’m HK$’m
Bank loans, secured 567.3 1,018.7
Bank loans, unsecured 10,618.6 11,414.8
Total long-term bank loans 11,185.9 12,433.5
Amounts repayable within one year included in current liabilities (1,934.2) (2,815.1)
9,251.7 9,618.4
2016 2015
HK$’m HK$’m
The maturity of long-term bank loans is as follows:
Within one year 1,934.2 2,815.1
In the second year 593.1 1,919.9
In the third to fifth year 8,658.6 7,698.5
11,185.9 12,433.5
As at 30 June 2016, the Group’s long-term bank loans of HK$11.186 billion (2015: HK$12.433 billion) are exposed
to interest rate risk of contractual repricing dates falling within one year except for an amount of HK$0.4 billion (2015:
HK$0.4 billion) which is fixed rate interest-bearing.
(b) Bank loans are secured by the intangible concession rights of Hangzhou Ring Road (note 17).
(c) The effective interest rates of bank loans at the end of the reporting period were as follows:
2016 2015
Hong Kong dollar 1.63% 1.71%
Renminbi 4.41% 5.54%
(d) Fixed rate bondsFixed rate bonds represent US$500.0 million bonds bearing interest with a coupon rate of 6.5% per annum. These
bonds are guaranteed unconditionally and irrevocably by the Company and listed on the Singapore Exchange Securities
Trading Limited.
US$500.0 million bonds are redeemable by the issuer at any time at the option of the issuer, subject to terms governing
the bonds. Unless previously redeemed, or purchased and cancelled, US$500.0 million bonds will be redeemed at the
principal on the maturity date on 9 February 2017.
As at 30 June 2016, the fair value of US$500.0 million bonds amounted to US$500.0 million (equivalent to approximately
HK$3,884.6 million) which is based on the quoted market prices.

NWS HOLDINGS LIMITED166
Notes to the Financial Statements
31 Borrowings (continued)(e) Other than fixed rate bonds as detailed in note (d) above, the carrying amounts of the borrowings approximate their fair
values.
(f) The carrying amounts of the borrowings are denominated in the following currencies:
2016 2015
HK$’m HK$’m
Hong Kong dollar 10,618.8 11,924.3
United States dollar 3,878.7 3,868.4
Renminbi 567.3 1,018.7
15,064.8 16,811.4
32 Deferred Income Tax
2016 2015
Note HK$’m HK$’m
At beginning of year 2,376.0 2,510.1
Translation differences (132.7) –
Written back upon disposal of intangible concession rights (33.8) –
Disposal of a subsidiary 38(b) – (1.3)
Reclassified as liabilities directly associated with assets held-for-sale 27 (56.8) –
Net amount credited to the consolidated income statement 11 (46.0) (132.8)
At end of year 2,106.7 2,376.0
Deferred taxation is calculated in full on temporary differences under the liability method using a principal taxation rate of 16.5%
(2015: 16.5%).
Deferred income tax assets are recognized for tax losses carried forward to the extent that realization of the related tax
benefits through the future taxable profits are probable. The Group has unrecognized tax losses of HK$941.1 million (2015:
HK$1,118.8 million) to be carried forward against future taxable income. These tax losses have no expiry dates.
As at 30 June 2016, the aggregate amount of unrecognized deferred tax liabilities associated with investments in subsidiaries
totalled approximately HK$225.9 million (2015: HK$231.6 million). For this unrecognized amount, the Group is able to control
the timing of the reversal of the temporary differences and it is probable that the temporary difference will not reverse in the
foreseeable future.
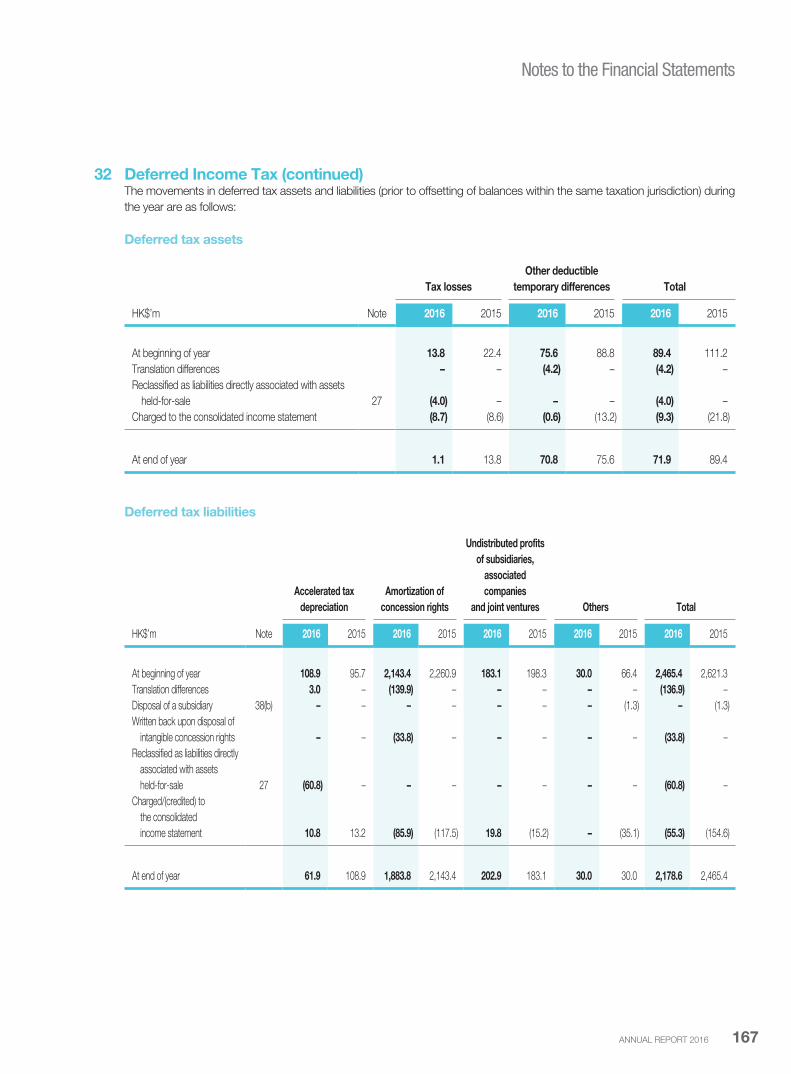
ANNUAL REPORT 2016 167
Notes to the Financial Statements
32 Deferred Income Tax (continued)The movements in deferred tax assets and liabilities (prior to offsetting of balances within the same taxation jurisdiction) during
the year are as follows:
Deferred tax assets
Other deductible
Tax losses temporary differences Total
HK$’m Note 2016 2015 2016 2015 2016 2015
At beginning of year 13.8 22.4 75.6 88.8 89.4 111.2
Translation differences – – (4.2) – (4.2) –
Reclassified as liabilities directly associated with assets
held-for-sale 27 (4.0) – – – (4.0) –
Charged to the consolidated income statement (8.7) (8.6) (0.6) (13.2) (9.3) (21.8)
At end of year 1.1 13.8 70.8 75.6 71.9 89.4
Deferred tax liabilities
Accelerated tax
depreciation
Amortization of
concession rights
Undistributed profits
of subsidiaries,
associated
companies
and joint ventures Others Total
HK$’m Note 2016 2015 2016 2015 2016 2015 2016 2015 2016 2015
At beginning of year 108.9 95.7 2,143.4 2,260.9 183.1 198.3 30.0 66.4 2,465.4 2,621.3
Translation differences 3.0 – (139.9) – – – – – (136.9) –
Disposal of a subsidiary 38(b) – – – – – – – (1.3) – (1.3)
Written back upon disposal of
intangible concession rights – – (33.8) – – – – – (33.8) –
Reclassified as liabilities directly
associated with assets
held-for-sale 27 (60.8) – – – – – – – (60.8) –
Charged/(credited) to
the consolidated
income statement 10.8 13.2 (85.9) (117.5) 19.8 (15.2) – (35.1) (55.3) (154.6) 61.9
At end of year 61.9 108.9 1,883.8 2,143.4 202.9 183.1 30.0 30.0 2,178.6 2,465.4
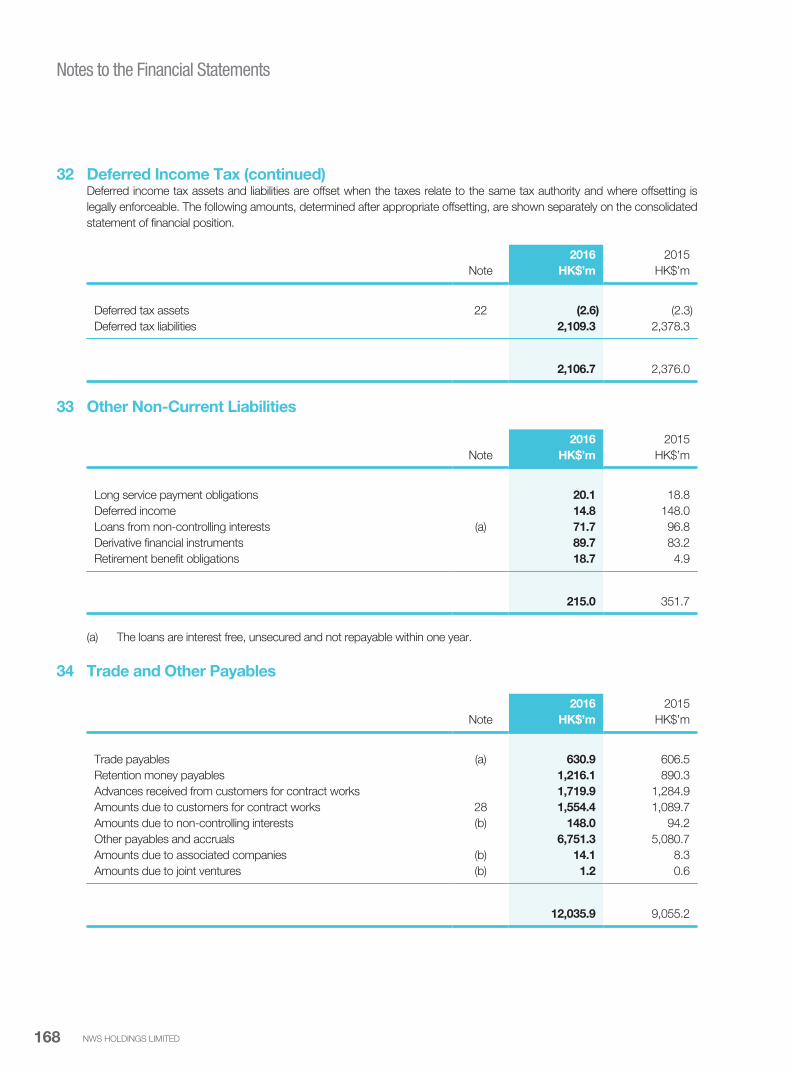
NWS HOLDINGS LIMITED168
Notes to the Financial Statements
32 Deferred Income Tax (continued)Deferred income tax assets and liabilities are offset when the taxes relate to the same tax authority and where offsetting is
legally enforceable. The following amounts, determined after appropriate offsetting, are shown separately on the consolidated
statement of financial position.
2016 2015
Note HK$’m HK$’m
Deferred tax assets 22 (2.6) (2.3)
Deferred tax liabilities 2,109.3 2,378.3
2,106.7 2,376.0
33 Other Non-Current Liabilities
2016 2015
Note HK$’m HK$’m
Long service payment obligations 20.1 18.8
Deferred income 14.8 148.0
Loans from non-controlling interests (a) 71.7 96.8
Derivative financial instruments 89.7 83.2
Retirement benefit obligations 18.7 4.9
215.0 351.7
(a) The loans are interest free, unsecured and not repayable within one year.
34 Trade and Other Payables
2016 2015
Note HK$’m HK$’m
Trade payables (a) 630.9 606.5
Retention money payables 1,216.1 890.3
Advances received from customers for contract works 1,719.9 1,284.9
Amounts due to customers for contract works 28 1,554.4 1,089.7
Amounts due to non-controlling interests (b) 148.0 94.2
Other payables and accruals 6,751.3 5,080.7
Amounts due to associated companies (b) 14.1 8.3
Amounts due to joint ventures (b) 1.2 0.6
12,035.9 9,055.2

ANNUAL REPORT 2016 169
Notes to the Financial Statements
34 Trade and Other Payables (continued)(a) The ageing analysis of trade payables based on invoice date is as follows:
2016 2015
HK$’m HK$’m
Under 3 months 611.2 587.7
4 to 6 months 7.4 5.4
Over 6 months 12.3 13.4
630.9 606.5
(b) The amounts payable are interest free, unsecured and have no fixed repayment terms.
(c) Included in the Group’s trade and other payables are HK$513.5 million (2015: HK$395.4 million) denominated in
Renminbi, HK$273.7 million (2015: HK$231.6 million) denominated in Macau Pataca and HK$185.3 million (2015:
HK$208.1 million) denominated in United States dollar. The remaining balances are mainly denominated in Hong Kong
dollar.
35 Financial Instruments by CategoryFinancial assets in the consolidated statement of financial position include available-for-sale financial assets, financial assets at
fair value through profit or loss, derivative financial instruments, trade receivables, loan and other receivables and cash and bank
balances. All these financial assets are carried at amortized cost using the effective interest method as “loans and receivables”
except for the “available-for-sale financial assets”, “financial assets at fair value through profit or loss” and “derivative financial
instruments” which are carried at fair value.
Financial liabilities in the consolidated statement of financial position include borrowings, trade payables, derivative financial
instruments, loan and other payables. All these financial liabilities are carried at amortized cost using the effective interest
method except for the “derivative financial instruments” which are carried at fair value.
36 Commitments(a) The outstanding commitments for capital expenditure are as follows:
2016 2015
Note HK$’m HK$’m
Contracted but not provided for
Intangible concession rights – 93.0
Property, plant and equipment 23.4 9.3
Capital contributions to/acquisitions
of an associated company and joint ventures (i) 2,339.7 2,072.7
Other investment 701.7 –
3,064.8 2,175.0

NWS HOLDINGS LIMITED170
Notes to the Financial Statements
36 Commitments (continued)(a) The outstanding commitments for capital expenditure are as follows (continued):
(i) The Group has committed to provide sufficient funds in the form of advances, capital and loan contributions to an
associated company and certain joint ventures to finance relevant projects. The directors estimate that the Group’s
share of projected funds requirements of these projects would be approximately HK$2,339.7 million (2015:
HK$2,072.7 million) which represents the attributable portion of the capital and loan contributions to be made to
an associated company and joint ventures.
(b) The Group’s share of commitments for capital expenditure committed by the joint ventures not included above are as
follows:
2016 2015
HK$’m HK$’m
Contracted but not provided for
Property, plant and equipment 574.3 971.2
Capital contributions to/acquisitions of joint ventures 76.4 177.6
650.7 1,148.8
(c) Commitments under operating leasesThe future aggregate lease payments under non-cancellable operating leases are as follows:
2016 2015
HK$’m HK$’m
Buildings
In the first year 78.0 73.5
In the second to fifth year inclusive 88.1 88.3
After the fifth year 4.4 5.3
170.5 167.1
The lease terms range from 1 to 19 years.
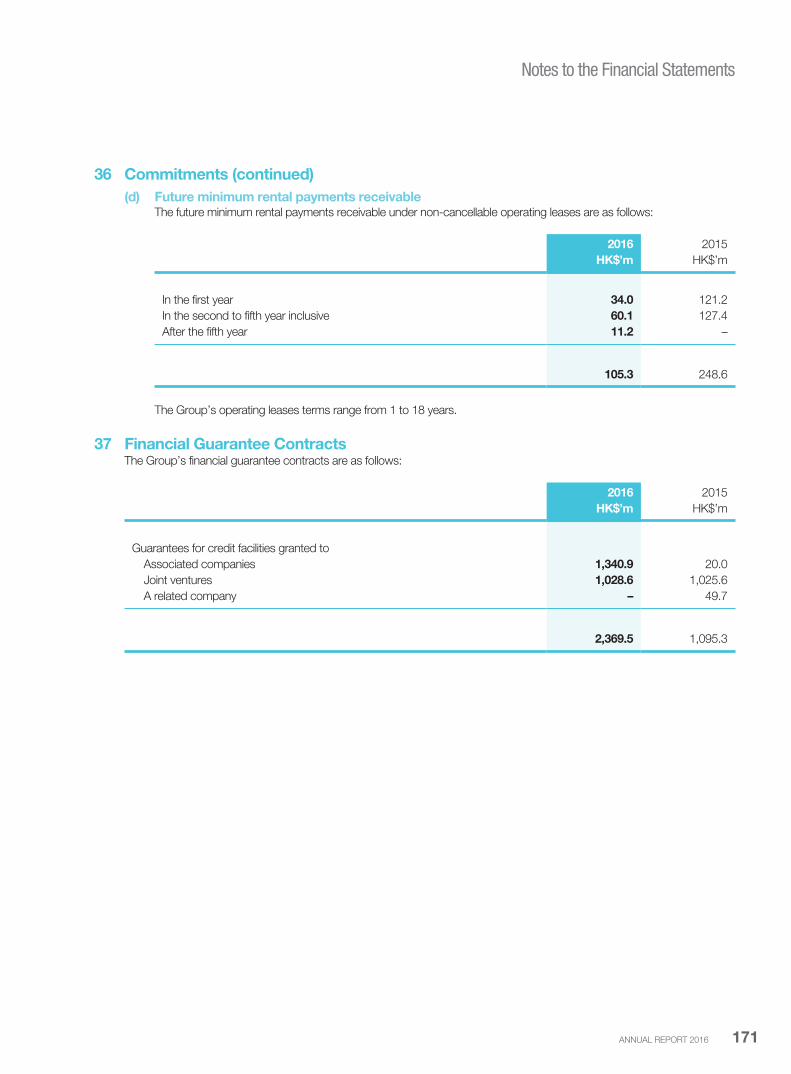
ANNUAL REPORT 2016 171
Notes to the Financial Statements
36 Commitments (continued)
(d) Future minimum rental payments receivableThe future minimum rental payments receivable under non-cancellable operating leases are as follows:
2016 2015
HK$’m HK$’m
In the first year 34.0 121.2
In the second to fifth year inclusive 60.1 127.4
After the fifth year 11.2 –
105.3 248.6
The Group’s operating leases terms range from 1 to 18 years.
37 Financial Guarantee ContractsThe Group’s financial guarantee contracts are as follows:
2016 2015
HK$’m HK$’m
Guarantees for credit facilities granted to
Associated companies 1,340.9 20.0
Joint ventures 1,028.6 1,025.6
A related company – 49.7
2,369.5 1,095.3
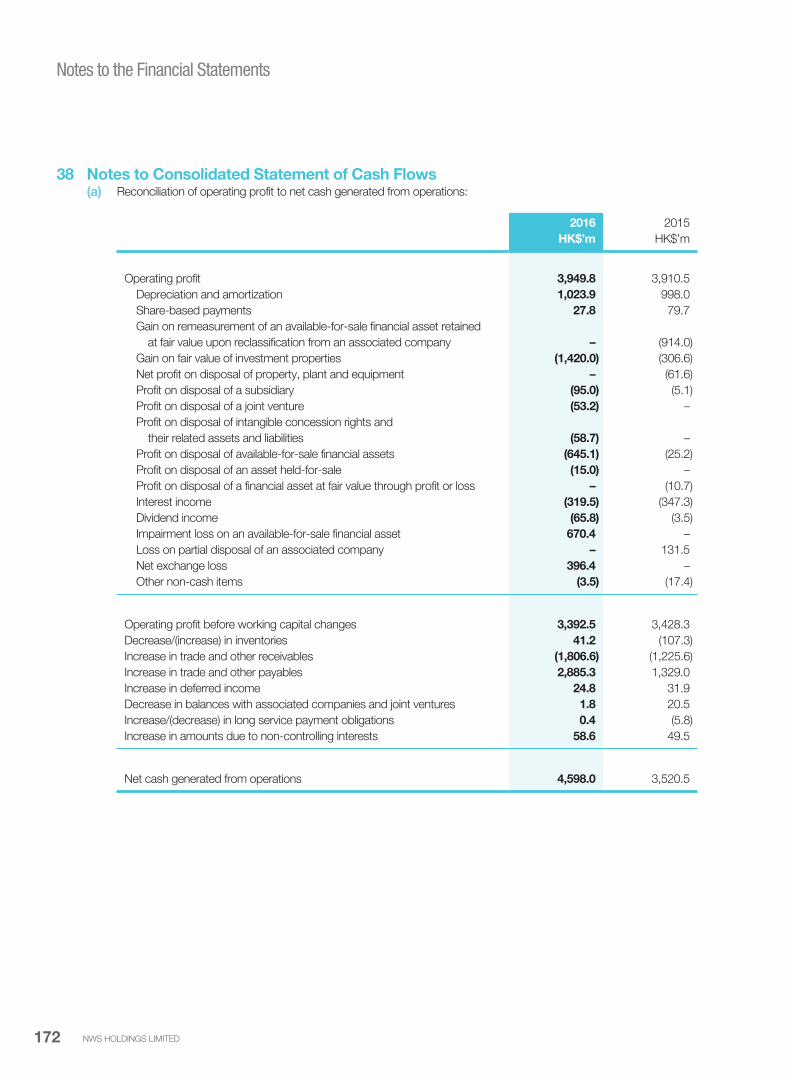
NWS HOLDINGS LIMITED172
Notes to the Financial Statements
38 Notes to Consolidated Statement of Cash Flows(a) Reconciliation of operating profit to net cash generated from operations:
2016 2015
HK$’m HK$’m
Operating profit 3,949.8 3,910.5
Depreciation and amortization 1,023.9 998.0
Share-based payments 27.8 79.7
Gain on remeasurement of an available-for-sale financial asset retained
at fair value upon reclassification from an associated company – (914.0)
Gain on fair value of investment properties (1,420.0) (306.6)
Net profit on disposal of property, plant and equipment – (61.6)
Profit on disposal of a subsidiary (95.0) (5.1)
Profit on disposal of a joint venture (53.2) –
Profit on disposal of intangible concession rights and
their related assets and liabilities (58.7) –
Profit on disposal of available-for-sale financial assets (645.1) (25.2)
Profit on disposal of an asset held-for-sale (15.0) –
Profit on disposal of a financial asset at fair value through profit or loss – (10.7)
Interest income (319.5) (347.3)
Dividend income (65.8) (3.5)
Impairment loss on an available-for-sale financial asset 670.4 –
Loss on partial disposal of an associated company – 131.5
Net exchange loss 396.4 –
Other non-cash items (3.5) (17.4)
Operating profit before working capital changes 3,392.5 3,428.3
Decrease/(increase) in inventories 41.2 (107.3)
Increase in trade and other receivables (1,806.6) (1,225.6)
Increase in trade and other payables 2,885.3 1,329.0
Increase in deferred income 24.8 31.9
Decrease in balances with associated companies and joint ventures 1.8 20.5
Increase/(decrease) in long service payment obligations 0.4 (5.8)
Increase in amounts due to non-controlling interests 58.6 49.5
Net cash generated from operations 4,598.0 3,520.5
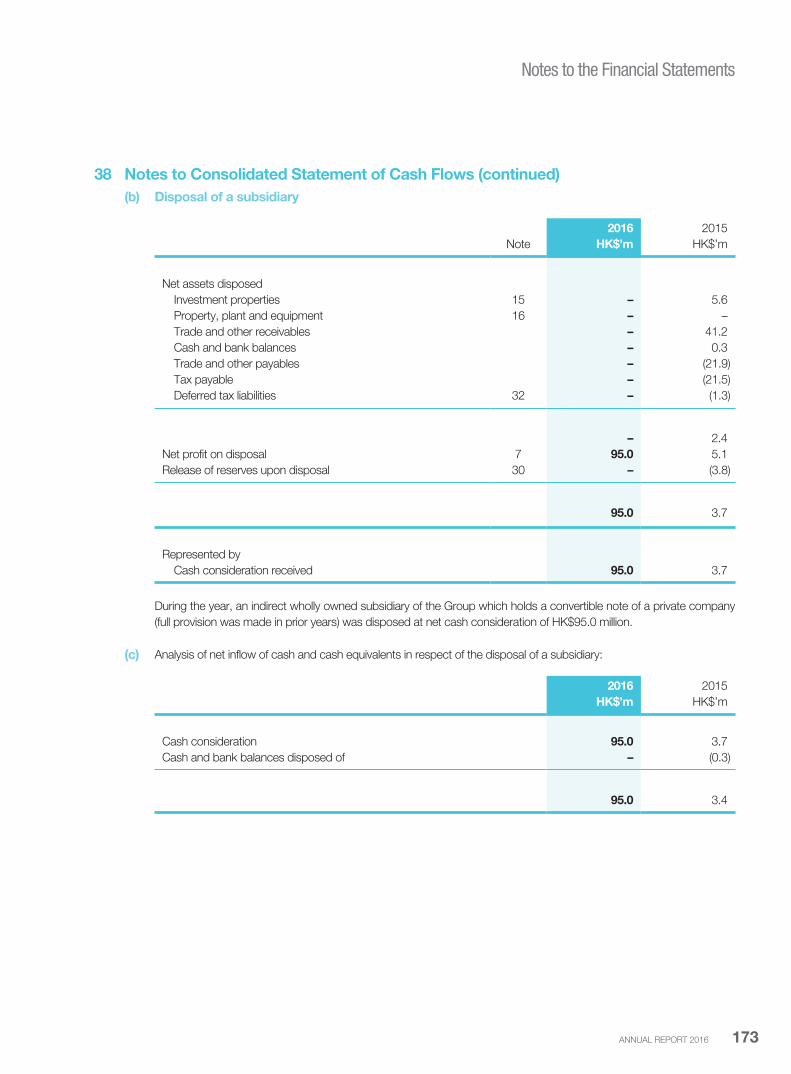
ANNUAL REPORT 2016 173
Notes to the Financial Statements
38 Notes to Consolidated Statement of Cash Flows (continued)
(b) Disposal of a subsidiary
2016 2015
Note HK$’m HK$’m
Net assets disposed
Investment properties 15 – 5.6
Property, plant and equipment 16 – –
Trade and other receivables – 41.2
Cash and bank balances – 0.3
Trade and other payables – (21.9)
Tax payable – (21.5)
Deferred tax liabilities 32 – (1.3)
– 2.4
Net profit on disposal 7 95.0 5.1
Release of reserves upon disposal 30 – (3.8)
95.0 3.7
Represented by
Cash consideration received 95.0 3.7
During the year, an indirect wholly owned subsidiary of the Group which holds a convertible note of a private company
(full provision was made in prior years) was disposed at net cash consideration of HK$95.0 million.
(c) Analysis of net inflow of cash and cash equivalents in respect of the disposal of a subsidiary:
2016 2015
HK$’m HK$’m
Cash consideration 95.0 3.7
Cash and bank balances disposed of – (0.3)
95.0 3.4

NWS HOLDINGS LIMITED174
Notes to the Financial Statements
39 Related Party Transactions(a) The following is a summary of significant related party transactions during the year carried out in the normal course of the
Group’s business:
2016 2015
Note HK$’m HK$’m
Transactions with affiliated companies (i)
Provision of construction work services (ii) 962.0 –
Provision of other services (iii) 7.6 3.5
Interest income (iv) 70.0 30.6
Management fee income (v) 23.6 23.7
Rental and other related expenses (vi) (11.3) (10.0)
Transactions with other related parties (i)
Provision of construction work services (ii) 8,447.1 6,986.8
Provision of other services (iii) 72.2 75.5
Rental and other related expenses (vi) (49.5) (45.4)
Mechanical and electrical engineering services (vii) (1,507.6) (664.2)
Other expenses (viii) (174.0) (153.0)
(i) Affiliated companies include associated companies and joint ventures of the Group. Related parties are
subsidiaries, associated companies and joint ventures of NWD, CTF Enterprises and Mr Doo and his associates
which are not companies within the Group. NWD is the ultimate holding company of the Company and CTF
Enterprises is a substantial shareholder of NWD. Mr Doo is the Vice-chairman and a non-executive director of
NWD. Mr Doo is also the father of Mr William Junior Guilherme Doo, the non-executive director of the Company.
(ii) Revenue from the provision of construction work services was charged in accordance with the relevant contracts.
(iii) The Group provided various kinds of services including facilities management, property management and other
services to certain affiliated companies and related parties. The services were provided and charged in accordance
with the relevant contracts.
(iv) Interest income was charged at interest rates as specified in notes 19, 20 and 24 on the outstanding balances due
from the affiliated companies.
(v) Management fee was charged at rates in accordance with the relevant contracts.
(vi) Rental and other related expenses were charged at rates in accordance with the respective tenancy agreements.
(vii) Mechanical and electrical engineering services were charged in accordance with the relevant contracts.
(viii) Other expenses include purchase of construction materials, laundry, security and guarding, landscaping, cleaning
and property management services. The services were charged in accordance with the relevant contracts.
(b) Key management compensationNo significant compensation arrangement has been entered into with the directors of the Company (being the key
management personnel) during the year other than the emoluments paid to them (being the key management personnel
compensation) as disclosed in note 14.
ANNUAL REPORT 2016 175
Notes to the Financial Statements
39 Related Party Transactions (continued)(c) On 24 September 2015, Catchy Investments Limited (the “Vendor”, a direct wholly owned subsidiary of NWD) and Hip
Hing Construction Holdings Limited (“HHCH”, an indirect wholly owned subsidiary of the Company) entered into an
agreement and pursuant to which, the Vendor agreed to dispose the entire issued share capital of Next Jubilee Holdings
Limited (“Next Jubilee”) and assign the outstanding shareholder’s loan of Next Jubilee from the Vendor to HHCH at a total
consideration of HK$261.9 million. Next Jubilee is an investment holding company whose main asset is its investment
in a wholly owned subsidiary, whose main assets are the properties comprising all those office units nos. 1 to 20 on the
eleventh floor of Chevalier Commercial Centre at No. 8 Wang Hoi Road, Kowloon Bay, Kowloon, Hong Kong.
The consideration was satisfied in cash by HHCH and completion of the agreement took place on 24 September 2015.
(d) On 10 December 2015, CTF Enterprises, Razor Zenith Limited (“RZL”, a wholly owned subsidiary of CTF Enterprises),
NWS Ports Management Limited (a direct wholly owned subsidiary of the Company), Flying Gravity Limited (“FGL”,
an indirect wholly owned subsidiary of the Company) and Silverway Global Limited (“SGL”) (collectively, the “Parties”)
entered into a shareholders agreement (the “Shareholders Agreement”) to regulate the respective rights and obligations
of RZL and FGL towards the management of SGL. The entire issued share capital of SGL is owned as to 50% by RZL
and 50% by FGL. Pursuant to the Shareholders Agreement, it was agreed that SGL shall, subject to the satisfaction of
certain conditions precedent, establish a joint venture with Aviation Capital Group Corp. (“ACG”, a company established
in USA engaged in the business of aircraft leasing), in which SGL shall hold 80% of the shares and ACG shall hold the
remaining 20% of the shares of the same class.
On 8 March 2016, Bauhinia Aviation Capital Limited was established as the joint venture between SGL and ACG as
contemplated under the Shareholders Agreement and owned as to 80% by SGL and 20% by ACG. Pursuant to a
supplemental agreement to the Shareholders Agreement entered into among the Parties on 8 March 2016, the Parties
agreed that the total commitment (whether equity, loan or otherwise and including any guarantee or indemnity in
connection with the establishment of SGL) of each of RZL and FGL towards SGL shall be increased from US$4.0 million
to US$240.0 million (approximate from HK$31.2 million to HK$1,872.0 million).
(e) On 6 January 2016, NWD, Easywin Enterprises Corporation Limited (the “Offeror”) and NWCL issued an announcement
jointly in relation to (i) the voluntary conditional cash offer by The Hongkong and Shanghai Banking Corporation Limited
(“HSBC”) on behalf of the Offeror to acquire all of the shares of NWCL (“NWCL Shares”) (other than those already held
by the Offeror and NWD) (the “Share Offer”); and (ii) the voluntary conditional cash offer by HSBC on behalf of the Offeror
to the holders of NWCL’s share options to cancel all the outstanding share options of NWCL held by them.
On 11 March 2016, High Earnings Holdings Limited (“High Earnings”, a wholly owned subsidiary of the Company)
tendered its acceptance of the Share Offer in respect of 93,073,738 NWCL Shares held by it by returning the duly
completed and signed form of acceptance and transfer in respect of the Share Offer together with the relevant
documents to the Hong Kong branch share registrar of NWCL. Based on the price of the Share Offer of HK$7.80
per offer share of NWCL, the aggregate consideration paid by the Offeror for the 93,073,738 NWCL Shares held by
High Earnings amounted to HK$725,975,156.40 (before deduction of seller’s ad valorem stamp duty). The relevant
consideration was received by High Earnings on 1 April 2016.
(f) The amounts of outstanding balances with associated companies, joint ventures and non-controlling interests are
disclosed in notes 19, 20, 24, 33 and 34.
40 Comparative FiguresCertain comparative figures have been reclassified to conform with the current year’s presentation.
41 Ultimate Holding CompanyThe directors regard NWD, a company incorporated in Hong Kong and listed on the Hong Kong Stock Exchange, as being the
ultimate holding company. The Company is held by NWD and certain of its subsidiaries.
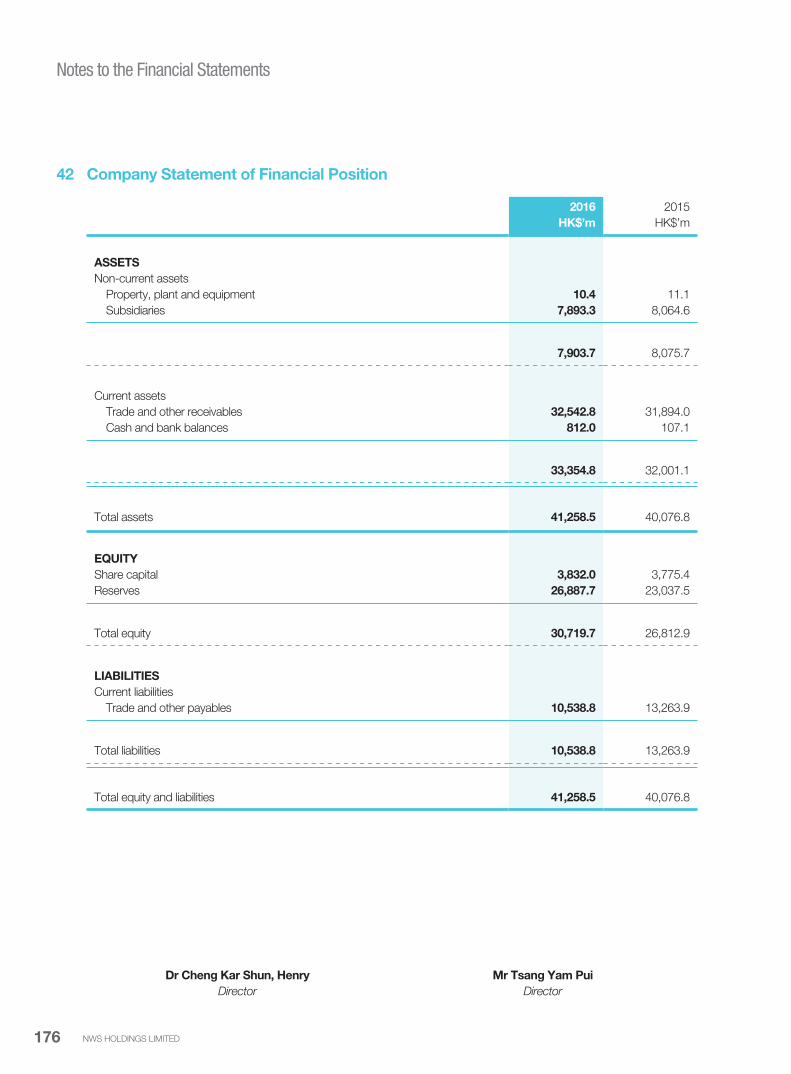
NWS HOLDINGS LIMITED176
Notes to the Financial Statements
42 Company Statement of Financial Position
2016 2015
HK$’m HK$’m
ASSETS
Non-current assets
Property, plant and equipment 10.4 11.1
Subsidiaries 7,893.3 8,064.6
7,903.7 8,075.7
Current assets
Trade and other receivables 32,542.8 31,894.0
Cash and bank balances 812.0 107.1
33,354.8 32,001.1
Total assets 41,258.5 40,076.8
EQUITY
Share capital 3,832.0 3,775.4
Reserves 26,887.7 23,037.5
Total equity 30,719.7 26,812.9
LIABILITIES
Current liabilities
Trade and other payables 10,538.8 13,263.9
Total liabilities 10,538.8 13,263.9
Total equity and liabilities 41,258.5 40,076.8
Dr Cheng Kar Shun, Henry Mr Tsang Yam Pui
Director Director
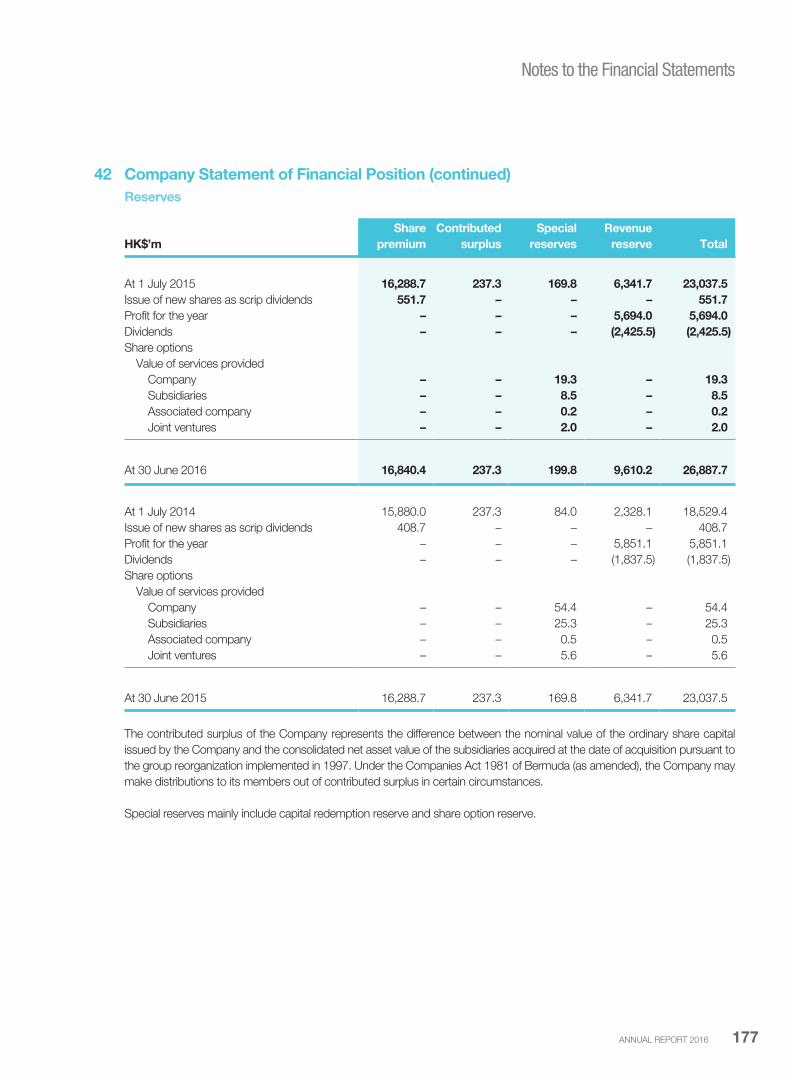
ANNUAL REPORT 2016 177
Notes to the Financial Statements
42 Company Statement of Financial Position (continued)
Reserves
Share Contributed Special Revenue
HK$’m premium surplus reserves reserve Total
At 1 July 2015 16,288.7 237.3 169.8 6,341.7 23,037.5
Issue of new shares as scrip dividends 551.7 – – – 551.7
Profit for the year – – – 5,694.0 5,694.0
Dividends – – – (2,425.5) (2,425.5)
Share options
Value of services provided
Company – – 19.3 – 19.3
Subsidiaries – – 8.5 – 8.5
Associated company – – 0.2 – 0.2
Joint ventures – – 2.0 – 2.0
At 30 June 2016 16,840.4 237.3 199.8 9,610.2 26,887.7
At 1 July 2014 15,880.0 237.3 84.0 2,328.1 18,529.4
Issue of new shares as scrip dividends 408.7 – – – 408.7
Profit for the year – – – 5,851.1 5,851.1
Dividends – – – (1,837.5) (1,837.5)
Share options
Value of services provided
Company – – 54.4 – 54.4
Subsidiaries – – 25.3 – 25.3
Associated company – – 0.5 – 0.5
Joint ventures – – 5.6 – 5.6
At 30 June 2015 16,288.7 237.3 169.8 6,341.7 23,037.5
The contributed surplus of the Company represents the difference between the nominal value of the ordinary share capital
issued by the Company and the consolidated net asset value of the subsidiaries acquired at the date of acquisition pursuant to
the group reorganization implemented in 1997. Under the Companies Act 1981 of Bermuda (as amended), the Company may
make distributions to its members out of contributed surplus in certain circumstances.
Special reserves mainly include capital redemption reserve and share option reserve.
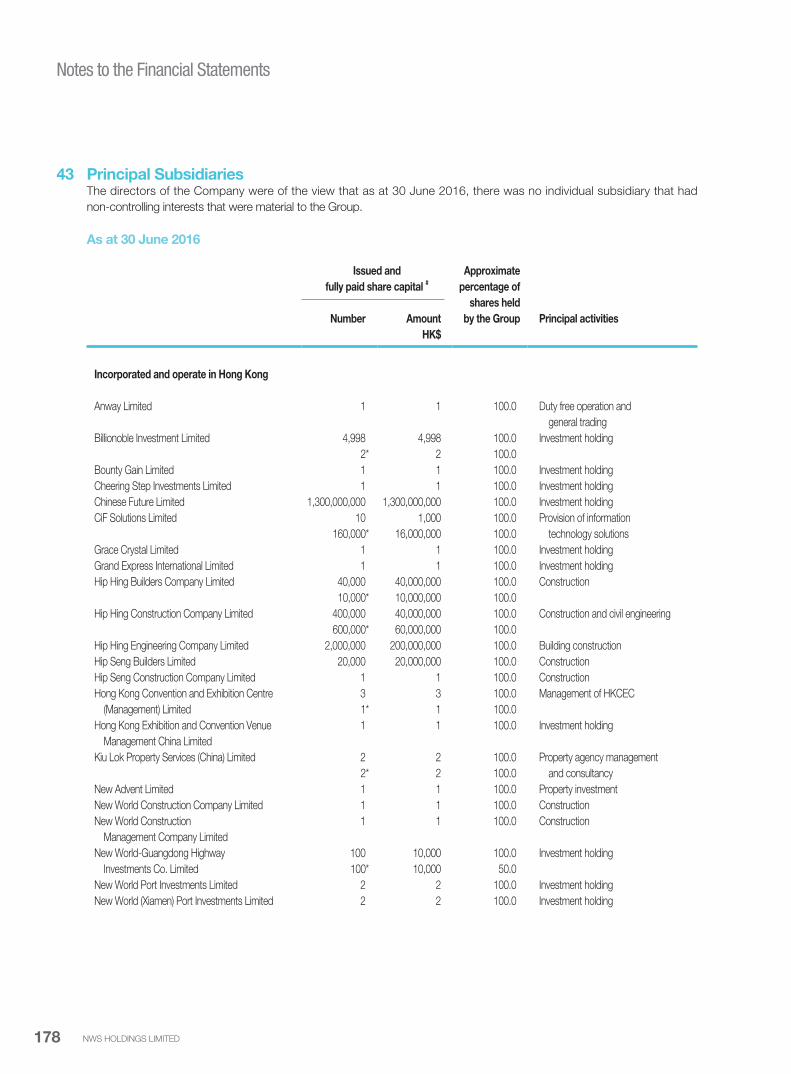
NWS HOLDINGS LIMITED178
Notes to the Financial Statements
43 Principal SubsidiariesThe directors of the Company were of the view that as at 30 June 2016, there was no individual subsidiary that had
non-controlling interests that were material to the Group.
As at 30 June 2016
Issued and
fully paid share capital #Approximate
percentage of
shares held
by the Group Principal activities
Number Amount
HK$
Incorporated and operate in Hong Kong
Anway Limited 1 1 100.0 Duty free operation and
general trading
Billionoble Investment Limited 4,998 4,998 100.0 Investment holding
2* 2 100.0
Bounty Gain Limited 1 1 100.0 Investment holding
Cheering Step Investments Limited 1 1 100.0 Investment holding
Chinese Future Limited 1,300,000,000 1,300,000,000 100.0 Investment holding
CiF Solutions Limited 10 1,000 100.0 Provision of information
160,000* 16,000,000 100.0 technology solutions
Grace Crystal Limited 1 1 100.0 Investment holding
Grand Express International Limited 1 1 100.0 Investment holding
Hip Hing Builders Company Limited 40,000 40,000,000 100.0 Construction
10,000* 10,000,000 100.0
Hip Hing Construction Company Limited 400,000 40,000,000 100.0 Construction and civil engineering
600,000* 60,000,000 100.0
Hip Hing Engineering Company Limited 2,000,000 200,000,000 100.0 Building construction
Hip Seng Builders Limited 20,000 20,000,000 100.0 Construction
Hip Seng Construction Company Limited 1 1 100.0 Construction
Hong Kong Convention and Exhibition Centre 3 3 100.0 Management of HKCEC
(Management) Limited 1* 1 100.0
Hong Kong Exhibition and Convention Venue 1 1 100.0 Investment holding
Management China Limited
Kiu Lok Property Services (China) Limited 2 2 100.0 Property agency management
2* 2 100.0 and consultancy
New Advent Limited 1 1 100.0 Property investment
New World Construction Company Limited 1 1 100.0 Construction
New World Construction 1 1 100.0 Construction
Management Company Limited
New World-Guangdong Highway 100 10,000 100.0 Investment holding
Investments Co. Limited 100* 10,000 50.0
New World Port Investments Limited 2 2 100.0 Investment holding
New World (Xiamen) Port Investments Limited 2 2 100.0 Investment holding
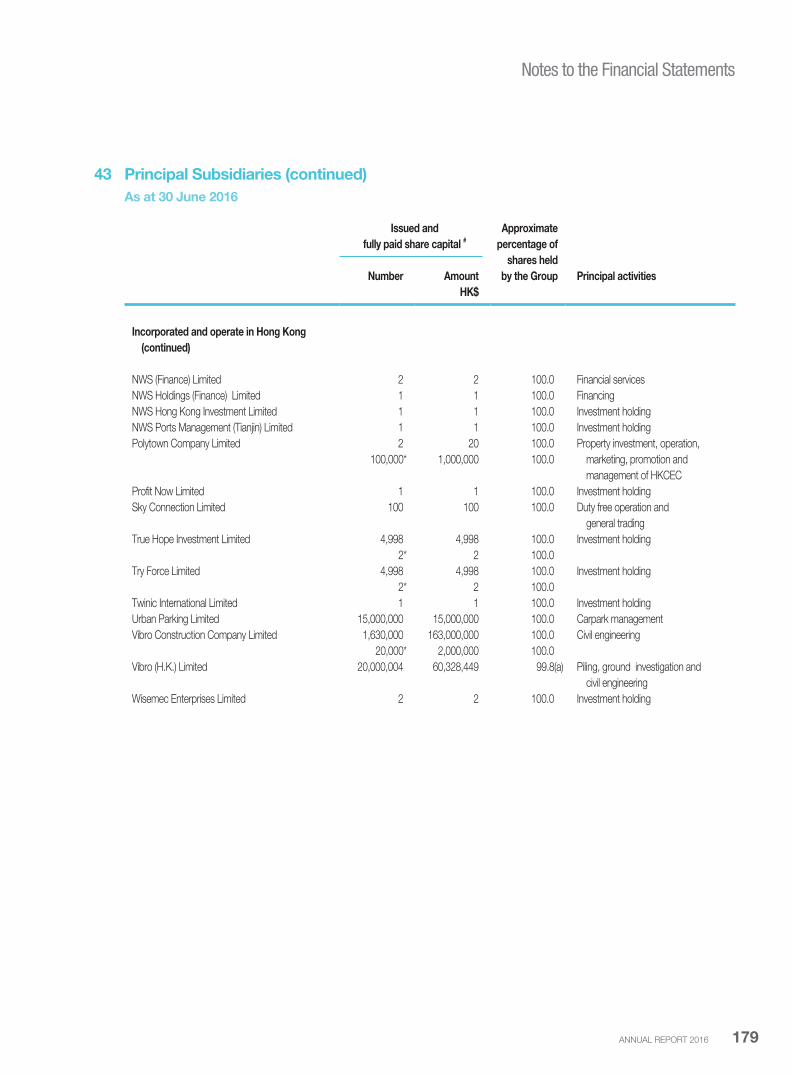
ANNUAL REPORT 2016 179
Notes to the Financial Statements
43 Principal Subsidiaries (continued)
As at 30 June 2016
Issued and
fully paid share capital #Approximate
percentage of
shares held
by the Group Principal activities
Number Amount
HK$
Incorporated and operate in Hong Kong
(continued)
NWS (Finance) Limited 2 2 100.0 Financial services
NWS Holdings (Finance) Limited 1 1 100.0 Financing
NWS Hong Kong Investment Limited 1 1 100.0 Investment holding
NWS Ports Management (Tianjin) Limited 1 1 100.0 Investment holding
Polytown Company Limited 2 20 100.0 Property investment, operation,
100,000* 1,000,000 100.0 marketing, promotion and
management of HKCEC
Profit Now Limited 1 1 100.0 Investment holding
Sky Connection Limited 100 100 100.0 Duty free operation and
general trading
True Hope Investment Limited 4,998 4,998 100.0 Investment holding
2* 2 100.0
Try Force Limited 4,998 4,998 100.0 Investment holding
2* 2 100.0
Twinic International Limited 1 1 100.0 Investment holding
Urban Parking Limited 15,000,000 15,000,000 100.0 Carpark management
Vibro Construction Company Limited 1,630,000 163,000,000 100.0 Civil engineering
20,000* 2,000,000 100.0
Vibro (H.K.) Limited 20,000,004 60,328,449 99.8(a) Piling, ground investigation and
civil engineering
Wisemec Enterprises Limited 2 2 100.0 Investment holding
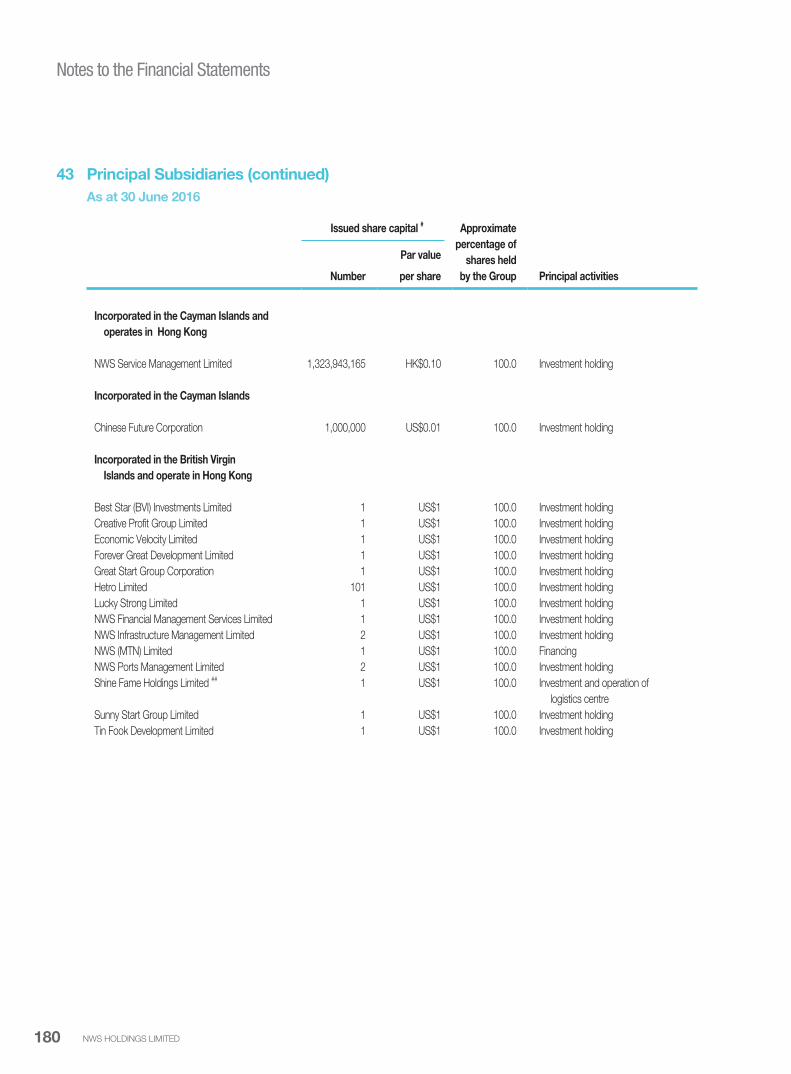
NWS HOLDINGS LIMITED180
Notes to the Financial Statements
43 Principal Subsidiaries (continued)
As at 30 June 2016
Issued share capital # Approximate
percentage of
shares held
by the Group Principal activities
Par value
Number per share
Incorporated in the Cayman Islands and
operates in Hong Kong
NWS Service Management Limited 1,323,943,165 HK$0.10 100.0 Investment holding
Incorporated in the Cayman Islands
Chinese Future Corporation 1,000,000 US$0.01 100.0 Investment holding
Incorporated in the British Virgin
Islands and operate in Hong Kong
Best Star (BVI) Investments Limited 1 US$1 100.0 Investment holding
Creative Profit Group Limited 1 US$1 100.0 Investment holding
Economic Velocity Limited 1 US$1 100.0 Investment holding
Forever Great Development Limited 1 US$1 100.0 Investment holding
Great Start Group Corporation 1 US$1 100.0 Investment holding
Hetro Limited 101 US$1 100.0 Investment holding
Lucky Strong Limited 1 US$1 100.0 Investment holding
NWS Financial Management Services Limited 1 US$1 100.0 Investment holding
NWS Infrastructure Management Limited 2 US$1 100.0 Investment holding
NWS (MTN) Limited 1 US$1 100.0 Financing
NWS Ports Management Limited 2 US$1 100.0 Investment holding
Shine Fame Holdings Limited ## 1 US$1 100.0 Investment and operation of
logistics centre
Sunny Start Group Limited 1 US$1 100.0 Investment holding
Tin Fook Development Limited 1 US$1 100.0 Investment holding

ANNUAL REPORT 2016 181
Notes to the Financial Statements
43 Principal Subsidiaries (continued)
As at 30 June 2016
Issued share capital # Approximate
percentage of
shares held
by the Group Principal activities
Par value
Number per share
Incorporated in the British Virgin Islands
Beauty Ocean Limited 1 US$1 100.0 Investment holding
Flying Gravity Limited 1 US$1 100.0 Investment holding
Fortland Ventures Limited 1 US$1 100.0 Investment holding
Ideal Global International Limited 1 US$1 100.0 Investment holding
Moscan Developments Limited 1 US$1 100.0 Investment holding
Natal Global Limited 1 US$1 100.0 Investment holding
NWS CON Limited 1 HK$1 100.0 Investment holding
NWS Construction Limited 190,000 US$0.1 100.0 Investment holding
8,325** US$0.1 –
7,080*** US$0.1 –
NWS Infrastructure Bridges Limited 1 US$1 100.0 Investment holding
NWS Infrastructure Power Limited 1 US$1 100.0 Investment holding
NWS Infrastructure Roads Limited 1 US$1 100.0 Investment holding
NWS Infrastructure Water Limited 1 US$1 100.0 Investment holding
Pure Cosmos Limited 1 US$1 100.0 Investment holding
Right Heart Associates Limited 4 US$1 100.0 Investment holding
Righteous Corporation 1 US$1 100.0 Investment holding
Rosy Unicorn Limited 1 US$1 100.0 Financing
Silvery Castle Limited 1 US$1 100.0 Financing
Stockfield Limited 1 US$1 100.0 Investment holding
Amount of
fully paid capital
Approximate
percentage of
attributable
interest to
the Group Principal activities
Incorporated and operate in Mainland China
Chaoming (Chongqing) Investment US$78,000,000 100.0 Investment holding
Company Limited
Guangdong Xin Chuan Co., Ltd. RMB714,853,600 100.0 Investment holding
Guangxi Beiliu Xinbei Highways Co., Ltd. RMB59,520,000 100.0 Operation of toll road
Guangxi Rongxian Xinrong Highways Limited RMB57,680,000 100.0 Operation of toll road
Guangxi Yulin Xinye Highways Co., Ltd. RMB63,800,000 60.0(b) Operation of toll road
Guangxi Yulin Xinyu Highways Co., Ltd. RMB96,000,000 65.0(c) Operation of toll road
Hangzhou Guoyi Expressway and Bridge US$320,590,000 100.0(d) Operation of toll road
Management Co., Ltd.
Shanxi Xinda Highways Ltd. RMB49,000,000 60.0(e) Operation of toll road
Shanxi Xinhuang Highways Ltd. RMB56,000,000 60.0(e) Operation of toll road
Wuzhou Xinwu Highways Limited RMB72,000,000 52.0(f) Operation of toll road
Xiamen NWS Management US$500,000 100.0 Management consultation
Consultancy Limited

NWS HOLDINGS LIMITED182
Notes to the Financial Statements
43 Principal Subsidiaries (continued)
As at 30 June 2016
Amount of
fully paid capital
Approximate
percentage of
attributable
interest to
the Group Principal activities
Incorporated and operate in Macau
Hip Hing Engineering (Macau) Company Limited MOP100,000 100.0 Construction
Vibro (Macau) Limited MOP1,000,000 99.8(a) Foundation works
# Ordinary shares, unless otherwise stated## Company classified as assets held-for-sale/liabilities directly associated with assets held-for-sale
* Non-voting deferred shares
** Redeemable, non-convertible and non-voting A preference shares
*** Redeemable, non-convertible and non-voting B preference shares
(a) The approximate percentage of shares held by non-controlling interests is 0.2%
(b) Percentage of interest in ownership and profit sharing (percentage for non-controlling interest is 40%)
(c) Profit sharing percentage (percentage held by non-controlling interest is 35%)
(d) The Group contracted to increase its interest in Hangzhou Ring Road by 5% to 100% during the year. The directors
of the Company considered the risks and rewards arising from the transaction has been passed to the Group and
Hangzhou Ring Road was accounted for as a wholly owned subsidiary of the Group as at 30 June 2016. The
transaction was legally completed in August 2016.
(e) Cash sharing ratio of 90% (percentage for non-controlling interest is 10%) for the first 12 years from the operation date
and thereafter 60% (percentage for non-controlling interest is 40%)
(f) Profit sharing percentage (percentage for non-controlling interest is 48%)
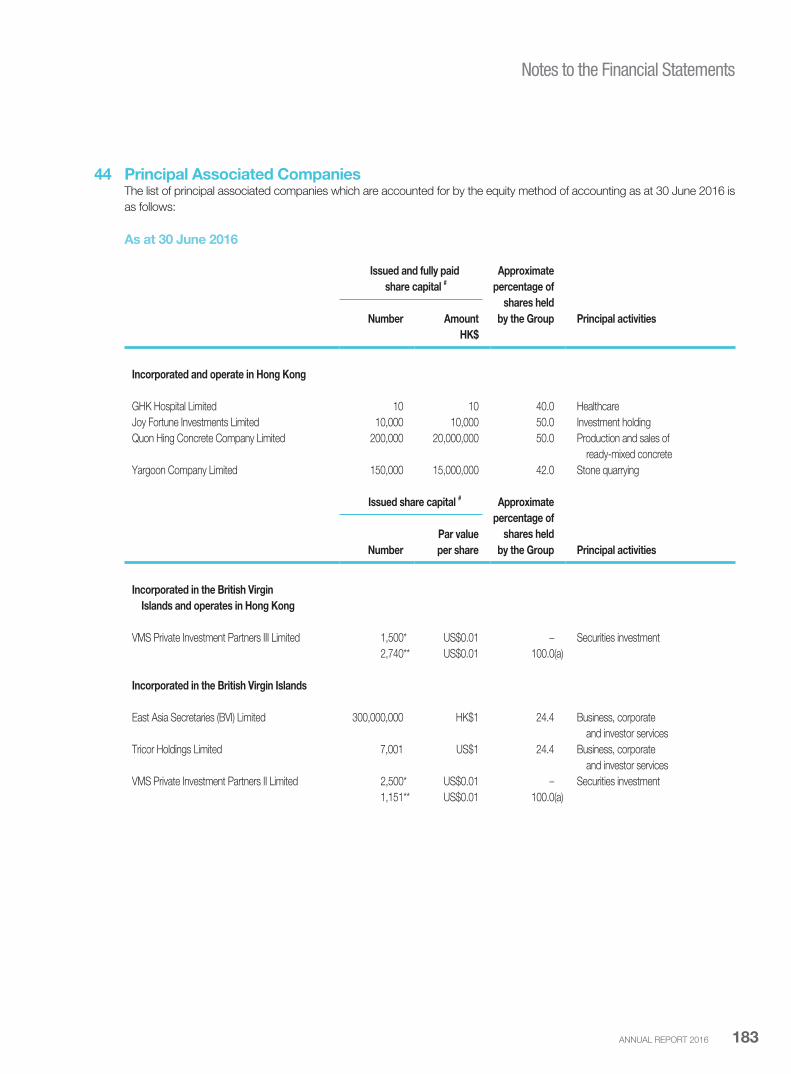
ANNUAL REPORT 2016 183
Notes to the Financial Statements
44 Principal Associated CompaniesThe list of principal associated companies which are accounted for by the equity method of accounting as at 30 June 2016 is
as follows:
As at 30 June 2016
Issued and fully paid
share capital #Approximate
percentage of
shares held
by the Group Principal activities
Number Amount
HK$
Incorporated and operate in Hong Kong
GHK Hospital Limited 10 10 40.0 Healthcare
Joy Fortune Investments Limited 10,000 10,000 50.0 Investment holding
Quon Hing Concrete Company Limited 200,000 20,000,000 50.0 Production and sales of
ready-mixed concrete
Yargoon Company Limited 150,000 15,000,000 42.0 Stone quarrying
Issued share capital # Approximate
percentage of
shares held
by the Group Principal activities
Number
Par value
per share
Incorporated in the British Virgin
Islands and operates in Hong Kong
VMS Private Investment Partners III Limited 1,500* US$0.01 – Securities investment
2,740** US$0.01 100.0(a)
Incorporated in the British Virgin Islands
East Asia Secretaries (BVI) Limited 300,000,000 HK$1 24.4 Business, corporate
and investor services
Tricor Holdings Limited 7,001 US$1 24.4 Business, corporate
and investor services
VMS Private Investment Partners II Limited 2,500* US$0.01 – Securities investment
1,151** US$0.01 100.0(a)
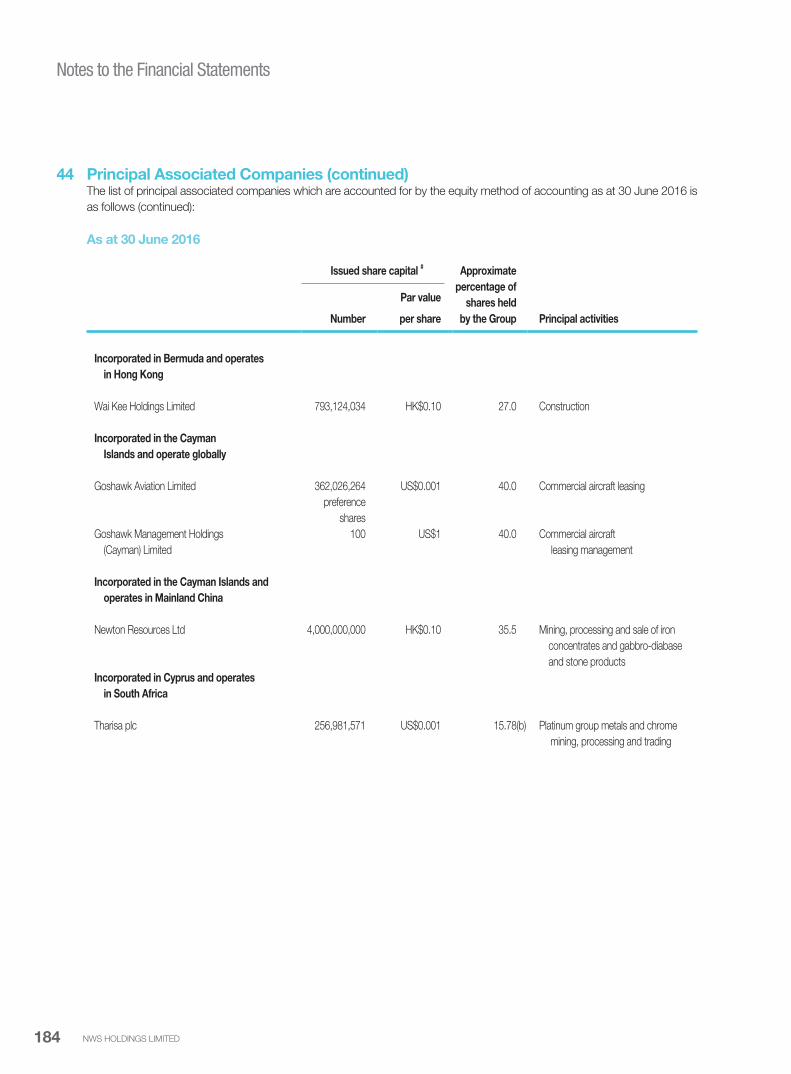
NWS HOLDINGS LIMITED184
Notes to the Financial Statements
44 Principal Associated Companies (continued)The list of principal associated companies which are accounted for by the equity method of accounting as at 30 June 2016 is
as follows (continued):
As at 30 June 2016
Issued share capital # Approximate
percentage of
shares held
by the Group Principal activities
Par value
Number per share
Incorporated in Bermuda and operates
in Hong Kong
Wai Kee Holdings Limited 793,124,034 HK$0.10 27.0 Construction
Incorporated in the Cayman
Islands and operate globally
Goshawk Aviation Limited 362,026,264 US$0.001 40.0 Commercial aircraft leasing
preference
shares
Goshawk Management Holdings 100 US$1 40.0 Commercial aircraft
(Cayman) Limited leasing management
Incorporated in the Cayman Islands and
operates in Mainland China
Newton Resources Ltd 4,000,000,000 HK$0.10 35.5 Mining, processing and sale of iron
concentrates and gabbro-diabase
and stone products
Incorporated in Cyprus and operates
in South Africa
Tharisa plc 256,981,571 US$0.001 15.78(b) Platinum group metals and chrome
mining, processing and trading
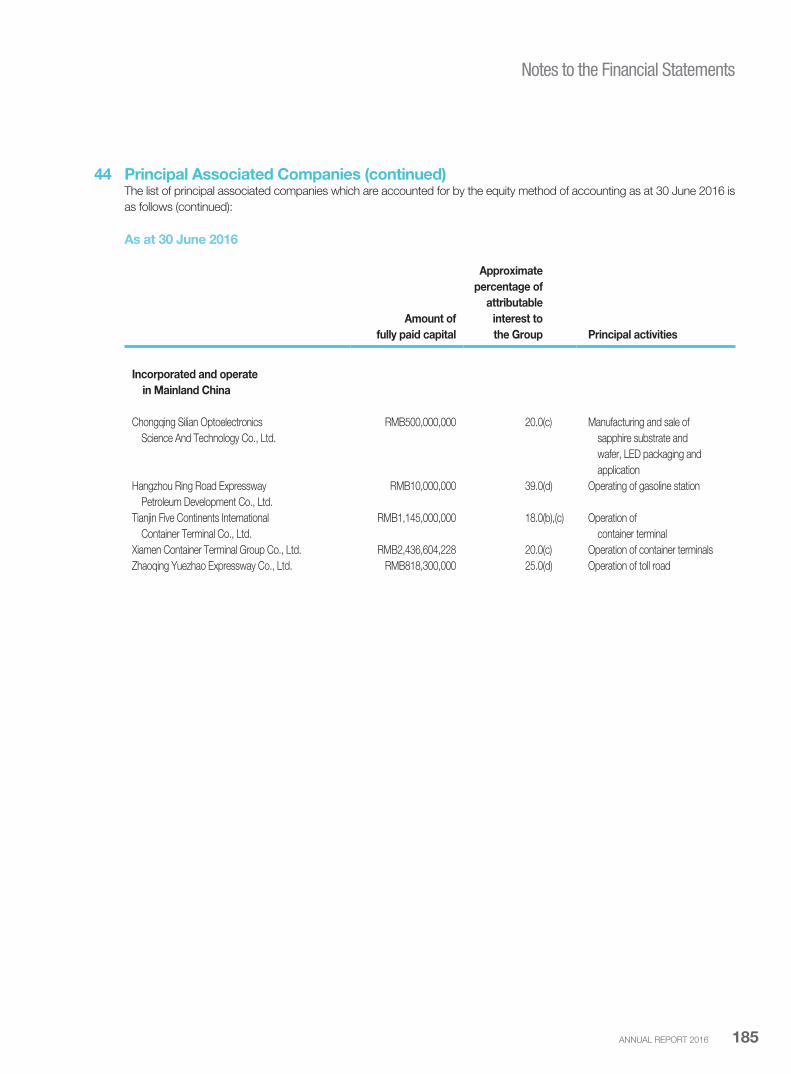
ANNUAL REPORT 2016 185
Notes to the Financial Statements
44 Principal Associated Companies (continued)The list of principal associated companies which are accounted for by the equity method of accounting as at 30 June 2016 is
as follows (continued):
As at 30 June 2016
Amount of
fully paid capital
Approximate
percentage of
attributable
interest to
the Group Principal activities
Incorporated and operate
in Mainland China
Chongqing Silian Optoelectronics
Science And Technology Co., Ltd.
RMB500,000,000 20.0(c) Manufacturing and sale of
sapphire substrate and
wafer, LED packaging and
application
Hangzhou Ring Road Expressway
Petroleum Development Co., Ltd.
RMB10,000,000 39.0(d) Operating of gasoline station
Tianjin Five Continents International RMB1,145,000,000 18.0(b),(c) Operation of
Container Terminal Co., Ltd. container terminal
Xiamen Container Terminal Group Co., Ltd. RMB2,436,604,228 20.0(c) Operation of container terminals
Zhaoqing Yuezhao Expressway Co., Ltd. RMB818,300,000 25.0(d) Operation of toll road

NWS HOLDINGS LIMITED186
Notes to the Financial Statements
44 Principal Associated Companies (continued)The list of principal associated companies which are accounted for by the equity method of accounting as at 30 June 2016 is
as follows (continued):
As at 30 June 2016
Issued and
Approximate
percentage
of shares held
by the Group Principal activities
fully paid share capital #
Number of
ordinary
shares
Par value
per share
Incorporated and operates
in Mainland China
Beijing Capital International 2,451,526,000 RMB1 – Operation of an
Airport Co., Ltd. domestic
shares
international airport
1,879,364,000 RMB1 23.9(b)
H shares
# Ordinary shares, unless otherwise stated
* Voting, non-participating, non-redeemable management shares
** Non-voting, redeemable participating shares
(a) The directors of the Company considered the Group has significant influence over these companies through its
representative on the investment committee which governs the daily financial, operational and investment decisions
(b) The directors of the Company considered the Group has significant influence over these companies through its
representatives on the board of directors of these companies
(c) Percentage of equity interest
(d) Percentage of interest in ownership and profit sharing
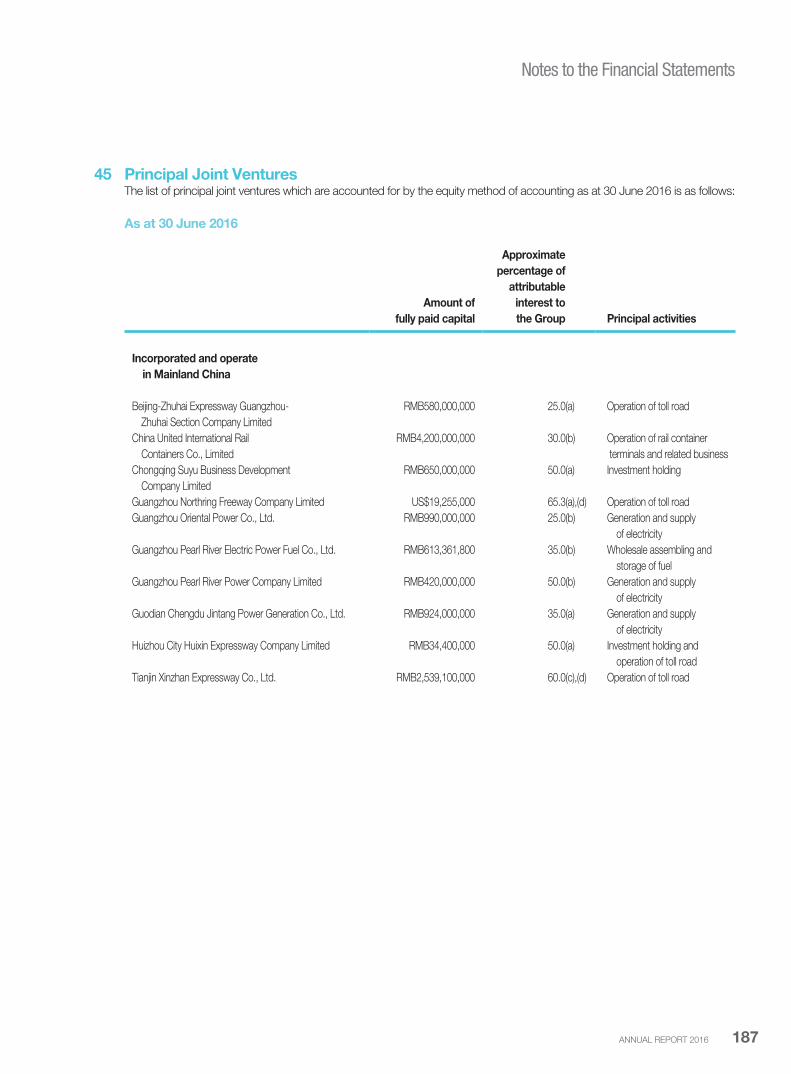
ANNUAL REPORT 2016 187
Notes to the Financial Statements
45 Principal Joint VenturesThe list of principal joint ventures which are accounted for by the equity method of accounting as at 30 June 2016 is as follows:
As at 30 June 2016
Amount of
fully paid capital
Approximate
percentage of
attributable
interest to
the Group Principal activities
Incorporated and operate
in Mainland China
Beijing-Zhuhai Expressway Guangzhou- RMB580,000,000 25.0(a) Operation of toll road
Zhuhai Section Company Limited
China United International Rail RMB4,200,000,000 30.0(b) Operation of rail container
Containers Co., Limited terminals and related business
Chongqing Suyu Business Development RMB650,000,000 50.0(a) Investment holding
Company Limited
Guangzhou Northring Freeway Company Limited US$19,255,000 65.3(a),(d) Operation of toll road
Guangzhou Oriental Power Co., Ltd. RMB990,000,000 25.0(b) Generation and supply
of electricity
Guangzhou Pearl River Electric Power Fuel Co., Ltd. RMB613,361,800 35.0(b) Wholesale assembling and
storage of fuel
Guangzhou Pearl River Power Company Limited RMB420,000,000 50.0(b) Generation and supply
of electricity
Guodian Chengdu Jintang Power Generation Co., Ltd. RMB924,000,000 35.0(a) Generation and supply
of electricity
Huizhou City Huixin Expressway Company Limited RMB34,400,000 50.0(a) Investment holding and
operation of toll road
Tianjin Xinzhan Expressway Co., Ltd. RMB2,539,100,000 60.0(c),(d) Operation of toll road
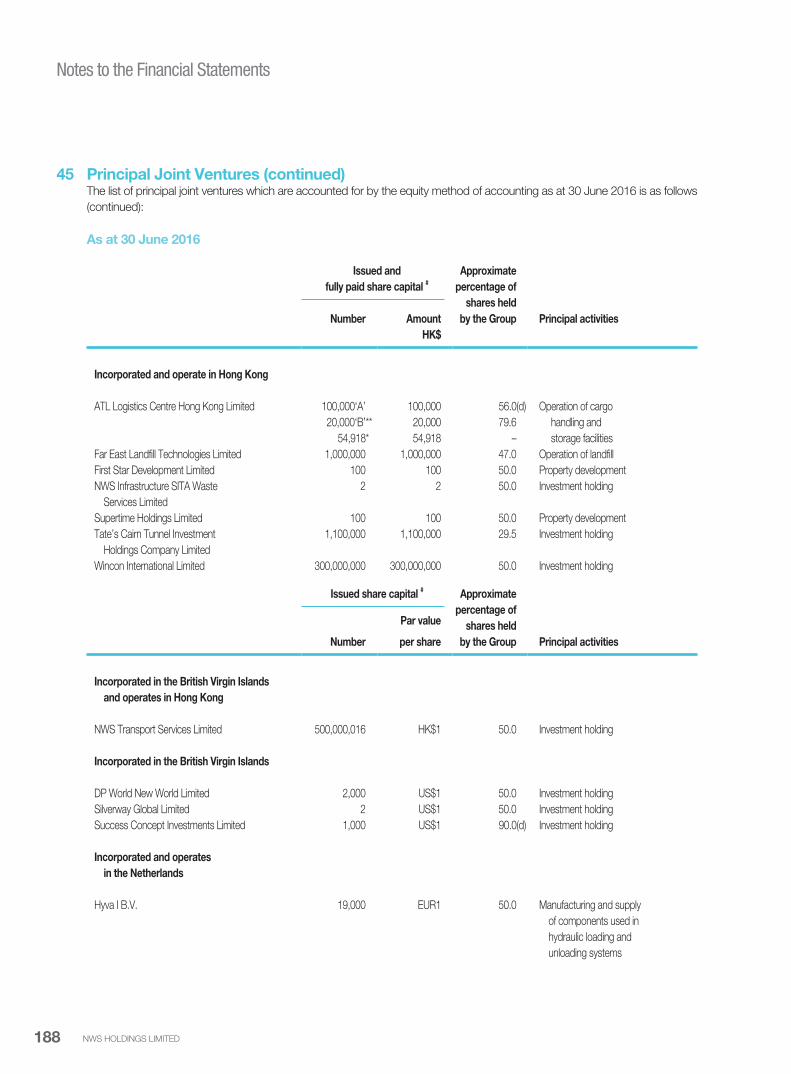
NWS HOLDINGS LIMITED188
Notes to the Financial Statements
45 Principal Joint Ventures (continued)The list of principal joint ventures which are accounted for by the equity method of accounting as at 30 June 2016 is as follows
(continued):
As at 30 June 2016
Issued and
fully paid share capital #Approximate
percentage of
shares held
by the Group
Number Amount Principal activities
HK$
Incorporated and operate in Hong Kong
ATL Logistics Centre Hong Kong Limited 100,000‘A’ 100,000 56.0(d) Operation of cargo
20,000‘B’** 20,000 79.6 handling and
54,918* 54,918 – storage facilities
Far East Landfill Technologies Limited 1,000,000 1,000,000 47.0 Operation of landfill
First Star Development Limited 100 100 50.0 Property development
NWS Infrastructure SITA Waste
Services Limited
2 2 50.0 Investment holding
Supertime Holdings Limited 100 100 50.0 Property development
Tate’s Cairn Tunnel Investment 1,100,000 1,100,000 29.5 Investment holding
Holdings Company Limited
Wincon International Limited 300,000,000 300,000,000 50.0 Investment holding
Issued share capital # Approximate
percentage of
shares held
by the Group Principal activities
Par value
Number per share
Incorporated in the British Virgin Islands
and operates in Hong Kong
NWS Transport Services Limited 500,000,016 HK$1 50.0 Investment holding
Incorporated in the British Virgin Islands
DP World New World Limited 2,000 US$1 50.0 Investment holding
Silverway Global Limited 2 US$1 50.0 Investment holding
Success Concept Investments Limited 1,000 US$1 90.0(d) Investment holding
Incorporated and operates
in the Netherlands
Hyva I B.V. 19,000 EUR1 50.0 Manufacturing and supply
of components used in
hydraulic loading and
unloading systems

ANNUAL REPORT 2016 189
Notes to the Financial Statements
45 Principal Joint Ventures (continued)The list of principal joint ventures which are accounted for by the equity method of accounting as at 30 June 2016 is as follows
(continued):
As at 30 June 2016
Issued and
fully paid share capital #Approximate
percentage of
shares held
by the Group
Number Amount Principal activities
HK$
Incorporated in Hong Kong and operates
in Hong Kong, Macau and Mainland China
Sino-French Holdings (Hong Kong) Limited 3,748,680‘A’ 374,868,000 – Investment holding and
7,209,000‘B’ 720,900,000 100.0 operation of water plants
3,460,320‘C’ 346,032,000 –
# Ordinary shares, unless otherwise stated
* Non-voting deferred shares
** Non-voting preference shares
(a) Percentage of interest in ownership and profit sharing
(b) Percentage of equity interest
(c) Cash sharing ratio of 90% for the first 15 years from the operation date and thereafter 60%
(d) The directors of the Company considered the Group does not have unilateral control governing the financial and
operating activities over these joint ventures

Five-Year Financial Summary
NWS HOLDINGS LIMITED190
2016 2015 2014 2013 2012
Earnings per share – Basic (HK$) 1.30 1.19 1.17 1.11 1.53
Earnings per share – Diluted (HK$) N/A N/A N/A 1.11 1.52
Key ratios
Net Gearing Ratio 13% 14% 23% 24% 34%
Return on Equity 11% 10% 10% 10% 15%
Return on Capital Employed 9% 7% 8% 7% 10%
Income statement data
(HK$’m)
Revenue 29,497.8 24,491.8 21,443.0 16,247.9 14,954.3
Revenue by segments
Roads 2,399.8 2,416.2 2,306.8 2,200.3 1,903.5
Logistics 100.1 100.1 99.7 102.1 41.3
Facilities Management 6,917.9 6,768.6 6,174.2 6,471.7 7,177.4
Construction & Transport 20,080.0 15,206.9 12,862.3 7,473.8 5,832.1
Revenue by region
Hong Kong 26,243.3 21,818.3 18,504.2 13,973.6 12,786.4
Mainland China 2,480.2 2,490.0 2,381.2 2,265.9 1,971.7
Others 774.3 183.5 557.6 8.4 196.2
Profit attributable to shareholders of the Company 4,912.8 4,477.6 4,324.9 4,008.0 5,251.1
Attributable operating profit 4,739.6 4,456.6 4,379.0 4,267.3 4,207.6
Attributable operating profit by segments
Roads 1,259.8 1,201.0 1,126.7 1,238.2 1,210.1
Environment 469.8 631.4 739.7 719.5 621.5
Logistics 702.6 548.9 477.7 330.4 301.4
Aviation 424.0 243.6 83.9 – –
Facilities Management 645.0 861.5 910.7 1,123.6 1,184.0
Construction & Transport 911.6 691.1 605.3 394.3 334.2
Strategic Investments 326.8 279.1 435.0 461.3 556.4

Five-Year Financial Summary
ANNUAL REPORT 2016 191
2016 2015 2014 2013 2012
Income statement data (continued)
(HK$’m)
Attributable operating profit by region
Hong Kong 2,615.9 2,556.1 2,292.4 2,204.7 2,241.4
Mainland China 1,937.9 1,748.0 1,642.8 1,647.5 1,493.0
Others 185.8 152.5 443.8 415.1 473.2
Corporate office and non-operating items
Net gain on disposal of a project under a joint venture – 1,549.9 – – –
Gain on remeasurement of an available-for-sale
financial asset retained at fair value upon reclassification
from an associated company – 914.0 – – –
Net gain on deemed disposals of interests
in associated companies or joint ventures – – 594.3 – 1,833.4
Gain on fair value of investment properties 1,420.0 306.6 111.4 333.6 93.3
Gain on disposal of an available-for-sale financial asset 534.1 – – – –
Gain on disposal of projects, net of tax 199.4 51.4 79.0 – 108.7
Net gain on deemed disposal of a project under
a joint venture 179.3 – – – –
Share of profit from Harbour Place, a residential
development project 2.0 71.9 41.8 28.1 51.8
Loss on partial disposal and impairment loss related to
an associated company – (1,910.9) – – –
Assets impairment losses – – – – (316.5)
Impairment loss of an available-for-sale financial asset (670.4) – – – –
Impairment loss related to an associated company (200.0) – – – –
Impairment loss related to a joint venture (177.6) (300.0) – – (200.0)
Provision for impairment on a joint venture – – (72.1) – –
Net exchange (loss)/gain (368.8) 2.1 (28.0) 104.9 14.0
Interest income 198.1 210.5 113.2 109.7 51.8
Finance costs (546.3) (522.0) (561.9) (555.3) (333.8)
Expenses and others (396.6) (352.5) (331.8) (280.3) (259.2)
Statement of financial position data
(HK$’m)
Total assets 75,685.0 75,153.6 71,554.1 67,022.8 62,086.2
Total liabilities and non-controlling interests 30,066.1 29,740.2 29,337.7 26,839.7 26,291.9
Total borrowings 15,064.8 16,811.4 17,667.5 17,679.5 17,666.1
Shareholders' funds 45,618.9 45,413.4 42,216.4 40,183.1 35,794.3

As at 30 June 2016
Project Key Facts and Figures
NWS HOLDINGS LIMITED192
2. Beijing-Zhuhai Expressway
(Guangzhou-Zhuhai Section)
3. Beijing-Zhuhai Expressway
(Guangzhou-Zhuhai Northern
Section)
4. Guangzhou-Zhaoqing
Expressway
Attributable Interest 25% 15% 25%
Form of Investment CJV CJV CJV
Length Section 1: 8.6 km
Section 2: 53.8 km
27 km Phase 1: 48 km
Phase 2: 5.39 km
Lanes Section 1: Dual 3-Lane
Section 2: Dual 2 to 3-Lane
Dual 3-Lane Phase 1: Dual 2-Lane
Phase 2: Dual 3-Lane
Location Zhongshan City & Zhuhai City Guangzhou City Zhaoqing City & Foshan City
Operation Date December 1999 December 2005 Phase 1: September 2002
Phase 2: September 2010
Expiry Date 2030 2032 2031
Current Toll Rates Section 1: RMB6 – RMB19 (Normal)
Section 2: RMB2 – RMB109 (Normal)
Section 1 & 2:
RMB0.09 – RMB0.12 / tonne / km
(Toll-by-weight vehicle)
RMB1 – RMB55 (Normal)
RMB0.12 / tonne / km
(Toll-by-weight vehicle)
RMB1 – RMB84 (Normal)
RMB0.09 – RMB0.12 / tonne / km
(Toll-by-weight vehicle)
Average Daily 2016 2015 2014 2016 2015 2014 2016 2015 2014
Traffic Flow 156,152 145,523 131,737 50,970 42,075 33,752 77,091 68,429 63,073
ROADSThe road portfolio comprises 17 roads and related projects in strategic locations
in Hong Kong and Mainland China, namely Guangdong, Zhejiang, Guangxi,
Shanxi and Tianjin, covering approximately 651 km in length.
INFRASTRUCTURE
1. Guangzhou City Northern
Ring Road
Attributable Interest 65.29%
Form of Investment CJV
Length 22 km
Lanes Dual 3-Lane
Location Guangzhou City
Operation Date January 1994
Expiry Date 2023
Current Toll Rates RMB1 – RMB28 (Normal)
RMB0.12 / tonne / km
(Toll-by-weight vehicle)
Average Daily Traffic Flow 2016 2015 2014286,088 258,580 247,450
Guangdong Province
4
1, 8
3
6
2
7
5b
5a
Guangzhou Baiyun International Airport
Zhaoqing Guangzhou Dongguan Huizhou
Shenzhen
LongxuedaoFerryTerminal
Hong Kong
Zhongshan
Zhuhai
Macau
The New GuangzhouRailway Station
Expressway
Roads
Grade 1 Highway

Project Key Facts and Figures
ANNUAL REPORT 2016 193
5a. Shenzhen-Huizhou
Expressway (Huizhou
Section)
5b. Shenzhen-Huizhou Roadway
(Huizhou Section)
6. Guangzhou Dongxin
Expressway
Attributable Interest 33.33% 50% 45.9%
Form of Investment CJV CJV Equity
Length 34.7 km 21.8 km 46.22 km
Lanes Dual 3 to 4-Lane Dual 2-Lane Dual 3 to 4-Lane
Location Huizhou City Huizhou City Guangzhou City
Operation Date June 1993 December 1997 December 2010
Expiry Date 2023 2022 2035
Current Toll Rates RMB1 – RMB67 (Normal)
RMB0.12 / tonne / km
(Toll-by-weight vehicle)
N/A (Annual toll ticket system has
been implemented since January
2011)
RMB2 – RMB98 (Normal)
RMB0.12 / tonne / km
(Toll-by-weight vehicle)
Average Daily 2016 2015 2014 2016 2015 2014 2016 2015 2014
Traffic Flow 80,852 70,942 63,649 N/A N/A N/A 82,769 59,497 44,232
9. Hangzhou Ring Road
Attributable Interest 100%#
Form of Investment Equity
Length 103.4 km
Lanes Dual 2 to 3-Lane
Location Hangzhou City
Operation Date January 2005
Expiry Date 2029
Current Toll Rates RMB5 – RMB170 (Normal)
RMB0.09 / tonne / km (Toll-by-weight vehicle)
Average Daily Traffic Flow 2016 2015 201484,485 82,825 85,090
Zhejiang Province
7. Guangzhou City Nansha Port Expressway 8. Guangdong Unitoll Services Incorporated
Attributable Interest 22.5% 2%
Form of Investment Equity Equity
Length 72.4 km N/A
Lanes Dual 3 to 4-Lane N/A
Location Guangzhou City Guangzhou City
Operation Date December 2004 January 2013
Expiry Date 2030 N/A
Current Toll Rates RMB2 – RMB78 (Normal)
RMB0.12 / tonne / km (Toll-by-weight vehicle)
N/A
Average Daily 2016 2015 2014 2016 2015 2014
Traffic Flow 94,853 83,155 74,309 N/A N/A N/A
9
Suzhou Shanghai
Jiaxing
Shaoxing
Hangzhou
ZhejiangProvince
Ningbo
Hangzhou Xiaoshan International Airport
JiangsuProvince
Expressway
Roads
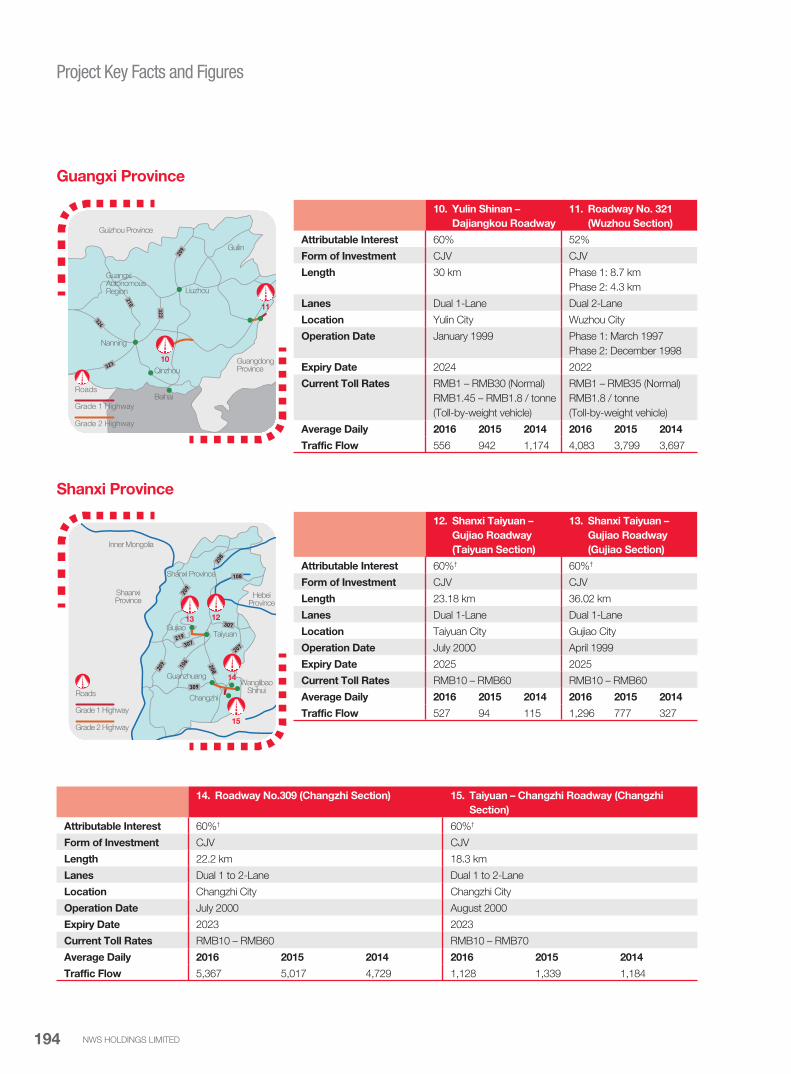
Project Key Facts and Figures
NWS HOLDINGS LIMITED194
10. Yulin Shinan –
Dajiangkou Roadway
11. Roadway No. 321
(Wuzhou Section)
Attributable Interest 60% 52%
Form of Investment CJV CJV
Length 30 km Phase 1: 8.7 km
Phase 2: 4.3 km
Lanes Dual 1-Lane Dual 2-Lane
Location Yulin City Wuzhou City
Operation Date January 1999 Phase 1: March 1997
Phase 2: December 1998
Expiry Date 2024 2022
Current Toll Rates RMB1 – RMB30 (Normal)
RMB1.45 – RMB1.8 / tonne
(Toll-by-weight vehicle)
RMB1 – RMB35 (Normal)
RMB1.8 / tonne
(Toll-by-weight vehicle)
Average Daily 2016 2015 2014 2016 2015 2014
Traffic Flow 556 942 1,174 4,083 3,799 3,697
12. Shanxi Taiyuan –
Gujiao Roadway
(Taiyuan Section)
13. Shanxi Taiyuan –
Gujiao Roadway
(Gujiao Section)
Attributable Interest 60%† 60%†
Form of Investment CJV CJV
Length 23.18 km 36.02 km
Lanes Dual 1-Lane Dual 1-Lane
Location Taiyuan City Gujiao City
Operation Date July 2000 April 1999
Expiry Date 2025 2025
Current Toll Rates RMB10 – RMB60 RMB10 – RMB60
Average Daily 2016 2015 2014 2016 2015 2014
Traffic Flow 527 94 115 1,296 777 327
Guangxi Province
Shanxi Province
14. Roadway No.309 (Changzhi Section) 15. Taiyuan – Changzhi Roadway (Changzhi
Section)
Attributable Interest 60%† 60%†
Form of Investment CJV CJV
Length 22.2 km 18.3 km
Lanes Dual 1 to 2-Lane Dual 1 to 2-Lane
Location Changzhi City Changzhi City
Operation Date July 2000 August 2000
Expiry Date 2023 2023
Current Toll Rates RMB10 – RMB60 RMB10 – RMB70
Average Daily 2016 2015 2014 2016 2015 2014
Traffic Flow 5,367 5,017 4,729 1,128 1,339 1,184
209
210
324
323
323
209
210
324
323
323
Grade 1 Highway
Roads
Grade 2 Highway
10
11
Guizhou Province
GuangxiAutonomousRegion
Nanning
Liuzhou
Guilin
GuangdongProvinceQinzhou
Beihai
108
307
207
309
307
208
209
208209 106
219
Grade 1 Highway
Roads
Grade 2 Highway
13 12
14
15
Inner Mongolia
ShaanxiProvince
Shanxi Province
GujiaoTaiyuan
Changzhi
GuanzhuangWanglibao
Shihui
HebeiProvince

Project Key Facts and Figures
ANNUAL REPORT 2016 195
16. Tangjin Expressway (Tianjin North Section)
Attributable Interest 60%*
Form of Investment CJV
Length Section 1: 43.45 km
Section 2: 17.22 km
Lanes Dual 3-Lane
Location Tianjin Municipality
Operation Date Section 1: December 1998
Section 2: December 2000
Expiry Date 2028
Current Toll Rates RMB5 – RMB105 (Normal)
RMB0.1 / tonne / km (Toll-by-weight vehicle)
Average Daily Traffic Flow 2016 2015 2014
46,999 35,568 29,954
17. Tate’s Cairn Tunnel
Attributable Interest 29.5%
Form of Investment Equity
Length 4 km
Lanes Dual 2-Lane
Location Hong Kong
Operation Date June 1991
Expiry Date 2018
Current Toll Rates HK$15 – HK$35
Average Daily Traffic Flow 2016 2015 2014
59,178 58,670 55,731
Tianjin Municipality
Hong Kong
# The Group contracted to increase its interest in Hangzhou Ring Road by 5% to 100% during the year. The directors of the Company considered the risks and rewards arising from the transaction have been passed to the Group and Hangzhou Ring Road was accounted for as a wholly owned subsidiary of the Group as at 30 June 2016. The transaction was legally completed in August 2016.
† Cash sharing ratio of 90% for the first 12 years from the operation date and thereafter 60%* Cash sharing ratio of 90% for the first 15 years from the operation date and thereafter 60%
Expressway
Roads
16
TianjinMunicipality
Hebei Province
Xingang
Tangshan
Expressway
Roads
17
New Territories
Mainland China
LantauIsland
Hong Kong
Kowloon
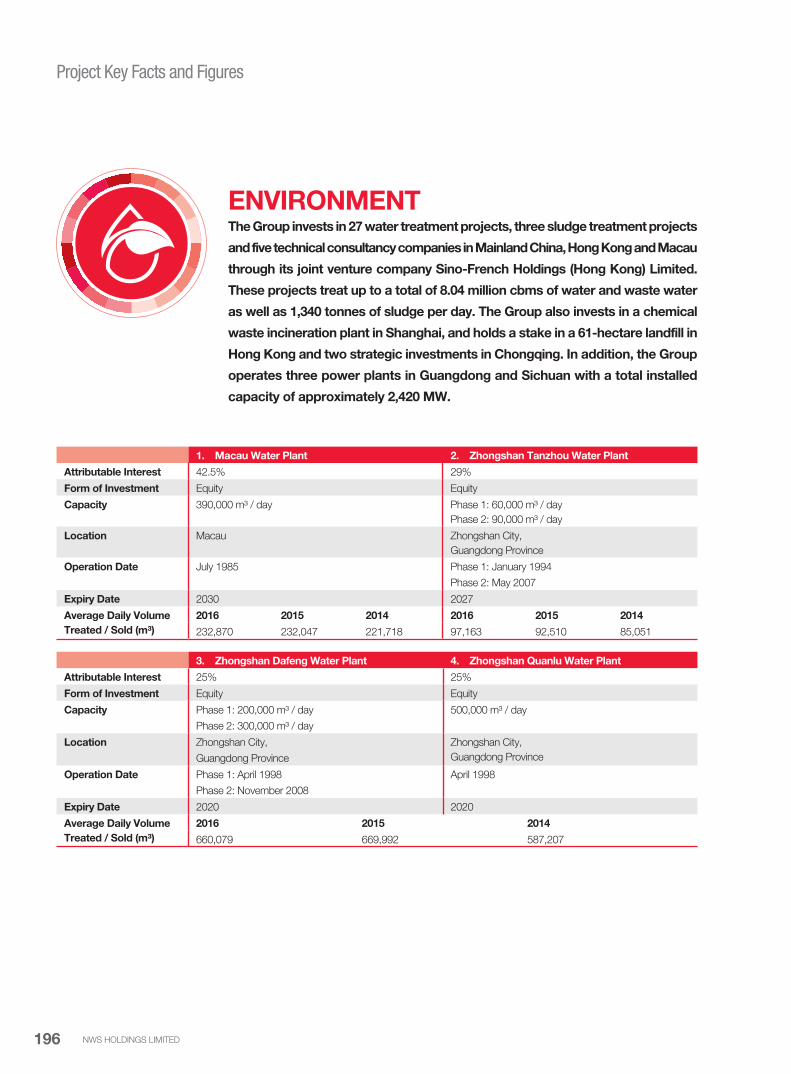
Project Key Facts and Figures
NWS HOLDINGS LIMITED196
ENVIRONMENTThe Group invests in 27 water treatment projects, three sludge treatment projects
and five technical consultancy companies in Mainland China, Hong Kong and Macau
through its joint venture company Sino-French Holdings (Hong Kong) Limited.
These projects treat up to a total of 8.04 million cbms of water and waste water
as well as 1,340 tonnes of sludge per day. The Group also invests in a chemical
waste incineration plant in Shanghai, and holds a stake in a 61-hectare landfill in
Hong Kong and two strategic investments in Chongqing. In addition, the Group
operates three power plants in Guangdong and Sichuan with a total installed
capacity of approximately 2,420 MW.
1. Macau Water Plant 2. Zhongshan Tanzhou Water Plant
Attributable Interest 42.5% 29%
Form of Investment Equity Equity
Capacity 390,000 m³ / day Phase 1: 60,000 m³ / day
Phase 2: 90,000 m³ / day
Location Macau Zhongshan City,
Guangdong Province
Operation Date July 1985 Phase 1: January 1994
Phase 2: May 2007
Expiry Date 2030 2027
Average Daily Volume
Treated / Sold (m³)
2016 2015 2014 2016 2015 2014
232,870 232,047 221,718 97,163 92,510 85,051
3. Zhongshan Dafeng Water Plant 4. Zhongshan Quanlu Water Plant
Attributable Interest 25% 25%
Form of Investment Equity Equity
Capacity Phase 1: 200,000 m³ / day
Phase 2: 300,000 m³ / day
500,000 m³ / day
Location Zhongshan City,
Guangdong Province
Zhongshan City,
Guangdong Province
Operation Date Phase 1: April 1998
Phase 2: November 2008
April 1998
Expiry Date 2020 2020
Average Daily Volume
Treated / Sold (m³)
2016 2015 2014
660,079 669,992 587,207

Project Key Facts and Figures
ANNUAL REPORT 2016 197
5. Baoding Water Plant 6. Zhengzhou Water Plant
Attributable Interest 27.5% 25%
Form of Investment Equity Equity
Capacity 260,000 m³ / day 360,000 m³ / day
Location Baoding City, Hebei Province Zhengzhou City, Henan Province
Operation Date June 2000 August 2001
Expiry Date 2020 2031
Average Daily Volume
Treated / Sold (m³)
2016 2015 2014 2016 2015 2014
234,000 234,000 236,978 256,685 272,099 274,068
7. Panjin Water Plant 8. Changtu Water Plant
Attributable Interest 30% 35%
Form of Investment Equity Equity
Capacity 110,000 m³ / day 50,000 m³ / day
Location Panjin City, Liaoning Province Tieling City, Liaoning Province
Operation Date April 2002 December 2000
Expiry Date 2032 2029
Average Daily Volume
Treated / Sold (m³)
2016 2015 2014 2016 2015 2014
93,000 93,000 93,952 26,790 26,956 25,966
9. Dalian Changxing Island Environmental
Services Company
10. Shanghai Spark Water Plant
Attributable Interest 47.5% 25%
Form of Investment Equity Equity
Capacity Waste Water (O&M^): 40,000 m³ / day 100,000 m³ / day
Location Dalian City, Liaoning Province Shanghai Municipality
Operation Date June 2010 January 2002
Expiry Date 2040 2031
Average Daily Volume
Treated / Sold (m³)
2016 2015 2014 2016 2015 2014
9,401 8,152 9,583 42,152 42,519 47,239
11. Shanghai SCIP Water Treatment Plants
Attributable Interest 25%
Form of Investment Equity
Capacity Waste Water: 50,000 m³ / day
Industrial Water: 200,000 m³ / day
Demineralized Water: 4,800 m³ / day
Location Shanghai Municipality
Operation Date Waste Water & Industrial Water: April 2005
Demineralized Water: February 2008
Expiry Date 2052
Average Daily Volume
Treated / Sold (m³)
2016 2015 2014
Waste Water: 64,066 63,074 54,753
Industrial Water: 148,905 143,129 128,522
Demineralized Water: 2,276 2,243 1,643

Project Key Facts and Figures
NWS HOLDINGS LIMITED198
12. Sino French Water
Environmental Technology
Consulting Company
13. Qingdao Water Plant 14. Qingdao Dongjiakou Waste
Water Plant
Attributable Interest 50% 25% 16.25%
Form of Investment Equity Equity Equity
Capacity Waste Water (O&M^): 10,000 m³ / day Phase 1: 543,000 m³ / day
Phase 2: 183,000 m³ / day
13,200 m³ / day
Location Shanghai Municipality Qingdao City, Shandong Province Qingdao City, Shandong Province
Operation Date October 2009 Phase 1: August 2002
Phase 2: September 2006
January 2016
Expiry Date 2039 2027 2042
Average Daily Volume
Treated / Sold (m³)
2016 2015 2014 2016 2015 2014 2016 2015 2014
9,743 7,255 5,885 674,483 603,896 622,756 12,718 N/A N/A
15. Sanya Water Plant 16. Nanchang Water Plant
Attributable Interest 25% 25%
Form of Investment Equity Equity
Capacity Phase 1: 235,000 m³ / day
Phase 2: 75,000 m³ / day
Phase 1: 50,000 m³ / day
Phase 2: 50,000 m³ / day
Location Sanya City, Hainan Province Nanchang City, Jiangxi Province
Operation Date Phase 1: January 2004
Phase 2: 1st half of 2017 (Estimate)
Phase 1: January 1996
Phase 2: September 2008
Expiry Date 2033 2023
Average Daily Volume
Treated / Sold (m³)
2016 2015 2014 2016 2015 2014
253,357 260,622 248,528 88,659 88,508 90,002
17. Chengdu Shuangliu Dayi Water Company 18. Chengdu Chongzhou Dayi Waste
Water Plant
Attributable Interest 32.5% 32.5%
Form of Investment Equity Equity
Capacity Waste Water: 19,800 m³ / day
Waste Water (O&M^): 15,350 m³ / day
40,000 m³ / day
Location Chengdu City, Sichuan Province Chengdu City, Sichuan Province
Operation Date Waste Water: February 2012
Waste Water (O&M^): January 2010
April 2008
Expiry Date 2043 2039
Average Daily Volume
Treated / Sold (m³)
2016 2015 2014 2016 2015 2014
Waste Water: 15,840 15,840 16,652 28,000 28,126 28,000
Waste Water (O&M^): 1,162 7,635 10,251

Project Key Facts and Figures
ANNUAL REPORT 2016 199
19. Sichuan Water Fund 20. Chongqing Water Plant 21. Chongqing Tangjiatuo Waste
Water Plant
Attributable Interest 17.46% 27.70% 28.14%
Form of Investment Equity Equity Equity
Capacity N/A Phase 1: 380,000 m³ / day
Phase 2: 160,000 m³ / day
Phase 3: 200,000 m³ / day
Phase 4: 200,000 m³ / day
Phase 1: 300,000 m³ / day
Phase 2: 100,000 m³ / day
Location Chengdu City, Sichuan Province Chongqing Municipality Chongqing Municipality
Operation Date November 2014 Phase 1: November 2002
Phase 2: July 2006
Phase 3: July 2011
Phase 4: July 2015
Phase 1: January 2007
Phase 2: January 2015
Expiry Date 2019 2052 2036
Average Daily Volume
Treated / Sold (m³)
N/A 2016 2015 2014 2016 2015 2014
587,894 555,378 520,850 436,371 422,046 415,267
22. Chongqing Construction Company 23. Chongqing CCIP Water Treatment Plants
Attributable Interest 20.33%* 25.33%
Form of Investment Equity Equity
Capacity Sludge Treatment: 240 tonnes / day Waste Water: 40,000 m³ / day
Industrial Water: 120,000 m³ / day
Location Chongqing Municipality Chongqing Municipality
Operation Date Sludge Treatment: 2nd half of 2016 (Estimate) March 2010
Expiry Date 2038 2055
Average Daily Volume
Treated / Sold (m³)
2016 2015 2014 2016 2015 2014
Sludge Treatment: N/A N/A N/A Waste Water: 26,273 24,254 21,783
Industrial Water: 32,440 33,089 29,504
24. Chongqing Environmental R&D Centre 25. Wuhan Chemical Industry Park Water
Treatment Plants
Attributable Interest 15.64% 21.5%
Form of Investment Equity Equity
Capacity N/A Waste Water: 10,000 m³ / day
Industrial Water: 50,000 m³ / day
Location Chongqing Municipality Wuhan City, Hubei Province
Operation Date November 2013 Waste Water: December 2013
Industrial Water: September 2013
Expiry Date 2043 2041
Average Daily Volume
Treated / Sold (m³)
N/A 2016 2015 2014
Waste Water: 1,350 726 401
Industrial Water: 4,369 1,479 478
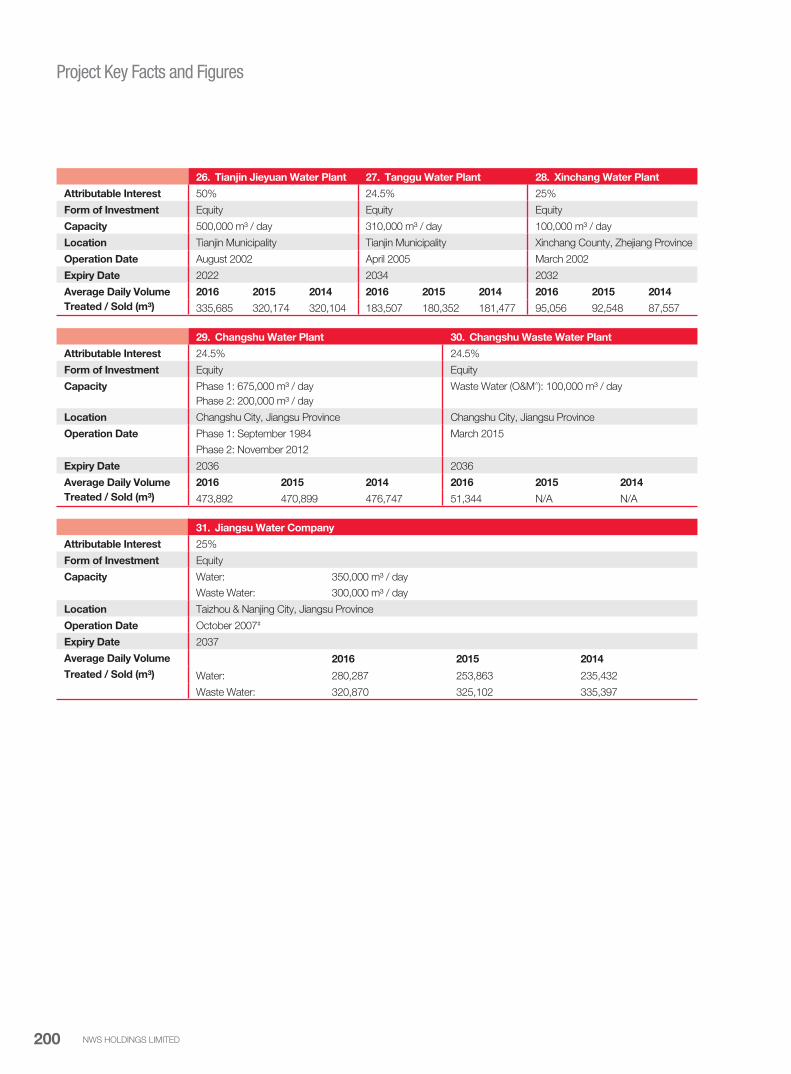
Project Key Facts and Figures
NWS HOLDINGS LIMITED200
26. Tianjin Jieyuan Water Plant 27. Tanggu Water Plant 28. Xinchang Water Plant
Attributable Interest 50% 24.5% 25%
Form of Investment Equity Equity Equity
Capacity 500,000 m³ / day 310,000 m³ / day 100,000 m³ / day
Location Tianjin Municipality Tianjin Municipality Xinchang County, Zhejiang Province
Operation Date August 2002 April 2005 March 2002
Expiry Date 2022 2034 2032
Average Daily Volume
Treated / Sold (m³)
2016 2015 2014 2016 2015 2014 2016 2015 2014
335,685 320,174 320,104 183,507 180,352 181,477 95,056 92,548 87,557
29. Changshu Water Plant 30. Changshu Waste Water Plant
Attributable Interest 24.5% 24.5%
Form of Investment Equity Equity
Capacity Phase 1: 675,000 m³ / day
Phase 2: 200,000 m³ / day
Waste Water (O&M^): 100,000 m³ / day
Location Changshu City, Jiangsu Province Changshu City, Jiangsu Province
Operation Date Phase 1: September 1984
Phase 2: November 2012
March 2015
Expiry Date 2036 2036
Average Daily Volume
Treated / Sold (m³)
2016 2015 2014 2016 2015 2014
473,892 470,899 476,747 51,344 N/A N/A
31. Jiangsu Water Company
Attributable Interest 25%
Form of Investment Equity
Capacity Water: 350,000 m³ / day
Waste Water: 300,000 m³ / day
Location Taizhou & Nanjing City, Jiangsu Province
Operation Date October 2007#
Expiry Date 2037
Average Daily Volume
Treated / Sold (m³)
2016 2015 2014
Water: 280,287 253,863 235,432
Waste Water: 320,870 325,102 335,397
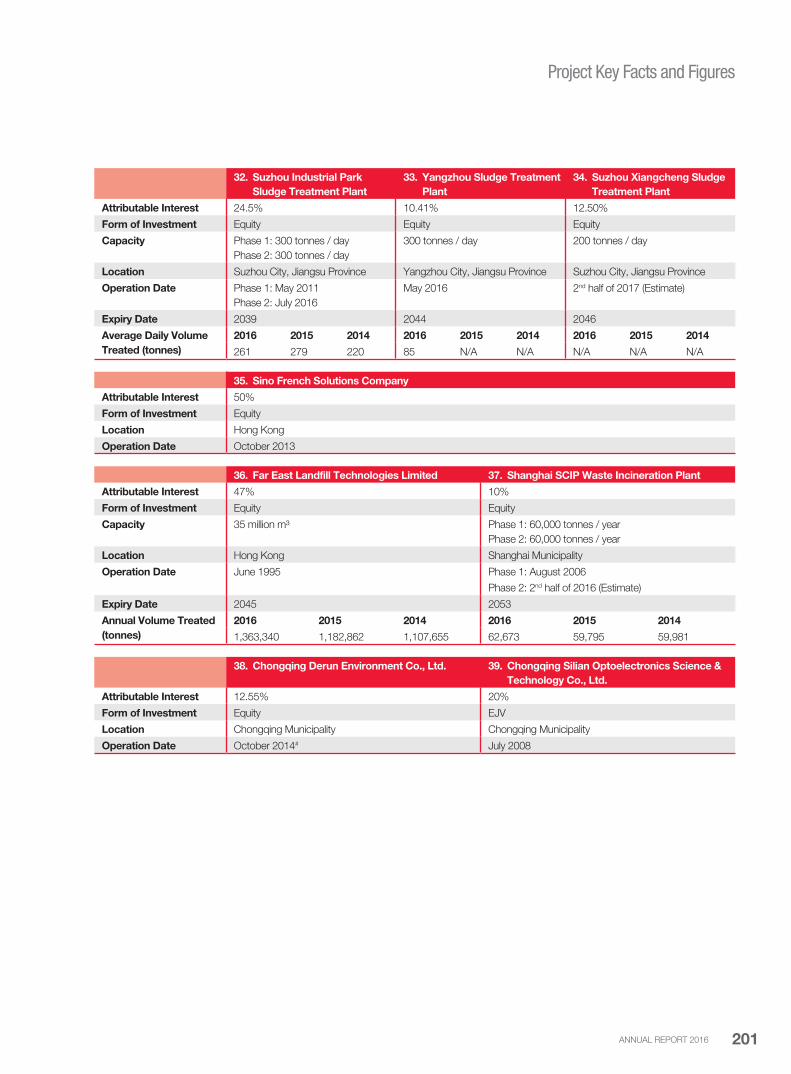
Project Key Facts and Figures
ANNUAL REPORT 2016 201
32. Suzhou Industrial Park
Sludge Treatment Plant
33. Yangzhou Sludge Treatment
Plant
34. Suzhou Xiangcheng Sludge
Treatment Plant
Attributable Interest 24.5% 10.41% 12.50%
Form of Investment Equity Equity Equity
Capacity Phase 1: 300 tonnes / day
Phase 2: 300 tonnes / day
300 tonnes / day 200 tonnes / day
Location Suzhou City, Jiangsu Province Yangzhou City, Jiangsu Province Suzhou City, Jiangsu Province
Operation Date Phase 1: May 2011
Phase 2: July 2016
May 2016 2nd half of 2017 (Estimate)
Expiry Date 2039 2044 2046
Average Daily Volume
Treated (tonnes)
2016 2015 2014 2016 2015 2014 2016 2015 2014
261 279 220 85 N/A N/A N/A N/A N/A
35. Sino French Solutions Company
Attributable Interest 50%
Form of Investment Equity
Location Hong Kong
Operation Date October 2013
36. Far East Landfill Technologies Limited 37. Shanghai SCIP Waste Incineration Plant
Attributable Interest 47% 10%
Form of Investment Equity Equity
Capacity 35 million m³ Phase 1: 60,000 tonnes / year
Phase 2: 60,000 tonnes / year
Location Hong Kong Shanghai Municipality
Operation Date June 1995 Phase 1: August 2006
Phase 2: 2nd half of 2016 (Estimate)
Expiry Date 2045 2053
Annual Volume Treated
(tonnes)
2016 2015 2014 2016 2015 2014
1,363,340 1,182,862 1,107,655 62,673 59,795 59,981
38. Chongqing Derun Environment Co., Ltd. 39. Chongqing Silian Optoelectronics Science &
Technology Co., Ltd.
Attributable Interest 12.55% 20%
Form of Investment Equity EJV
Location Chongqing Municipality Chongqing Municipality
Operation Date October 2014# July 2008

Project Key Facts and Figures
NWS HOLDINGS LIMITED202
40. Zhujiang Power Station - Phase I 41. Zhujiang Power Station - Phase II
Attributable Interest 50% 25%
Form of Investment EJV EJV
Installed Capacity 600 MW 620 MW
Location Guangzhou City, Guangdong Province Guangzhou City, Guangdong Province
Type of Power Coal-Fired Thermal Coal-Fired Thermal
Operation Date January 1994 April 1996
Expiry Date 2017 2020
Electricity Sales (GWh) 2016 2015 2014 2016 2015 2014
1,916 2,437 2,918 2,089 2,777 2,569
42. Chengdu Jintang Power Plant
Attributable Interest 35%
Form of Investment Equity
Installed Capacity 1,200 MW
Location Chengdu CIty, Sichuan Province
Type of Power Coal-Fired Thermal
Operation Date June 2007
Expiry Date 2040
Electricity Sales (GWh) 2016 2015 2014
3,128 4,557 5,660
43. Guangzhou Fuel Company
Attributable Interest 35%
Form of Investment EJV
Coal Pier Handling
Capacity
7 million tonnes / year
Location Guangzhou City, Guangdong Province
Nature of Business Wholesale, assembling and storage of coal
Operation Date January 2008
Expiry Date 2033
^ O&M stands for operation and management consultancy services* To restructure the water projects in Chongqing, the Group’s interest in Chongqing Construction Company was injected into Chongqing Tangjiatuo Waste Water
Plant in September 2016# Date of incorporation

Project Key Facts and Figures
ANNUAL REPORT 2016 203
LOGISTICSThrough its joint venture, China United International Rail Containers Co., Limited,
the Group develops and operates a large-scale pivotal rail container terminal
network across Mainland China. The Group also invests in two logistics centres
in Hong Kong that offer a total leasable area of 6.82 million sq ft, and three port
projects in Mainland China with an aggregate container handling capacity of
12 million TEUs per year.
1. China United International Rail Containers Co., Limited
Attributable Interest 30%
Form of Investment EJV
Investment Scope Pivotal rail container terminal network
Locations Kunming, Chongqing, Chengdu, Zhengzhou, Dalian, Qingdao, Wuhan, Xian
Operation Date Kunming: January 2008
Chongqing: December 2009
Chengdu: March 2010
Zhengzhou: April 2010
Dalian: July 2010
Qingdao: August 2010
Wuhan: August 2010
Xian: December 2010
Expiry Date 2057
Throughput Achieved
(TEUs)
2016 2015 2014
2,062,000 1,817,000 1,618,000
2. ATL Logistics Centre 3. NWS Kwai Chung Logistics Centre
Attributable Interest 56% 100%#
Form of Investment Equity Equity
Leasable Area 5.9 million sq ft 920,000 sq ft
Location Hong Kong Hong Kong
Operation Date Phase 1: February 1987
Phase 2: March 1988
Phase 3: February 1992
Phase 4: January 1994
Phase 5: November 1994
December 2011
Expiry Date 2047 2058
Average Occupancy
Rate
2016 2015 2014 2016 2015 2014
97.4% 99.5% 98.8% 100% 100% 100%
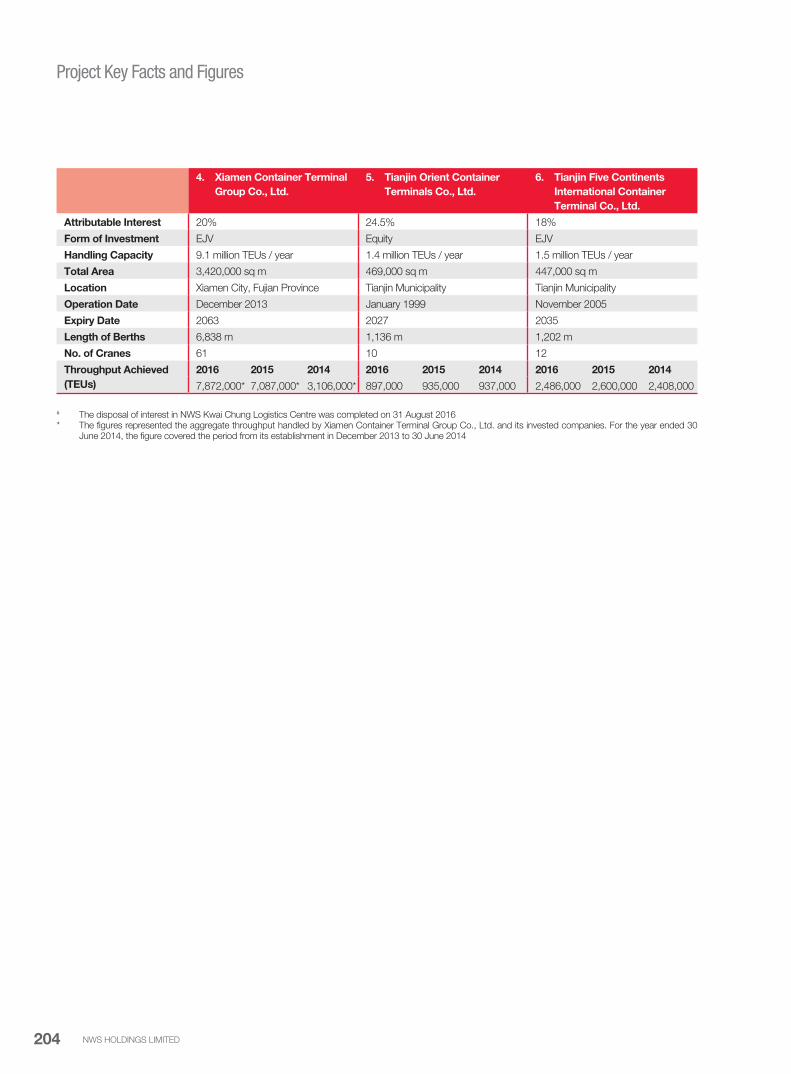
Project Key Facts and Figures
NWS HOLDINGS LIMITED204
4. Xiamen Container Terminal
Group Co., Ltd.
5. Tianjin Orient Container
Terminals Co., Ltd.
6. Tianjin Five Continents
International Container
Terminal Co., Ltd.
Attributable Interest 20% 24.5% 18%
Form of Investment EJV Equity EJV
Handling Capacity 9.1 million TEUs / year 1.4 million TEUs / year 1.5 million TEUs / year
Total Area 3,420,000 sq m 469,000 sq m 447,000 sq m
Location Xiamen City, Fujian Province Tianjin Municipality Tianjin Municipality
Operation Date December 2013 January 1999 November 2005
Expiry Date 2063 2027 2035
Length of Berths 6,838 m 1,136 m 1,202 m
No. of Cranes 61 10 12
Throughput Achieved
(TEUs)
2016 2015 2014 2016 2015 2014 2016 2015 2014
7,872,000* 7,087,000* 3,106,000* 897,000 935,000 937,000 2,486,000 2,600,000 2,408,000
# The disposal of interest in NWS Kwai Chung Logistics Centre was completed on 31 August 2016* The figures represented the aggregate throughput handled by Xiamen Container Terminal Group Co., Ltd. and its invested companies. For the year ended 30
June 2014, the figure covered the period from its establishment in December 2013 to 30 June 2014

Project Key Facts and Figures
ANNUAL REPORT 2016 205
AVIATIONThe Group has invested in Beijing Capital International Airport, the second busiest
airport in the world in terms of passenger throughput. The Group’s Goshawk
Aviation Limited and Bauhinia Aviation Capital Limited invest in commercial
aircraft for leasing to worldwide airline operators.
1. Beijing Capital International Airport Co., Ltd.
Attributable Interest 10.35%
Form of Investment Equity
Facility 3 runways & 3 terminals (total floor area: 1.41 million sq m)
Location Beijing Municipality
Operation Date October 1999#
Passenger Throughput
Aircraft Movements
2016 2015 2014
91,462,000 88,620,000 44,121,000*
597,000 589,000 302,000*
2. Goshawk Aviation Limited
Attributable Interest 40%
Form of Investment Equity
Operation Date October 2013#
No. of Aircraft 2016 2015 2014
68 40 N/A†
3. Bauhinia Aviation Capital Limited
Attributable Interest 40%
Form of Investment Equity
Operation Date March 2016
No. of Aircraft 2016 2015 2014
– N/A N/A
# Date of incorporation* The figures covered the period from the acquisition in December 2013 to 30 June 2014† No comparative figures as the investment was acquired in February 2015
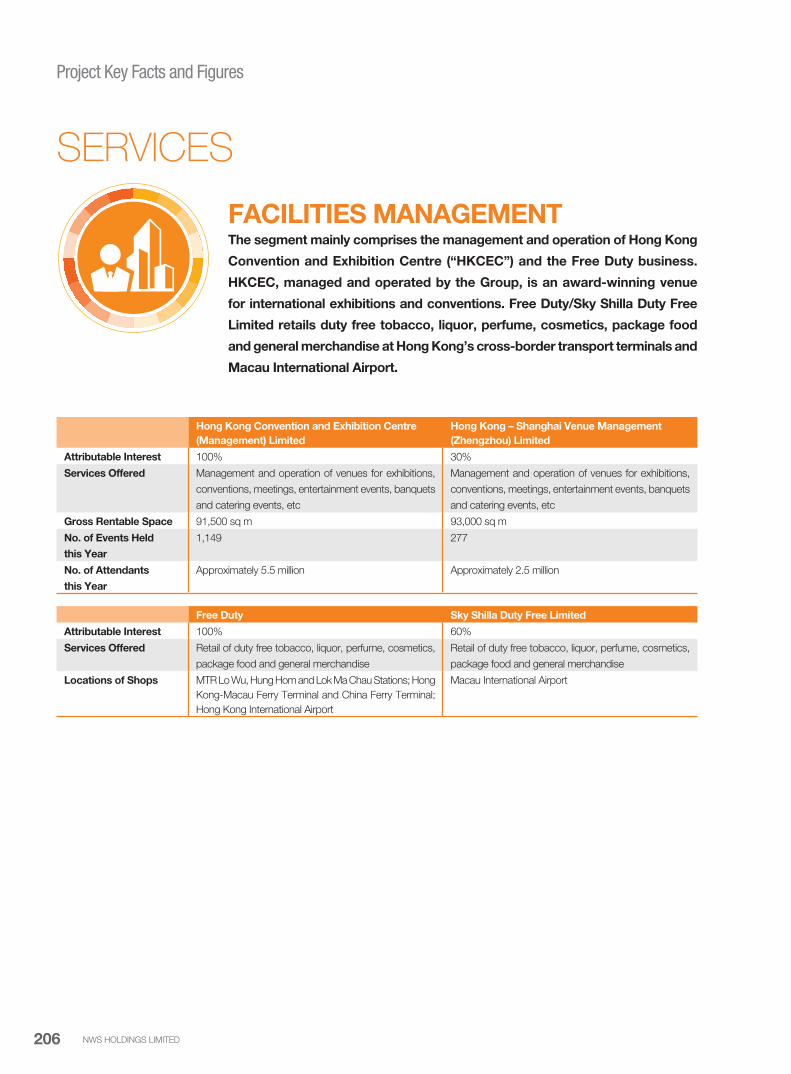
Project Key Facts and Figures
NWS HOLDINGS LIMITED206
FACILITIES MANAGEMENTThe segment mainly comprises the management and operation of Hong Kong
Convention and Exhibition Centre (“HKCEC”) and the Free Duty business.
HKCEC, managed and operated by the Group, is an award-winning venue
for international exhibitions and conventions. Free Duty/Sky Shilla Duty Free
Limited retails duty free tobacco, liquor, perfume, cosmetics, package food
and general merchandise at Hong Kong’s cross-border transport terminals and
Macau International Airport.
Hong Kong Convention and Exhibition Centre
(Management) Limited
Hong Kong – Shanghai Venue Management
(Zhengzhou) Limited
Attributable Interest 100% 30%
Services Offered Management and operation of venues for exhibitions,
conventions, meetings, entertainment events, banquets
and catering events, etc
Management and operation of venues for exhibitions,
conventions, meetings, entertainment events, banquets
and catering events, etc
Gross Rentable Space 91,500 sq m 93,000 sq m
No. of Events Held
this Year
1,149 277
No. of Attendants
this Year
Approximately 5.5 million Approximately 2.5 million
Free Duty Sky Shilla Duty Free Limited
Attributable Interest 100% 60%
Services Offered Retail of duty free tobacco, liquor, perfume, cosmetics,
package food and general merchandise
Retail of duty free tobacco, liquor, perfume, cosmetics,
package food and general merchandise
Locations of Shops MTR Lo Wu, Hung Hom and Lok Ma Chau Stations; Hong
Kong-Macau Ferry Terminal and China Ferry Terminal;
Hong Kong International Airport
Macau International Airport
SERVICES

Project Key Facts and Figures
ANNUAL REPORT 2016 207
CONSTRUCTION & TRANSPORTWith abundant experience in constructing large-scale projects, the Group
provides professional construction services in Hong Kong. The Group is also
dedicated to providing reliable public transport services, including bus and ferry
services in Hong Kong.
Hip Hing Construction Company Limited New World Construction Company Limited
Attributable Interest 100% 100%
Services Offered General contracting, construction management and civil
engineering works
General contracting and construction management
Total Value of Contracts
Awarded this Year
HK$8.8 billion HK$0.8 billion
Value of Contracts
on Hand
HK$33.3 billion (remaining value of works to be completed:
HK$18.3 billion)
HK$36.4 billion (remaining value of works to be completed:
HK$20.3 billion)
Major Projects West Kowloon Government Offices; Xiqu Centre at West
Kowloon Cultural District; Gleneagles Hong Kong Hospital
at Wong Chuk Hang; Kerry Hotel Hong Kong at Hung
Hom; Phase Two Expansion of Cathay Pacific’s Catering
Services Facility at Chek Lap Kok; Residential Development at
Tsuen Wan West Station TW6 for New World Development
and Vanke; Residential Development “Double Cove” for
New World Development; “One HarbourGate” at Hung
Hom and Residential and Commercial Development at
Tseung Kwan O Area 65C1 for Wheelock Properties;
Goldin Financial Global Centre at Kowloon Bay for Goldin
Group; Composite Development at Tseung Kwan O,
Town Lot No. 95, for Strongly International Limited; Urban
Renewal Project at Sham Shui Po for Hong Kong Housing
Society; Public Rental Housing Development at former
Kwai Chung Police Married Quarters, Home Ownership
Scheme Development at Tin Shui Wai and Mui Wo for
Hong Kong Housing Authority
Renovation of Discovery Park Shopping Mall at Tsuen
Wan; Clear Water Bay Residential Development at Sai
Kung; New World Centre Remodeling at Tsim Sha Tsui;
Residential Development at South Lane, Sai Wan; Residential
Development at Tong Yan San Tsuen Lot 2139, Yuen
Long; Sai Yee Street Development at Mongkok; New
Eastern Terrace Residential Development at Tin Hau;
Palace Mall Remodeling at Tsim Sha Tsui; Residential
Development at Des Voeux Road West; Residential
Development at Sai Yuen Lane; Office Redevelopment
at King’s Road; Avenue of Stars Revitalization at Tsim
Sha Tsui; Tai Wai Station Development (Advance Work);
Residential Development at Tuen Mun Heung Sze Wui
Road; Residential Development at 420-422 Prince
Edward Road West
New World First Ferry Services
Limited
Citybus Limited New World First Bus Services
Limited
Attributable Interest 50% 50% 50%
Services Offered Ferry services of outlying and inner
harbour routes
Franchised bus services in
Hong Kong
Franchised bus services in
Hong Kong
Fleet Size 16 owned vessels and 3 chartered
vessels
938 buses 709 buses
No. of Routes 5 105 87
Average Daily Patronage 40,000 627,000 461,000
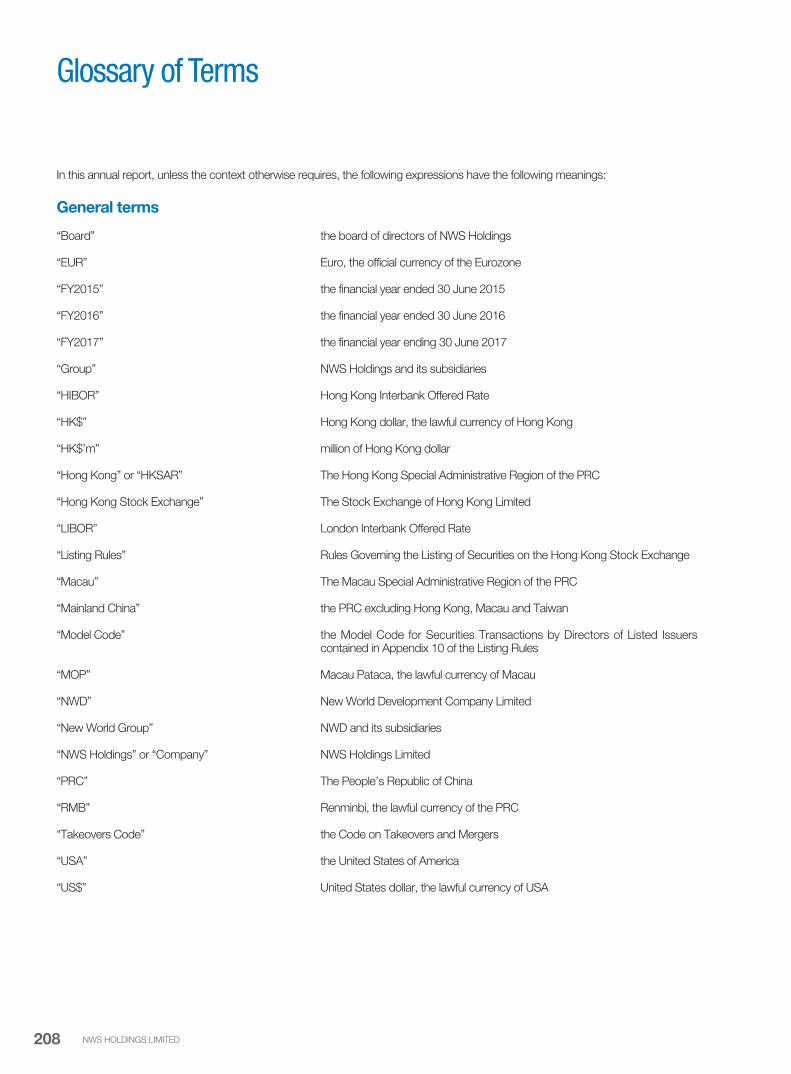
Glossary of Terms
NWS HOLDINGS LIMITED208
In this annual report, unless the context otherwise requires, the following expressions have the following meanings:
General terms
“Board” the board of directors of NWS Holdings
“EUR” Euro, the official currency of the Eurozone
“FY2015” the financial year ended 30 June 2015
“FY2016” the financial year ended 30 June 2016
“FY2017” the financial year ending 30 June 2017
“Group” NWS Holdings and its subsidiaries
“HIBOR” Hong Kong Interbank Offered Rate
“HK$” Hong Kong dollar, the lawful currency of Hong Kong
“HK$’m” million of Hong Kong dollar
“Hong Kong” or “HKSAR” The Hong Kong Special Administrative Region of the PRC
“Hong Kong Stock Exchange” The Stock Exchange of Hong Kong Limited
“LIBOR” London Interbank Offered Rate
“Listing Rules” Rules Governing the Listing of Securities on the Hong Kong Stock Exchange
“Macau” The Macau Special Administrative Region of the PRC
“Mainland China” the PRC excluding Hong Kong, Macau and Taiwan
“Model Code” the Model Code for Securities Transactions by Directors of Listed Issuers contained in Appendix 10 of the Listing Rules
“MOP” Macau Pataca, the lawful currency of Macau
“NWD” New World Development Company Limited
“New World Group” NWD and its subsidiaries
“NWS Holdings” or “Company” NWS Holdings Limited
“PRC” The People’s Republic of China
“RMB” Renminbi, the lawful currency of the PRC
“Takeovers Code” the Code on Takeovers and Mergers
“USA” the United States of America
“US$” United States dollar, the lawful currency of USA

Glossary of Terms
ANNUAL REPORT 2016 209
Technical terms
“cbm(s)” or “m3” cubic metre(s)
“CJV” co-operative joint venture company
“EJV” equity joint venture company
“ft” foot (feet)
“GWh” gigawatt-hour, equals to 1,000,000 kilowatt-hours
“km” kilometre(s)
“MW” megawatt(s), equals to 1,000 kilowatts
“sq ft” square foot (feet)
“sq km” square kilometre(s)
“sq m” square metre(s)
“TEU(s)” twenty-foot equivalent unit(s), a standard measurement unit of a container. It is based on the dimensions of a container 20 feet long by 8 feet wide by 8.5 feet high with an average load of approximately nine tonnes
“tonne(s)” equal to 1,000 kilograms
Financial terms
“Attributable operating profit” or “AOP” profit available for appropriation before corporate office and non-operating items
“Dividend Payout Ratio” dividends
profit attributable to shareholders of the Company
“Basic Earnings per Share” profit attributable to shareholders of the Company
weighted average number of shares in issue during the year
“EBIT” earnings before interests and tax expenses
“Net Gearing Ratio” Net Debt
total equity
“Net Assets” total assets less total liabilities
“Net Assets per Share” Net Assets
number of issued shares at the end of the year
“Net Debt” Total Debt less cash and bank balances and short-term deposits
“Return on Capital Employed” profit for the year
total equity + non-current liabilities
“Return on Equity” profit for the year
total equity
“Total Debt” the aggregate of bank loans, other loans, overdrafts and finance leases
Corporate Information
Board of DirectorsExecutive DirectorsDr Cheng Kar Shun, Henry (Chairman)
Mr Tsang Yam Pui (Chief Executive Officer)
Mr Hui Hon Chung (Deputy Chief Executive Officer)
Mr Cheung Chin Cheung
Mr Cheng Chi Ming, Brian
Non-executive DirectorsMr To Hin Tsun, Gerald
Mr Dominic Lai
Mr Lam Wai Hon, Patrick
Mr William Junior Guilherme Doo
Independent Non-executive DirectorsMr Kwong Che Keung, Gordon
Dr Cheng Wai Chee, Christopher
The Honourable Shek Lai Him, Abraham
Mr Lee Yiu Kwong, Alan
Mrs Oei Fung Wai Chi, Grace
Board CommitteesExecutive CommitteeDr Cheng Kar Shun, Henry (Chairman)
Mr Tsang Yam Pui
Mr Hui Hon Chung
Mr Cheung Chin Cheung
Mr Cheng Chi Ming, Brian
Audit CommitteeMr Kwong Che Keung, Gordon (Chairman)
Mr Dominic Lai
Dr Cheng Wai Chee, Christopher
The Honourable Shek Lai Him, Abraham
Mr Lee Yiu Kwong, Alan
Remuneration CommitteeThe Honourable Shek Lai Him, Abraham (Chairman)
Mr Tsang Yam Pui
Mr Kwong Che Keung, Gordon
Dr Cheng Wai Chee, Christopher
Nomination CommitteeDr Cheng Kar Shun, Henry (Chairman)
Mr Tsang Yam Pui
Mr Kwong Che Keung, Gordon
Dr Cheng Wai Chee, Christopher
The Honourable Shek Lai Him, Abraham
Corporate Social Responsibility CommitteeMr Tsang Yam Pui (Chairman)
Mr Hui Hon Chung
Mr Cheung Chin Cheung
Mr Cheng Chi Ming, Brian
Mr Dominic Lai
Mr Lam Wai Hon, Patrick
Mr William Junior Guilherme Doo
Mr Lee Yiu Kwong, Alan
Mrs Oei Fung Wai Chi, Grace
Ms Lam Yuet Wan, Elina
Ms Tang Cheung Yi
Company SecretaryMr Chow Tak Wing
Registered OfficeClarendon House
2 Church Street, Hamilton HM 11
Bermuda
Head Office and Principal Place ofBusiness28/F, New World Tower
18 Queen’s Road Central
Hong Kong
Principal Share Registrar andTransfer OfficeMUFG Fund Services (Bermuda) Limited
The Belvedere Building
69 Pitts Bay Road
Pembroke HM08
Bermuda
Branch Share Registrar andTransfer Office in Hong KongTricor Standard Limited
Level 22, Hopewell Centre
183 Queen’s Road East
Hong Kong
AuditorPricewaterhouseCoopers
Certified Public Accountants
22/F, Prince’s Building, Central
Hong Kong
Principal BankersBank of America, N.A. Hong Kong Branch
Bank of China (Hong Kong) Limited
Bank of Communications Co., Ltd. Hong Kong Branch
BNP Paribas Hong Kong Branch
China Construction Bank (Asia) Corporation Limited
Crédit Agricole Corporate & Investment Bank
DBS Bank Ltd. Hong Kong Branch
Mizuho Bank, Ltd. Hong Kong Branch
Nanyang Commercial Bank, Limited
Oversea-Chinese Banking Corporation Limited
Scotiabank (Hong Kong) Limited
Standard Chartered Bank (Hong Kong) Limited
The Bank of Tokyo – Mitsubishi UFJ, Ltd. Hong Kong Branch
The Hongkong and Shanghai Banking Corporation Limited
Websitewww.nws.com.hk
NWS HOLDINGS LIMITED210
Where the English and the Chinese texts
conflict, the English text prevails.
This annual report is also available at
www.nws.com.hk.
©NWS Holdings Limited 2016
Concept, d
esi
gn a
nd p
rintin
g: E
QU
ITY
FIN
AN
CIA
L P
RE
SS
LIM
ITE
D. W
ebsi
te: w
ww
.equity
gro
up.c
om
.hk
NWS Holdings Limited takes every practicable measure to conserve resources and minimize waste.This annual report is printed on FSC™ certified paper using chemistry free plate system and soy ink.The FSC™ logo identifies product group from responsible forestry in accordance with the rules of the Forest Stewardship Council®.
NWS Holdings Limited(incorporated in Bermuda with limited liability)
28/F New World Tower
18 Queen’s Road Central
Central, Hong Kong
Tel : (852) 2131 0600
Fax : (852) 2131 0611
E-mail : [email protected]
www.nws.com.hk