NW Washington Case Study: The Economic Impact … a significant net present value. ... –Apples to...
17
NW Washington Case Study: The Economic Impact of $1 Spent on Community Energy Efficiency Alex Ramel Energy and Policy Director Sustainable Connections Graham Marmion Recent graduate, Western Washington University Economics and Energy Policy
Transcript of NW Washington Case Study: The Economic Impact … a significant net present value. ... –Apples to...

NW Washington Case Study: The Economic Impact of $1 Spent on Community Energy Efficiency
Alex RamelEnergy and Policy Director
Sustainable Connections
Graham MarmionRecent graduate,
Western Washington University
Economics and Energy Policy
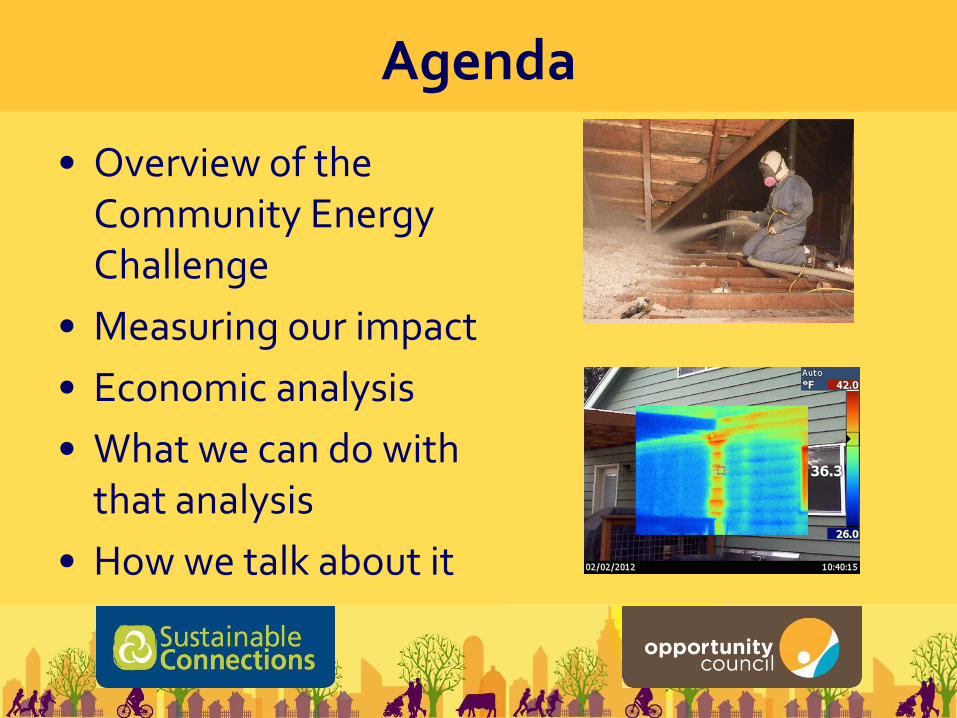
Agenda
• Overview of the Community Energy Challenge
• Measuring our impact
• Economic analysis
• What we can do with that analysis
• How we talk about it

Community Energy Challenge
Making energy efficiency, accessible, affordable, and attractive by creating a One Stop Shop for Energy
Efficiency in Northwest Washington

Overview the CEC process

Results to Date: Residential Retrofits
Since 2010:
• 1542 Home Energy Assessments Complete
• 1148 completed energy efficiency projects in 881 homes
• Average 23% energy savings ($470/year) at a total cost of $6,662/project.

Results to Date: Business Retrofits
• Since 2010:
– 404 business assessments
– 179 major energy projects at
115 businesses

Results from Customer Satisfaction Survey
How likely are you to recommend the Community Energy Challenge program to others?
Already have
Definitely will
Probably will
Probably will not
Definitely will not
Don't know
N=287
94% of customers already have or will recommend the CEC to others

Results to Date
• Energy savings of over $649,000/year
• Equivalent to taking 1319 cars off the road
• $16 million in total economic activity

Results to Date: Job Creation
• The Community Energy Challenge regularly works with more than 25 contractors.
• In 2013, the CEC generated more than $5 million in direct economic activity for local businesses.

Using Program Data to Conduct Evaluation
• Good data systems pay dividends
• Analyze and revise metrics over time
• This supports both program improvement and budgeting but also future funding requests
• Collaborate with higher ed. for deeper analysis – economic analysis, surveys, etc.

Economic Impact Analysis Results
$1 = $5.27• Public funding is more than matched by private investment and utility rebate.
• When local contractors are used, there is an economic multiplier effect (indirect and induced spending) from purchase of supplies and equipment and employees with more money in their pockets.
• Money spent making efficiency improvements reduces future energy costs which have a significant net present value.
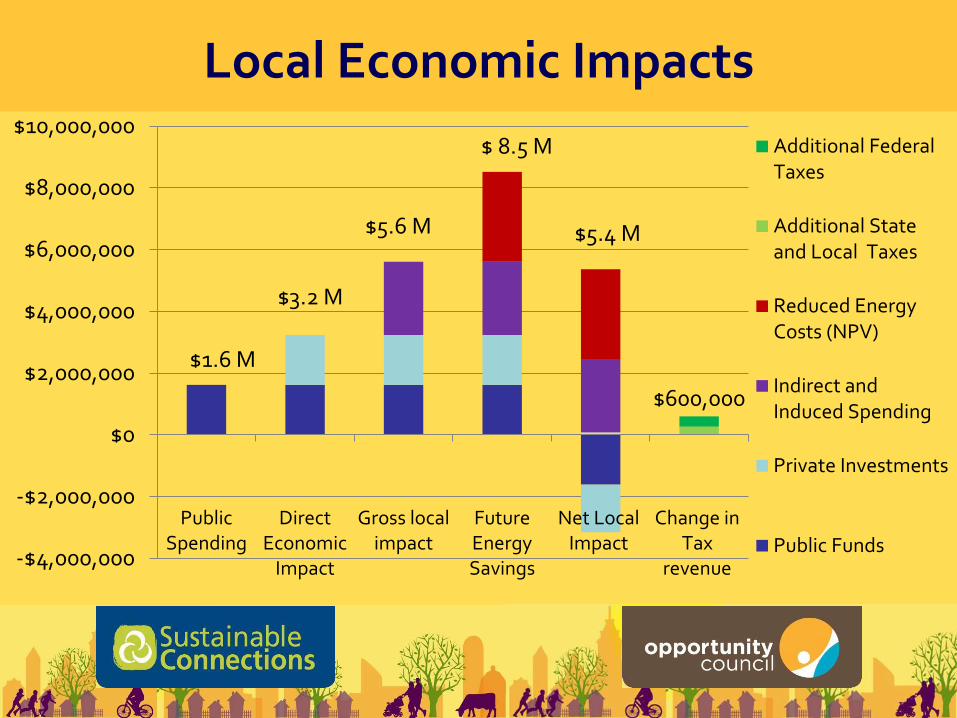
Local Economic Impacts
$3.2 M
$1.6 M
$5.6 M
$ 8.5 M
$600,000
$5.4 M
-$4,000,000
-$2,000,000
$0
$2,000,000
$4,000,000
$6,000,000
$8,000,000
$10,000,000
PublicSpending
DirectEconomic
Impact
Gross localimpact
FutureEnergySavings
Net LocalImpact
Change inTax
revenue
Additional FederalTaxes
Additional Stateand Local Taxes
Reduced EnergyCosts (NPV)
Indirect andInduced Spending
Private Investments
Public Funds

Key Assumptions
• Local base impacts – what would have happened with the money if we didn’t do this?
• 3% discount rate
• Cost of energy
• IMPLAN model assumptions: economic activity by sector for each county
• Utility responses to reduced energy consumption
• Solar production credit
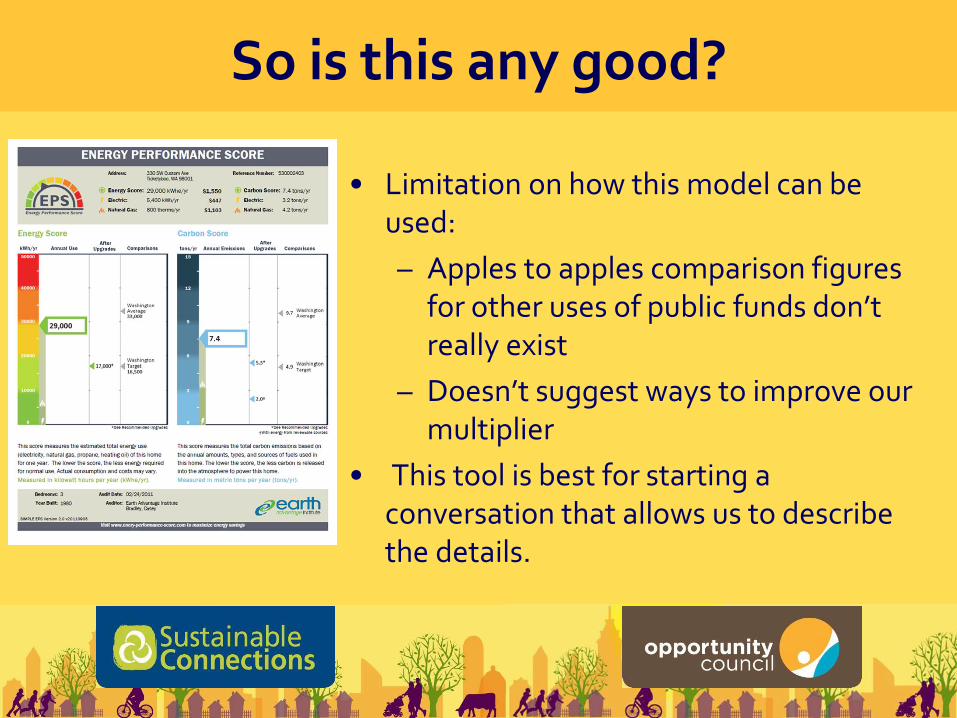
So is this any good?
• Limitation on how this model can be used:
– Apples to apples comparison figures for other uses of public funds don’t really exist
– Doesn’t suggest ways to improve our multiplier
• This tool is best for starting a conversation that allows us to describe the details.
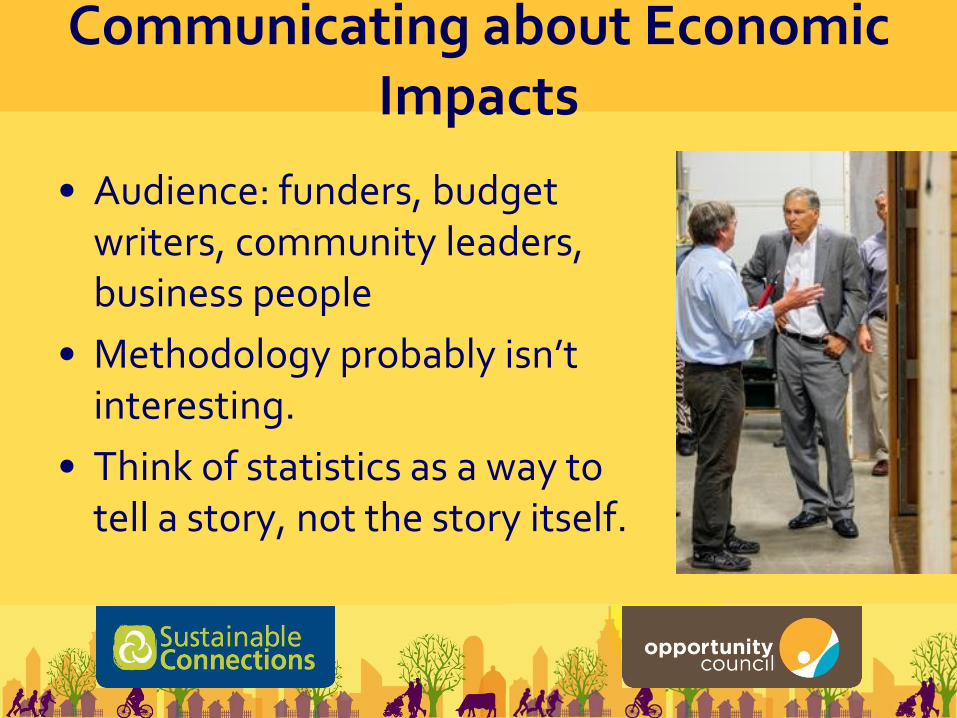
Communicating about Economic Impacts
• Audience: funders, budget writers, community leaders, business people
• Methodology probably isn’t interesting.
• Think of statistics as a way to tell a story, not the story itself.

Communicating about Economic Impacts
Keep it simple, even for sophisticated audiences

Questions